
Investigation of the Pressure Coefficients Correlation Field for Low-Rise Building Roofs


1
Department of Architecture, Construction and Design, Polytechnic University of Bari, 70126 Bari, Italy
2
Department of Engineering and Geology (INGEO), University G. D’Annunzio, 65127 Pescara, Italy
*
Author to whom correspondence should be addressed.
Appl. Sci. 2022, 12(21), 10790; https://doi.org/10.3390/app122110790
Submission received: 22 September 2022
/
Revised: 11 October 2022
/
Accepted: 20 October 2022
/
Published: 25 October 2022
(This article belongs to the Special Issue Structural Wind Engineering)
Abstract
:The use of hyperbolic paraboloid roofing (HPRs) is increasingly common in contemporary architecture, especially for buildings with large spans, making use of tensile structures or light shells. These structures are very sensitive to wind loads because of their light weight. In particular, they tend to oscillate under wind action, generating complex pressure distributions and cable instability. Therefore, for this shape structure, the investigation of wind-pressure coefficients correlations plays a relevant role in the design of structural elements. Therefore, based on wind tunnel tests, this paper investigates the behavior of four rectangular low-rise building models with HPR when immersed in a turbulent boundary layer flow. The test results were synthesized in correlation maps of the pressure coefficients. The results were evaluated as functions of different model heights and curvatures, and considering three different angles of wind incidence (0°, 45°, and 90°).
1. Introduction
Knowledge of point-to-point variation of pressure fields is essential for the design of roofs, cladding, and building envelope systems [1], while averaged area loads are important for overall structural loads. The correlation structure assumes a crucial role in the characterization of pressure fields, because it affects wind-induced aerodynamic load.
Previously, several studies have focused on the aerodynamics of bluff bodies, and attention to extreme events has recently increased [2]. However, the aerodynamics around sharp edges in turbulent boundary layer flows deserves further investigation, particularly in relation to the structure of the separating and reattaching flow streamlines and their dependence on the characteristics of the approaching flow [3]. These flow-structure interactions affect structures’ reliability and should be investigated through specific experimental and numerical analyses, in terms of their relations with the mean and fluctuating pressure fields around two-dimensional bluff bodies exposed to uniform flows [3,4,5,6,7,8].
Low-rise buildings with flat or curved roofs show significantly different flow conditions in turbulent boundary layers [3]. Few previous studies in this field have included correlation of the pressure field [9,10,11,12,13,14,15]. A significant study was carried out [16] examining the characteristics of correlations of wind-force components, using the absolute ratio of wind forces, phase-plane trajectories, and (absolute) cross-correlation, and wind-load combinations were examined. The spatial correlations of the along-wind aerodynamic fluctuating force and its influence on wind-induced responses of high-rise buildings was investigated [17,18], with discussion of the spanwise correlation of pressure fluctuations for the aerodynamics of a 5:1 rectangular cylinder obtained from wind-tunnel pressure measurements.
Computational fluid dynamics (CFD) is quickly emerging as another method of determining the space–time distribution of pressure fields over bluff bodies [3,19]. Utilizing the LES model, Yu and Kareem [20] reported correlation of pressure around bluff bodies. Zhu et al. in 2022 [21] investigated the twisted-wind effect on aerodynamic correlation and flow patterns of a high-rise building with a 3:1 side ratio. Spatial–temporal correlations of aerodynamic forces and flow fields under a conventional wind profile and a twisted wind profile were comprehensively compared.
This current paper focuses on the correlation structure of the pressure field on saddle roofs (i.e., hyperbolic paraboloid roofs) immersed in turbulent boundary layer flows [22]. This type of geometry has been applied to construct cable net membrane roofs to cover large spans. Examples include the J. S. Dorton Arena (1953) in Rayleigh, USA, roofs designed by Frei Otto in Munich (1968–1972), Germany, the Calgary Arena (1983) in Calgary, USA, the St. Christopher’s Pavilion (1985) in São Cristóvão, Brazil, the Peace and Friendship Stadium (1985) in Athens, Greece, and the Lee Valley velo park (2012) in London, UK.
Because of their light weight, HPRs are very sensitive to wind loads and, in particular, they tend to oscillate upwards and downwards under wind action. Cable instability may occur under strong upward action because the cable tension in the upward cables decreases until the cable becomes unstable. Several studies have discussed the structural performances of this kind of roof [23,24,25,26,27,28], and specific parametric studies [29,30,31,32,33,34,35,36,37,38] given by two of the authors have contributed to the Italian standard [39] that provides pressure coefficients for HPR with square [37], rectangular [37], circular, and elliptical plan shapes [38].
Wind-tunnel data [29] are utilized in this current paper to study the correlation structure and the correlation fields of several points on roofs under three wind angles, and the results are discussed and compared.
2. Experimental Setup
The experimental study was carried out in the CRIACIV (Inter-University Research Centre on Building Aerodynamics and Wind Engineering) wind tunnel in Prato, Italy, in 2008. The results of these tests have been discussed in detail [29,30,31,32,33,34,35,36,37,38]. In total, sixteen different geometries with four plan shapes (square, rectangular, circular, and elliptical), two different roof curvatures, and two different maximum heights of the roof from the ground were investigated, under sixteen wind angles from 0° to 337.5° with a step of 22.5°. The facility is an open-circuit tunnel with a 2.30 m × 1.60 m test chamber. For sake of brevity, the present paper discusses the experimental results for four different models with a rectangular plan (denoted by R in Figure 1, according to notation in [30]), two different curvatures (C and F in Figure 1, meaning “more curve” and “flatter”, respectively), and two different heights (L and H in Figure 1, indicating “low” and “high”, respectively).
The selected wind profile corresponds to the terrain category III as described in [40] and [35]. Results were processed to provide mean, maximum, and minimum pressure coefficient maps [34,38]. The results were incorporated in [39].
The geometry of the models is summarized in Table 1, where and are the building plan sizes, and the upward and downward sags of the roof, respectively, and is the maximum roof distance from the ground as shown in Figure 1. The number of pressure taps on the roof was 95 and they were connected to the pressure scanners by polymeric material tubes. The pressure series were acquired at a sampling frequency of 252 Hz for a duration of 30 s [34]. The turbulence intensity ranged between 11% and 12%.
3. Experimental Wind-Tunnel Results
As discussed in previous papers by two of the authors [29,30,31,32,33,34,35,36,37,38], the design of this kind of structure requires at a preliminary stage the knowledge of the mean values (sample shown in Figure 2) and of the peak values of the aerodynamic pressure coefficients cp(t), whose instantaneous values are obtained by the recorded pressure time histories p(t) as follows:
where denotes the air density, and the mean speed at the roof level, and the static pressure of undisturbed flow.
Depending on the dimensions and characteristics of the structure, aeroelastic effects, i.e., wind–structure interactions in the large displacement field, may become relevant depending on the flexibility of the structure. This may require ad hoc wind-tunnel tests and nonlinear numerical analyses, as widely discussed in the scientific literature [39].
Furthermore, the correlation between pressure–time histories at different points of the roof may also play a relevant role, because the resultant wind-induced loads on a given portion of the structure obviously depend on that correlation. Its underestimation or overestimation may lead to unsafe or redundant design of structural elements depending on their area of influence. However, the role of the correlation of the wind-induced pressure field on hyperbolic paraboloid roofs has so far been almost neglected.
Based on some results of the experimental wind-tunnel study discussed in Section 2, this paper explores these aspects for four rectangular models with hyperbolic paraboloid roofs, discussing the dependence of the correlation functions on the height and the curvature of the scale models and on the mean direction of the wind.
According to the scientific literature, the correlation coefficient between the pressure–time histories at a reference point P0 and another point P on the roof is defined as:
where and denote the standard deviations of the pressure coefficient time histories cp(t) in P0 and P, respectively, whose covariance is defined by:
where E denotes the expected value.
In the following, the correlation functions relating a selected pressure tap (at point P0) to all the other pressure taps P is discussed for the four models described in Section 2, for different positions P0 of the reference pressure tap.
As a first check, the stationarity of the recorded pressure fields was verified for sample pressure taps, evaluating their correlation functions for a given length of the recorded pressure–time histories and for different starting points t0 of the wind-pressure acquisition.
As reported in Figure 3, for the lower rectangular model with higher curvature (RLC), the level curves of the correlation function between the pressure–time history in the center of the roof (pressure tap #48) and the other points of the roof surface were almost independent on the initial time t0, confirming the stationarity of the experimental pressure field.
The correlation between the pressure–time history at a given point of the roof and other points of the roof surface, on the other hand, quickly decays when the delay time τ between the two points is taken into account, as shown in Figure 4. This means that, notwithstanding the stationarity of the flow, the complex aerodynamics continuously and dynamically modifies the instantaneous local wind-induce pressure. This confirms the need to take into account the correlation between the pressure fields at different points, also if they are far from each other. The correlation may in fact have a large influence whenever global wind-induced loads are relevant for the design of the main structural elements.
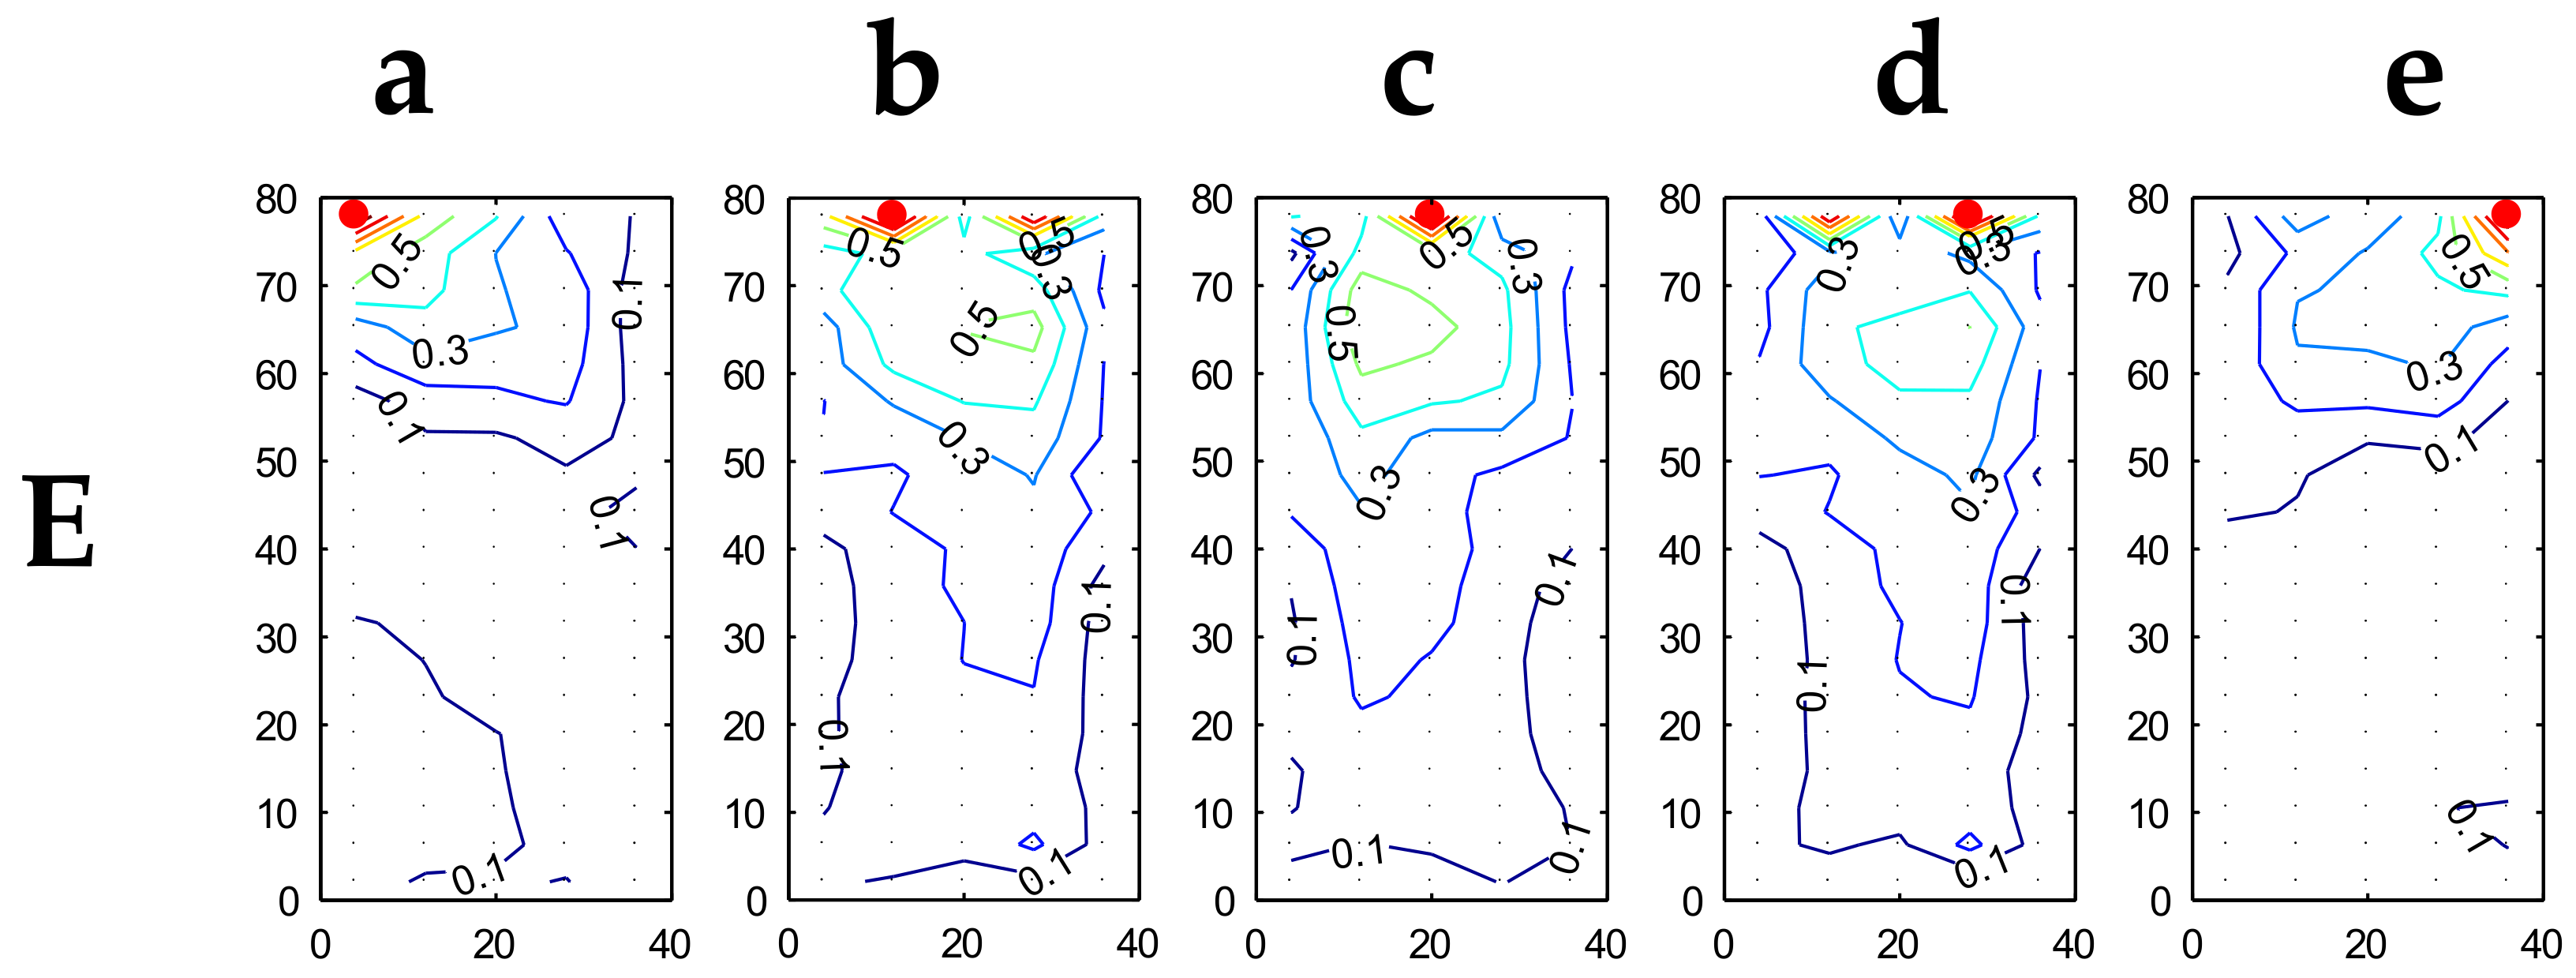
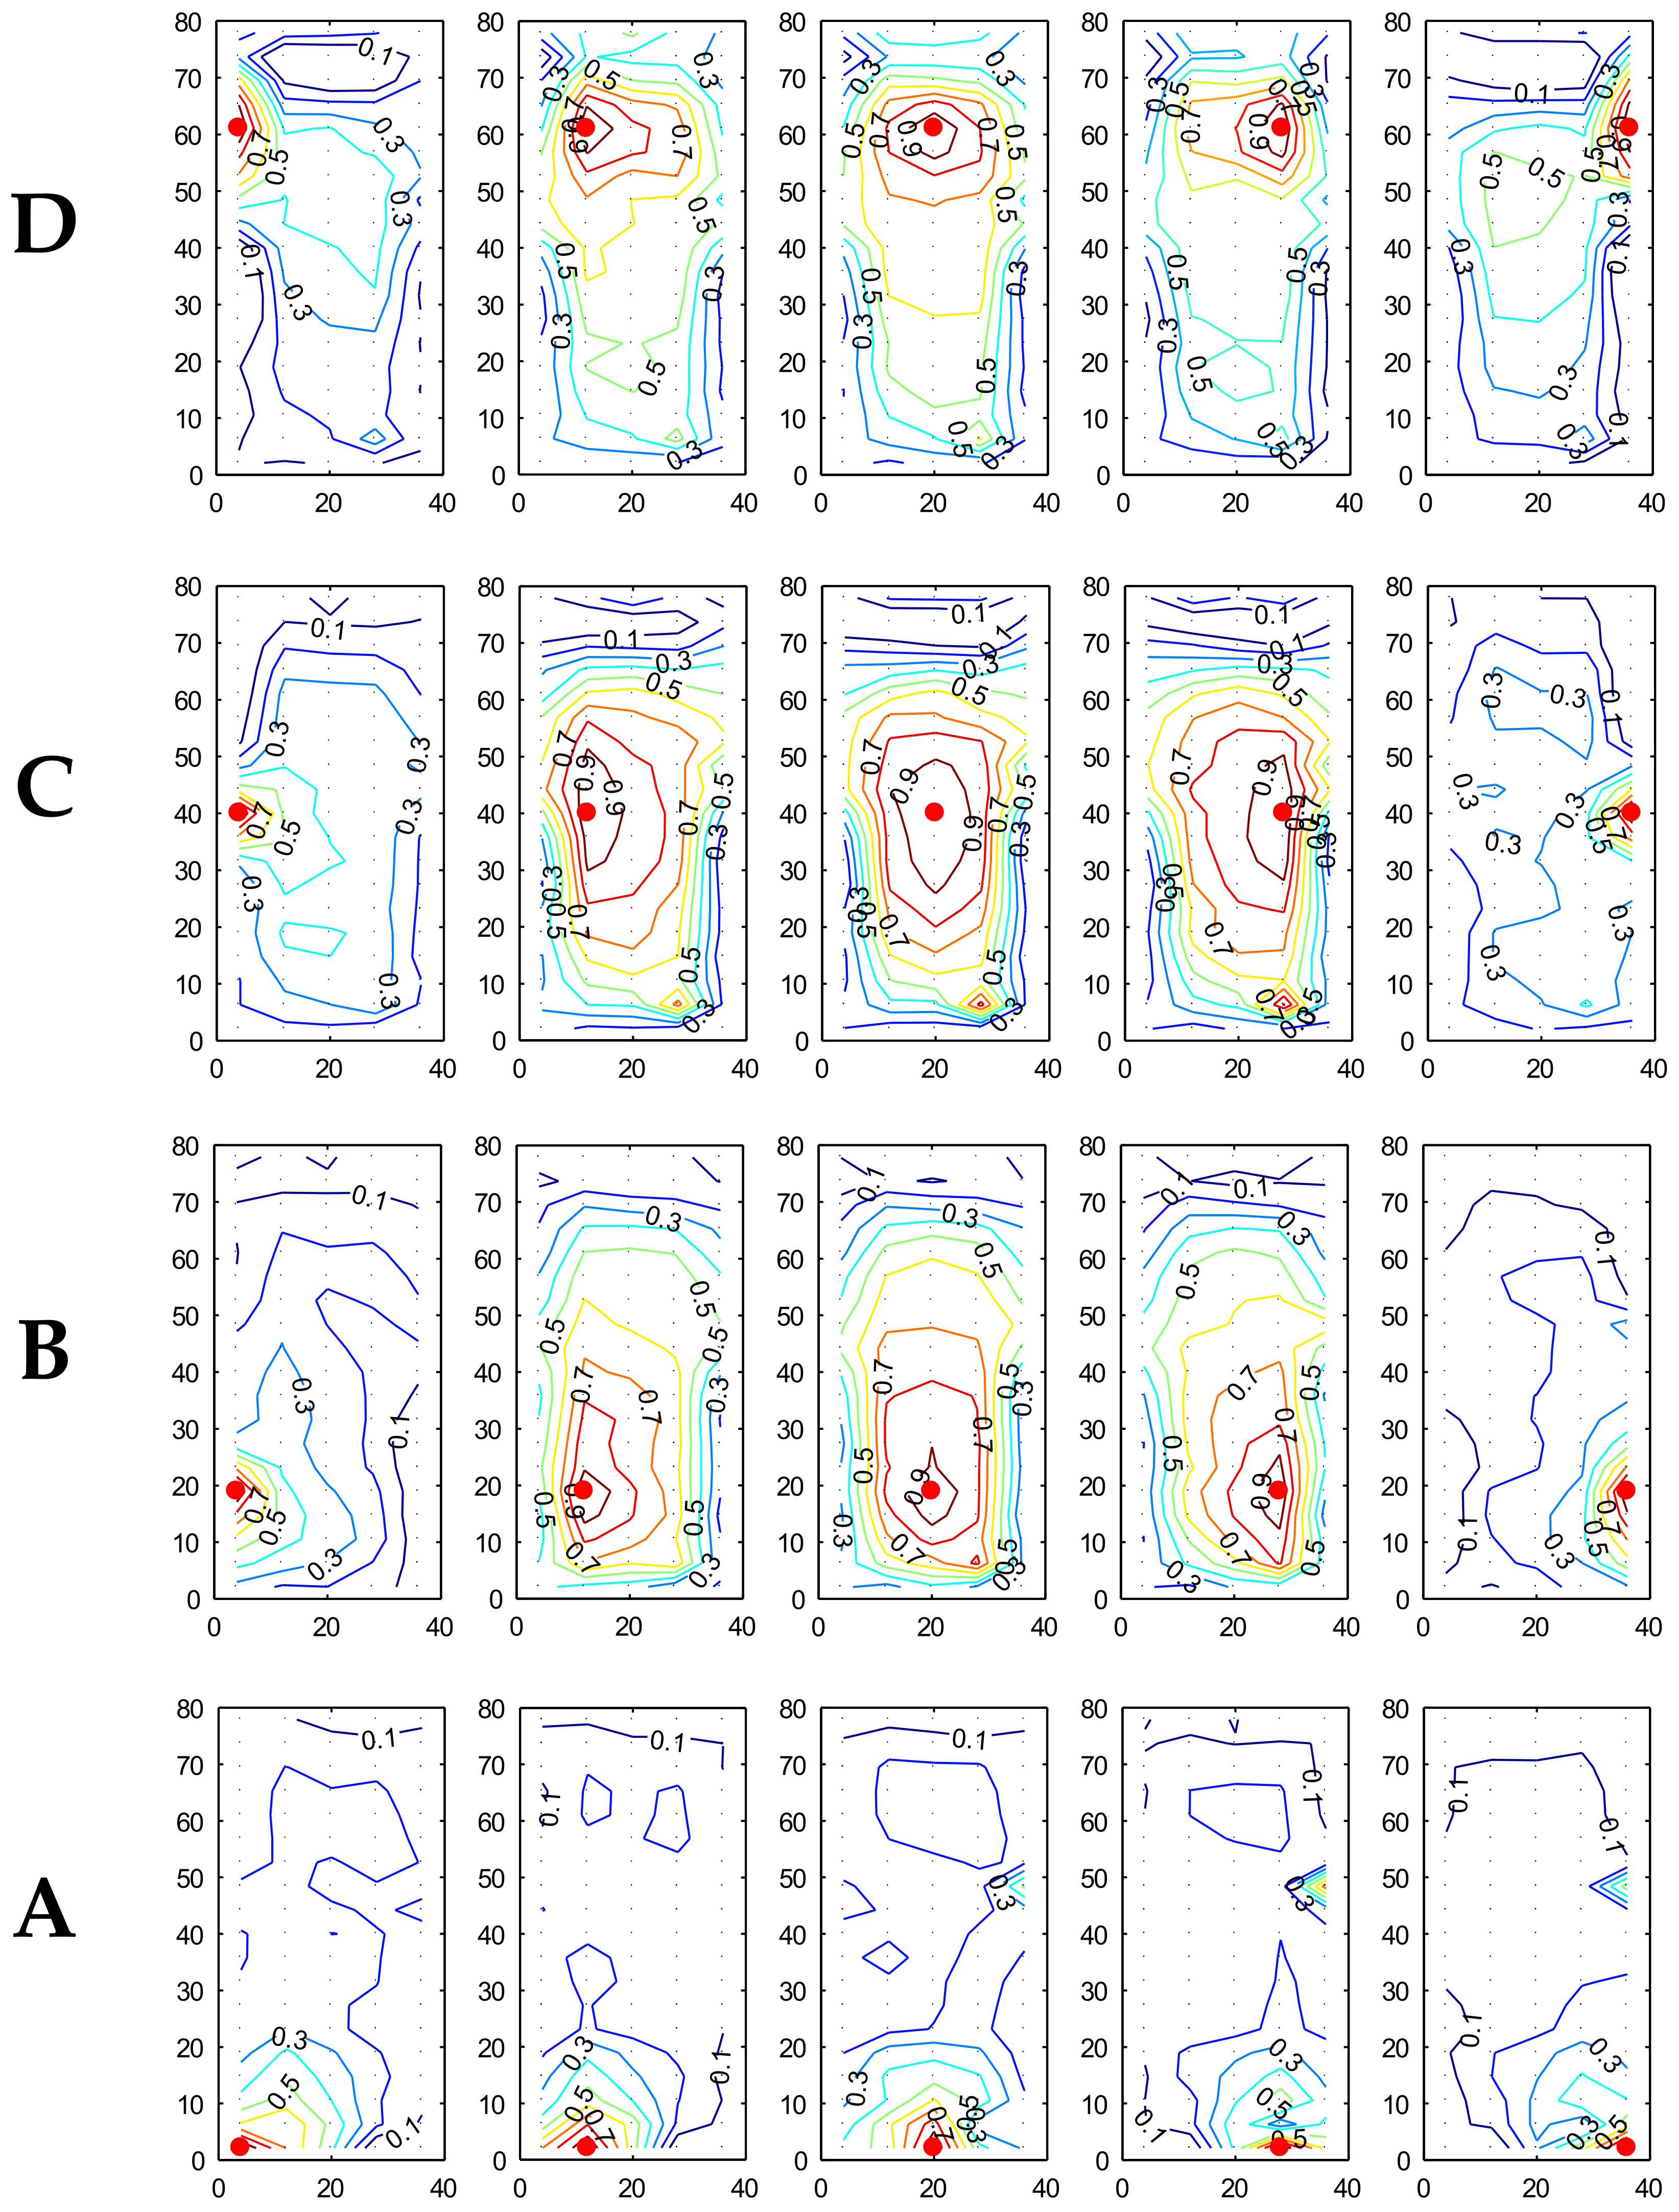
The following subsections describe the characteristics of the correlation functions for the models described in Section 2, as reported in Figure 5, Figure 6, Figure 7, Figure 8, Figure 9, Figure 10, Figure 11, Figure 12, Figure 13, Figure 14, Figure 15 and Figure 16, for three selected wind directions: 0°, 45°, 90°. Each figure contains 25 pictures, quoted in the paper by a couple of letters corresponding to the row and the column where the picture is included, each one describing the correlation field between the reference point P0 (Equations (2) and (3)) denoted by a red point and the other points of the roof.
3.1. Mean Wind Direction 0°
Observing the distribution of the correlation coefficient in the maps of Figure 5 (RLC), with the wind blowing from 0°, it can be observed that the values of the pressure field at the taps close to the edges of the roof have a very small correlation with the surrounding areas. This is particularly the case for the pressure taps along the edge hit directly by the wind, and even more so in the areas near the two orthogonal edges (see Figure 5Aa–Ae). This is due to the fact that the flow near the edges detaches from the roof and is consequently disturbed and affected by eddies which induce the fluid thread on the roof to proceed chaotically.
For the same reason (chaotic detachment of vortices from the edge hit directly by the wind) an absence of symmetry was found between the level curves of the correlation function of the pressure taps Aa and Ae, which for this angle of wind (0°) were nominally symmetrical with respect to the longitudinal axis of the roof. As proof of the good quality of the experiment, meanwhile, the expected symmetry of the correlation functions was observed for most of the symmetrical pairs of pressure taps with respect to the longitudinal axis of the roof, e.g., pressure taps Ab and Ad, Ba and Be, Bb and Bd, Ea and Ee. They were found to be “mirrored” to each other, except for unavoidable small differences physically related to the statistical variations of the phenomena under consideration, as highlighted by two of the authors in a previous paper [41].
The situation at the central part of the roof (e.g., pressure taps Cb, Cc, Cd, Dc) was very different, because the flow confined by the upward curvature across the wind was for most of the roof attached along the downward curvature in the direction of the wind, with consequent high correlation (correlation index > 0.7) for portions of the roof up to about one third of its transverse and longitudinal dimensions. This circumstance can be of considerable importance in the characterization of average pressures or suctions to be considered in the design and verification of the main load-bearing elements of this type of structure, affected by the wind-induced loads on extended portions of the roof [42].
As shown recently by two of the current authors [42], the average pressure coefficients for this kind of structure generally decrease significantly when the influence area of the structural element increases, as a consequence of the decreasing correlation between local actions at points far away from each other, according to the indications reported in technical codes [39,40] for ordinary geometries. For complex geometries such as those under examination, the variations of the correlation functions for the central and perimetral parts of the roof are larger, as already seen. This may lead to a strong time correlation of wind-induced loads for points comparatively far from each other, which may result in wind-induced loads significantly larger of those found for regions with analogous extension but where the correlation of wind flow is smaller.
Comparing the data of Figure 5 (0° RLC) with those illustrated in Figure 6 (0° RLF), which refers to a roof of similar height (although not the same) but with a flatter curvature, differences can be observed.
In this case, the effect described for the previous model (differences between correlation functions for the edges and the central part of the roof) was again observed. However, it was noted that for pressure taps near the edges on the flatter roof (Figure 6) the correlation with surrounding points had higher values than for the more curved roof (Figure 5), especially for the edge first hit by the flow. Furthermore, the higher correlations in the central part of the roof affected slightly larger regions than on the more curved roof. This effect was evidently due to the lower curvature and therefore the shape of the roof, because a flatter roof minimizes the detachment of vortices at 0°, as also confirmed by the slightly lower coefficients for suction pressure [29].
Comparing the results for wind direction 0° for higher models with large curvature (RHC) and small curvature (RHF), shown in Figure 7 and Figure 8, respectively, the differences found were in many ways similar to those observed comparing the results between flatter and more curved roofs on lower models, so confirming a general trend. In these cases, the correlations between a given pressure tap and points in the surrounding area were significantly larger for pressure taps at the inner part of the roof, compared with pressure taps closer to the edges of the model. For taller models, however, the detachment of vortices from the edge that was directly hit by the wind was larger. Unlike the lower models, this implies a faster decrease of correlation for the perimeter pressure taps on flatter models, which was only partially regained with subsequent reattachment of the flow (e.g., see Figure 8Ac). Slower decrease of correlation was instead observed for the more curved roof, for which the correlation between the pressure taps on the leading edge and the surrounding area was larger (e.g., see Figure 7Ac), because the flow reattached sooner due to the higher downward curvature in the direction of the wind. An opposite trend as a function of the roof curvature, analogous to the trend observed for lower models, was observed with increased distance between the leading edge and the pressure tap under consideration. This is shown, for example, by the larger correlation of the pressure taps Ba and Be in the flatter model (Figure 8) compared with the analogous pressure taps Ba and Be of the more curved model (Figure 7).
On the other hand, with the same curvature, greater model height reduced the differences between the correlation relative to the pressure taps of internal regions and the correlation relative to the pressure taps along the edges. This was especially the case for the models with larger curvature; for example, the pressure taps Ac and Cc of the model RLC (Figure 5) compared with the same pressure taps Ac and Cc of the model RHC (Figure 7).
In conclusion, for a wind angle of 0° the correlation between the pressure at a point on the roof and the surrounding points was mainly influenced by the curvature of the roof, with the exception of the areas near the leading edge, where the correlation was also significantly influenced by the height of the model.
3.2. Mean Wind Direction 45°
A wind direction 45° generates a very complex flow field for this kind of geometry, because the asymmetrical shape of the model with respect to the mean wind direction implies a completely unpredictable aerodynamics without wind-tunnel tests or CFD analyses.
In this case, the flow detached from one of the roof edges and partly followed the curvature of the diagonal line of the roof, partly splits into vortices that decayed close to the roof edges. This caused a trend of correlation coefficients completely different from that observed at 0°.
Observing for example the results shown in Figure 9 for the model RLC, it was noted how the correlation coefficient was rapidly reduced for points at a short distance compared with findings for the 0° angle, even in the central region of the model, which was strongly affected by the detachment of vortices from the edges. In comparison with experimental results for the 0° angle, the spatial decay of the correlation function was more accentuated around the pressure taps along the two windward edges. Comparing models with smaller curvatures, Figure 10 and Figure 12 (RLF and RHF), and with larger curvatures, Figure 9 and Figure 11 (RLC and RHC), on high (RHC and RHF) and low (RLC and RLF) models, the same behavior was observed with some small differences in the extension of the correlation in the central region: a wider correlation was found for flatter roofs than for more curved roofs.
For the pressure taps along the leading edge with upward curvatures (the edge with smaller dimensions), comparison of models with the same height and different curvatures showed a significant increase for the flatter models in the extension of the region strongly correlated with the pressure tap under consideration (for example, see pressure taps Ac, Ad, Ae in Figure 10 and Figure 12 with the analogous pressure taps Ac, Ad, Ae in Figure 9 and Figure 11), similar to observations for the leading edge in lower models and those with wind direction 0°.
In conclusion, the way in which the flow at 45° detached from two edges of different lengths with opposite curvatures, both equally affected by the incident flow (oriented at 45° with respect to both), influenced the trend of the correlation coefficient much more than the curvature or height of the building. When the latter varied, differences in correlation were found for most of the roof that were lower than differences found when the same parameters (height and curvature) were varied for the other two angles considered (0° and 90°), with the exception of pressure taps along the leading edge with upward curvatures (the smallest edge).
3.3. Mean Wind Direction 90°
For this wind angle there was in most cases a substantial symmetry of correlation functions for symmetrical pressure taps with respect to the mean flow direction, corresponding to the transverse symmetry axis of the models. Examples can be seen in the comparison of the level curves Aa and Ea in Figure 13, Ba and Da in Figure 16, Ab and Eb in Figure 14, and Aa and Ea in Figure 15. However, the experimental results for the wind angle of 90°sometimes showed a different correlation trend for certain pairs of nominally symmetrical pressure taps (e.g., Ac and Ec in Figure 13, Ab and Eb in Figure 15), due to physical statistical variations of the phenomena under examination, as well as unavoidable inaccuracies in the measurement chain, as already highlighted in a previous work by two of the authors [41].
For a wind direction of 90°, the aerodynamic behavior of this kind of roof is very different than for the other two wind angles (0° and 45°), because the flow impacts on the higher and wider side of the model.
The flow detached from the longer edge of the model, and on the flatter roof it continued in an almost straight line after detachment, according to the trend of pressure coefficients [29]. For the curved model, the flow tended to follow the downward curvature along the direction of the wind and to reattach, although only partially. Consequently, the correlation between the pressure taps on the roof and their surrounding areas was larger for the curved models, as for example in the comparison of pressure taps Cc and Cd in Figure 13 and Figure 15 with corresponding pressure taps Cc and Cd in Figure 14 and Figure 16.
On the other hand, the correlation of the internal pressure taps was also significantly influenced by the height of the model; for a greater height, the previously described phenomena due to the detachment of the flow were accentuated. For the taller models examined here, there were a larger differences of correlation relative to models with different curvatures, compared with the lower models; e.g., pressure taps Cd and Ce in Figure 15 (RHC) and in Figure 16 (RHF), compared with pressure taps Cd and Ce in Figure 13 (RLC) and in Figure 14 (RLF).
Similarly, in the case of curved models a greater height emphasized the sudden reduction of the correlation for pressure taps on the edge directly hit by the wind (for example pressure taps Ca, Ba, and Da of model RHC in Figure 15 compared with corresponding pressure taps Ca, Ba, and Da of model RLC in Figure 13). For the flatter models, meanwhile, the effect of different heights was substantially irrelevant to the trend of the correlation function for pressure taps along the leading edge.
More difficult to interpret is the trend of the correlation for pressure taps contained in the areas near the two orthogonal edges of the model where two different curvatures meet, because for this geometry such zones are always disturbed by the detachment of vortices [29]. In these regions, therefore, the curvature and height of the model both played a relevant role for the angle of approaching wind considered in this section (90°), as indeed was also found for the different wind angles discussed in the previous sections.
In conclusion, for a wind angle of 90° the height and curvature of the model both affected the correlation for most of the roof, except for the areas near the leading edge, where the height of the model’s windward surface played a predominant role compared with the effect of its curvature.
4. Conclusions
Based on the experimental wind-tunnel studies carried out in the CRIACIV boundary layer wind tunnel (Italy) [28,29,30,31,32,33,34,35,36,37], this paper has examined the results for four rectangular models of low-rise buildings with HPR. In particular, it has discussed the dependence of the pressure coefficients correlation value on the height and curvature of the scale models and the mean direction of the wind. This research demonstrates:
- the correlation of wind-induced pressure fields on hyperbolic paraboloid roofs plays a relevant role for design purposes; for complex geometries, the variations of correlation functions between central and perimeter parts of the roof are very relevant;
- the obtained experimental results highlight the dominant influence of the angle of wind incidence when defining and investigating wind loads, in addition to the importance of the building’s plan dimensions and height; in particular:
- for a wind angle of 0°, the correlation between the pressure at a given point on the roof and the surrounding points was mainly influenced by the curvature of the roof, with the exception of areas near the leading edge, where the correlation was also significantly influenced by the height of the model;
- for a wind angle of 90°, the correlation was influenced by both the height and the curvature for almost the entire roof, except the areas near the leading edge, where the height of the model’s windward surface played a predominant role compared with that of curvature;
- for a wind angle f 45°, the correlation was influenced by the way in which the flow detached from two edges of different lengths and with opposite curvatures, much more than by the curvature or height of the model;
The correlation between wind-induced loads at points of the roof far from each other can be of considerable importance in the characterization of the average pressures or suctions to be considered in the design and verification of the main load-bearing elements of this kind of structure. However, these aspects of wind-induced loads have seldom been considered in the scientific literature. It is therefore worth extending this research in future to explore the role of the correlation in different configurations of low-rise building roofs. Such research can also be very useful for investigating wind modes and their effects on structures [43,44].
Author Contributions
Conceptualization, F.R. and V.S.; methodology, F.R. and V.S.; software, F.R. and V.S.; validation, F.R. and V.S.; investigation, F.R.; data curation, F.R.; writing—original draft preparation, F.R., V.S., and M.F.S.; writing—review and editing, F.R., V.S., and M.F.S. All authors have read and agreed to the published version of the manuscript.
Funding
This research received no external funding.
Institutional Review Board Statement
Not applicable.
Data Availability Statement
Not applicable.
Conflicts of Interest
The authors declare no conflict of interest.
References
- Aly, A.M.; Chapain, S. Large-Scale Open-Jet Testing for Cladding Design in High-Rise Buildings: Higher Peak Pressures Compared to Wind Tunnels. Pract. Period. Struct. Des. Constr. 2022, 27, 04022016. [Google Scholar] [CrossRef]
- Henderson, C.; Huff, T.; Bouton, G. Structural Observations and Tornado Damage Mitigation Concepts: March 2020 Tennessee Tornadoes. Pract. Period. Struct. Des. Constr. 2020, 26, 05021001. [Google Scholar] [CrossRef]
- Kareem, A. Correlation structure of random pressure fields. J. Wind Eng. Ind. Aerodyn. 1997, 69, 507–516. [Google Scholar] [CrossRef]
- Lee, B.E. The effects of turbulence on the surface pressure fields of a square prism. J. Fluid Mech. 1975, 69, 263–282. [Google Scholar] [CrossRef]
- Wilkinson, R.H. On Vortex-Induced Loading on Long Bluff Cylinders. Ph.D. Thesis, Department of Civil Engineering, University of Bristol, Bristol, UK, 1974. [Google Scholar]
- Nakamura, Y.; Ozono, S. The effects of turbulence on a separated and reattaching flows. J. Fluid Mech. 1984, 144, 13–46. [Google Scholar] [CrossRef]
- Saathoff, P.J.; Melbourne, W.H. The generation of peak pressure in separated/reattaching flows. J. Wind Eng. Ind. Aerodyn. 1989, 32, 121–134. [Google Scholar] [CrossRef]
- Li, Q.S.; Melbourne, W.H. Effects of turbulence on surface pressures of a flat plate and rectangular cylinders in separated and reattaching flows. In Proceedings of the 9th International Conference on Wind Engineering, Wiley Eastern Limited, New Delhi, India, 9–13 January 1995; Volume 1. [Google Scholar]
- Akins, R.E. Wind Pressure on Buildings. Ph.D. Thesis, Department of Civil Engineering, Colorado State University, Fort Collins, CO, USA, 1976. [Google Scholar]
- Kareem, A.; Cermak, J.E. Pressure fluctuations on a square building model in boundary layer flows. J. Wind Eng. Ind. Aerodyn. 1984, 16, 17–41. [Google Scholar] [CrossRef]
- Karecm, A. Wind-Excited Motion of Buildings. Ph.D. Thesis, Department of Civil Engineering, Colorado State University, Fort Collins, CO, USA, 1978. [Google Scholar]
- Kareem, A. Measurements of pressure and force fields on building models in simulated atmospheric flows. J. Wind Eng. Ind. Aerodyn. 1984, 16, 589–599. [Google Scholar] [CrossRef]
- Kareem, A. Mapping and synthesis of random pressure field. J. Eng. Mech. Am. Soc. Eng. 1989, 115, 2325–2332. [Google Scholar] [CrossRef]
- Wacker, J.; Plate, E.J. Correlation structure of wind pressure buffeting on cuboidal buildings and corresponding effective area wind loads. J. Wind Eng. Ind. Aerodyn. 1992, 43, 1865–1876. [Google Scholar] [CrossRef]
- Surry, D.; Djakovich, D. Fluctuating pressure on models of tall buildings. J. Wind Eng. Ind. Aerodyn. 1995, 58, 81–112. [Google Scholar] [CrossRef]
- Tamura, Y.; Chul Kim, Y.; Kikuchi, H.; Hibi, K. Correlation and combination of wind force components and responses. J. Wind Eng. Ind. Aerodyn. 2014, 125, 81–93. [Google Scholar] [CrossRef]
- Jiadong, Z.; Mingshui, L.; Zhiguo, L.; Zhitian, Z. Spatial correlation of along-wind fluctuating aerodynamic force acting on large aspect-ratio rectangular prisms. J. Wind Eng. Ind. Aerodyn. 2022, 224, 104951. [Google Scholar] [CrossRef]
- Ricciardelli, F.; Marra, A.M. Sectional aerodynamic forces and their longitudinal correlation on a vibrating 5:1 rectangular cylinder. In Proceedings of the 6th International Colloquium on Bluff Body Aerodynamics and Applications, Milan, Italy, 20–24 July 2008; Volume 2024. [Google Scholar]
- Murakami, S.; Mochida, A. On turbulent vortex shedding low past 2D square cylinder predicted by CFD. J. Wind Eng. Ind. Aerodyn. 1993, 54, 81–112. [Google Scholar]
- Yu., D.; Kareem, A. Simulation of probabilistic flow field around two-dimensional rectangular prisms utilizing LES. In Proceedings of the International Wind Engineering Forum Workshop on CFD for Prediction of wind loading on Buildings and Structures, Yokohama, Japan, 9 September 1995. [Google Scholar]
- Zhou, L.; Tse, K.T.; Hu, G. Aerodynamic correlation and flow pattern of high-rise building with side ratio of 3:1 under twisted wind profile: A computational study. J. Wind Eng. Ind. Aerodyn. 2022, 228, 105087. [Google Scholar] [CrossRef]
- Liu, M.; Chen, X.; Yang, Q. Characteristics of dynamic pressures on a saddle type roof in various boundary layer flows. J. Wind Eng. Ind. Aerodyn. 2016, 150, 1–14. [Google Scholar] [CrossRef]
- Rizzo, F.; Sepe, V.; Vasta, M. Correlation structure of wind-tunnel pressure fields for a hyperbolic paraboloid roof. In AIMETA 2017—Proceedings of the XXIII Conference of the Italian Association of Theoretical and Applied Mechanics, Salerno, Italy, 4–7 September 2017; Centro Servizi d’Ateneo: Mediglia, Italy, 2017; pp. 462–471. ISBN 978-889-42484-7-0. [Google Scholar]
- Liu, M.; Chen, X.; Yang, Q. Estimation of peak factor of non-Gaussian wind pressures by improved moment-based Hermite model. J. Eng. Mech. 2017, 143, 06017006. [Google Scholar] [CrossRef]
- Colliers, J.; Degroote, J.; Mollaert, M.; De Laet, L. Mean pressure coefficient distributions over hyperbolic paraboloid roof and canopy structures with different shape parameters in a uniform flow with very small turbulence. Eng. Struct. 2020, 205, 110043. [Google Scholar] [CrossRef]
- Vassilopoulou, I.; Gantes, C.J. Influence of a Deformable Contour Ring on the Nonlinear Dynamic Response of Cable Nets. Structures 2016, 6, 146–158. [Google Scholar] [CrossRef]
- Vassilopoulou, I.; Petrini, F.; Gantes, C.J. Nonlinear Dynamic Behavior of Cable Nets Subjected to Wind Loading. Structures 2017, 10, 170–183. [Google Scholar] [CrossRef]
- Colliers, J.; Mollaert, M.; Vierendeels, J.; De Laet, L. Collating Wind Data for Doubly-curved Shapes of Tensioned Surface Structures (Round Robin Exercise 3). Procedia Eng. 2016, 155, 152–162. [Google Scholar] [CrossRef]
- Rizzo, F.; D’Asdia, P.; Lazzari, M.; Procino, L. Wind action evaluation on tension roofs of hyperbolic paraboloid shape. Eng. Struct. 2011, 33, 445–461. [Google Scholar] [CrossRef] [Green Version]
- Rizzo, F.; Barbato, M.; Sepe, V. Shape dependence of wind pressure peak factor statistics in hyperbolic paraboloid roofs. J. Build. Eng. 2021, 44, 103203. [Google Scholar] [CrossRef]
- Rizzo, F.; Barbato, M.; Sepe, V. Peak factor statistics of wind effects for hyperbolic paraboloid roofs. Eng. Struct. 2018, 173, 313–330. [Google Scholar] [CrossRef]
- Rizzo, F.; Zazzini, P. Shape dependence of acoustic performances of buildings with a hyperbolic paraboloid cable net membrane roof. J. Acoust. Aust. 2017, 45, 421–443. [Google Scholar] [CrossRef]
- Rizzo, F.; Zazzini, P. Improving the acoustical properties of an elliptical plan space with a cable net membrane roof. J. Acoust. Aust. 2016, 44, 449–456. [Google Scholar] [CrossRef]
- Rizzo, F.; Sepe, V. Static loads to simulate dynamic effects of wind on hyperbolic paraboloid roofs with square plan. J. Wind Eng. Ind. Aerodyn. 2015, 137, 46–57. [Google Scholar] [CrossRef]
- Rizzo, F.; Kopp, A.G.; Giaccu, G. Investigation of wind-induced dynamics of a cable net roof with aeroelastic wind tunnel tests. Eng. Struct. 2021, 229, 111569. [Google Scholar] [CrossRef]
- Rizzo, F.; Sepe, V.; Ricciardelli, F.; Avossa, A.M. Wind pressures on a large span canopy roof. Wind Struct. 2020, 30, 299–316. [Google Scholar] [CrossRef]
- Rizzo, F.; D’Asdia, P.; Ricciardelli, F.; Bartoli, G. Characterisation of pressure coefficients on hyperbolic paraboloid roofs. J. Wind Eng. Ind. Aerodyn. 2012, 102, 61–71. [Google Scholar] [CrossRef]
- Rizzo, F.; Ricciardelli, F. Design pressure coefficients for circular and elliptical plan structures with hyperbolic paraboloid roof. Eng. Struct. 2017, 139, 153–169. [Google Scholar] [CrossRef]
- CNR (National Research Council of Italy). Guide for the Assessment of Wind Actions and Effects on Structures; CNR-DT 207 R1/2018; CNR (National Research Council of Italy): Rome, Italy, 2018. [Google Scholar]
- CEN (Comité Européen de Normalization). EN1991-1-4: Eurocode1: Actions on Structures—Part 1–4: General Actions—Wind Actions; CEN (Comité Européen de Normalization): Brussels, Belgium, 2005. [Google Scholar]
- Rizzo, F.; Sepe, V. Uncertainties in wind-induced loads on hyperbolic paraboloid roofs: Wind-tunnel tests and analytical models. In Proceedings of the EURODYN 2020, 11th International Conference on Structural Dynamics, Athens, Greece, 22–24 June 2020. [Google Scholar]
- Rizzo, F.; Sepe, V. Pressure field correlation for buildings with hyperbolic paraboloid roofs: Results of wind-tunnel tests. In Proceedings of the AIMETA, Rome, Italy, 15–19 September 2019. [Google Scholar]
- Sepe, V.; Vasta, M. Wind-tunnel tests on high-rise buildings: Wind modes and structural response. Wind Struct. 2014, 18, 37–56. [Google Scholar] [CrossRef]
- Rizzo, F.; Caracoglia, L.; Piccardo, G. Examining wind-induced floor accelerations in an unconventionally shaped, high-rise building for the design of “smart” screen walls. J. Build. Eng. 2021, 43, 103115. [Google Scholar] [CrossRef]
Figure 1.
Experimental setup: (a) RLF; (b) RHF; (c) RLC; (d) RHC (acronyms as in [30]).
Figure 1.
Experimental setup: (a) RLF; (b) RHF; (c) RLC; (d) RHC (acronyms as in [30]).

Figure 2.
Example of mean pressure coefficients maps for RLC at (a) 0° and (b) 90°.

Figure 3.
Lower rectangular model with higher curvature (RLC). Level curves of the correlation function between the pressure–time history in the center of the roof (pressure tap #48) and the other points of the roof surface, for different initial times t0. From left to right: t0 = 0 s, t0 = 4 s, t0 = 8 s, t0 = 12 s, t0 = 16 s.

Figure 4.
Lower rectangular model with higher curvature (RLC). Level curves of the correlation function between the pressure–time history in the center of the roof (pressure tap #48) and the other points of the roof surface, for different delay times τ between the reference point and the other points. From left to right: τ = 0 s, τ = 0.004 s, τ = 0.008 s, τ = 0.02 s, τ = 0.04 s, τ = 0.08 s. Color bar as in Figure 3.

Figure 5.
Correlation coefficient trend for RLC at 0°. Color bar as in Figure 3.
Figure 5.
Correlation coefficient trend for RLC at 0°. Color bar as in Figure 3.


Figure 6.
Correlation coefficient trend for RLF at 0°. Color bar as in Figure 3.
Figure 6.
Correlation coefficient trend for RLF at 0°. Color bar as in Figure 3.


Figure 7.
Correlation coefficient trend for RHC at 0°. Color bar as in Figure 3.
Figure 7.
Correlation coefficient trend for RHC at 0°. Color bar as in Figure 3.


Figure 8.
Correlation coefficient trend for RHF at 0°. Color bar as in Figure 3.
Figure 8.
Correlation coefficient trend for RHF at 0°. Color bar as in Figure 3.

Figure 9.
Correlation coefficient trend for RLC at 45°. Color bar as in Figure 3.
Figure 9.
Correlation coefficient trend for RLC at 45°. Color bar as in Figure 3.

Figure 10.
Correlation coefficient trend for RLF at 45°. Color bar as in Figure 3.
Figure 10.
Correlation coefficient trend for RLF at 45°. Color bar as in Figure 3.


Figure 11.
Correlation coefficient trend for RHC at 45°. Color bar as in Figure 3.
Figure 11.
Correlation coefficient trend for RHC at 45°. Color bar as in Figure 3.


Figure 12.
Correlation coefficient trend for RHF at 45°. Color bar as in Figure 3.
Figure 12.
Correlation coefficient trend for RHF at 45°. Color bar as in Figure 3.


Figure 13.
Correlation coefficient trend for RLC at 90°. Color bar as in Figure 3.
Figure 13.
Correlation coefficient trend for RLC at 90°. Color bar as in Figure 3.


Figure 14.
Correlation coefficient trend for RLF at 90°. Color bar as in Figure 3.
Figure 14.
Correlation coefficient trend for RLF at 90°. Color bar as in Figure 3.

Figure 15.
Correlation coefficient trend for RHC at 90°. Color bar as in Figure 3.
Figure 15.
Correlation coefficient trend for RHC at 90°. Color bar as in Figure 3.


Figure 16.
Correlation coefficient trend for RHF at 90°. Color bar as in Figure 3.
Figure 16.
Correlation coefficient trend for RHF at 90°. Color bar as in Figure 3.


Table 1.
Test model geometrical parameters, measurements in mm.
| Models | |||||
|---|---|---|---|---|---|
| RLF | 400.0 | 800.0 | 26.7 | 53.3 | 213.3 |
| RHF | 400.0 | 800.0 | 26.7 | 53.3 | 346.3 |
| RLC | 400.0 | 800.0 | 44.4 | 88.9 | 266.6 |
| RHC | 400.0 | 800.0 | 44.4 | 88.9 | 399.9 |
Publisher’s Note: MDPI stays neutral with regard to jurisdictional claims in published maps and institutional affiliations. |
© 2022 by the authors. Licensee MDPI, Basel, Switzerland. This article is an open access article distributed under the terms and conditions of the Creative Commons Attribution (CC BY) license (https://creativecommons.org/licenses/by/4.0/).
Share and Cite
MDPI and ACS Style
Rizzo, F.; Sepe, V.; Sabbà, M.F. Investigation of the Pressure Coefficients Correlation Field for Low-Rise Building Roofs. Appl. Sci. 2022, 12, 10790. https://doi.org/10.3390/app122110790
AMA Style
Rizzo F, Sepe V, Sabbà MF. Investigation of the Pressure Coefficients Correlation Field for Low-Rise Building Roofs. Applied Sciences. 2022; 12(21):10790. https://doi.org/10.3390/app122110790
Chicago/Turabian StyleRizzo, Fabio, Vincenzo Sepe, and Maria Francesca Sabbà. 2022. "Investigation of the Pressure Coefficients Correlation Field for Low-Rise Building Roofs" Applied Sciences 12, no. 21: 10790. https://doi.org/10.3390/app122110790
Note that from the first issue of 2016, this journal uses article numbers instead of page numbers. See further details here.