
A Method of Predicting Critical Derailment Speed and Analysis of Derailment Process


1
School of Mechanical and Vehicle Engineering, Beijing University of Civil Engineering and Architecture, Beijing 100044, China
2
Key Laboratory of Convergence Medical Engineering System and Healthcare Technology, the Ministry of Industry and Information Technology, School of Life Science, Beijing Institute of Technology, Beijing 100811, China
*
Author to whom correspondence should be addressed.
Appl. Sci. 2022, 12(21), 11199; https://doi.org/10.3390/app122111199
Submission received: 17 September 2022
/
Revised: 12 October 2022
/
Accepted: 2 November 2022
/
Published: 4 November 2022
Abstract
:In order to study the derailment process and dynamic performance-changing rules of vehicles on a curved track, a method of calculating critical derailment speed is proposed, which is the progressive trial method. In terms of their theoretical basis and calculation results, compared with the two traditional methods (root locus method and limit cycle method) for calculating linear and nonlinear critical speed, the advantages of this method in studying derailment are proved, and its applicable conditions are explained. Taking CRH3 as an example, the critical derailment speed on different radius curves is calculated by the progressive trial method. At the critical derailment speed, the variation laws of wheel lifting, wheel–rail attack angle and dynamic index are analyzed. The discrete elastic contact analysis is used to observe the changes in the wheel–rail contact position and contact spot during derailment. The results show that with the increase in the curve radius and critical speed of derailment, the absolute values of lateral force, vertical forces and derailment coefficient increase at the same position of the line; when the impact angle between the front wheel of the front bogie and the rail increases to more than 0.06 rad, the train is in a critical derailment state.
1. Introduction
Train derailment is one of the complex and difficult problems in the field of vehicle dynamics. Since 1908, when the famous derailment coefficient criterion was proposed by Nadal, the derailment problem has been researched for more than a century, but there is no good solution [1].
The derailment processes of trains under high-speed and low-speed conditions show different patterns. Under low-speed conditions, the quasi-static model generally is used to study the train-derailment process [2,3,4,5]. Tests can be conducted through the derailer, and the simulation method is used to analyze the running attitude of the train during derailment [6,7]. The theoretical system of the lateral motion stability of vehicles at low speed is relatively perfect, but there are still many unsolved problems of high-speed derailment. Under high-speed conditions, the train derailment form is variable, the mechanism of action is complex, and the nonlinear characteristics are more obvious [8]. The effects of side wind, earthquake, track bulge, or structural component failure on the operational safety of high-speed trains have been studied by many scholars [9,10,11,12,13,14]. However, research on the derailment process which is caused by over-speed on a curve is scarcer.
Gong Kai [15] et al. proposed a method to calculate the whole process of train derailment caused by over-speed on curves and proved that the derailment coefficient and wheel weight reduction rate make it difficult to discern whether the train is derailed or not. The article puts forward a new method to calculate the critical derailment speed of a vehicle on different radius curves. The wheel–rail contact state and dynamic response at the critical derailment speed are analyzed. The research results could provide a reference basis for train-derailment early warning.
2. Vehicle–Track System Dynamic Model
The multi-body dynamic software Simpack was applied to establish the CRH3 vehicle–track system dynamic model. The model consists of the vehicle body, bogie, primary suspension and secondary suspension, as shown in Figure 1. Ignoring the elastic deformation of each component of the vehicle system, the vehicle body and bogie are set as rigid bodies. The parameters of the vehicle–track model are shown in Table 1.
In order to simulate the derailment process of vehicles under ideal conditions, there is no excitation on the track. The transition curve and superelevation were set according to the Code for Railway Line Design [16]. The parameters of the track alignment are shown in Table 2. In order to study the process of vehicle derailment under different curve radius, the value of R is different.
3. Calculation Methods of Critical Speed
3.1. The Limit Cycle Method and Root Locus Method
The hunting instability critical speed is an important reference to determine the operating speed of high-speed trains. The hunting motion is a kind of lateral vibration when the train is running at high speed. Because of the tapered wheel tread, when two wheels are rolling on the rail with different rolling circles, the wheelset will produce a hunting motion that is serpentine-like. The excessive vibration amplitude will cause hunting instability when approaching the critical speed of hunting instability, and the safety of the vehicle operation will be greatly affected; in other words, there is a great risk of derailment. Two of the most common methods for calculating the hunting-instability critical speed in a numerical simulation are the limit cycle method and the root locus method. The premise of these two methods is that the vehicles travel along a straight track.
As shown in Table 3, the time-domain integral equation of the vehicle system of the limit cycle method is used, and the nonlinear instability critical speed of the vehicle is measured. The root locus method measures the linear instability critical speed of the vehicle through the integral operation in the frequency domain [17].
Based on the limit cycle method, the variation curve of the lateral displacement of the wheelset with the speed is obtained, as shown in Figure 2, and it is determined that the nonlinear instability critical speed of the train is less than 320 km/h. According to the root locus method, it is determined that the linear instability critical speed of the train is about 380 km/h.
The vehicle operating at the critical speed calculated by the above two methods is in a hunting instability state. When the speed is high enough to cause a hunting instability of the vehicle, derailment may not occur. Meanwhile, the speed which causes vehicle derailment may not induce hunting instability. Therefore, a new method is proposed to calculate the critical derailment speed when the vehicle is overspeeding along a curve, which is called the progressive trial method. The critical derailment velocity calculated by this method can ensure the inevitability of derailment.
3.2. Progressive Trial Method
The progressive trial method is to calculate the derail speed of the vehicle when it overspeeds through the curve. During the process of the speed increases regularly and steadily, the speed at which the train derailment occurs is defined as the critical derailment speed.
The running speed of the vehicle on the curve is shown in Figure 3. The initial speed when the train enters the curve safely is low. After traveling a certain distance, the speed accelerates to a certain value and the vehicle runs steadily. The process of acceleration and maintenance of speed is repeated until the vehicle derails.
In this method, the definition of the critical derailment state comes from the geometric state of wheel–rail contact, and the train derailment is determined according to the wheel lift, which is also the most direct way to judge derailment. As shown in Figure 4, Iw is the lateral displacement of the wheelset; hp is the wheel lifting height, which is the vertical distance between the nominal contact point of the wheel tread and the highest point of the rail; hi is the height of the wheel flange; and hj is the height of the wheelset jumps.
When the bottom of the flange is completely climbed onto the rail, hp = hi. When the wheelset jumps from the rail, hp = hj > hi. It shows that when the wheel lifting height hp exceeds the flange height hi, and the lateral displacement of the wheelset Iw is greater than the width of the rail head, it can be determined that the wheel is separated from the rail; the wheel speed at this time is defined as the critical derailment speed.
The critical derailment speeds under different radius curves are shown in Figure 5. The critical derailment speed is positively correlated with the radius. When the radius of the curve increases, the critical speed increases and the growth rate becomes slower. For example, when the curve radius increases from 800 m to 1000 m, the critical speed increases 30 km/h. When the curve radius increases from 1600 m to 1800 m, the critical speed only increases 20 km/h. It can be seen that the larger the radius of the curve is, the smaller the influence of this factor on the increase in critical derailment speed.
3.3. Comparison of Results of Different Calculation Methods
3.3.1. Root Locus Method and Progressive Trial Method
The highest critical derailment speed calculated by the progressive trial method that occurs at the curve radius is 1800 m, which is close to the critical speed calculated by the root locus method, which is 380 km/h.
The root locus method must linearize the wheel–rail relationship, and the nonlinear characteristics of the force element is ignored. For example, the influence of the unloading speed is ignored in the shock absorber, and the relationship between the force and speed of the shock absorber is linearized. Due to the influence of nonlinear factors being ignored, the calculated critical speed is on the high side. In the progressive trial method, the nonlinear factors are taken into account, and the running state of the train is more accurate.
3.3.2. Limit Cycle Method and Progressive Trial Method
The nonlinear critical speed is close to 320 km/h. When the train runs on the lines with curve radii of 800 m, 1000 m and 1200 m, the critical derailment speeds calculated by the progressive trial method are 255 km/h, 285 km/h and 313 km/h, respectively. The nonlinear critical speed calculated by the progressive trial method is lower than that calculated by the limit cycle method. Vehicle derailment will occur before serpentine instability, and the three lines are set as group A. When the curve radii are 1400 m, 1600 m and 1800 m, the critical speeds of derailment are 341 km/h, 365 km/h and 383 km/h, which are higher than those calculated by the limit cycle method; the three curves are set into group B.
The running state of trains at different speeds is shown in Figure 6. It means that the vehicle could run stably over the nonlinear critical speed. According to the derailment mechanism [18], the train derails when the vehicle system loses stability in its lateral vibration state. The reason why the rolling stock can still run smoothly under various external disturbance conditions is that the system can generate a sufficient resistance increment after the disturbance, which exceeds or balances the load increment due to the disturbance in order to maintain the original system state [19].
The stability conditions of the equilibrium state of the train system are shown in Table 4. When the speed increases, the transverse vibration input energy σp and the transverse vibration ultimate resistance work σc increase. When the speed of the vehicle is under the non-derailment speed, σp and σc have an inconsistent growth trend. However, when the speed of the vehicle reaches the critical derailment speed, σp and σc approach each other [20]. That is, the train derails when the maximum energy of the transverse vibration input is greater than the ultimate minimum resistance.
The load energy increment in the limit cycle method mainly comes from the work performed by the excitation force caused by the hunting motion. When the vehicle runs over the nonlinear critical speed, the excitation vibration input work decreases. The vehicle can be shifted from an unstable state to a stable state, and the vehicle does not derail. With the progressive trial method, excluding the change in transverse vibration input energy caused by the change of train speed, the load energy increment comes entirely from the work performed by the rail on the wheel when the vehicle passes the curve. When it exceeds the work performed by the resistance force, the train will derail.
4. Wheel–Rail Contact Analysis at Critical Derailment Speed
4.1. Wheel–Rail Contact Analysis Method
In recent years, the wheel–rail elastic contact model has been widely used. The wheel–rail contact is a non-rigid contact; that different contact areas appear on the wheel tread should be considered. When multiple positions on the wheel tread are in contact with the rail at the same time, multiple contact spots can be generated [21].
The wheel–rail elastic contact model can be divided into equivalent elastic contact and discrete elastic contact. The equivalent elastic contact converts the actual contact spot shape into an elliptical shape. The data of Hertz normal force and creep force can be obtained. The method of equivalent elastic contact calculates quickly, whereas the calculation results in a lack of accuracy. The discrete elastic contact uses the periodicity of the swept body to evaluate the size of multiple contact spots, and the discretization method is used to predict the actual shape of the non-elliptical contact area. The simulation runs slow, but the calculation result is more accurate. So, discrete elastic contact is used in this article.
4.2. Analysis of Wheel–Rail Contact Spot
The wheels on the outer rail side of the train are selected for discrete elastic contact analysis, and simulations are performed at the critical derailment speed to obtain the change of contact patch during the derailment of the train, as shown in Figure 7.
The running direction of train is defined as the x direction, and the detection which is parallel to the ground and perpendicular to the x direction is the y direction. Figure 7a shows the wheel–rail contact spot during the normal operation of the train, and its maximum size in the x and y directions is close to 11 mm. When the train enters the transition curve, the contact spot moves rapidly to the right, as shown in Figure 7b. At the moment shown in Figure 7c, the wheel flange root begins to be in contact with the rail. The maximum length of the contact spot in the x direction increases to 17.4 mm, and the maximum width in the y direction decreases to 7.8 mm. Then, the contact spot continues to move rapidly to the right to reach a relatively stable position, as shown in Figure 7d. The wheel flange root and rail experience conformal contact. The train enters the curve, the relative position of the wheel and rail reaches the traditional critical position of quasi-static derailment, and the wheel tread and flange come in contact with the rail at the same time, as shown in Figure 7e. The wheel–rail contact state is extremely unstable. With the contact spot moving to the left, the wheel tread leaves the rail. The wheel flange climbs on the rail top, as shown in Figure 7f. The train derails.
5. Derailment Process Analysis
The derailment process is analyzed when the train runs at critical derailment speeds on different curves. The front wheelset of the front bogie plays a guiding role, which derails first. So, the wheels mentioned in this section are all in the front wheelset.
5.1. Wheel Lifting Height
Under the critical derailment speed, the wheel lifting height on the inner rail side is shown in Figure 8. When the vehicle enters the transition curve, the wheel flange on the inner side of the track has a tendency to climb up the rail due to the superelevation, and the wheel lifting height increases rarely. Based on the centrifugal force, the wheel pair moves to the outer side of the track quickly. In order to restore the alignment position, the wheel shakes left and right during the balancing process, resulting in fluctuation of the wheel lifting height. When the radius of the curve is 800 m, the train wheels along to the inner side derail on the transition curve. While on other lines, the wheel lifting height increases suddenly after the train enters the circular curve until the train turns over.
Figure 9 shows the wheel lifting height on the outer rail side. When the train runs on the line of group A, the lateral swing displacement of the wheel is large, and the wheel lifting height changes obviously. On the line with a radius of 800 m, the wheel of the outer rail does not return to alignment position after one lateral swing, and the flange falls over the top of the rail. The change trend of the wheel lifting height on the outer rail side of the vehicle in group B is the same. The wheel lifting height of trains which run in the curve of group B is smaller than that in group A. With the increase in the curve radius, the train derailment occurs later.
5.2. Wheel–Rail Attack Angle
The change curve of the front wheel–rail attack angle of the vehicle at the critical derailment speed is shown in Figure 10. When the train runs into the transition curve, the wheel–rail attack angle fluctuates. When the vehicle runs to the latter half of the transition curve on group A lines, the wheel–rail attack angle of the front wheelset increases suddenly. The maximum value of the wheel–rail attack angle is about 0.065 rad. The fluctuation amplitude of the wheel–rail attack angle reduces when the vehicle runs on the line of group B, and the value return to 0 rad gradually. After the train runs into the circle curve whose radius is 800 m, the train derails. On the other two lines in group A, the wheel–rail attack angle reduces to 0.005 rad quickly and changes with a large amplitude. With the vehicles running on group B lines, the wheel–rail attack angle stabilizes to 0 rad when the train runs into the circle curve.
Figure 11 shows the change curve of the rear wheel–rail attack angle of the vehicle under the critical derailment speed. On groups A and B in the transition curve, the train’s rear wheel–rail attack angles have a large change but will not produce abrupt changes.
Before reaching the critical derailment speed, the train on group B line runs unstably with the process of speed increasing. In order to study whether the wheel–rail attack angle of the train changes abnormally or not, the train runs on the group B line at a nonlinear critical speed. The relationship of the attack angle between the front wheel and the track is obtained and is shown in Figure 12.
It can be seen that the train that runs on the line of the 1400 m radius derails, but the other two trains do not derail. After the trains enter the transition curve, the attack angle of the front wheel pairs of the train running on group B lines shows similar change trends as that of group A at the critical derailment speed. The maximum value of the attack angle of group B is 0.06 rad.
It can be seen that when the speed is lower than the nonlinear critical speed, but the attack angle of the front wheel rises rapidly to 0.06 rad, the vehicle must derail. When the speed of the vehicle is larger than the nonlinear critical speed, the wheel–rail angle attack changes suddenly. The vehicle may not derail, but it will be in a critical unstable state. When the speed reaches the critical derailment speed, the wheel–rail attack angle will not change suddenly. Therefore, detecting the abnormal change of the wheel–rail attack angle of the train is an effective means to monitor the derailment tendency of the train. When the attack angle reaches 0.06 rad, timely measures should be taken to avoid derailment accidents.
5.3. Lateral and Vertical Forces and Derailment Factor
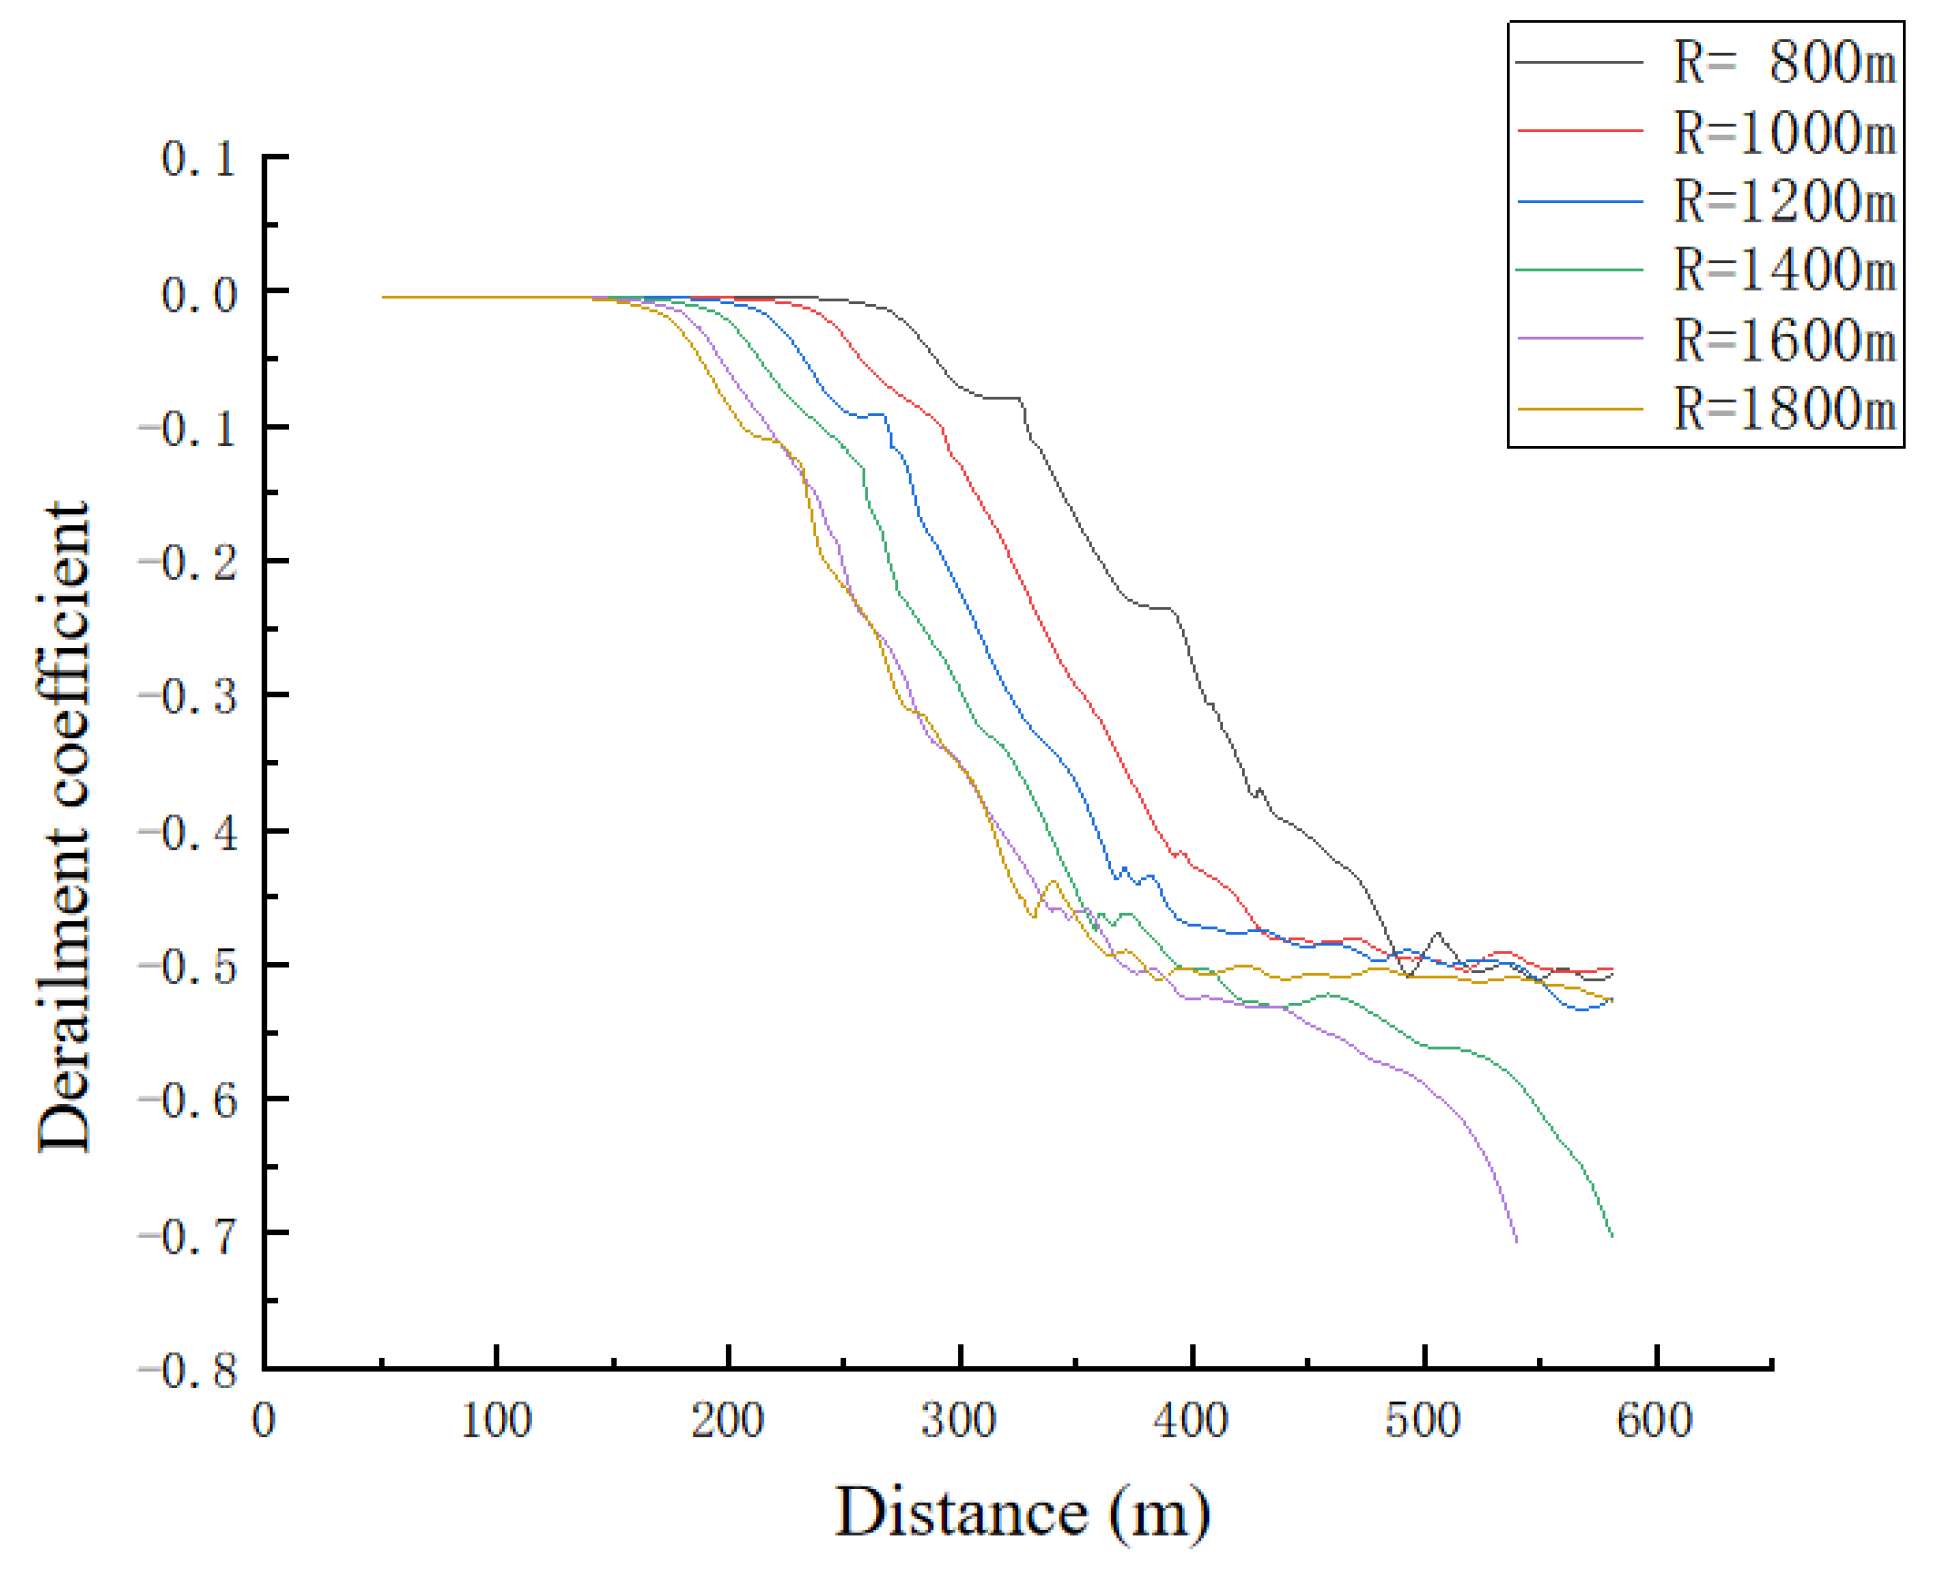
Figure 13, Figure 14 and Figure 15 show the changes in lateral forces, vertical forces and derailment coefficients when trains run at the critical derailment speed.
As can be seen from Figure 13, at the same location of the line, the larger the curve radius, the larger the absolute value of the wheel–rail lateral force of the vehicle. At the moment of derailment, the wheel–rail lateral force reaches more than 60 kN.
As shown in Figure 14, the vehicle vertical force increases with the radius of the curve. The vehicle force of trains running on the group B lines reaches 125~130 kN, and it maintains until derailment. On the 800 m radius curve, the train falls prematurely, and the wheel–rail vertical force on other lines can exceed 135 kN.
As can be seen from Figure 15, the larger the radius of the curve at the same location of the line, the larger the absolute value of the derailment factor. The derailment coefficients of the trains did not reach the second limit standard specified by the International Union of Railways, i.e., it increased the passing standard of safety margin, which verified the statement that it is difficult to judge whether the trains are derailed or not based on the derailment coefficients.
6. Conclusions
This article proposes a new method to study the critical derailment speed of a vehicle, which is the progressive trial method, analyzing the wheel–rail contact state when operating at the critical speed of derailment calculated by the progressive trial method, studying the dynamics of the index change law during derailment. The conclusions are as follows:
- Compared with the root locus method, both the progressive trial method and the limit cycle method take into account the nonlinear factors in the vehicle system, but the calculated critical speed is lower. Compared with the limit cycle method, the progressive trial method is more suitable for calculating the safe speed of trains running on small radius curves.
- The critical derailment speed is positively correlated with the curve radius, and its growth trend slows down with the increase in the curve radius. The smaller the radius of the curve, the greater the influence of this factor on the critical speed.
- When that the wheel–rail attack angle exceeds 0.06 rad, the vehicle is in a critical state of instability. Attention should be paid in time to avoid derailment accidents.
- On curved lines of different radii, when the train is derailed at the corresponding critical derailment speed, the maximum derailment coefficient is less than 0.8, but the derailment phenomenon still occurs. It indicates that the single derailment coefficient standard is not enough to measure whether the train derails or not.
Author Contributions
Conceptualization, R.Y. and H.M.; methodology, J.Z.; software, R.Y.; validation, R.Y. and H.M.; formal analysis, R.Y. and H.M.; investigation, Y.N.; resources, H.M.; data curation, R.Y.; writing—original draft preparation, R.Y.; writing—review and editing, H.M. and Y.N.; visualization, Y.N.; supervision, J.Z.; project administration, J.Z.; funding acquisition, J.Z. All authors have read and agreed to the published version of the manuscript.
Funding
This research was funded by Natural Science Foundation of China (grant number 51775031), R&D Program of Beijing Municipal Education Commission (grant number KM202210016003), Young Teachers’ Research Ability Enhancement Program Project of Beijing University of Civil Engineering and Architecture (grant number X21059).
Institutional Review Board Statement
Not applicable.
Informed Consent Statement
Not applicable.
Data Availability Statement
Not applicable.
Conflicts of Interest
The authors declare no conflict of interest.
References
- Zeng, J.; Guan, Q.H. Wheelset climb derailment criteria for evaluation of railway vehicle running safety. J. Transp. Eng. 2007, 6, 1–5. [Google Scholar]
- Wang, P.; Lai, J.; Liao, T.; Xu, J.; Wang, J.; Chen, R. Study on safety limit of wheelset derailment under quasi-static condition. J. Railw. 2019, 41, 123–130. [Google Scholar]
- Li, M.; Wang, C.; Ma, W. Derailment dynamic response analysis at low speed for a metro vehicle. Mech. Des. Manuf. 2019, 5, 121–124. [Google Scholar]
- Karmel, A.; Sweet, L.M. Wheelset mechanics during wheel climb derailment. J. Appl. Mech. 1984, 51, 680–686. [Google Scholar] [CrossRef]
- Braghin, F.; Bruni, S.; Diana, G. Experimental and numerical investigation on the derailmcnt of a railway wheelset with solid axde. Veh. Syst. Dynamnics 2006, 44, 305–325. [Google Scholar] [CrossRef]
- Lirong, G.; Kaiyun, W.; Huijiong, W.; Bing, Z.; Jianhui, L. Dynamic responses of motor vehicle in low-speed derailment. J. Transp. Eng. 2015, 15, 52–60+68. [Google Scholar]
- Kuzuta, M.; Ueki, K.; Miyamoto, T.; Nishiyama, Y.; Maebashi, E. Numerical Dynamic Simulation of a Train Set Running on Ballasted Track after Derailment. Q. Rep. RTRI 2013, 54, 112–117. [Google Scholar] [CrossRef] [Green Version]
- Sun, L. Evaluation Method Study and Theory Analysis of Lateral Running Stability and Dynamic Derailment of High Speed Train; China Academy of Railway Science: Bejing, China, 2014. [Google Scholar]
- Xiao, X. Study on High-Speed Train Derailment Mechanism in Severe Environment; Southwest Jiaotong University: Chengdu, China, 2013. [Google Scholar]
- Hou, S.; Huo, X.; Zhang, X.; Zuo, T.; Guo, G. Study on dynamic characteristics and structural strength of lateral limiting device for high-speed train under collision derailment accident. J. Railw. Sci. Eng. 2021, 18, 588–595. [Google Scholar]
- Wu, X. Research on the Safety of Vehicle Derailment under Seismic Conditions; Southwest Jiaotong University: Chengdu, China, 2016. [Google Scholar]
- Yao, C. Study on Reliability of High-Speed Train Running on Embankment under Crosswind; Dalian Maritime University: Dalian, China, 2020. [Google Scholar]
- Keiichi, G.; Masamichi, S.; Munemasa, T. Seismic Train-Running Safety on Structures. Proceedings 2018, 2, 1143. [Google Scholar]
- Mu, D.; Gwon, S.-G.; Choi, D.-H. Dynamic Responses of a Cable-stayed Bridge under a High Speed Train with Random Track Irregularities and a Vertical Seismic Load. Int. J. Steel Struct. 2016, 16, 1339–1354. [Google Scholar] [CrossRef]
- Gong, K.; Liu, L.; Xiang, J.; Luo, K. Calculation of passenger train derailment course induced by overspeeds in curve. J. Cent. South Univ. 2020, 51, 2673–2680. [Google Scholar]
- The First Survey and Design Institute Group of China Railway Co. Railroad Line Design Specification; China Railway Press: Bejing, China, 2018. [Google Scholar]
- Liu, H.; Gao, C.; Wang, Y.; Hu, H. Method to determine the critical hunting speed of bogies for 160 km/h rapid freight cars. Railr. Veh. 2017, 55, 1–5+18+6. [Google Scholar]
- Shi, H.; Luo, R.; Zeng, J. Review on domestic and foreign dynamics evaluation criteria of high-speed train. J. Transp. Eng. 2021, 21, 36–58. [Google Scholar]
- Xiang, J.; Zeng, Q.Y.; Zhou, Z.F. Mechanical mechanism and random energy analysis theory of train derailment on the bridge and its application. J. Railw. 2004, 2, 97–104. [Google Scholar]
- Xiang, J. Study on Mechanism and Analysis Theory of Train Derailment; Central South University: Changsha, China, 2006. [Google Scholar]
- Shabana, A.A.; Zaazaa, K.E.; Escalona, J.L.; Sany, J.R. Development of elastic force model for wheel/rail contact problems. J. Sound Vib. 2004, 269, 295–325. [Google Scholar] [CrossRef]
Figure 1.
Vehicle–track system dynamics model.
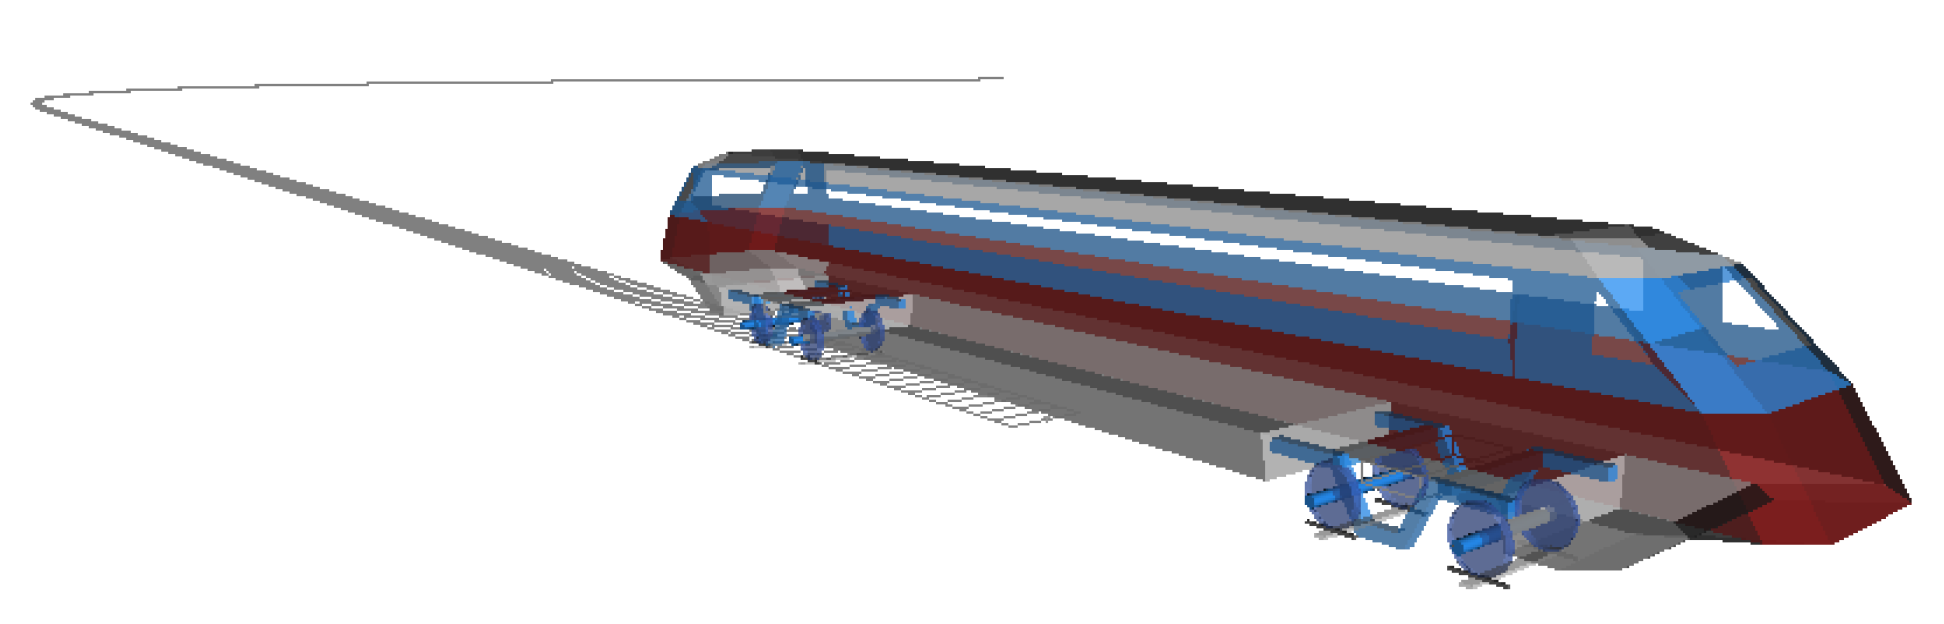
Figure 2.
Relationship between traverse and speed.
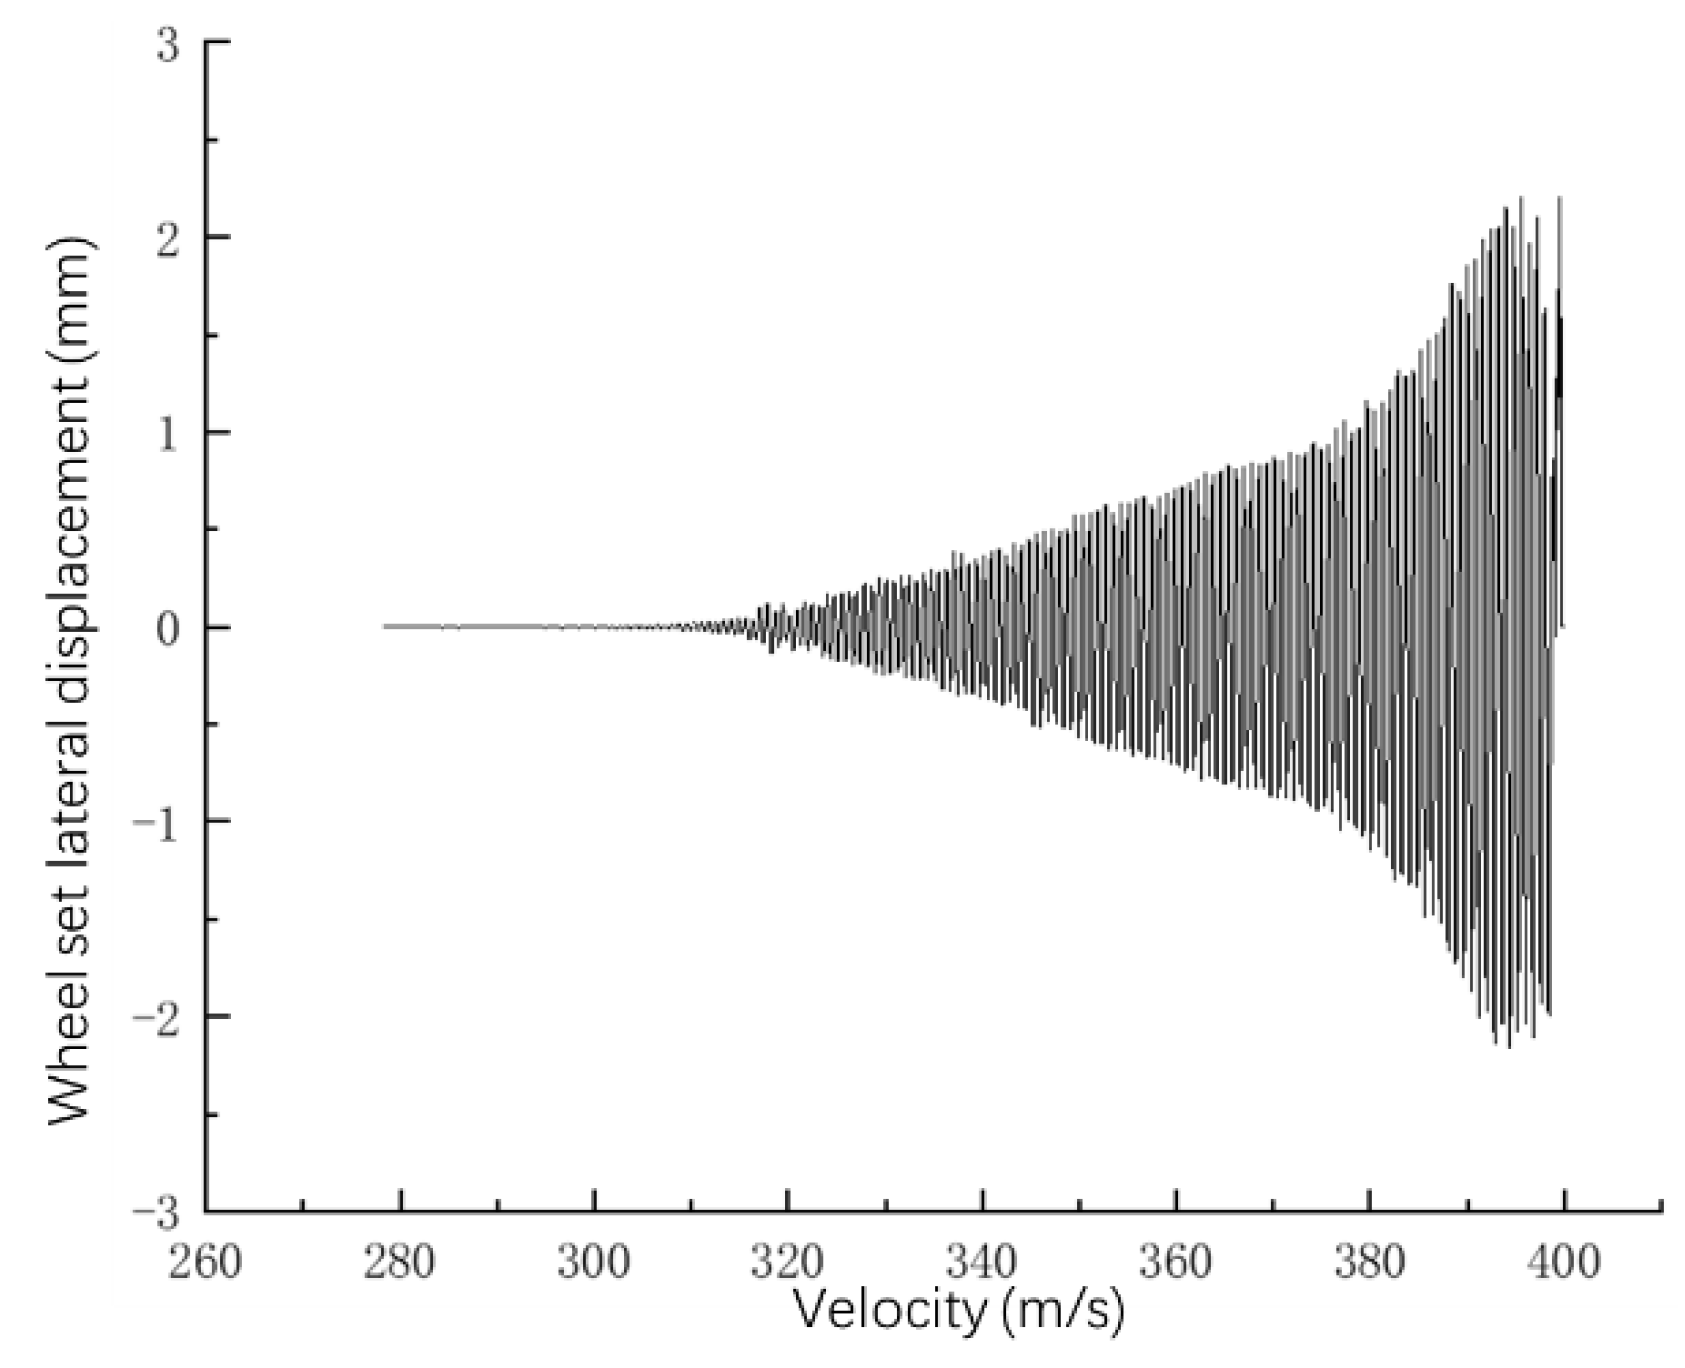
Figure 3.
The running speed of the vehicle on the curve.
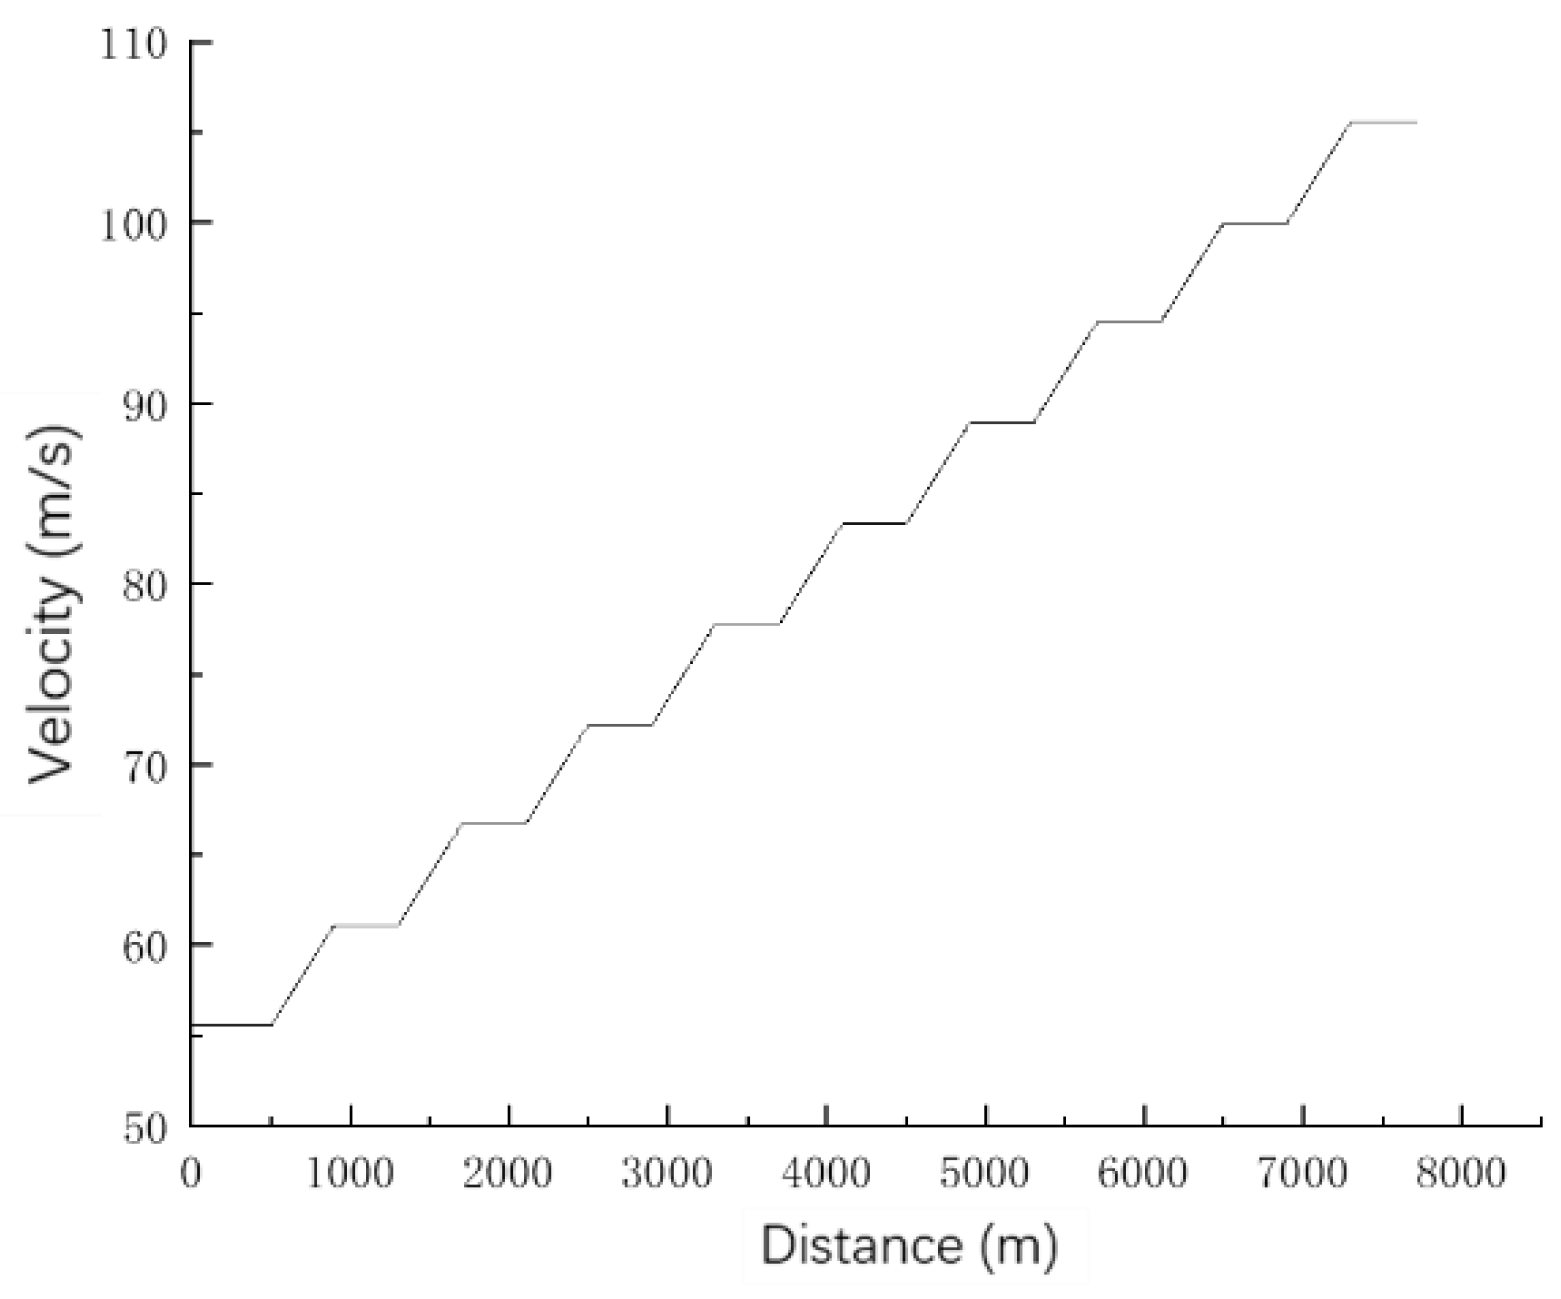
Figure 4.
Geometric state of wheel–rail during derailment.

Figure 5.
The critical derailment speeds under different radius curves.
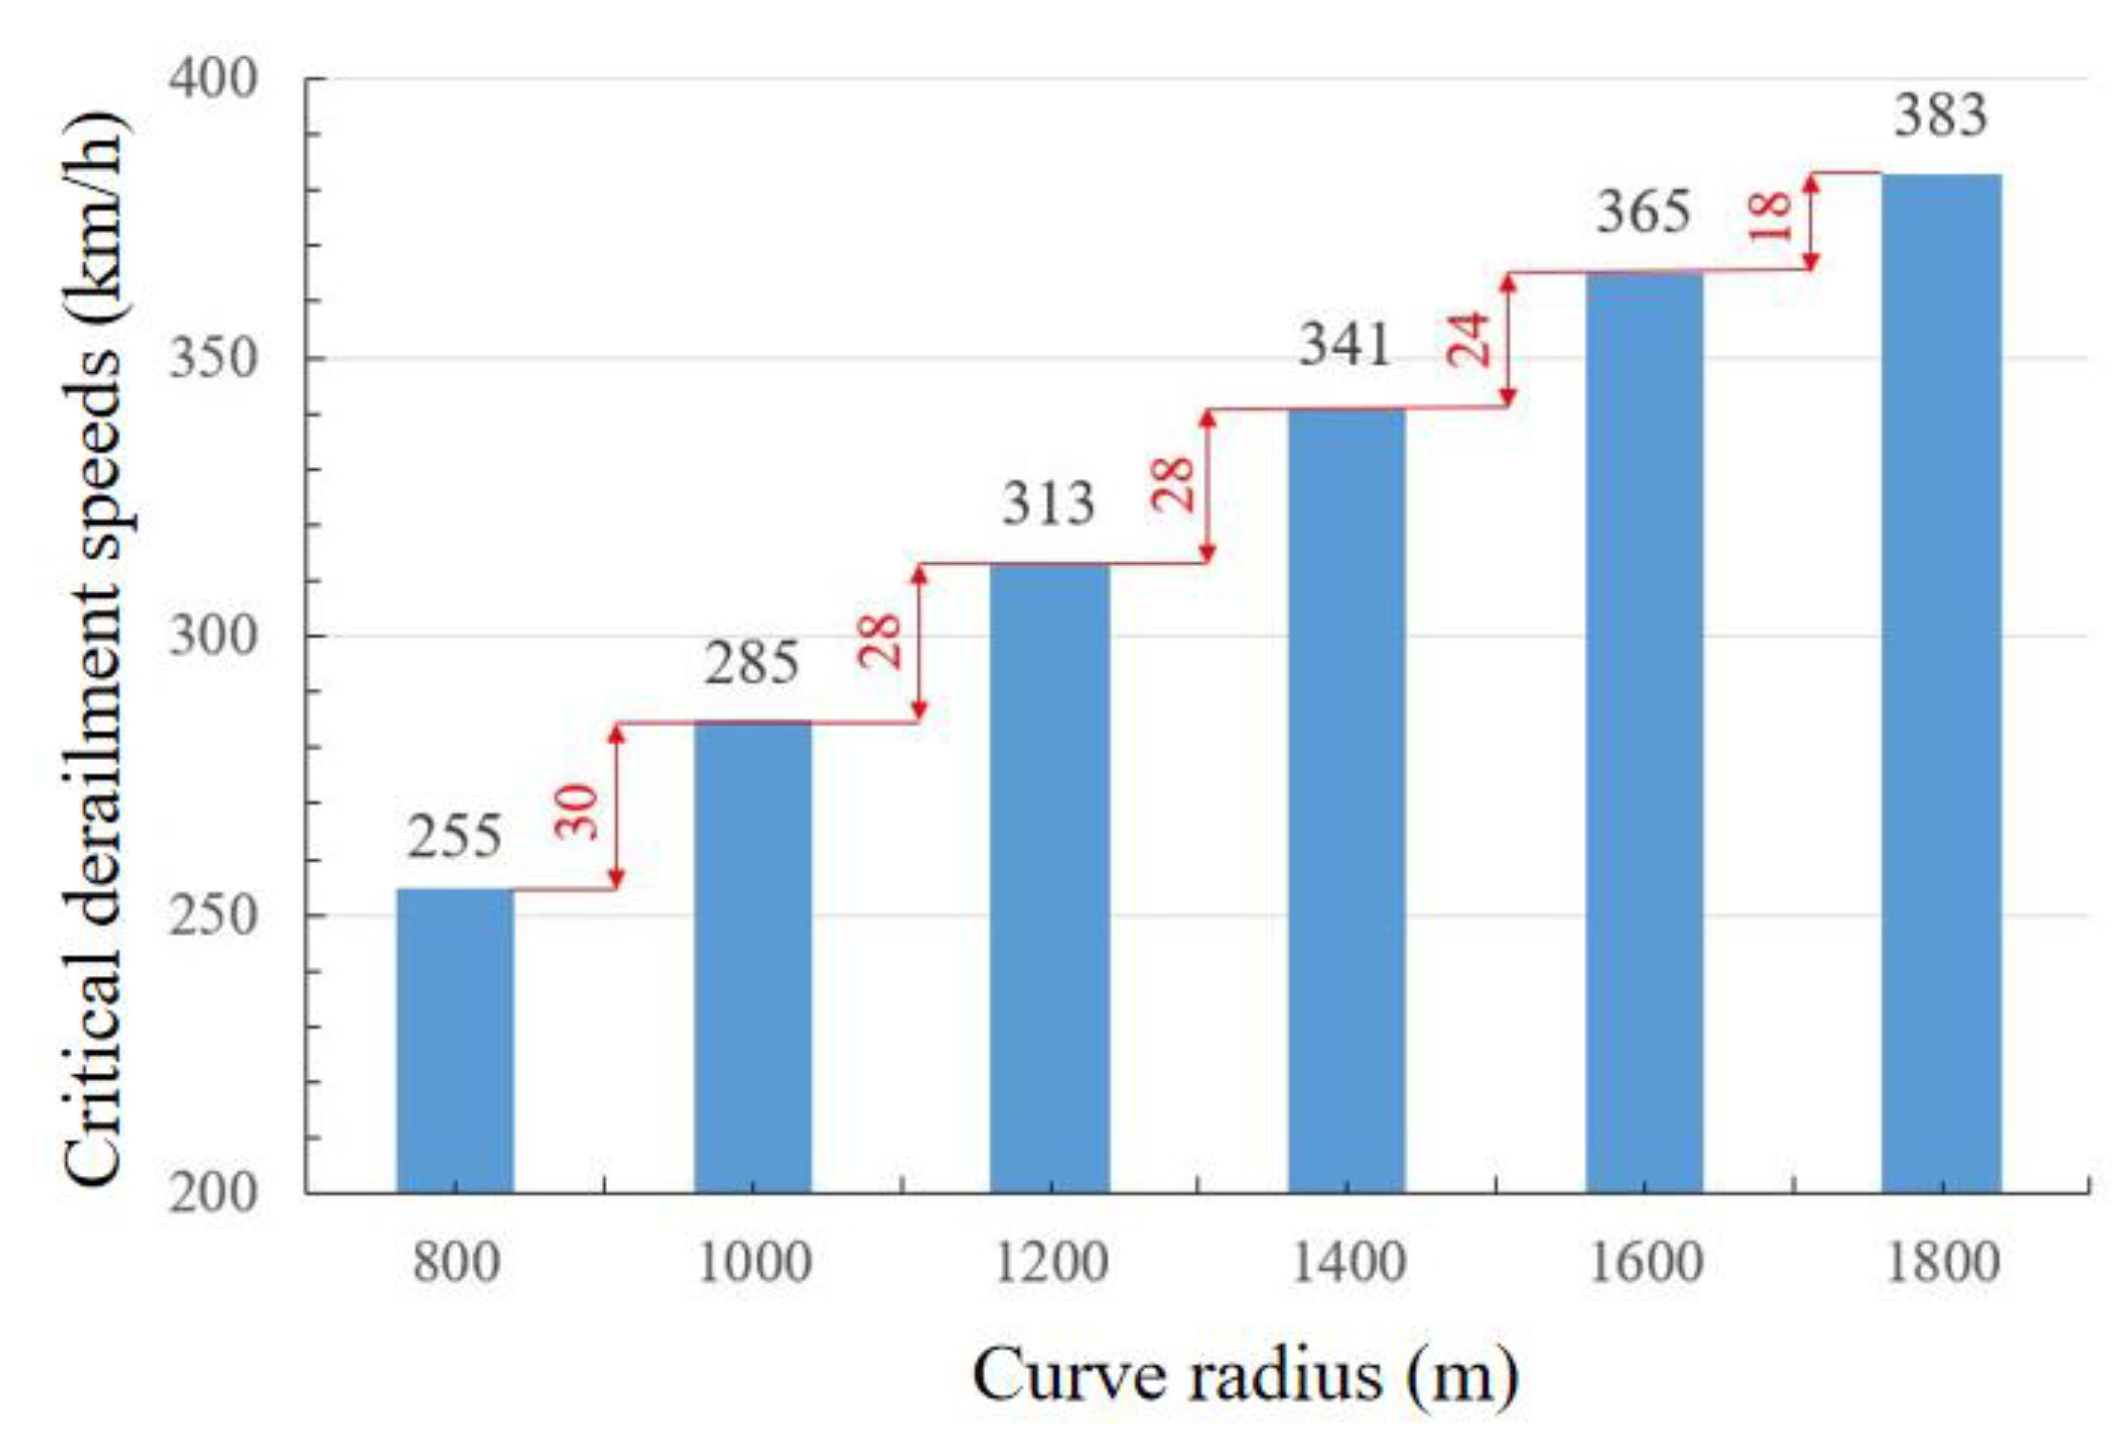
Figure 6.
Running status of trains on group A and group B.
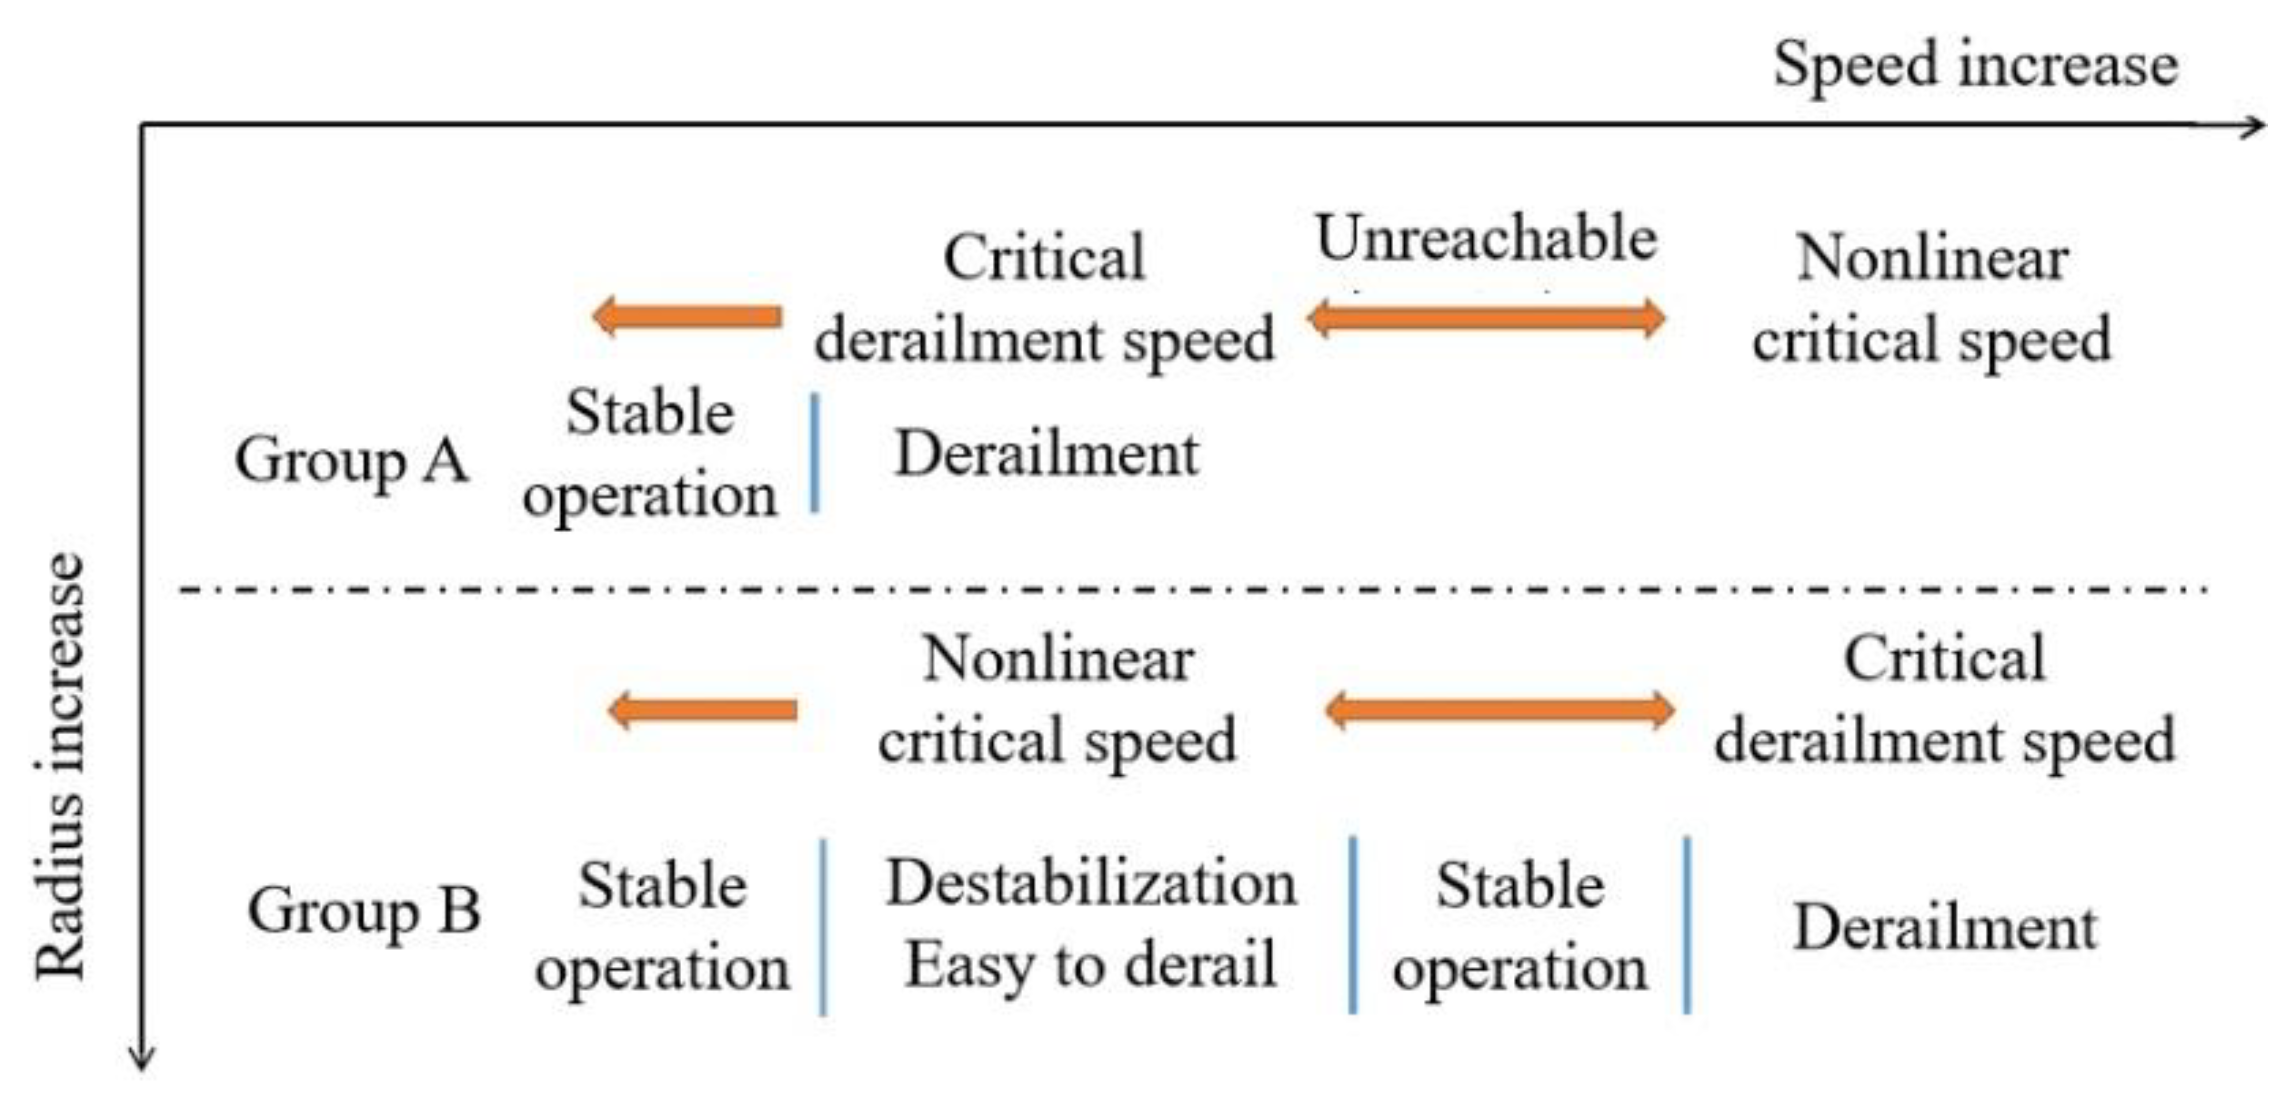
Figure 7.
Wheel–rail contact spot variation diagram.
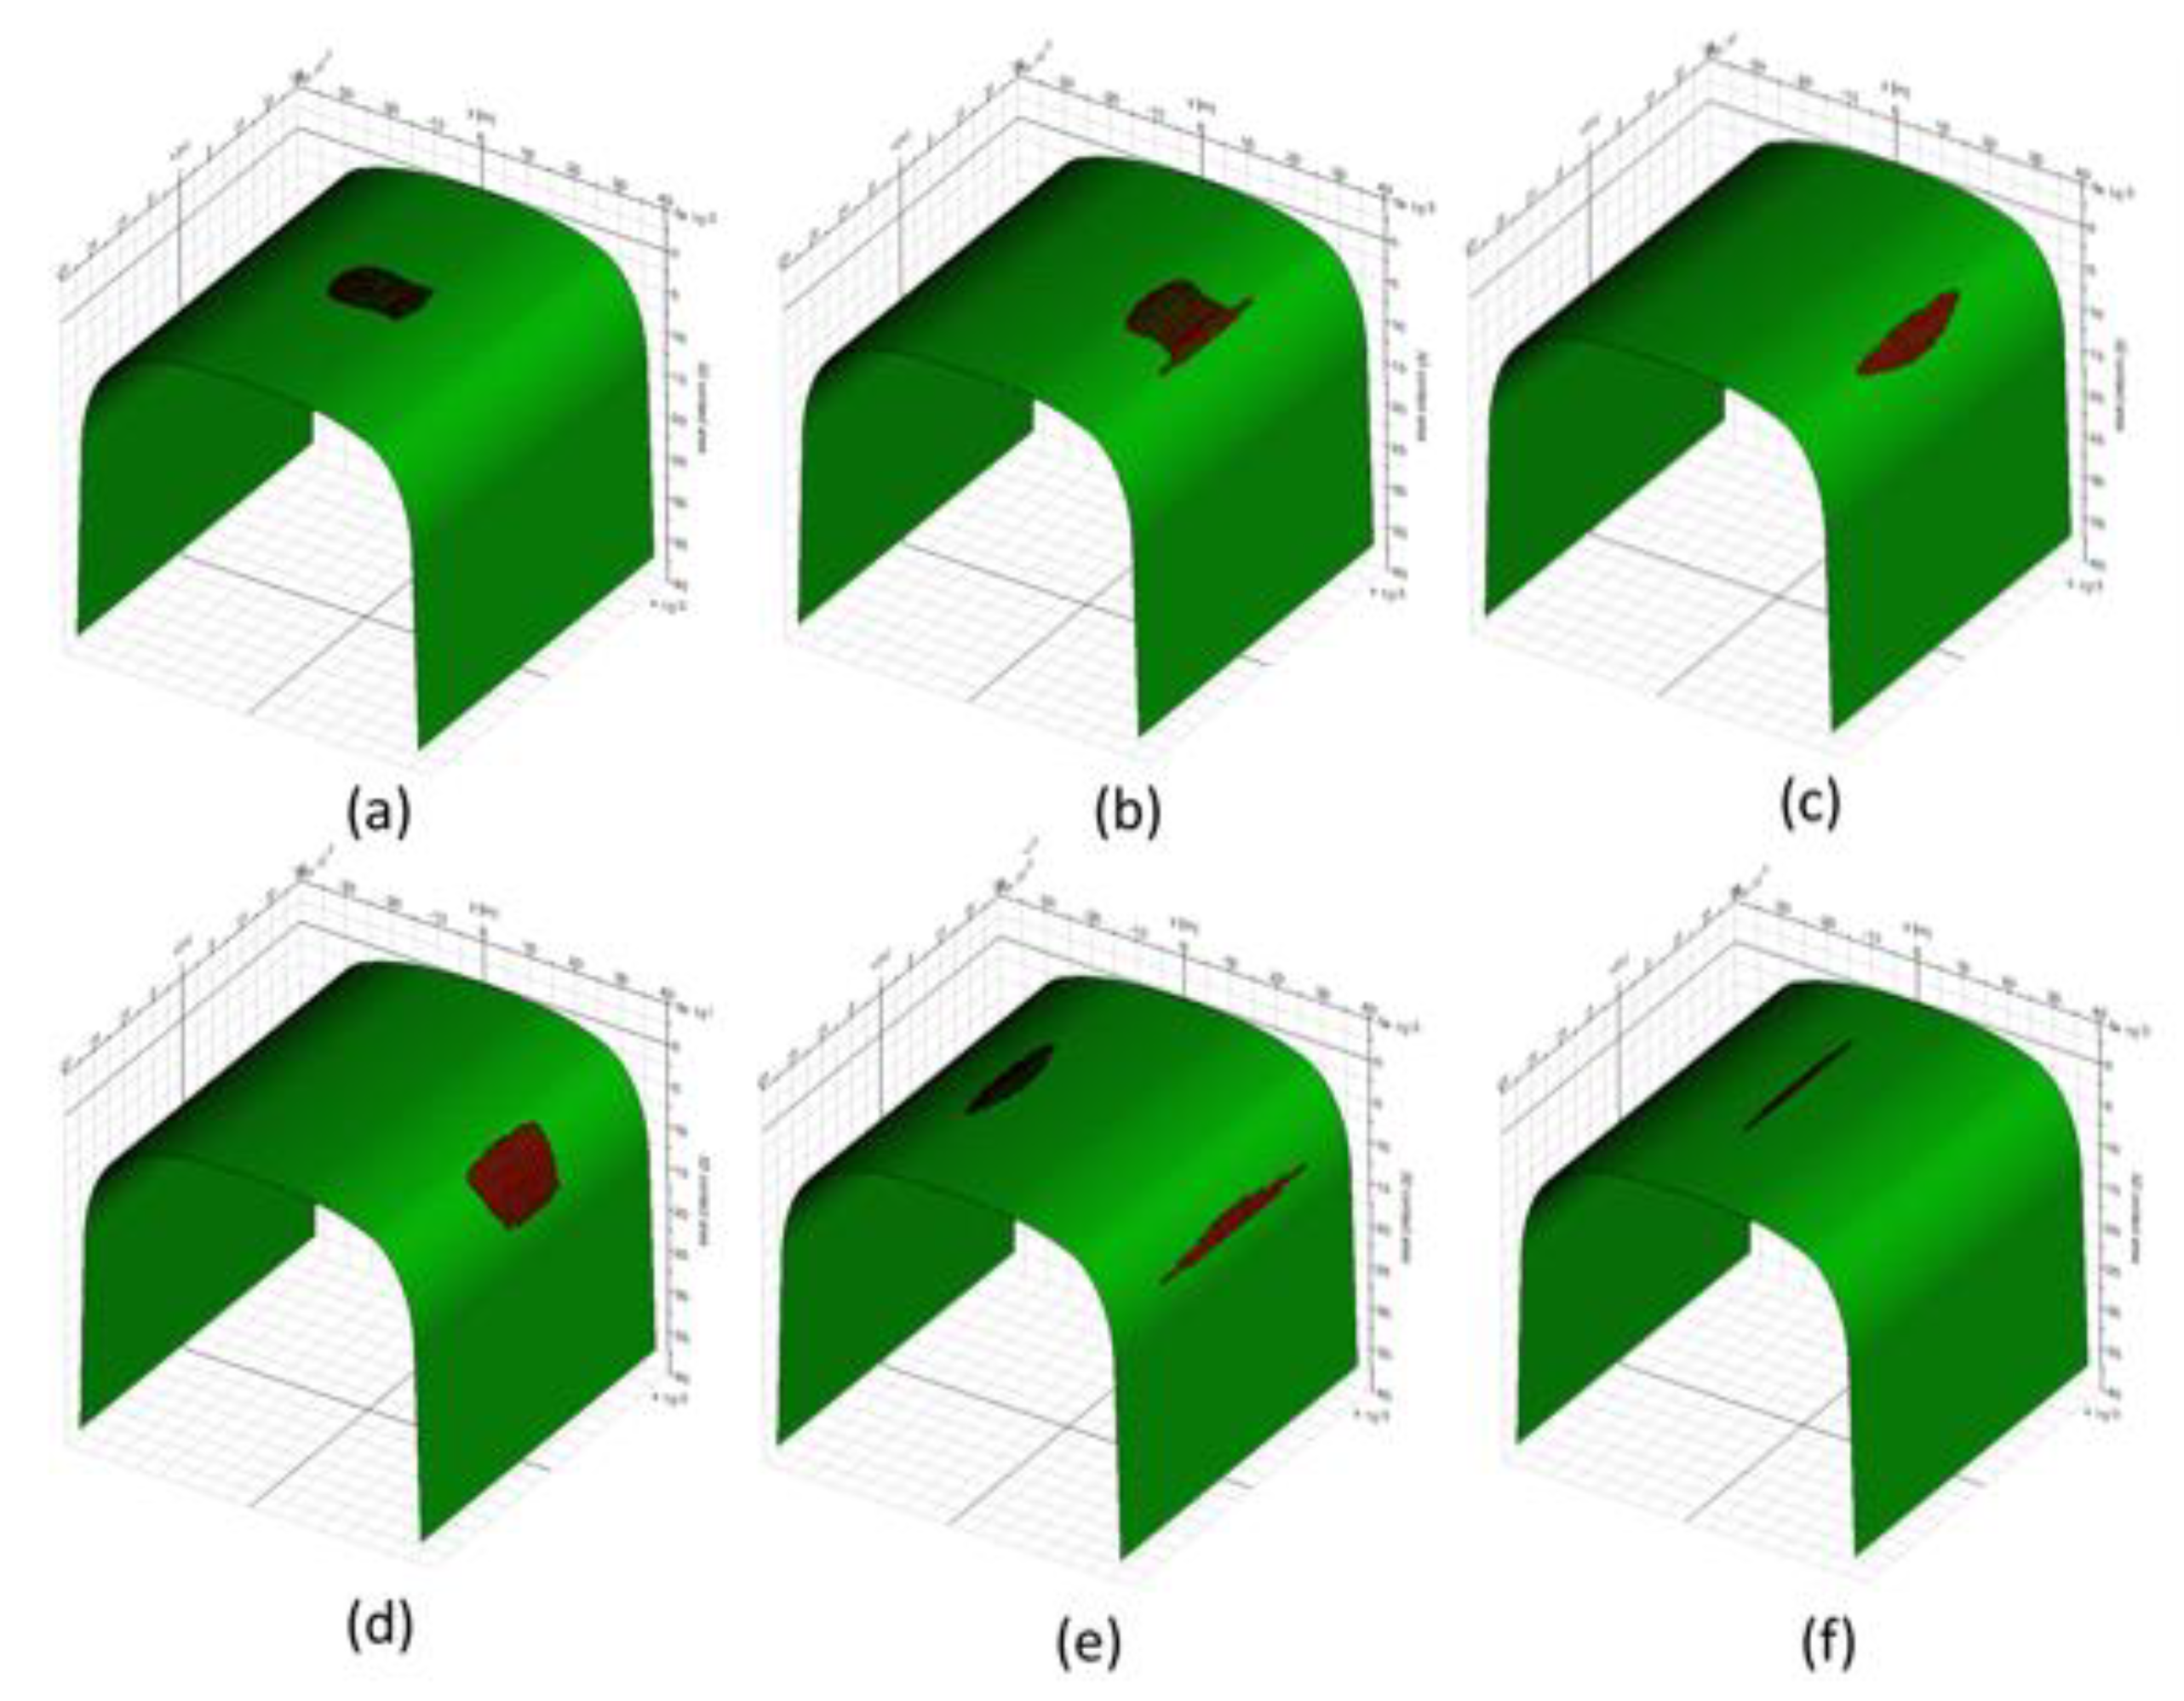
Figure 8.
Wheel lifting height at inner rail side.
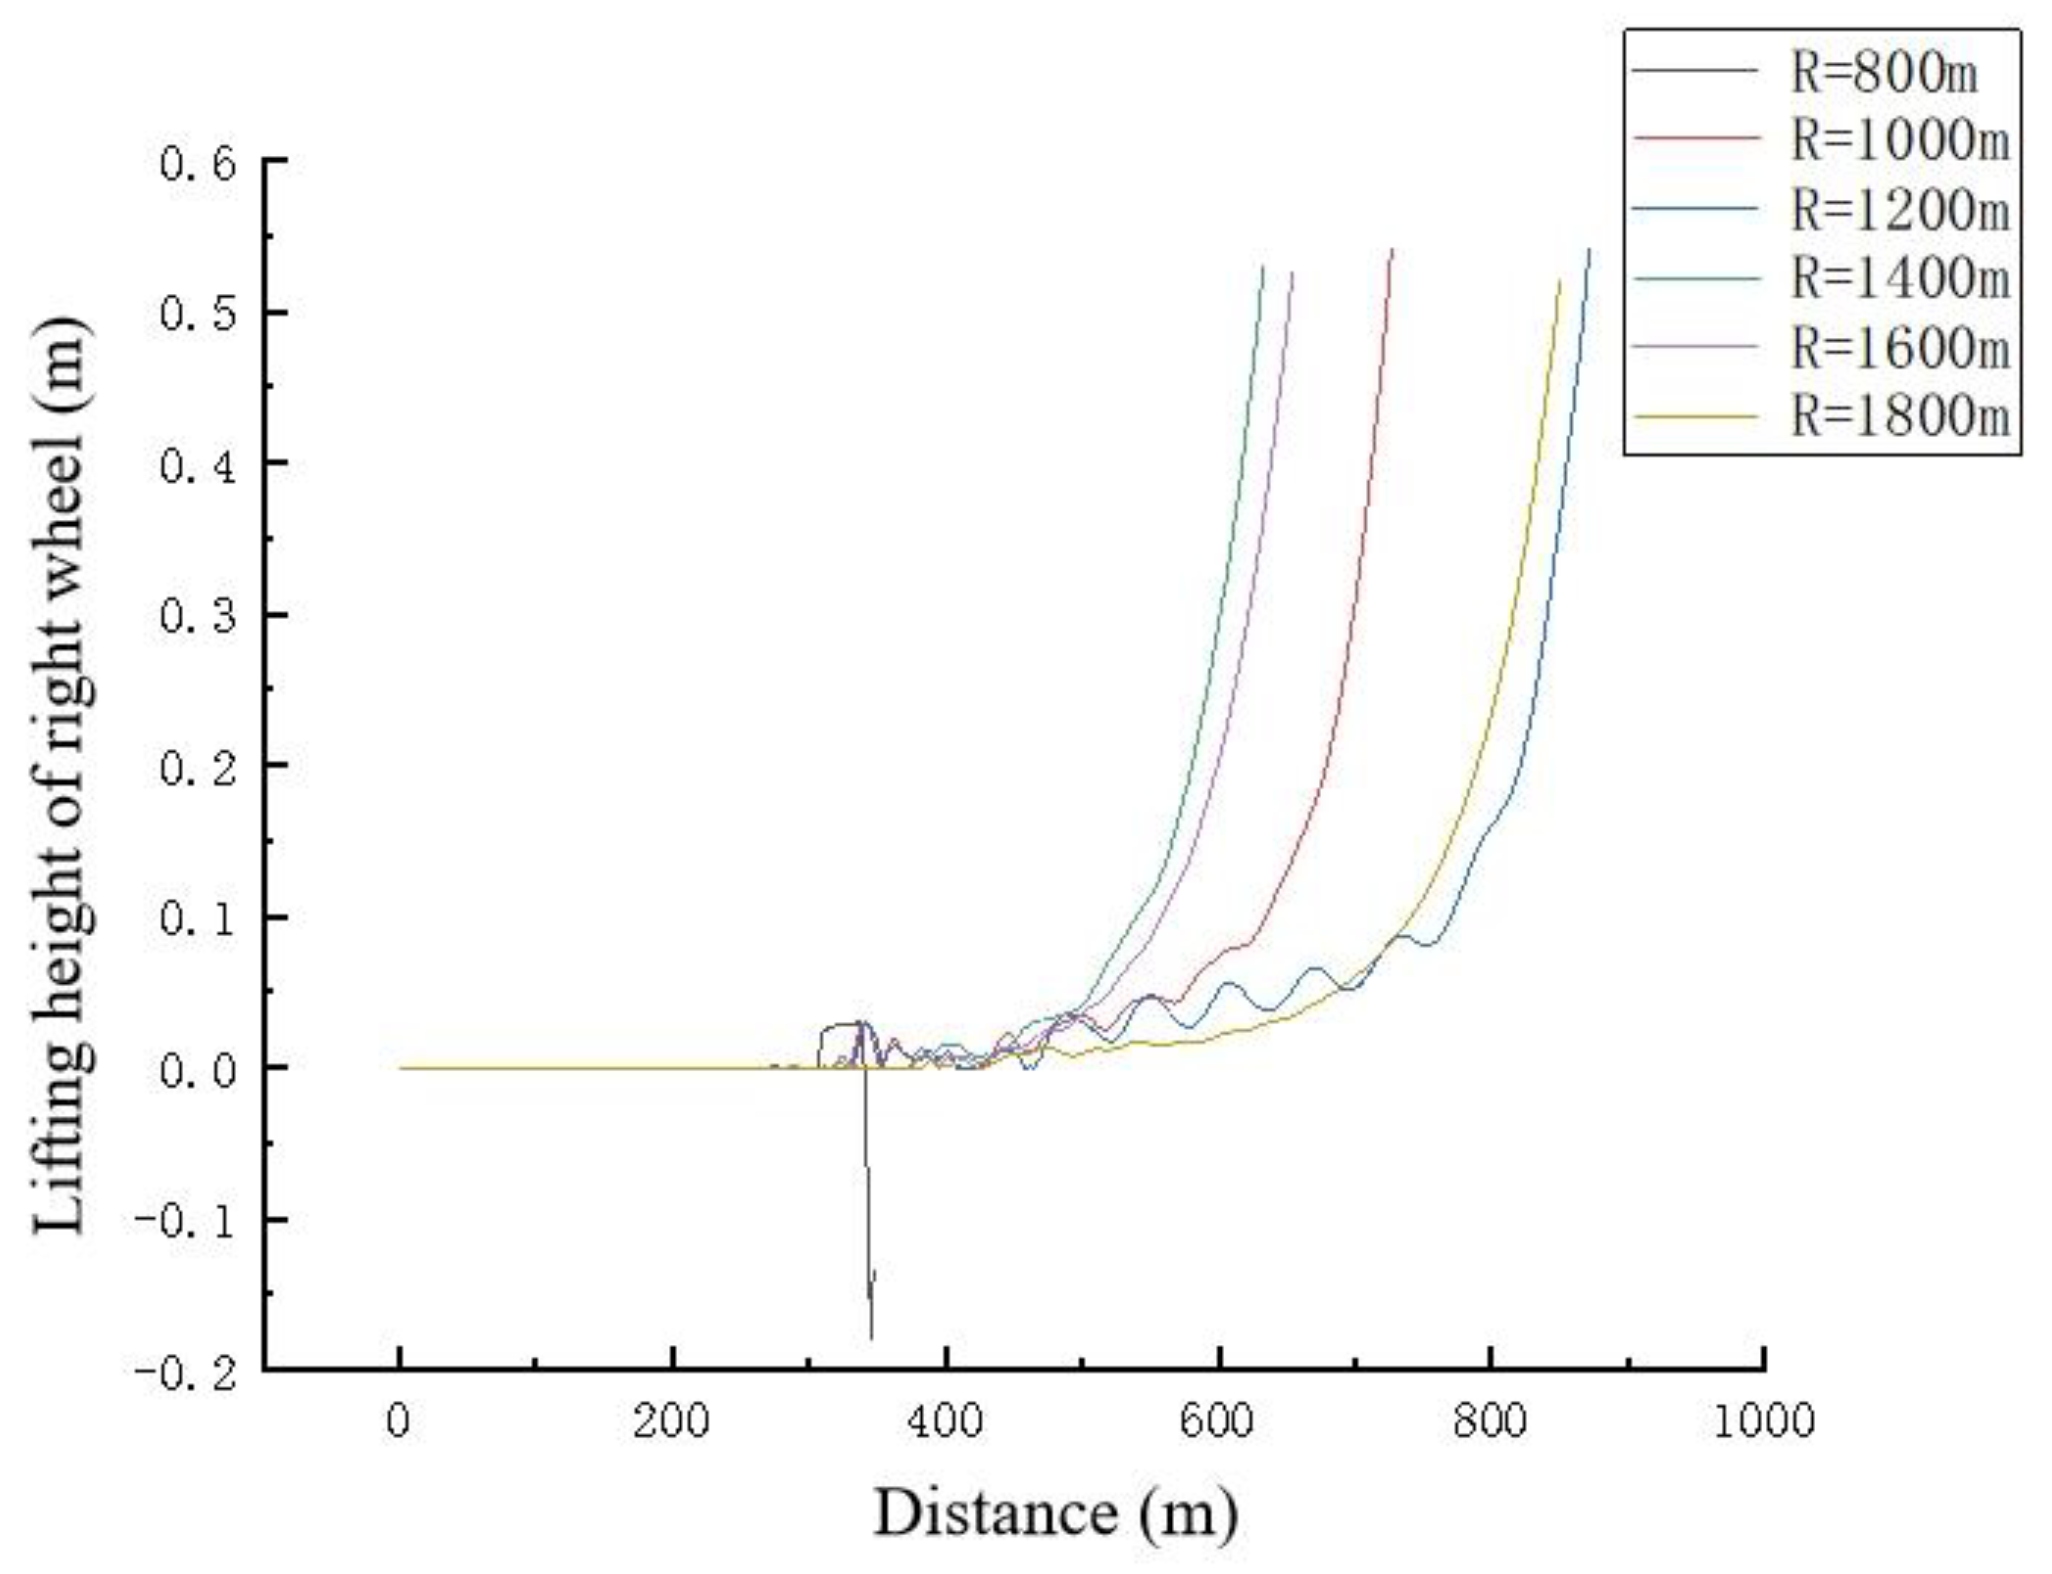
Figure 9.
Wheel lifting height at outer rail side.
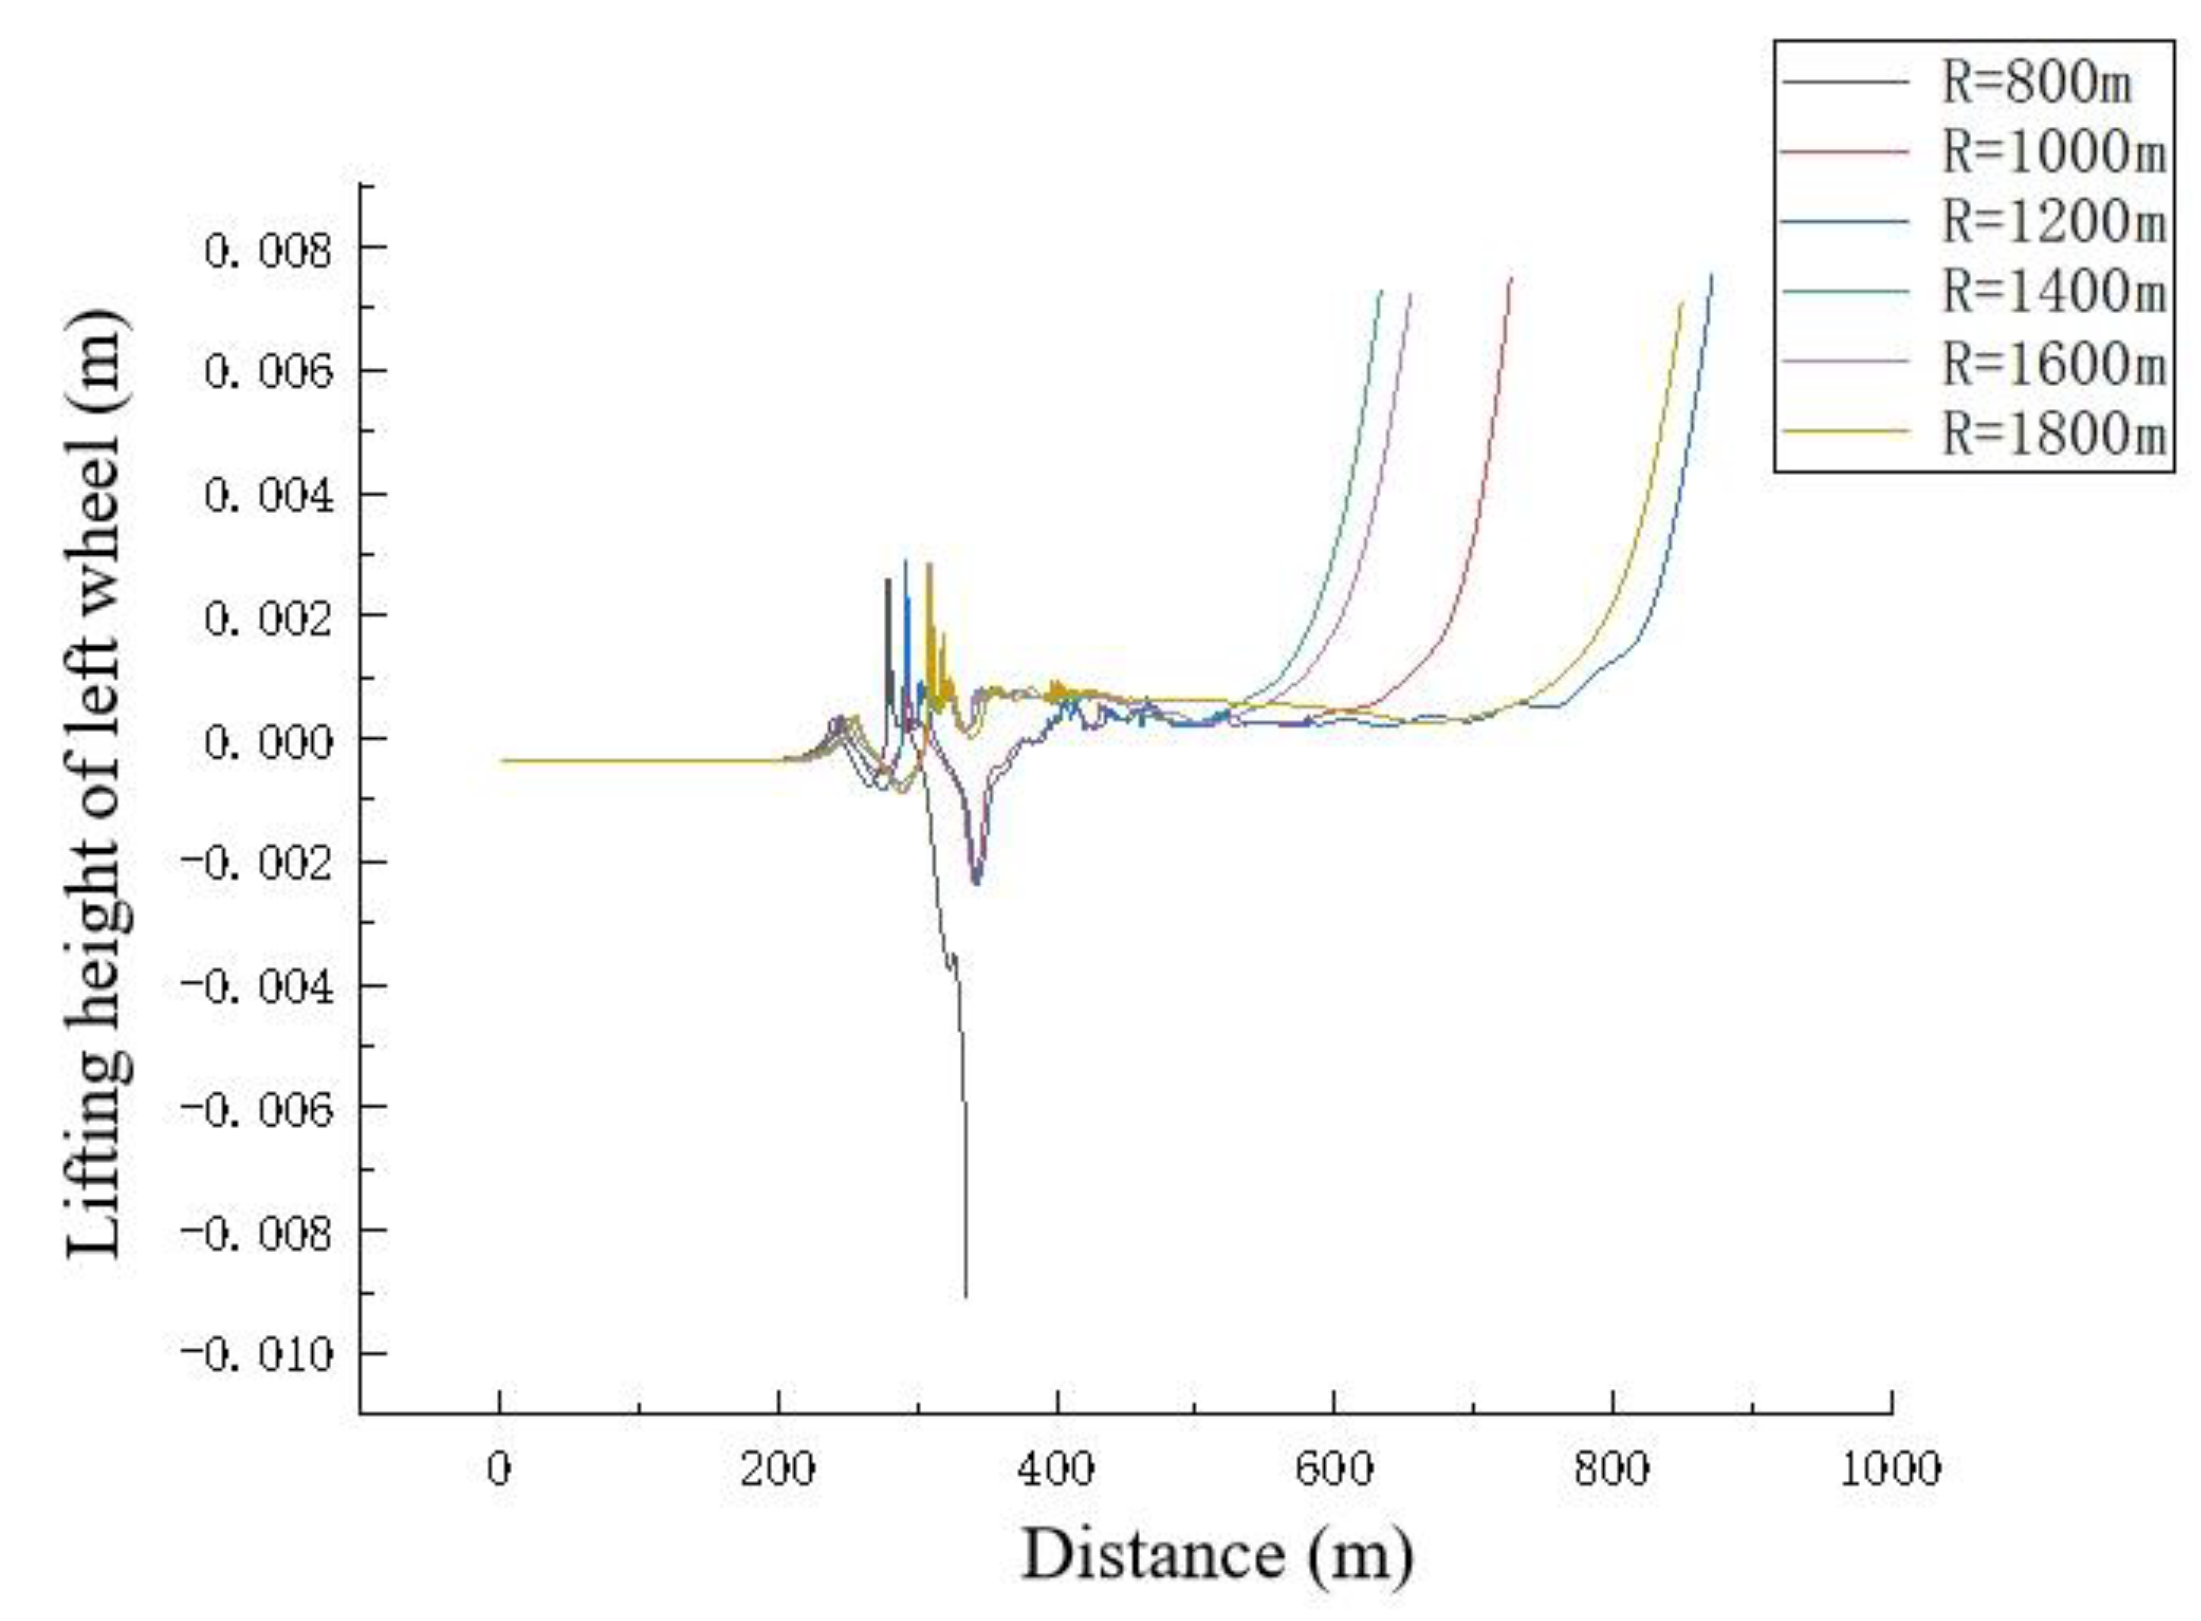
Figure 10.
Changing curve of the front wheel–rail attack angle.
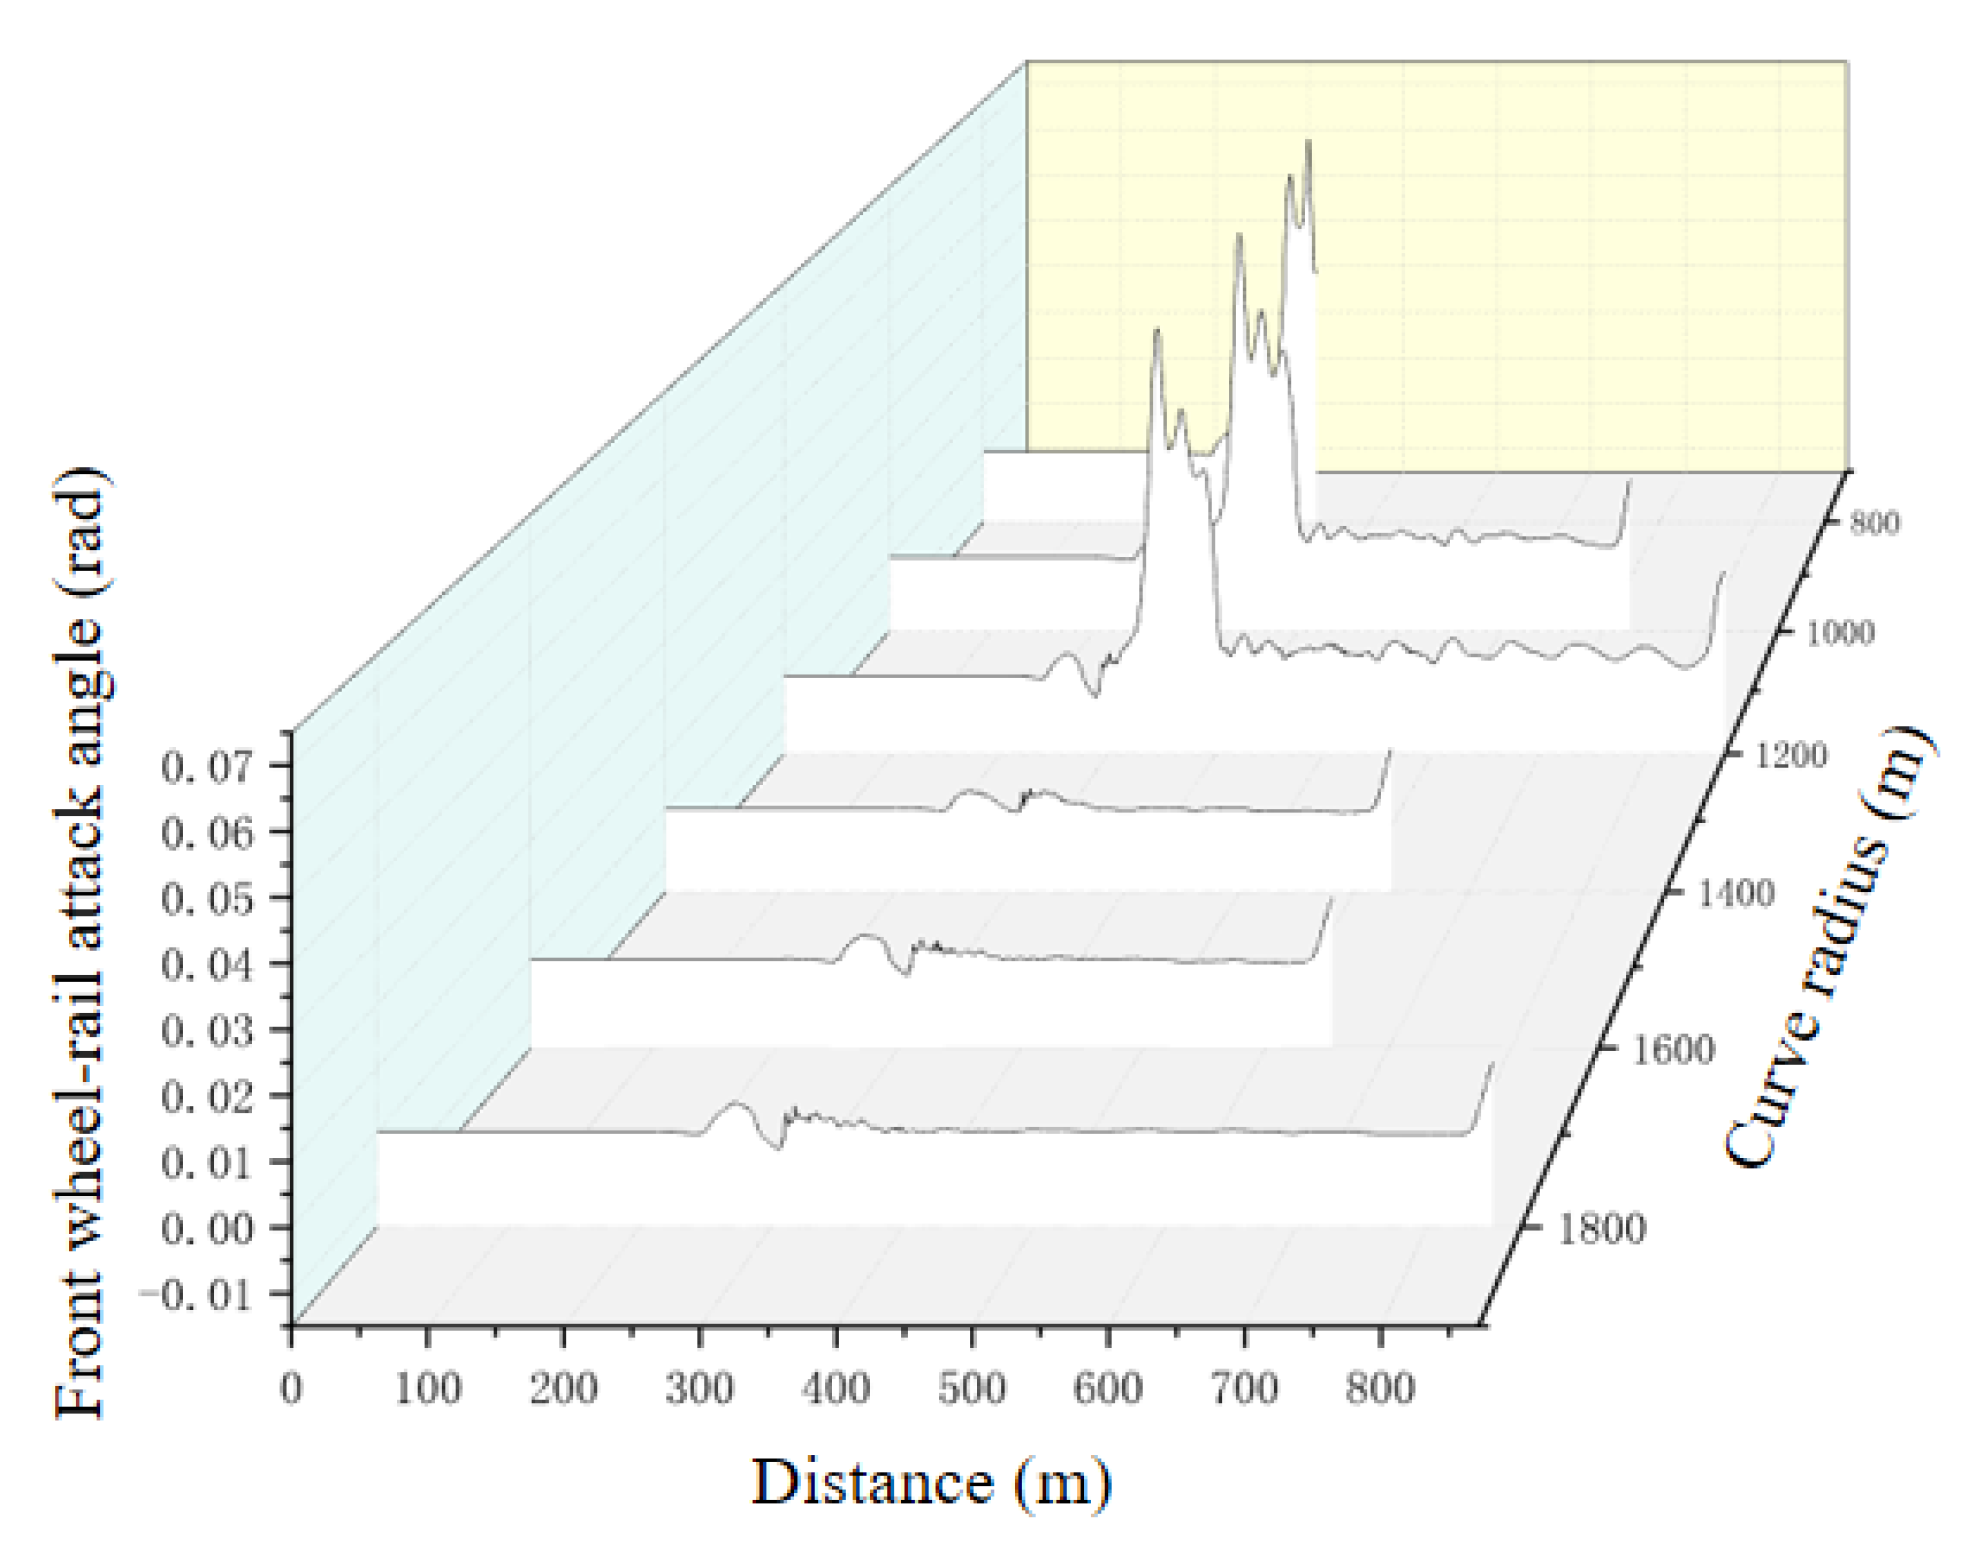
Figure 11.
Changing curve of the rear wheel–rail attack angle.
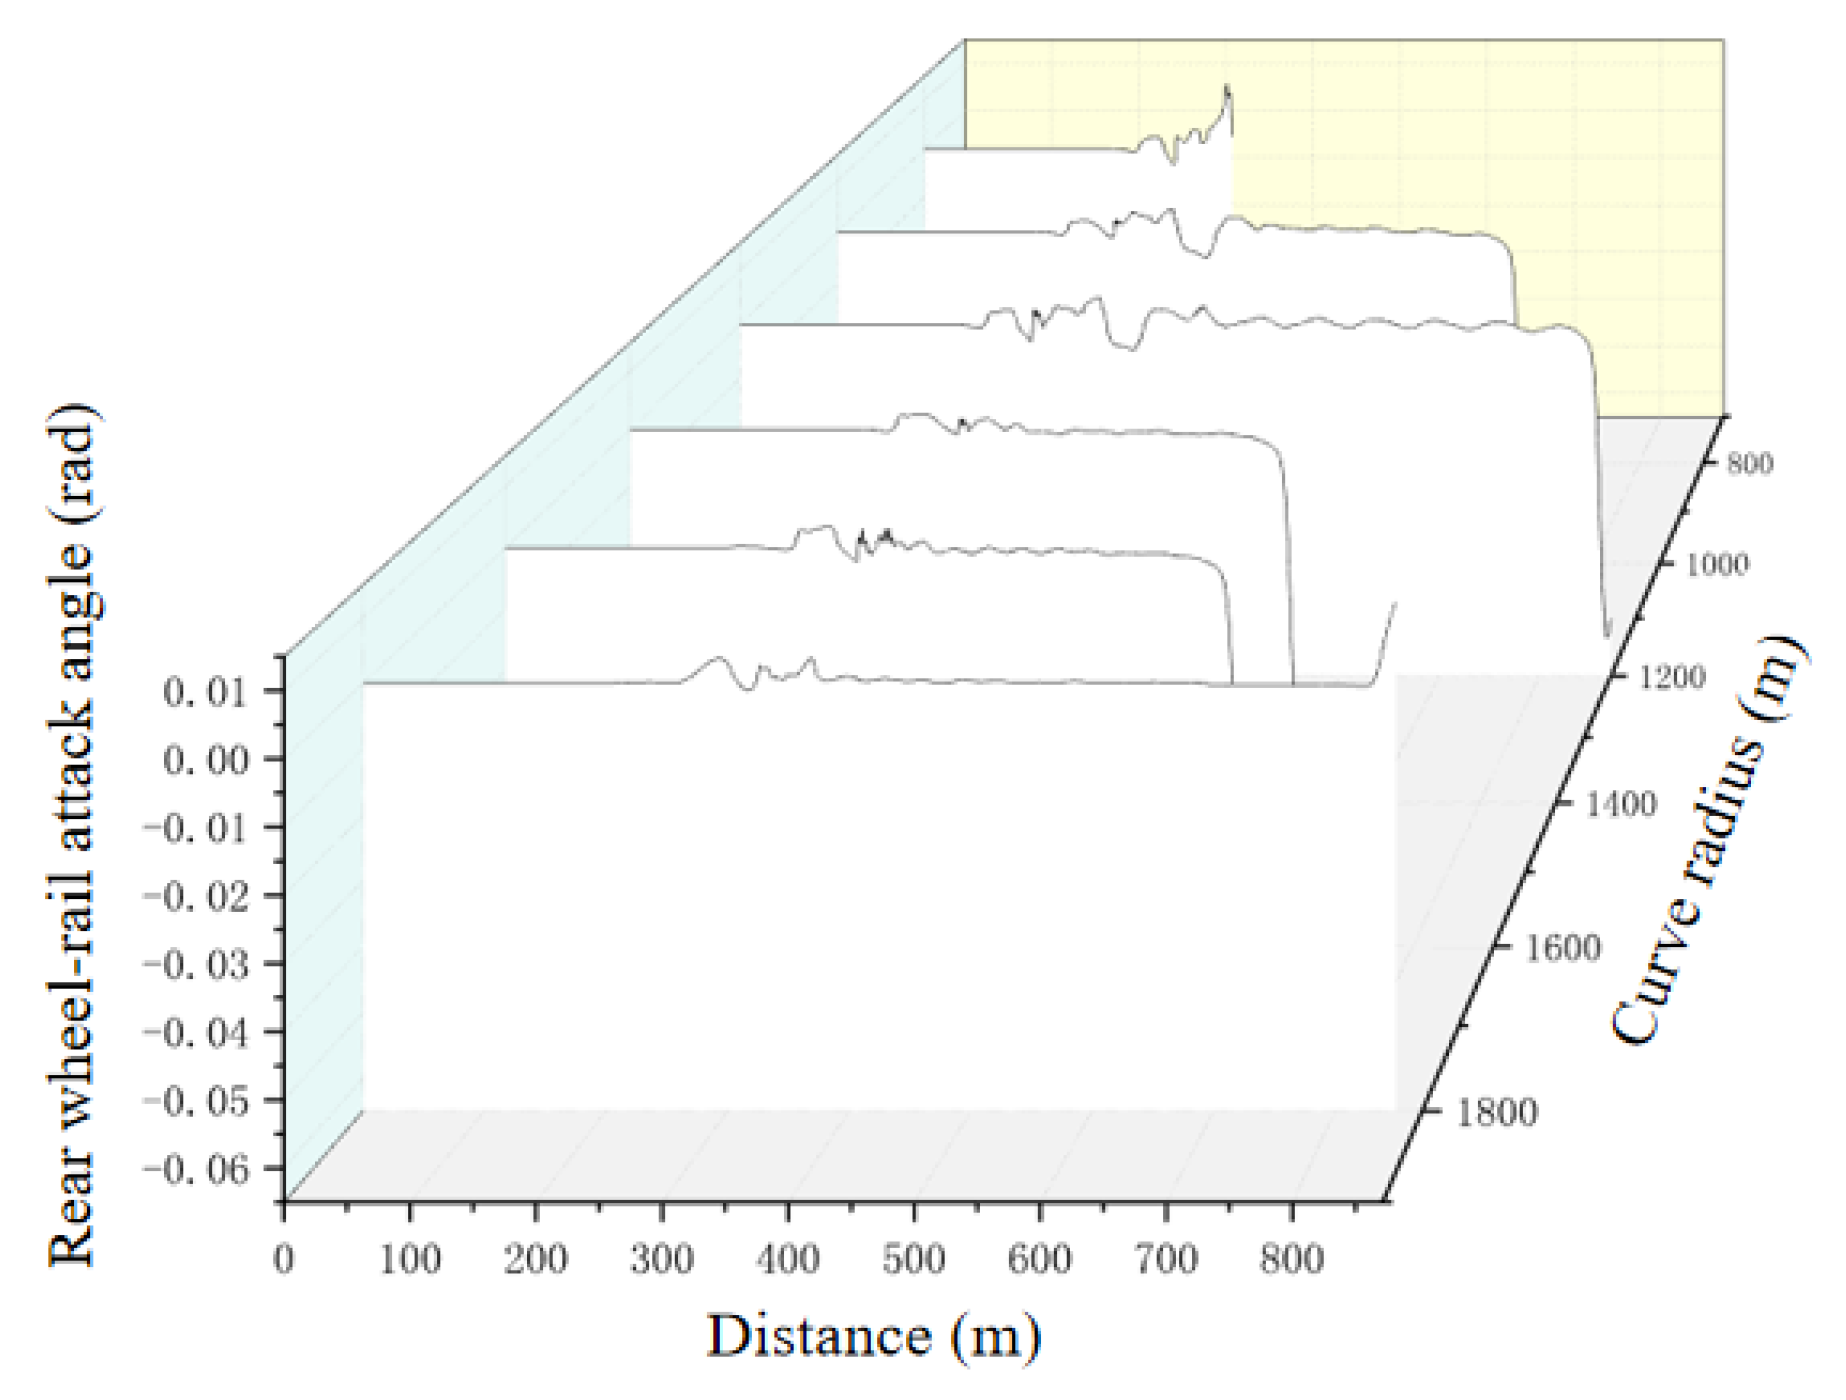
Figure 12.
Attack angle of the train running on group B under nonlinear critical speed.
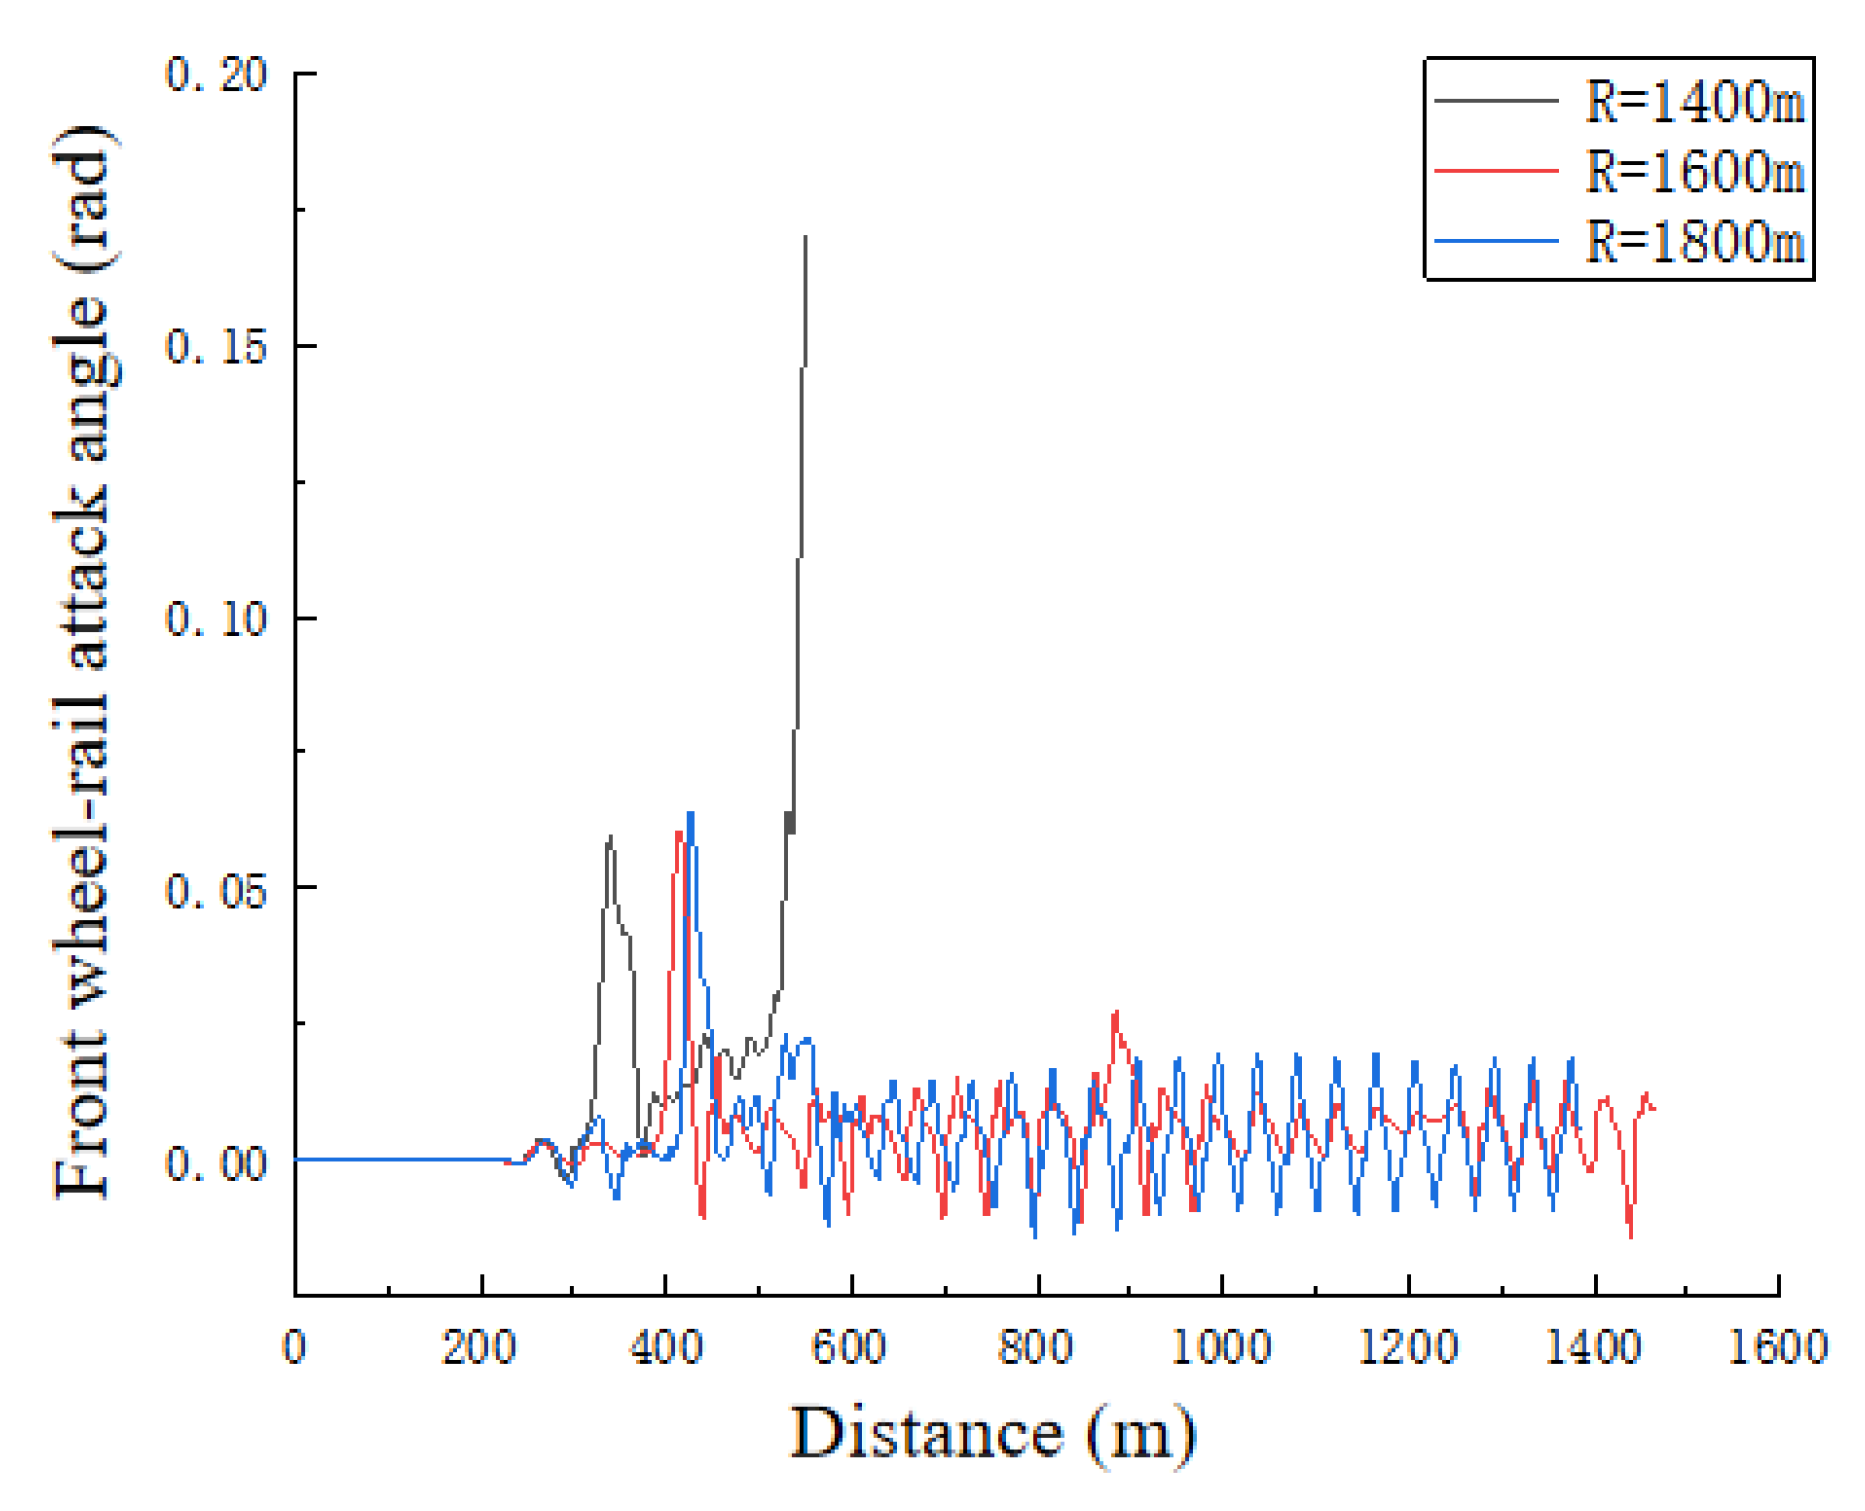
Figure 13.
Variation of lateral force at critical derailment speed.
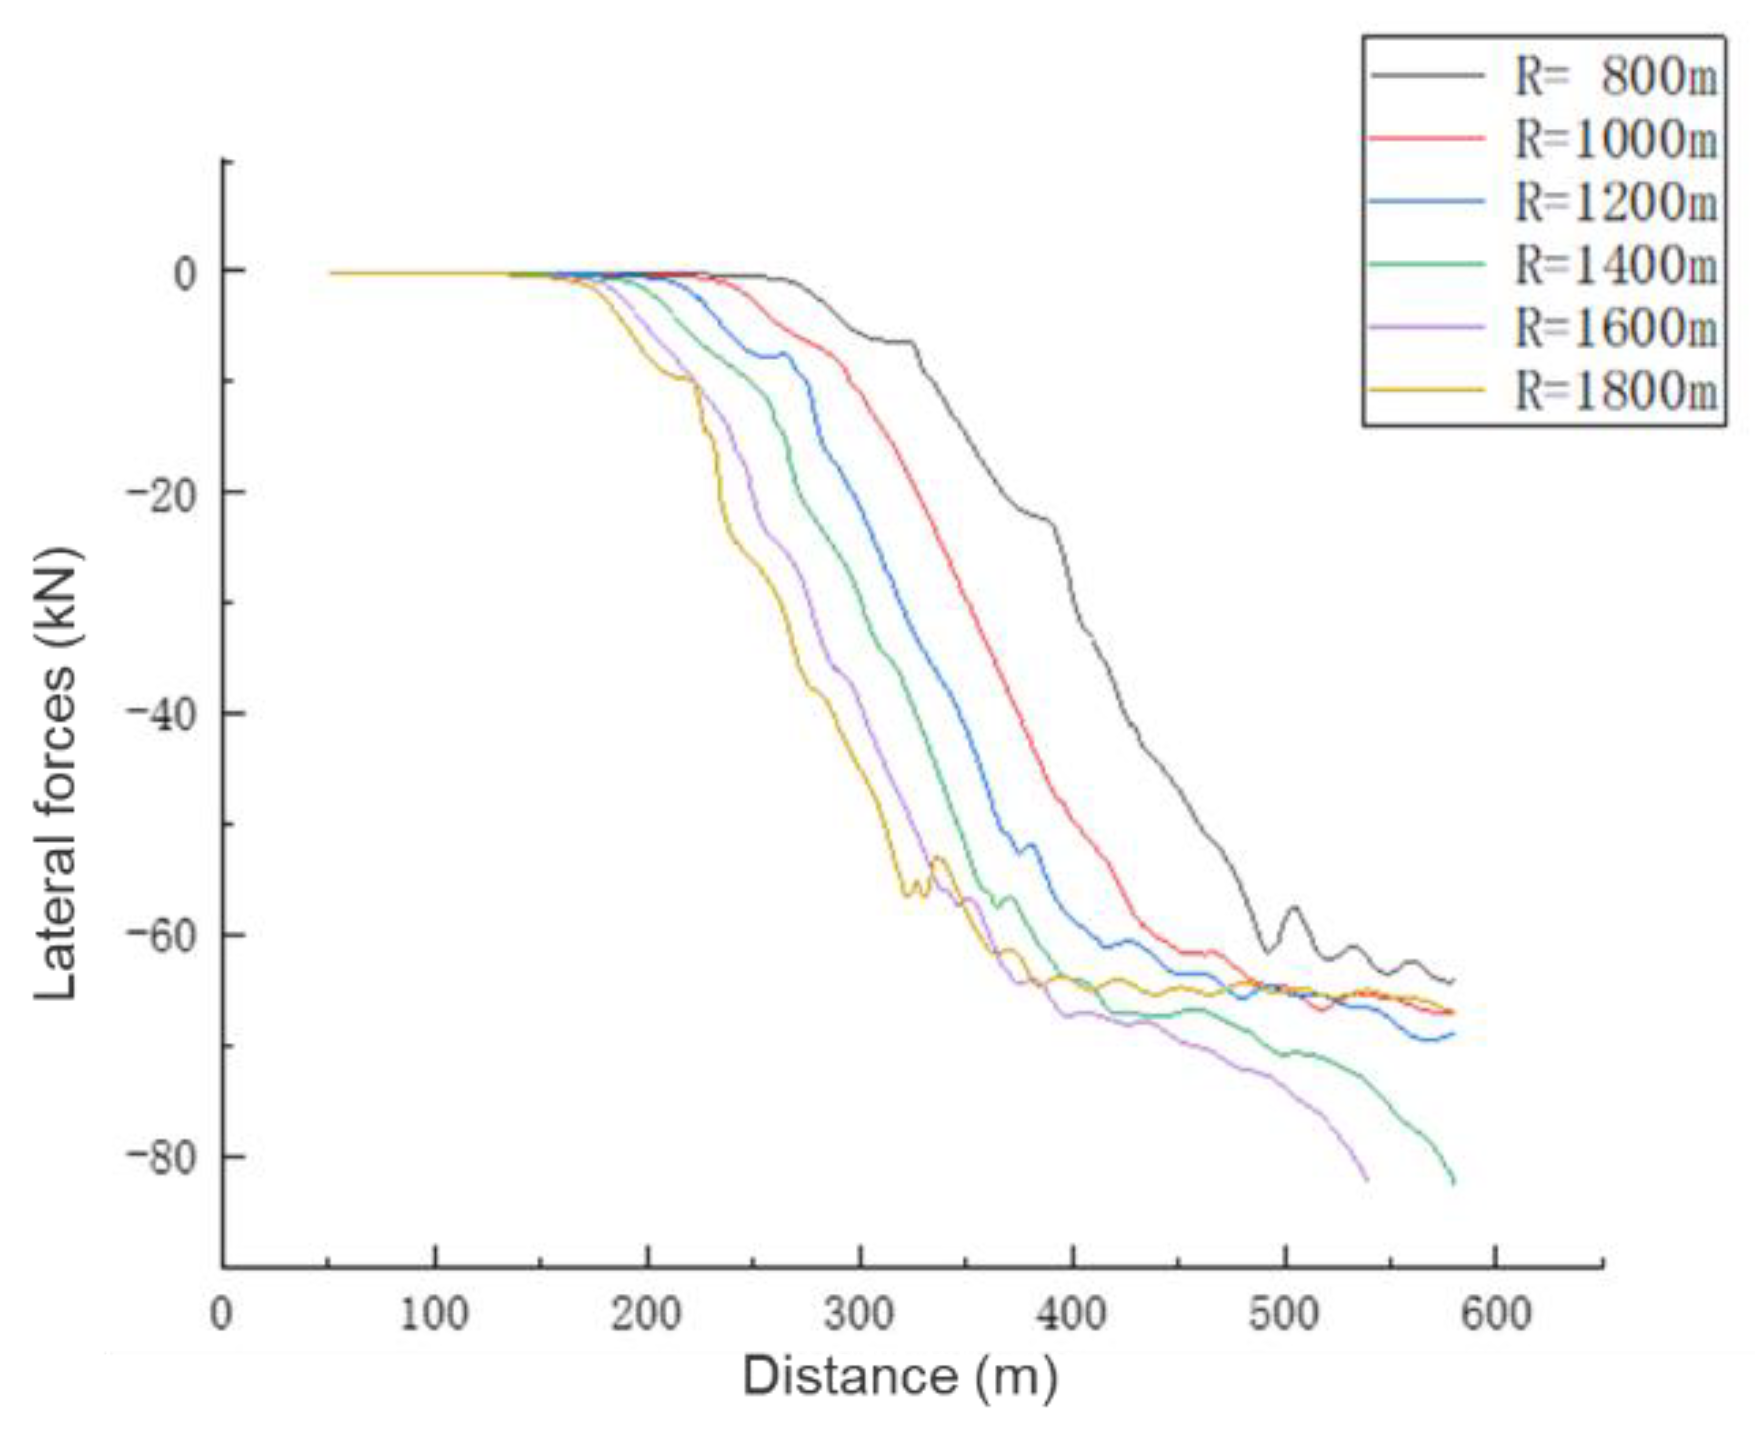
Figure 14.
Variation of vertical force at critical derailment speed.
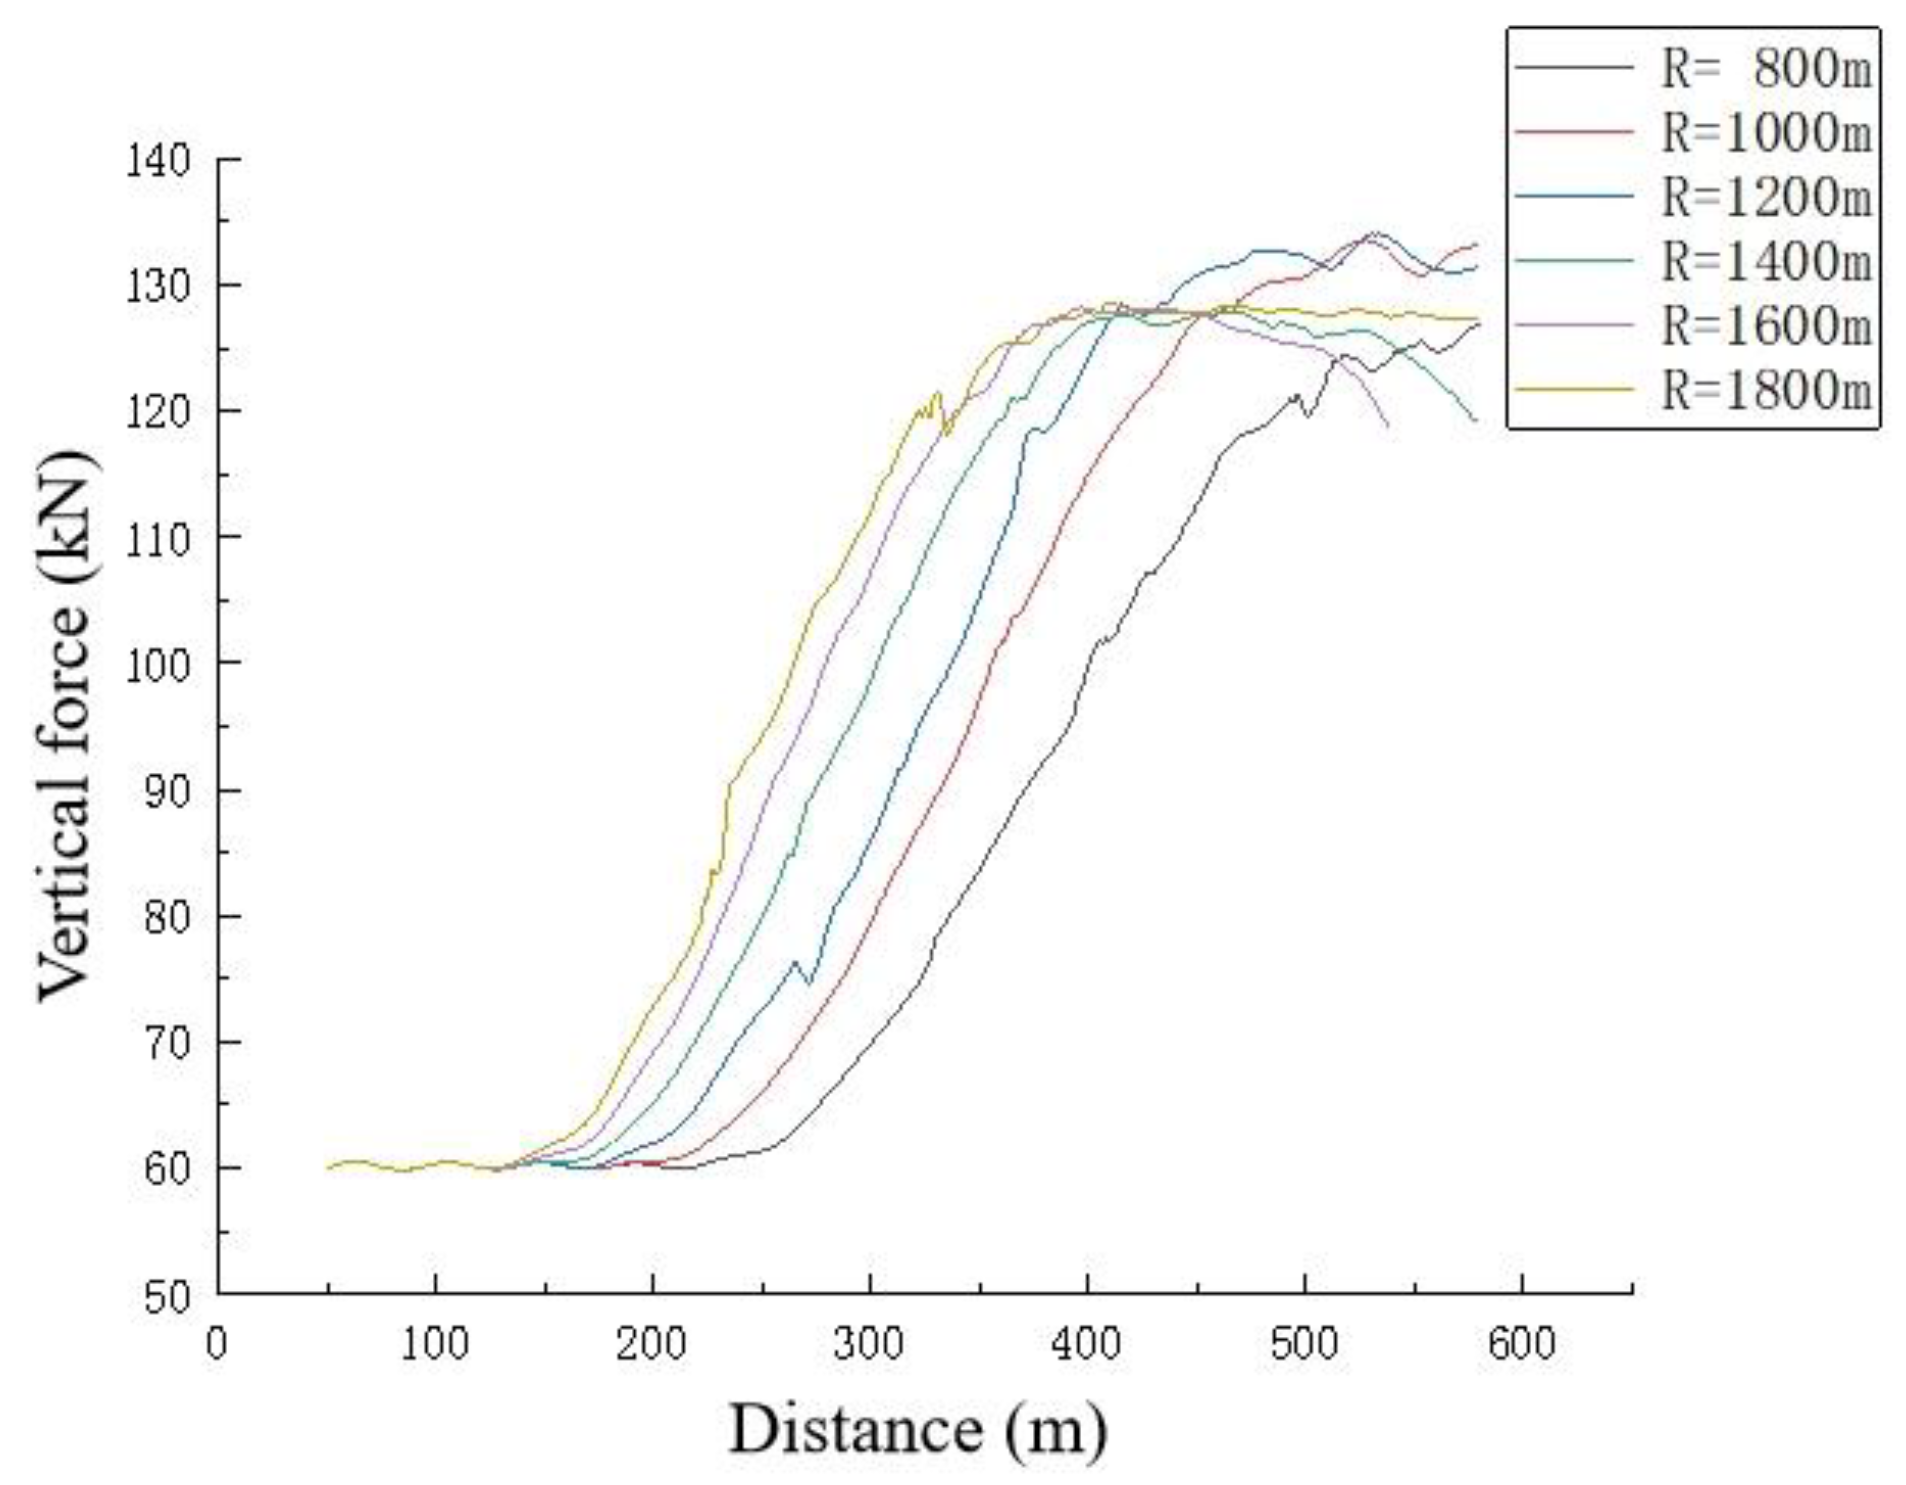
Figure 15.
Variation of derailment coefficient at critical derailment speed.

Table 1.
Vehicle–track model parameters.
| Parameters | Value | Parameters | Value |
|---|---|---|---|
| Body mass/kg | 32,000 | Vehicle distance setting/m | 17.5 |
| Frame mass/kg | 3300 | Wheelbase/m | 2.5 |
| Wheel mass/kg | 1780 | tread rolling circle radius/m | 0.46 |
| Tread surface profile | LM | Rail profile | UIC60 |
Table 2.
Track alignment parameters.
| Alignment | Length (m) | Superelevation (mm) | Curve Radius (m) |
|---|---|---|---|
| Straight | 200 | 0 | ∞ |
| Transition curve | 200 | 0~175 | ∞~R |
| Curve | 1000 | 175 | R |
| Transition curve | 200 | 175~0 | R~∞ |
| Straight | 200 | 0 | ∞ |
Table 3.
The limit cycle method and root locus method.
| Limit Cycle Method | Root Locus Method |
|---|---|
| Consider non-linear factors | Consider linear factors |
| Perform integral operation in time domain | Perform integral operation in frequency domain |
| The vehicle passes through the exciting line at a certain speed, and then runs on the smooth line to observe whether the lateral displacement of the wheelset converges. When the lateral displacement of the wheelset exceeds 0.1 mm, that is, the lateral displacement diverges, the speed at the moment is defined as the instability critical speed. | The instability speed of the vehicle is determined based on the inherent vibration frequency of each rigid body at different vehicle speeds. The minimum damping value less than 0 represents the system destabilization. |
Table 4.
Stability conditions of the equilibrium state of the train system.
| Resistance work increment > load energy increment | Stable equilibrium state |
| Resistance work increment < load energy increment | Unstable equilibrium |
| Resistance work increment = load energy increment | The equilibrium state is at the critical point of stability and instability, i.e., critical instability |
Publisher’s Note: MDPI stays neutral with regard to jurisdictional claims in published maps and institutional affiliations. |
© 2022 by the authors. Licensee MDPI, Basel, Switzerland. This article is an open access article distributed under the terms and conditions of the Creative Commons Attribution (CC BY) license (https://creativecommons.org/licenses/by/4.0/).
Share and Cite
MDPI and ACS Style
Yu, R.; Ma, H.; Zhang, J.; Niu, Y. A Method of Predicting Critical Derailment Speed and Analysis of Derailment Process. Appl. Sci. 2022, 12, 11199. https://doi.org/10.3390/app122111199
AMA Style
Yu R, Ma H, Zhang J, Niu Y. A Method of Predicting Critical Derailment Speed and Analysis of Derailment Process. Applied Sciences. 2022; 12(21):11199. https://doi.org/10.3390/app122111199
Chicago/Turabian StyleYu, Ruodan, He Ma, Jun Zhang, and Yan Niu. 2022. "A Method of Predicting Critical Derailment Speed and Analysis of Derailment Process" Applied Sciences 12, no. 21: 11199. https://doi.org/10.3390/app122111199
Note that from the first issue of 2016, this journal uses article numbers instead of page numbers. See further details here.