
Experimental and Numerical Study on UHPC–RC Decks within Hogging Moment Region
by
 ,
,
Guanxu Long
1,2,
Ruigen Zhou
3,
Haiying Ma
4,*,
Gongfeng Xin
1,2,
Seyyedbehrad Emadi
5 and
Xuefei Shi
4 1
Shandong Key Laboratory of Highway Technology and Safety Assessment, Jinan 250014, China
2
Shandong Hi-Speed Group Co., Ltd., Innovation Research Institute, Jinan 250014, China
3
Guangdong Communication Planning & Design Institute Group Co., Ltd., Guangzhou 510507, China
4
Department of Bridge Engineering, Tongji University, Shanghai 200092, China
5
Department of Civil and Building Engineering, Universitat Politècnica de Catalunya-BarcelonaTech, 08034 Barcelona, Spain
*
Author to whom correspondence should be addressed.
Appl. Sci. 2022, 12(22), 11446; https://doi.org/10.3390/app122211446
Submission received: 31 October 2022
/
Revised: 7 November 2022
/
Accepted: 9 November 2022
/
Published: 11 November 2022
(This article belongs to the Special Issue Ultra-High Performance Concrete (UHPC): Preparation, Properties and Applications)
Abstract
:Steel–concrete composite continuous bridges can take full advantage of concrete and steel, but in regions with hogging moments, cracking of the concrete deck is a big issue affecting the durability of bridges. In order to solve cracking problems within the hogging moment region, this study proposes a composite deck method using ultra-high-performance concrete (UHPC) and regular concrete (RC). In this way, the layers of UHPC and RC are composited to take advantage of the high tensile strength of UHPC materials to improve the anti-crack performance of the concrete deck within the hogging moment region. Four different specimens were designed to account for different layer thickness of UHPC. Bending experiments of the UHPC–RC composite deck were undertaken and a corresponding finite element model was established to study the behavior of the UHPC–RC composite deck. The regularity of crack development in different UHPC layer thicknesses was revealed, and the load-displacement results were compared to investigate the ultimate capacity of a steel–concrete composite bridge structure using a UHPC–RC composite deck. Finally, with consideration of material cost, a reasonable UHPC layer thickness suitable for the composite deck was obtained to provide a reference for the design of a UHPC–RC composite deck.
1. Introduction
Steel–concrete composite bridges can make use of the advantages of steel and concrete materials, and can also reduce the time of interruption for normal traffic during bridge construction (e.g., steel girders provide form support for concrete deck placement construction). Thus, they are widely used in bridge structures with small and medium spans. Since most steel–concrete composite bridges are continuous girder bridges, the concrete deck is in tension within the hogging moment region (i.e., at the top of the interior pier). Cracking of the concrete deck often occurs within the hogging moment region, which reduces the overall stiffness of the composite section and causes corrosion of the reinforcements and shear connectors in the concrete deck. Thus, the durability of the overall structure is reduced. Therefore, the most critical issue in the design of steel–concrete composite continuous bridges is to effectively inhibit the occurrence and development of cracking of the concrete deck within the hogging moment region. Many researchers have studied different ways to improve the anti-cracking capacity of the concrete deck, including pre-tension of the concrete deck and pre-jacking of the interior supports to induce shanginitial compressive stress in the concrete deck [1,2,3,4,5,6]. However, for these methods, due to the creep and shrinkage of concrete, the initial compressive stress in the concrete deck transfers to the steel girders, and concrete cracking problems occur. Research by Xu et al. [4] showed that double composite action can make concrete crack development slower and can increase the sectional stiffness but cannot avoid deck cracking. The study of crack propagation is also of importance in other engineering applications [7,8,9]. Crack propagation tests were conducted to investigate the effect using high-density polyethylene [8], and fatigue crack retardation can be obtained [9]. For steel-concrete composite bridge structures, one possible solution to this problem is to replace conventional concrete with ultrahigh-performance concrete (UHPC) for a deck that has much better tensile strength. UHPC is an advanced cement composite material with high tensile strength, which was first used in bridge engineering in 1997 and started to be applied to bridge structures in China in the 21st century [10,11].
Several researchers have investigated the behavior of steel–UHPC composite girders or decks. Zhang et al. [12] investigated the cracking resistance, flexural performance, and deformation characteristics of steel–UHPC composite beams under the hogging moment with experiments and theoretical analyses. They found that the crack resistance and flexural capacity of steel–UHPC composite beams under the hogging moment were significantly higher than those of steel–NSC composite beams, and that the development and propagation of cracks was much slower. Xiao et al. [13] conducted full-scale experiments of three steel–UHPC composite slabs and one steel–concrete composite slab to investigate the effect of the number and type of shear connectors. Cheng et al. [14] studied the flexural behavior of a composite bridge deck composed of a corrugated steel deck and a UHPC slab connected using MCL-shaped dowels. Liu et al. [15] analyzed the mechanical behavior of steel–UHPC composite slabs before ultimate loading and obtained the mechanical indexes, including the cracking and ultimate loads, using a pure bending test model. Hu et al. [16] investigated the flexural performance of steel–UHPC composite beams composed of a pre-cast UHPC slab through a large-scale and four-point bending test. Shao et al. [17] proposed three new types of steel–UHPC lightweight composite bridge girders and analyzed crack resistance and fatigue performance. Tong et al. [18] investigated the static bending performance of HSS–UHPC composite beams through experiments and finite element analysis. Liu et al. [19] conducted an experimental investigation and nonlinear finite element analysis on a UHPC slab instead of conventional concrete; their results showed that the use of a UHPC slab can enhance the cracking performance of composite beams. Wei et al. [20] experimentally studied the flexural behavior of composite slabs and beams under static and fatigue-negative moments. Ghasemi et al. [21] improved a type of ultralight steel UHPC waffle bridge deck used for movable bridges through comprehensive experimental analyses, and the size of the bridge deck and reinforcement configuration were adjusted to make its weight meet the use requirements for movable bridges. Liu et al. [22] experimentally and numerically investigated the flexural behavior of steel–UHPC–RC composite girders and found that the use of UHPC–RC composite concrete deck can save costs on materials, as well as improve the anti-cracking performance.
Some specifications provide suggestions for designing structures using UHPC. China’s design specification [23] suggests that the design of composite decks using UHPC or SHPLC follow the specifications in the General Code for Design of Highway Bridges and Culverts [24], which does not consider the material characteristics of UHPC. Switzerland’s design specification [25] highlights that UHPC has no resistance when a plastic hinge is generated; when the tension strain is over three times the elastic yield strain strength, UHPC no longer works, and all of the tension forces are carried by the rebars.
Current research and design specifications on UHPC application in bridge decks mostly focus on full-UHPC decks, with little research having been conducted on composite decks using ultra-high-performance concrete (UHPC) and regular concrete (RC). Since 2015, a large amount of steel–concrete twin-I girder bridges (Figure 1) have been constructed in China, with the advantages of lower material costs and accelerated construction [1,26]. Within the hogging moment regions, concrete deck cracking is an issue that affects the performance of bridge structures [1]. Double composite action cannot be applied to twin-I girders, since the system uses open sections, and the construction time and cost are increased to attach additional concrete on the bottom flange.
Taking the advantages of UHPC, this paper proposes a UHPC–RC composite deck and studies the anti-cracking performance of a steel–concrete composite bridge using a UHPC–RC composite deck within the hogging moment region. Four specimens were tested to investigate the behavior of the UHPC–RC composite deck. A finite element model was established to compare the test results and to investigate the behavior under different conditions. Finally, the crack development law of the UHPC–RC composite deck is summarized, and a reasonable thickness for the UHPC layer is put forward to be suitable for a UHPC–RC composite deck within the hogging moment region, which provide a reference for the design of bridge structures using a UHPC–RC composite deck
2. Stress State for Steel–Concrete Composite Girder Bridges Using an RC Deck
Currently, the main girder of steel–concrete composite twin-I girder bridges is made of steel, and a prefabricated deck or a cast-in-place concrete deck is used. However, under service conditions, a tensile stress of more than 8 MPa is produced within the hogging moment region, which is much greater than the tensile strength of regular concrete (2~3 MPa). Liu developed a parametric study on composite twin-I girder bridge systems. From the cases studied by Shi et al. [26], several typical steel–concrete composite twin-I girder bridges were selected and analyzed to obtain the stress in the concrete deck, as shown in Figure 1 and Figure 2.
The respective stress states under the short-term strength limit state and the service limit state were calculated based on JTG D60-2015 [20], as shown in Figure 1 and Figure 2. In Figure 1, the maximum tensile stress in the bridge deck is 3.5 Mpa. Within a range of 57 m from both sides of the interior support (hogging moment region), the normal tensile stress of the concrete deck under the service limit state ranged from 5 to 8 Mpa, as shown in Figure 2. Note that the analyses were conducted using a linear elastic assumption for the material.
Through the above analyses, the tensile stress of the concrete bridge deck was much greater than the tensile strength, and the concrete deck cracked. At present, the design check is generally controlled by the crack width. Although the crack width can meet the design requirements, cracking leads to internal steel-bar rust and other problems, affecting the durability of the structure due to the erosion of rainwater and other effects.
The development and application of new materials, especially the application of UHPC and other materials with high tensile strength, provides a new idea to solve the cracking problems of regular concrete decks. This paper mainly used an experimental and numerical method to analyze the anti-cracking performance of UHPC–RC composite decks in steel–concrete composite bridge systems (e.g., twin-I girder bridge system), and discusses the feasibility of its application in steel–concrete composite bridge structures.
3. Experimental Study
3.1. Design Principles
The scale specimen was designed based on the actual stress distribution of the bridge deck under the service limit state, in that the stress distribution in the specimen was similar to that in the actual concrete deck. According to Brühwiler’s research [27], when the thickness of the UHPC layer is between 25 and 40 mm, UHPC can only play a protective role to protect the concrete layer from external conditions; meanwhile, when the thickness of the UHPC layer reaches more than 40 mm, the UHPC layer can not only play a protective role, but can also be stressed together with the structure, adopting a strengthening role for the structure. Therefore, when designing a UHPC layer for a composite deck, the layer thickness should be more than 40 mm to ensure that the UHPC layer can be stressed together with the structure. In addition, since the UHPC layer can participate in the structural force, the conventional concrete layer beneath the UHPC layer can be allowed to crack to a certain extent without affecting the normal use performance of the structure under the serviceability limit state.
3.2. Parameters of Specimens
The thickness of the bridge deck of the scale specimen was 200 mm. In order to make the UHPC layer participate in the structural force, its layer thickness must be greater than 40 mm (i.e., the layer thickness ratio must be greater than 20%). Thus, three types of UHPC layer thickness ratios (UHPC layer thickness to deck thickness) were designed: 30%, 60%, and 100%. At the same time, one specimen with a bridge deck only using regular concrete (i.e., UHPC layer thickness percentage of 0) was designed. The specimens were grouped as shown in Table 1 and Figure 3a–d, respectively. Additionally, contact surfaces were roughened before pouring the UHPC, and reinforcements were arranged to prevent the slip in the contact surfaces (as shown in Figure 3) to guarantee the contact behavior between UHPC and RC.
3.3. Material
The UHPC material used in this study belongs to low strain hardening UHPC, with a Young’s modulus of 46,900 MPa and an elastic ultimate tensile strength of 6.5 MPa. The linear elastic ultimate tensile strain is 0.00014, the ultimate tensile strength is 8.8 MPa, and the corresponding ultimate tensile strain is 0.0045. The type of RC is C50, with a Young’s modulus of 34,500 MPa and an elastic ultimate tensile strength of 2.7 MPa. Note that the properties of UHPC were provided by the manufacturer that conducted material tests. The tensile stress–strain relationship of UHPC and RC is shown in Figure 4.
3.4. Load
Two concentrated line loads were applied near the midspan of the test specimen to induce a uniform bending moment, as shown in Figure 5a. The load arrangement was composed of a jack, a loading beam, and loading bearings, as shown in Figure 5b. Three loading conditions were considered during the test, including: (1) initial loading conditions with a value of 50 kN so that the concrete deck was under loads including the structure weight (steel girder and concrete deck) and the wearing surface; (2) service limit state loading conditions with a value of 150 kN so that the concrete deck was under service limit state conditions; and (3) ultimate loading conditions so that the specimen was tested to failure. In addition, cyclic loading was applied to model the variation of the load applied to the deck during the service time. When the load increased to 150 kN, it was unloaded to 50 kN and subsequently continued to be loaded to 150 kN. This was repeatedly cycled 10 times to investigate the behavior under cyclic loading to check if more cracks occurred.
3.5. Experimental Results
For specimen A, when a load of 60 kN was applied, the first cracking was observed, and cracks were obviously formed near the midspan when it was loaded up to 150 kN. During the cyclic loading, new cracks occurred near the midspan and the loading position, and the old cracks increased in width. When the load was increased to 335 kN, out-of-plane instability occurred on the upper flange of the steel girder and several transverse penetration cracks were formed in the concrete deck near the midspan, leading to bending damage of the specimen, as shown in Figure 6a. Thus, the specimen was loaded to its ultimate load capacity and failed.
Specimen B had obvious cracks at the bottom of the deck near the loading position due to construction deviations. During cyclic loading, the crack width developed only slightly due to the presence of steel fibers in the UHPC layer. When the load was increased to 160 kN, several cracks occurred in the RC layer near the midspan of the specimen (no cracks in the UHPC layer). When the load was increased to 380 kN, the concrete cracks penetrated through the whole deck at the loading position, and the steel beam was loaded to yield and the specimen failed, as shown in Figure 6b.
For specimen C, significant cracks occurred at the bottom of the deck near the loading position due to construction deviations. During cyclic loading, no obvious new cracks were found in the specimen. When the specimen was loaded to 350 kN, the width of the UHPC cracks at the loading position increased and developed into a penetration crack, while several diagonal cracks occurred in the concrete layer and penetrated the whole deck section and the specimen failed, as shown in Figure 6c.
For specimen D, when the load was increased to 220 kN, fine cracks on one side of the loading position occurred. The damage process was similar to that of specimen C, but when the load was finally increased to 405 kN, penetration cracks only occurred on one side of the concrete deck, and the development of other cracks was not obvious, as shown in Figure 6d.
When failure occurred, more cracks penetrated through the depth of the deck for specimen A. For specimens B, C, and D, only one or two cracks penetrated through the depth of the deck, while the development of other cracks was not obvious due to the high tensile strength of UHPC.
4. Finite Element Model
In order to further study the bending mechanism of the UHPC–RC composite deck, a finite element (FE) model of each specimen was established using Abaqus software, as shown in Figure 7.
4.1. Elements and Mesh
The steel bar in the model was established using truss elements. The bridge deck, main girders, and stiffener were established using three-dimensional solid elements. Different mesh sizes including 30 mm, 20mm, and 10 mm were studied, and it was found that a mesh size of 20 mm for the bridge deck was sufficient to describe where the cracks occurred and how they developed. The mesh size for the other parts was 40 mm.
4.2. Boundary Conditions
Boundary conditions were defined based on the midline of the two supports. For one support, the displacements along two directions of y and z were restrained; for the other one, the displacement along the direction y was restrained.
4.3. Material
Both RC and UHPC were simulated using the concrete damaged plasticity model, and the parameters are shown in Table 3. Q235 and HRB400 were simulated using perfectly elastic–plastic material. The effect of the shear studs was simulated using the constraint of “tie” between the steel beam and the UHPC–RC composite deck.
4.4. Load
The explicit dynamic method was used to conduct the analysis. The load was applied to the specimen by means of a displacement, and the loading was continued until the specimen failed.
5. Comparison and Analysis of Results
By comparing the crack development of the experiment and finite element analyses, as well as the load-displacement curves of the whole loading process, the damage pattern and crack development law of the UHPC–RC composite deck are summarized.
5.1. UHPC Layer Ratio of 0
5.1.1. Crack Development
For the FE analyses, when the load increases to 70 kN, cracks start to occur at the bottom of the concrete layer in the loading position. As the load continues to increase, multiple cracks occur near the midspan, while the depth of the existing cracks is deepened. Eventually, two penetration cracks form near the loading position and the model fails, as shown in Figure 8. Note that PE denotes the plastic strain in concrete, and the value is larger than 0.0001, while RC cracks and those cracks (approximately 0.05 mm wide) are created in the concrete. The crack development in the finite element model analyses is similar to that in specimen A.
5.1.2. Load-Displacement Curve
Figure 9 presents the load-displacement for specimen A from the FE and experimental analyses. As the load increases, specimen cracks occur continuously, and the overall stiffness of the specimen gradually decreases. When the two main cracks near the midspan form, the overall stiffness of the specimen tends to be stable. When the load increases to 300 kN, the stiffness of the specimen decreases rapidly, and finally, damage occurs. The FE analysis results agree well with the experimental results.
5.2. UHPC Layer Ratio of 0.3
5.2.1. Crack Development
Initial cracks existed in the UHPC layer in the specimen near the midspan due to construction deviations, and they were included in the FE analyses. When the load increases to 60 kN, cracks start to occur at the bottom of the RC layer in the loading position. As the load continues to increase, multiple cracks occur near the midspan, while the depth of the existing cracks continues to deepen. Eventually, two penetration cracks occur near the loading position and the model fails, as shown in Figure 10. The crack development from the FE analyses is similar to that of the experimental results for specimen B, as discussed in Section 3.4.
5.2.2. Load-Displacement Curve
Figure 11 presents the load-displacement curve for the deck with a UHPC layer ratio of 0.3 from the FE analyses and the experimental results. As the load increases, the specimen keeps cracking, and the overall stiffness of the specimen gradually decreases. When the two main cracks near the midspan are formed, the overall stiffness of the specimen tends to be stable. When the load increases to 320 kN, the stiffness of the specimen decreases rapidly, and finally, damage occurs. Before loading up to 200 kN, the FE results agree well with the experimental results. The FE analyses results have a smaller capacity than the experimental results, but the differences are not substantial.
5.3. UHPC Layer Ratio of 0.6
5.3.1. Crack Development
Initial cracks existed in the UHPC layer near the midspan due to construction deviations, which were included in the FE analyses. For the FE analyses, when the load increases to 50 kN, cracks start to occur at the bottom of the RC layer in the loading position. As the load continues to increase, multiple cracks occur near the midspan, while the depth of the existing cracks continues to deepen. Eventually, two penetration cracks occur near the loading positions, which leads to a failure of the model, as shown in Figure 12. The crack development process in the FE analyses is similar to that in the experimental analyses.
5.3.2. Load-Displacement Curve
Figure 13 presents the load-displacement curve for the deck with a UHPC layer ratio of 0.6. For the FE analyses, as the load increases, the model keeps cracking, and the overall stiffness gradually decreases. When the two main cracks near the midspan are formed, the overall stiffness tends to be stable. When the load increases to 330 kN, the stiffness of the specimen decreases rapidly, and finally, failure occurs. The whole process of crack development is similar between the FE and experimental analyses.
5.4. UHPC Layer Ratio of 1.0
5.4.1. Crack Development
For FE analyses with a UHPC layer ratio of 1.0, when the load increase to 180 kN, cracks begin to occur at the bottom of the concrete layer in the loading position. As the load continues to increase, multiple cracks occur near the midspan, while the depth of the existing cracks continues to increase. Eventually, two penetration cracks occur near the loading position, as shown in Figure 14. The whole process of crack development is similar between the FE and experimental analyses.
5.4.2. Load-Displacement Curve
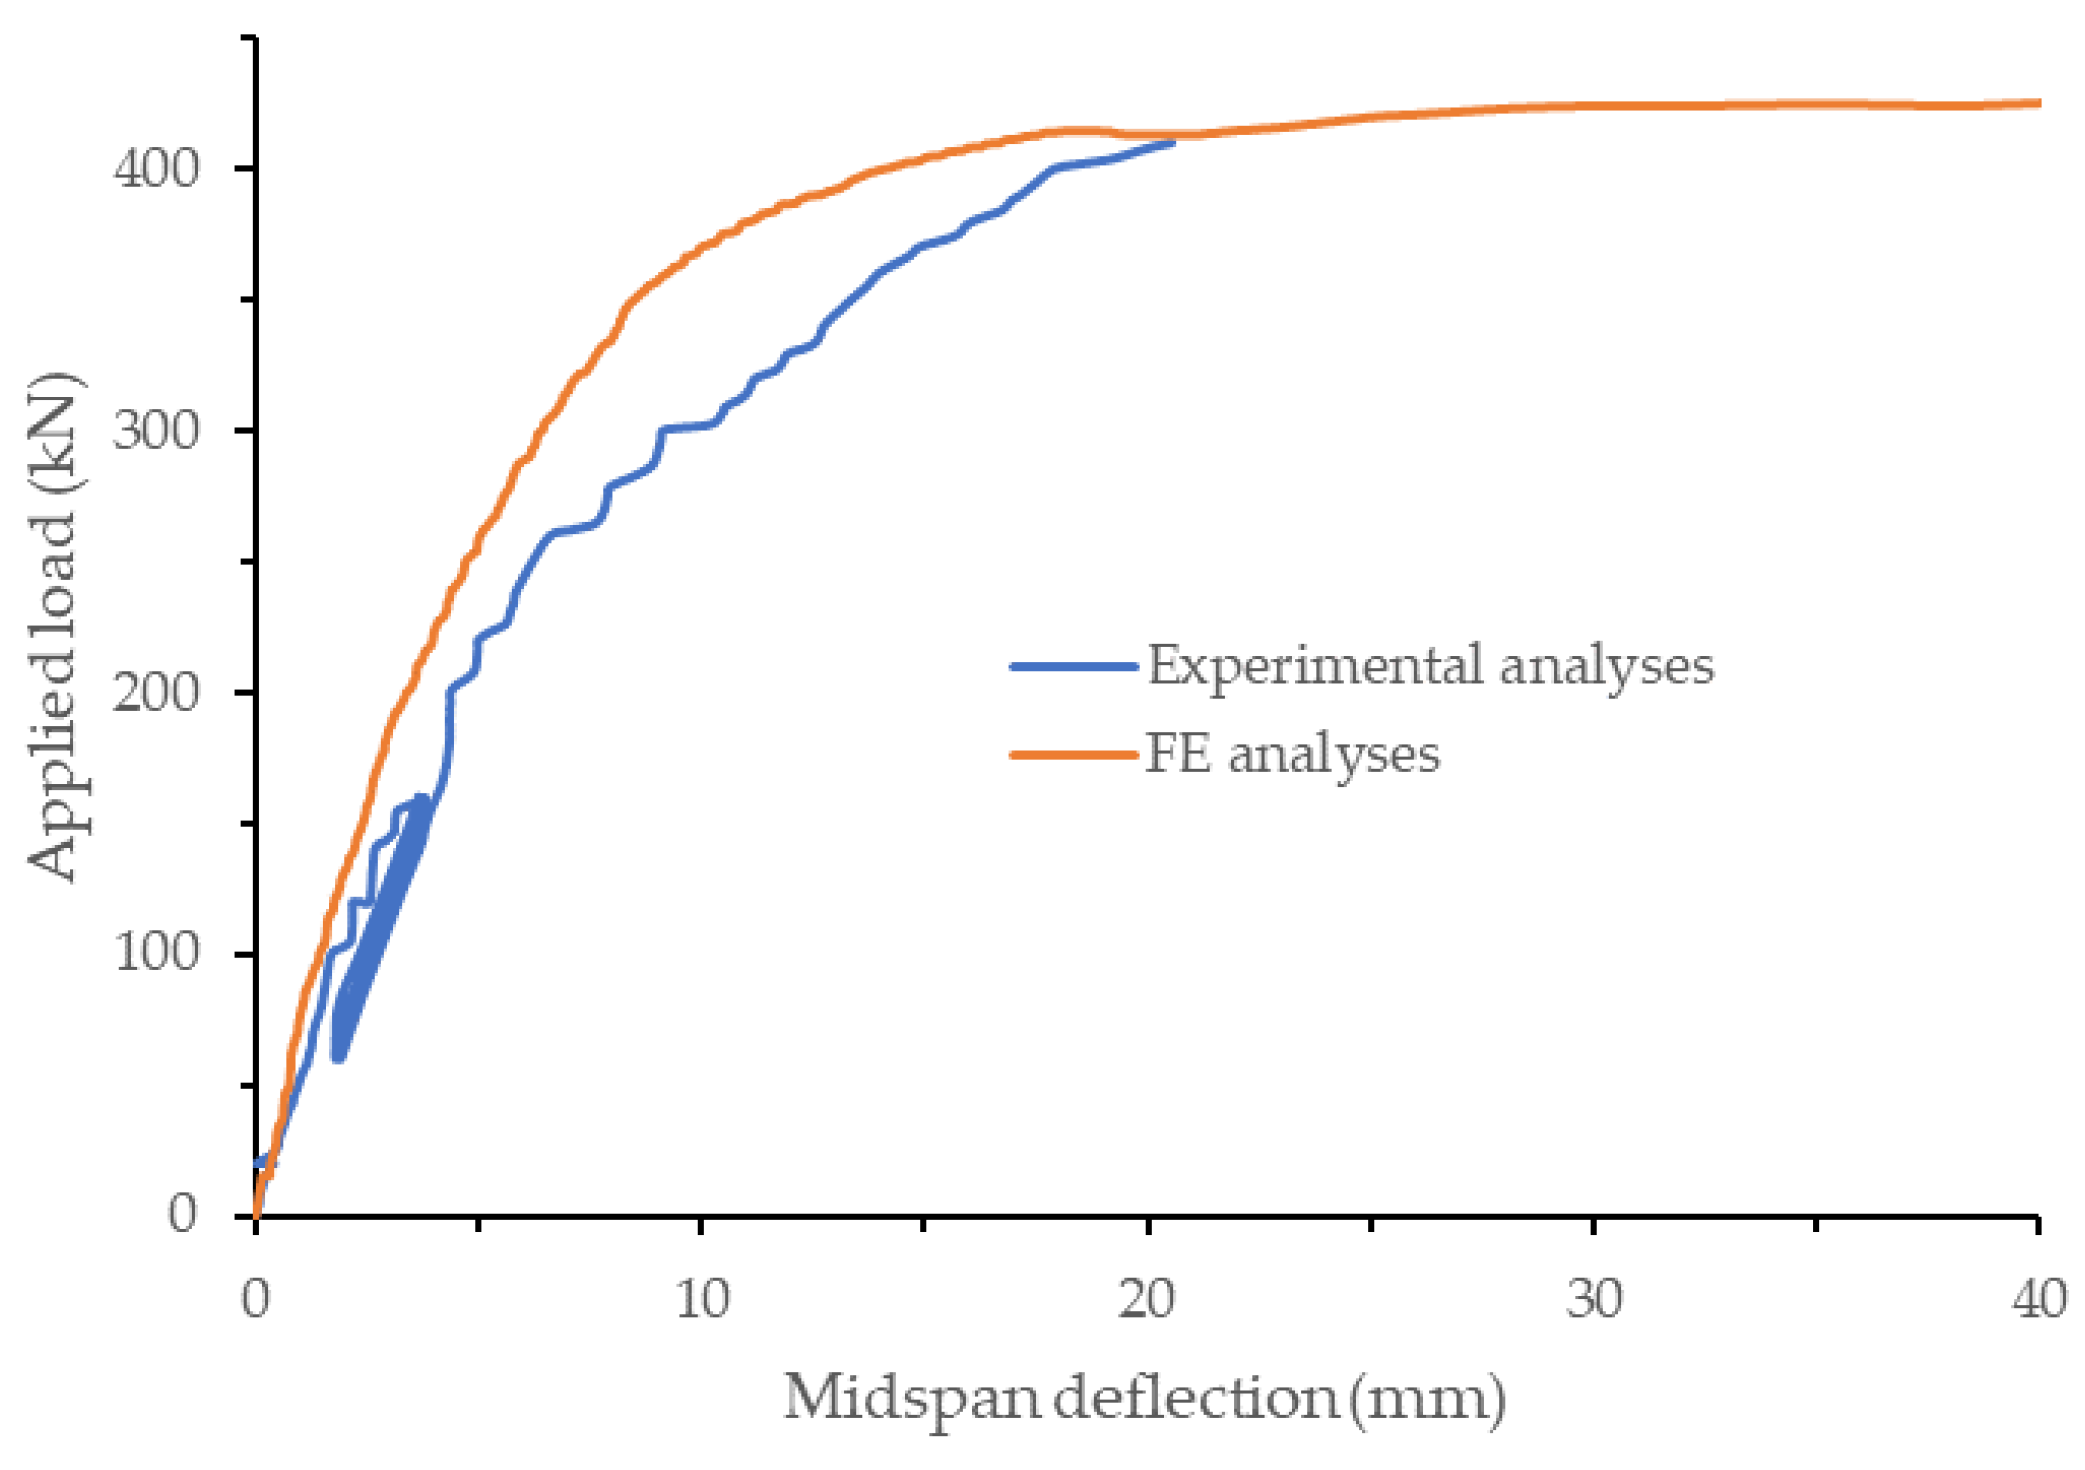
Figure 15 presents the load-displacement curve for a UHPC layer ratio of 1.0. With the increase in load, cracks occur gradually, but the overall stiffness of the specimens does not change much after cracking. When the load increases to 360 kN, the stiffness of the specimen decreases rapidly, and finally, failure occurs. After loading up to 200 kN, the FE analyses results are bigger than the experimental results, and a possible reason is that cracks might exist in the specimen due to construction. Both the FE and experimental analyses results demonstrate similar ultimate capacity.
From the experimental and FE results, the UHPC–RC composite deck can improve the cracking resistance and can be used in the hogging moment region to reduce or avoid cracks during service time. Compared to the method of Ma et al. [1], which induces compressive stress in concrete but has a loss due to concrete creep, this method does not require any prestressed tendons and simplifies the deck construction process.
6. Conclusions
Through experimental and FE analyses of UHPC–RC composite decks with different UHPC layer thicknesses for steel–concrete composite bridge structures, the main conclusions are summarized as follows:
- (1)
- A UHPC–RC composite deck can effectively increase the anti-cracking capacity of steel–concrete girder bridges within the hogging moment region.
- (2)
- With increasing UHPC layer thickness, the anti-cracking capacity of bridge decks gets better; with economic cost consideration, the UHPC layer ratio of the bridge deck can be taken as 0.3.
- (3)
- The developed FE models could reasonably predict the behavior of the four specimens, and they can be used to design UHPC–RC composite decks of steel–concrete composite bridge structures.
These tests were focused on the observation of cracking on the deck surface. Further study needs to focus on the inner cracks in the RC layer and crack width development. In addition, it was found that the construction process has some effect on the behavior of UHPC–RC composite decks during the test. Further study is needed on the construction process, details of the connection between the UHPC and RC layers, and shrinkage and creep of UHPC and RC.
Author Contributions
Conceptualization, H.M., G.L. and X.S.; methodology, R.Z., G.X. and S.E.; software, R.Z. and S.E.; validation, H.M., G.L. and R.Z.; formal analysis, G.L. and R.Z.; investigation, G.L., H.M. and R.Z.; resources, H.M., G.L. and X.S.; data curation, R.Z., G.X. and S.E.; writing—original draft preparation, H.M., G.L. and R.Z.; writing—review and editing, H.M., G.L., R.Z. and S.E.; visualization, R.Z.; supervision, H.M., G.L. and X.S.; project administration, G.L. and H.M.; funding acquisition, G.L. and H.M. All authors have read and agreed to the published version of the manuscript.
Funding
The Open Project of Shandong Key Laboratory of Highway Technology and Safety Assessment (SH202001).
Institutional Review Board Statement
Not applicable.
Informed Consent Statement
Not applicable.
Data Availability Statement
Not applicable.
Conflicts of Interest
The authors declare no conflict of interest.
References
- Ma, H.; Shi, X.; Zhang, Y. Long-Term Behaviour of Precast Concrete Deck Using Longitudinal Prestressed Tendons in Composite I-Girder Bridges. Appl. Sci. 2018, 8, 2598. [Google Scholar] [CrossRef]
- Hällmark, R.; Collin, P.; Möller, M. The Behaviour of a Prefabricated Composite Bridge with Dry Deck Joints. Struct. Eng. Int. 2013, 23, 47–54. [Google Scholar] [CrossRef]
- Yan, L.; Jia, X.J.; Lu, Z.F.; Deng, X.G. Crack resistance measure for steel-concrete composite continuous girder bridge in negative bending area. World Build. Mater. 2018, 39, 47–51. [Google Scholar]
- Xu, C.; Su, Q.; Wu, C.; Sugiura, K. Experimental study on double composite action in the negative flexural region of two-span continuous composite box girder. J. Constr. Steel Res. 2011, 67, 1636–1648. [Google Scholar] [CrossRef]
- Hajdin, N. Einige Beispiele der Kombination von Stahl und Beton im Brückenbau. Schweiz. Ing. Archit. 1985, 103, 37–39. [Google Scholar] [CrossRef]
- Larena, J.B.; Larena, A.B. Beitrag zur Entwicklung der Querschnittsgestaltung im Verbundbrückenbau. Stahlbau 2011, 80, 185–197. [Google Scholar] [CrossRef]
- Elsheikh, A. Bistable Morphing Composites for Energy-Harvesting Applications. Polymers 2022, 14, 1893. [Google Scholar] [CrossRef]
- Kamal, A.; Elsheikh, A.H.; Showaib, E. Development of Fatigue Machine to Accommodate the Application of Overloads During Fatigue Crack Propagation Tests of Polymeric Materials. J. Fail. Anal. Prev. 2022, 22, 510–518. [Google Scholar] [CrossRef]
- Kamal, A.; Showaib, E.; Elsheikh, A. Effect of single-period overload parameters on fatigue crack retardation for high-density polyethylene. Theor. Appl. Fract. Mech. 2022, 118, 103249. [Google Scholar] [CrossRef]
- Zhou, M.; Lu, W.; Song, J.; Lee, G.C. Application of Ultra-High Performance Concrete in bridge engineering. Constr. Build. Mater. 2018, 186, 1256–1267. [Google Scholar] [CrossRef]
- Azmee, N.M.; Shafiq, N. Ultra-high performance concrete: From fundamental to applications. Case Stud. Constr. Mater. 2018, 9, e00197. [Google Scholar] [CrossRef]
- Zhang, Y.; Cai, S.; Zhu, Y.; Fan, L.; Shao, X. Flexural responses of steel-UHPC composite beams under hogging moment. Eng. Struct. 2020, 206, 110134. [Google Scholar] [CrossRef]
- Xiao, J.-L.; Zhou, M.; Nie, J.-G.; Yang, T.-Y.; Fan, J.-S. Flexural behavior of steel-UHPC composite slabs with perfobond rib shear connectors. Eng. Struct. 2021, 245, 112912. [Google Scholar] [CrossRef]
- Cheng, Z.; Zhang, Q.; Bao, Y.; Deng, P.; Wei, C.; Li, M. Flexural behavior of corrugated steel-UHPC composite bridge decks. Eng. Struct. 2021, 246, 113066. [Google Scholar] [CrossRef]
- Liu, X.-Y. Experimental study on bending resistance of steel-UHPC composite slabs. IOP Conf. Ser. Earth Environ. Sci. 2021, 787, 012041. [Google Scholar] [CrossRef]
- Hu, Y.; Meloni, M.; Cheng, Z.; Wang, J.; Xiu, H. Flexural performance of steel-UHPC composite beams with shear pockets. Structures 2020, 27, 570–582. [Google Scholar] [CrossRef]
- Shao, X.; Deng, L.; Cao, J. Innovative steel-UHPC composite bridge girders for long-span bridges. IABSE Symp. Rep. 2016, 106, 614–622. [Google Scholar] [CrossRef]
- Tong, L.; Chen, L.; Wang, X.; Zhu, J.; Shao, X.; Zhao, Z. Experiment and finite element analysis of bending behavior of high strength steel-UHPC composite beams. Eng. Struct. 2022, 266, 114594. [Google Scholar] [CrossRef]
- Liu, X.; Zhang, J.; Cheng, Z.; Ye, M. Experimental and Numerical Studies on the Negative Flexural Behavior of Steel-UHPC Composite Beams. Adv. Civ. Eng. 2021, 2021, 8828175. [Google Scholar] [CrossRef]
- Wei, C.; Zhang, Q.; Yang, Z.; Li, M.; Cheng, Z.; Bao, Y. Flexural cracking behavior of reinforced UHPC overlay in composite bridge deck with orthotropic steel deck under static and fatigue loads. Eng. Struct. 2022, 265, 114537. [Google Scholar] [CrossRef]
- Ghasemi, S.; Zohrevand, P.; Mirmiran, A.; Xiao, Y.; Mackie, K. A super lightweight UHPC–HSS deck panel for movable bridges. Eng. Struct. 2016, 113, 186–193. [Google Scholar] [CrossRef]
- Liu, J.; Lai, Z.; Chen, B.; Xu, S. Experimental behavior and analysis of steel-laminated concrete (RC and UHPC) composite girders. Eng. Struct. 2020, 225, 111240. [Google Scholar] [CrossRef]
- Department of Transportation of Guangdong Province. Technical Specification for Ultra-High Performance Light-Weighted Composite Deck Structure; China Communications Press: Beijing, China, 2015. [Google Scholar]
- CCCC Highway Consultants Co., Ltd. General Code for Design of Highway Bridges and Culverts: JTG D60-2015; China Communications Press: Beijing, China, 2015. [Google Scholar]
- Swiss Society of Architects and Engineers. UHPFRC-Materials Design and Construction: SIA 2052; Swiss Federal Institute of Technology in Lausanne: Lausanne, Switzerland, 2016. [Google Scholar]
- Shi, X.F.; Ma, H.Y.; Liu, C. Parametric Study and Optimization on Behaviour of Twin-I girder Composite Bridges. J. Tongji Univ. (Nat. Sci.) 2018, 46, 444–451. (In Chinese) [Google Scholar] [CrossRef]
- Brühwiler, E.; Denarié, E. Rehabilitation and Strengthening of Concrete Structures Using Ultra-High Performance Fibre Reinforced Concrete. Struct. Eng. Int. 2013, 23, 450–457. [Google Scholar] [CrossRef]
- China Metallurgical Information and Standardization Institute. Dimension, Shape, Weight and Tolerances for Hot-Rolled Steel Plates and Sheets: GB/T 709-2019; Standards Press of China: Beijing, China, 2019. [Google Scholar]
- National Standardization Administration of China. Steel for the Reinforcement of Concrete-Part 2: Hot Rolled Ribbed Bars: GB/T 1499.2-2018; Standards Press of China: Beijing, China, 2018. [Google Scholar]
Figure 1.
Stress distribution in the concrete deck under the short-term strength limit state (unit: Pa).
Figure 1.
Stress distribution in the concrete deck under the short-term strength limit state (unit: Pa).

Figure 2.
Stress distribution in the concrete deck under the service limit state (unit: Pa).
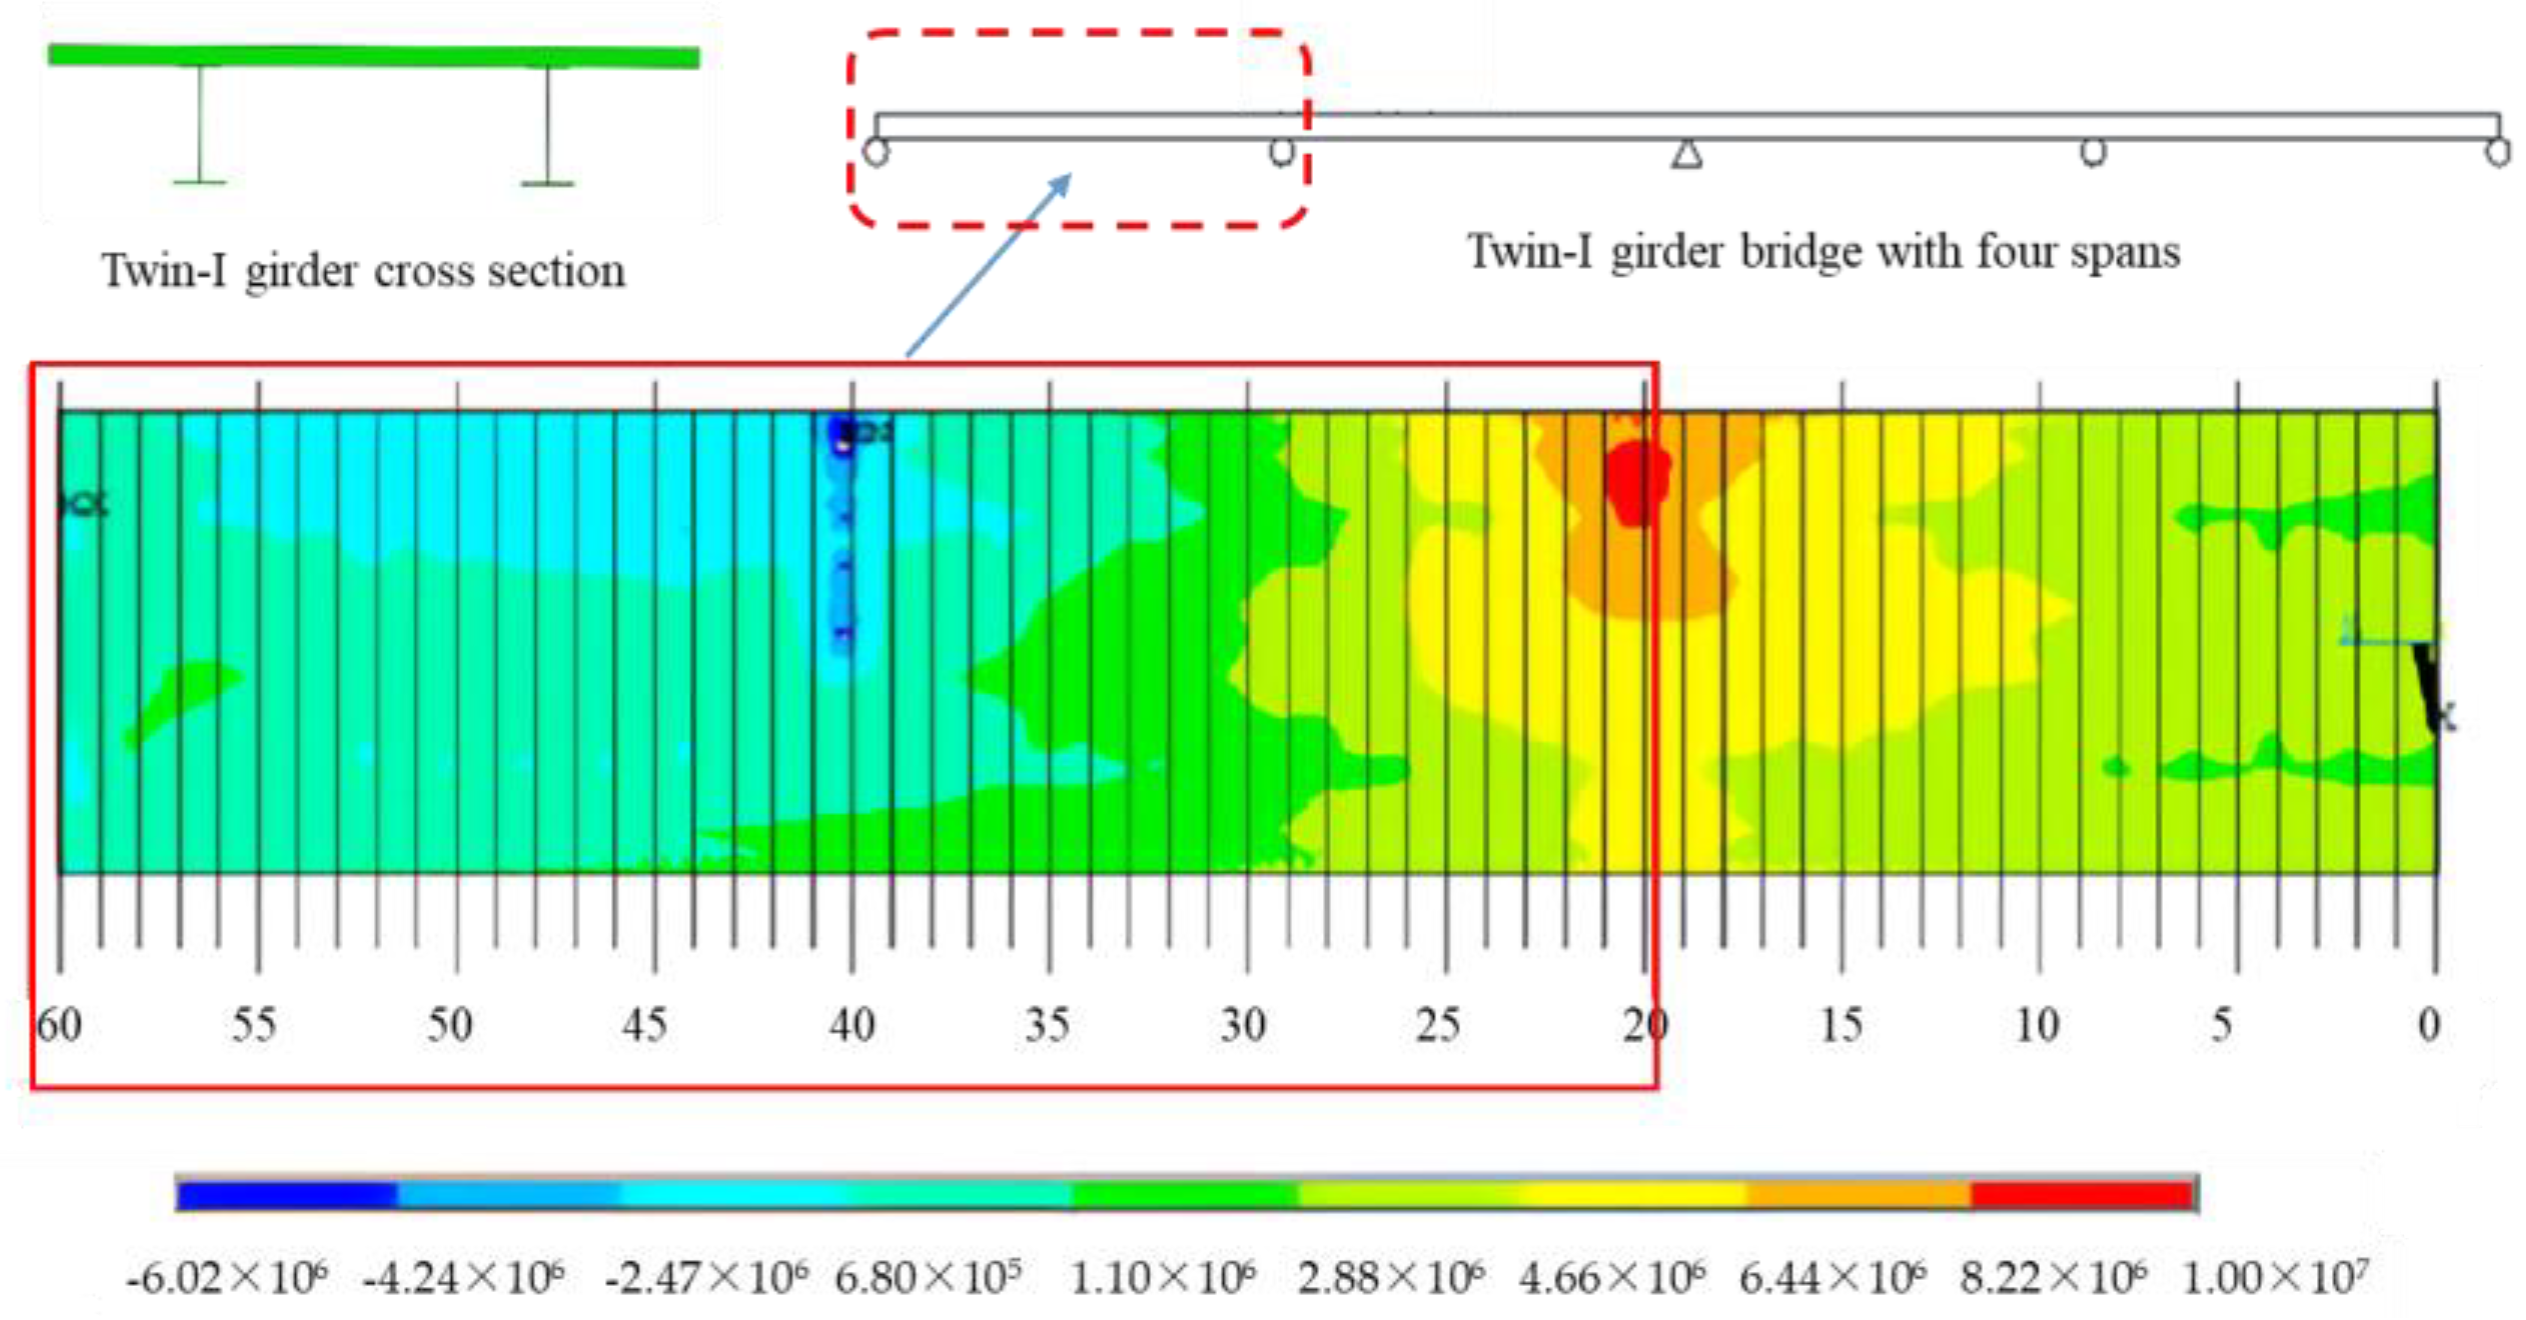
Figure 3.
Detailed dimensions of the specimens (unit: mm): (a) detailed dimensions of specimen A; (b) detailed dimensions of specimen B; (c) detailed dimensions of specimen C; (d) detailed dimensions of specimen D.
Figure 3.
Detailed dimensions of the specimens (unit: mm): (a) detailed dimensions of specimen A; (b) detailed dimensions of specimen B; (c) detailed dimensions of specimen C; (d) detailed dimensions of specimen D.

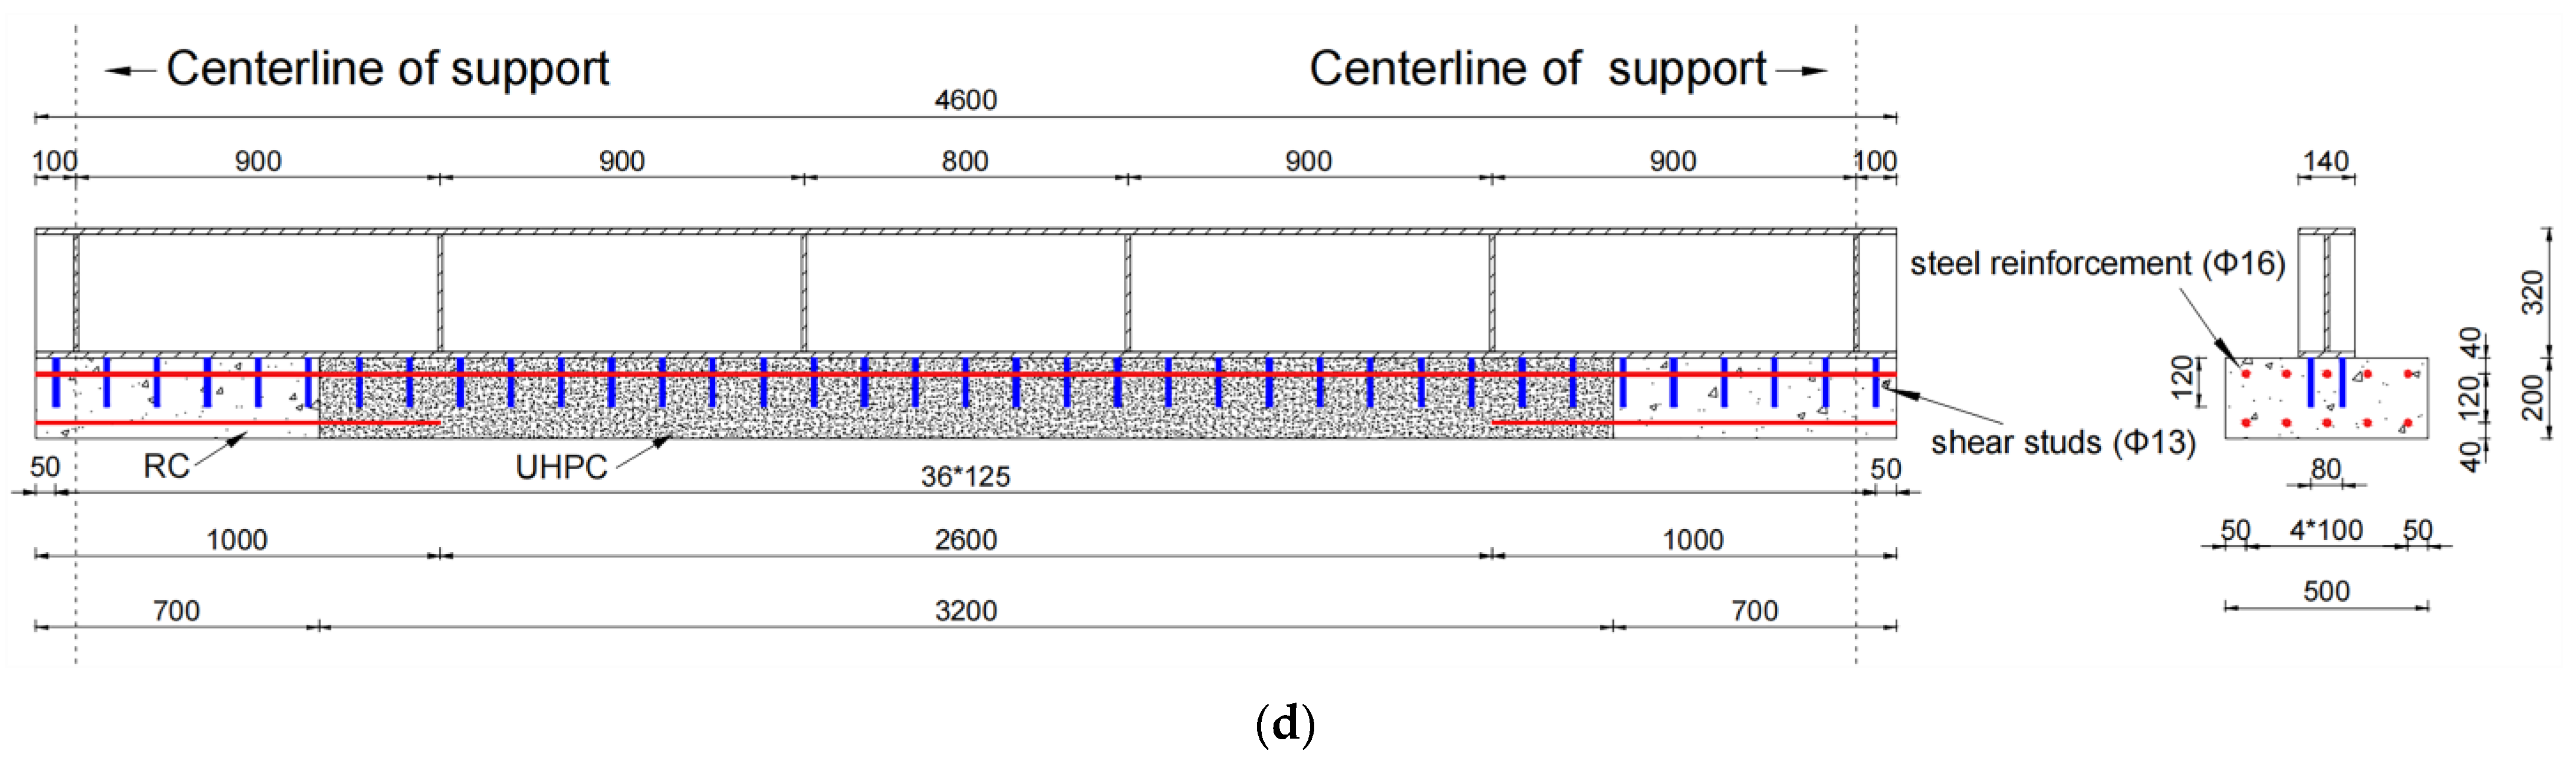
Figure 4.
Tensile stress–strain relationships: (a) tensile stress–strain relationship of UHPC; (b) tensile stress–strain relationship of RC.
Figure 4.
Tensile stress–strain relationships: (a) tensile stress–strain relationship of UHPC; (b) tensile stress–strain relationship of RC.
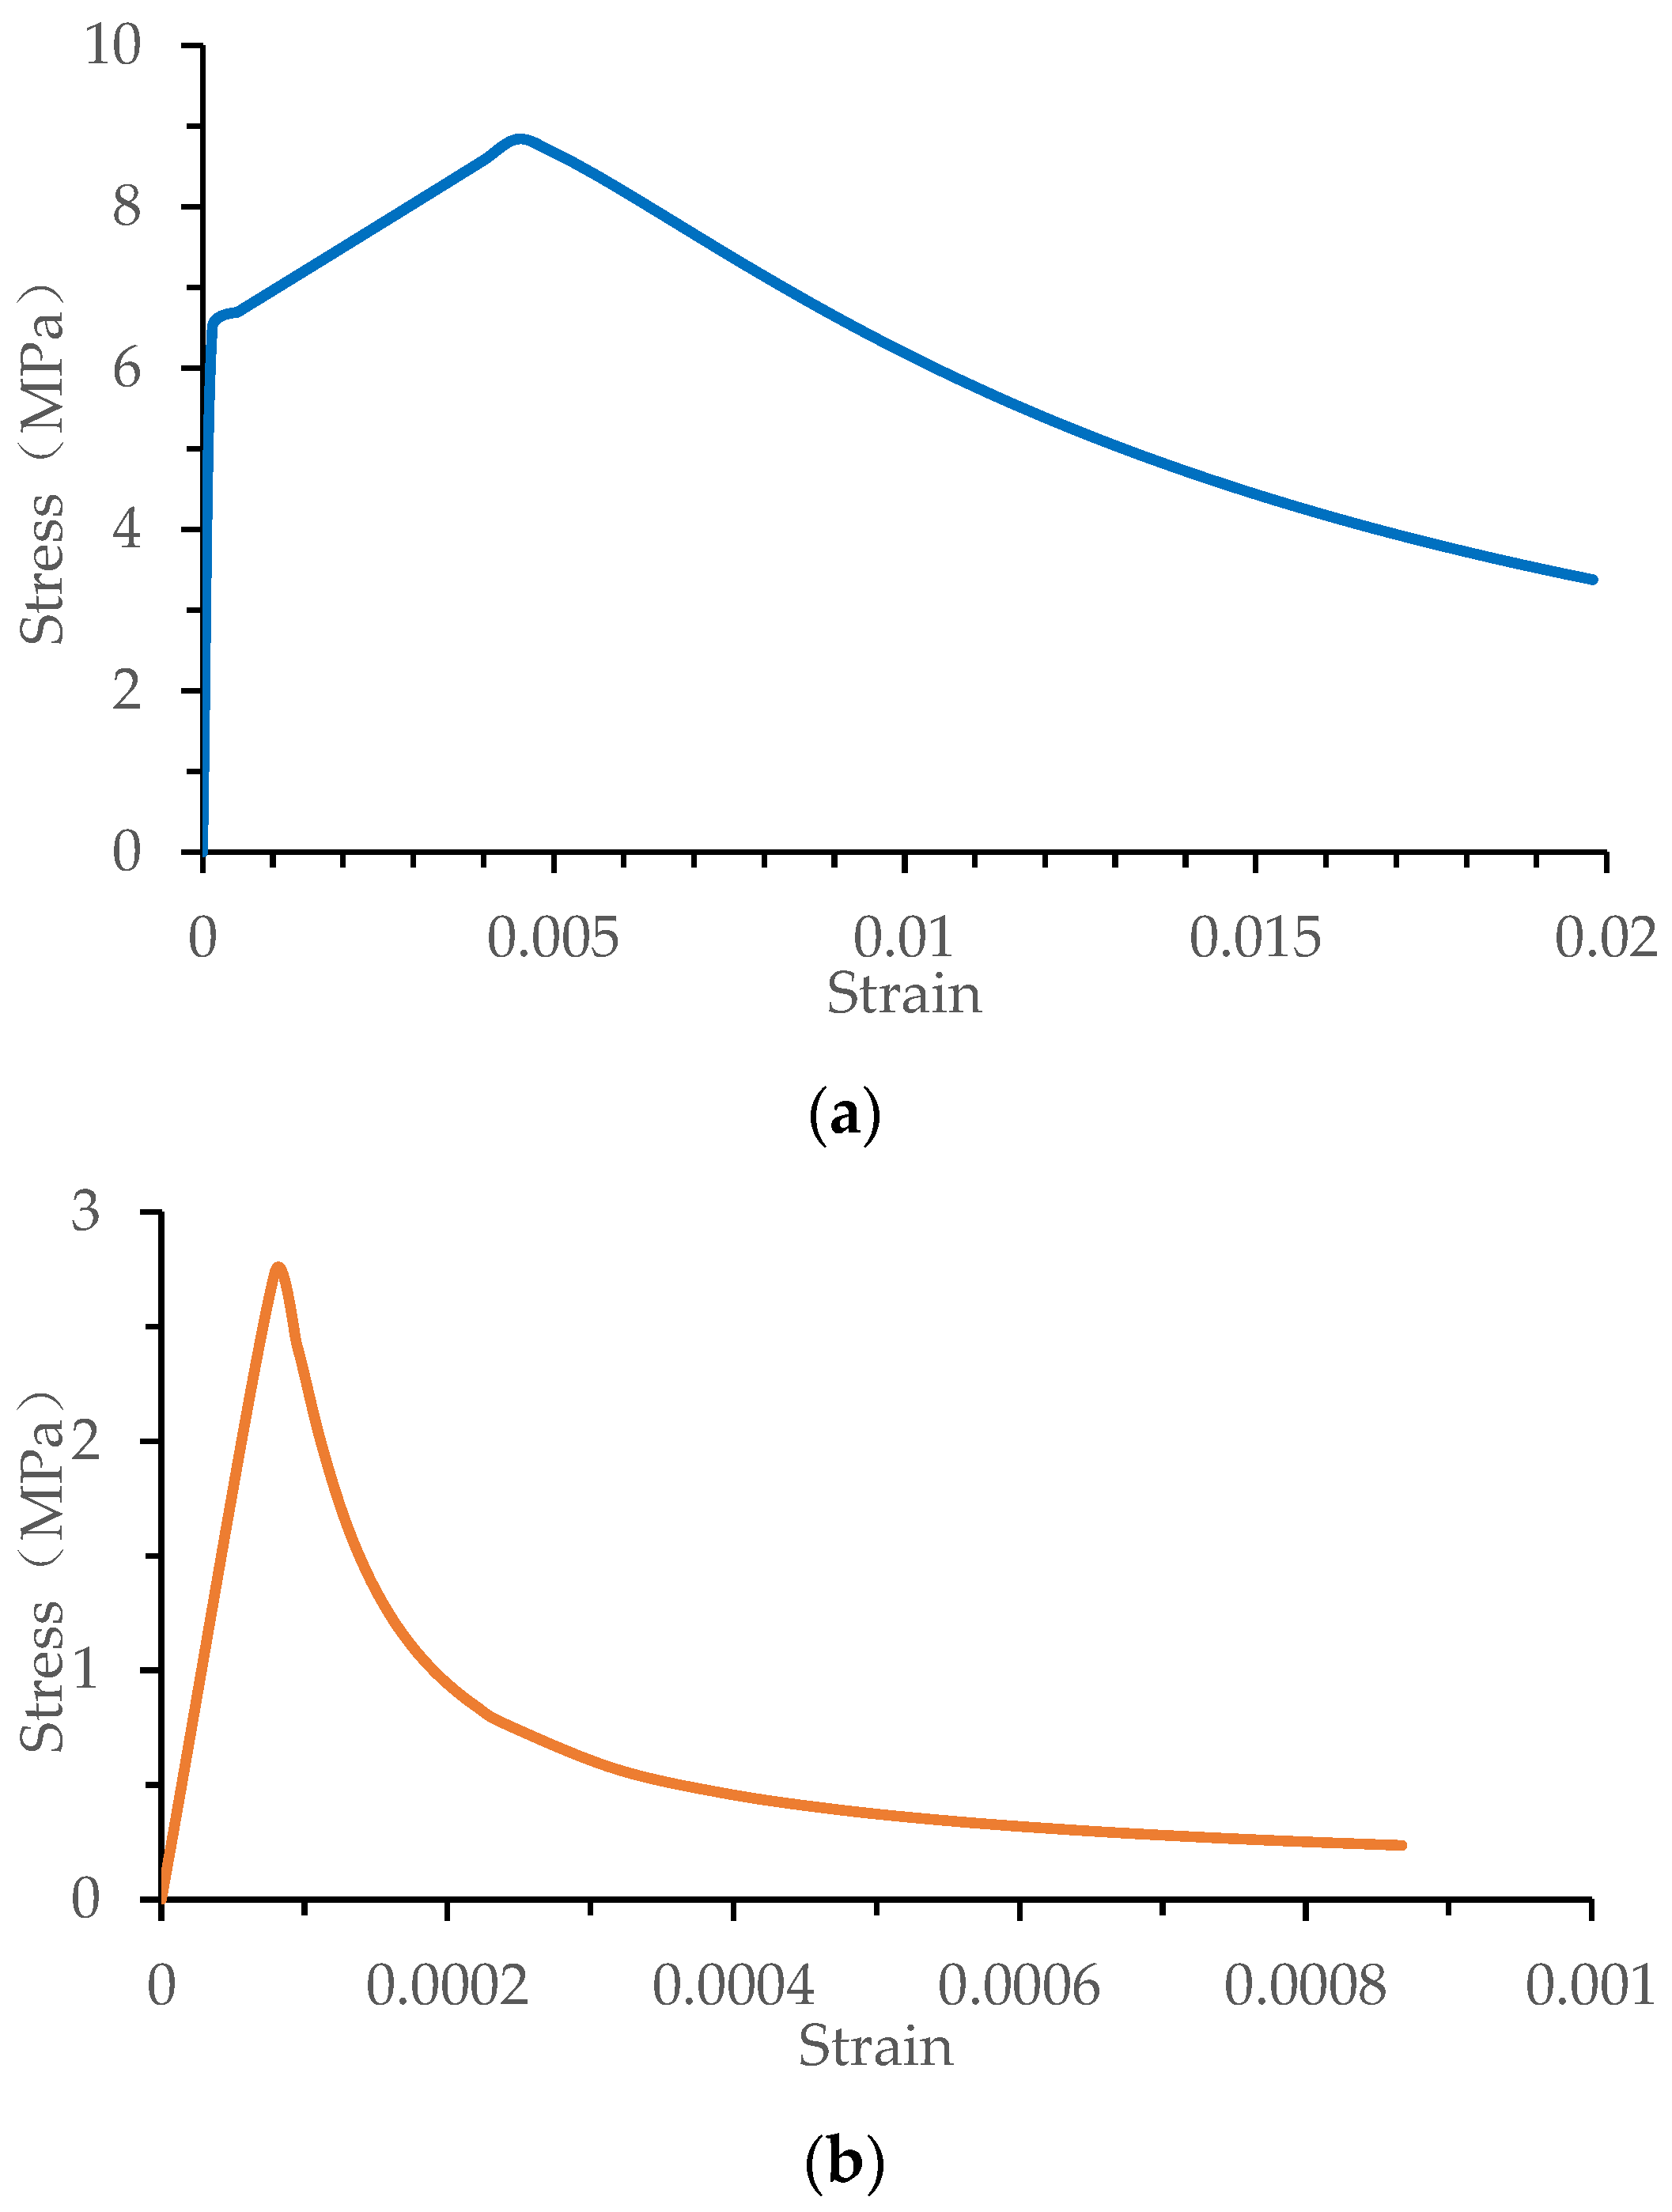
Figure 5.
Loading arrangement: (a) loading positions along the specimen length; (b) loading arrangement of the test.
Figure 5.
Loading arrangement: (a) loading positions along the specimen length; (b) loading arrangement of the test.
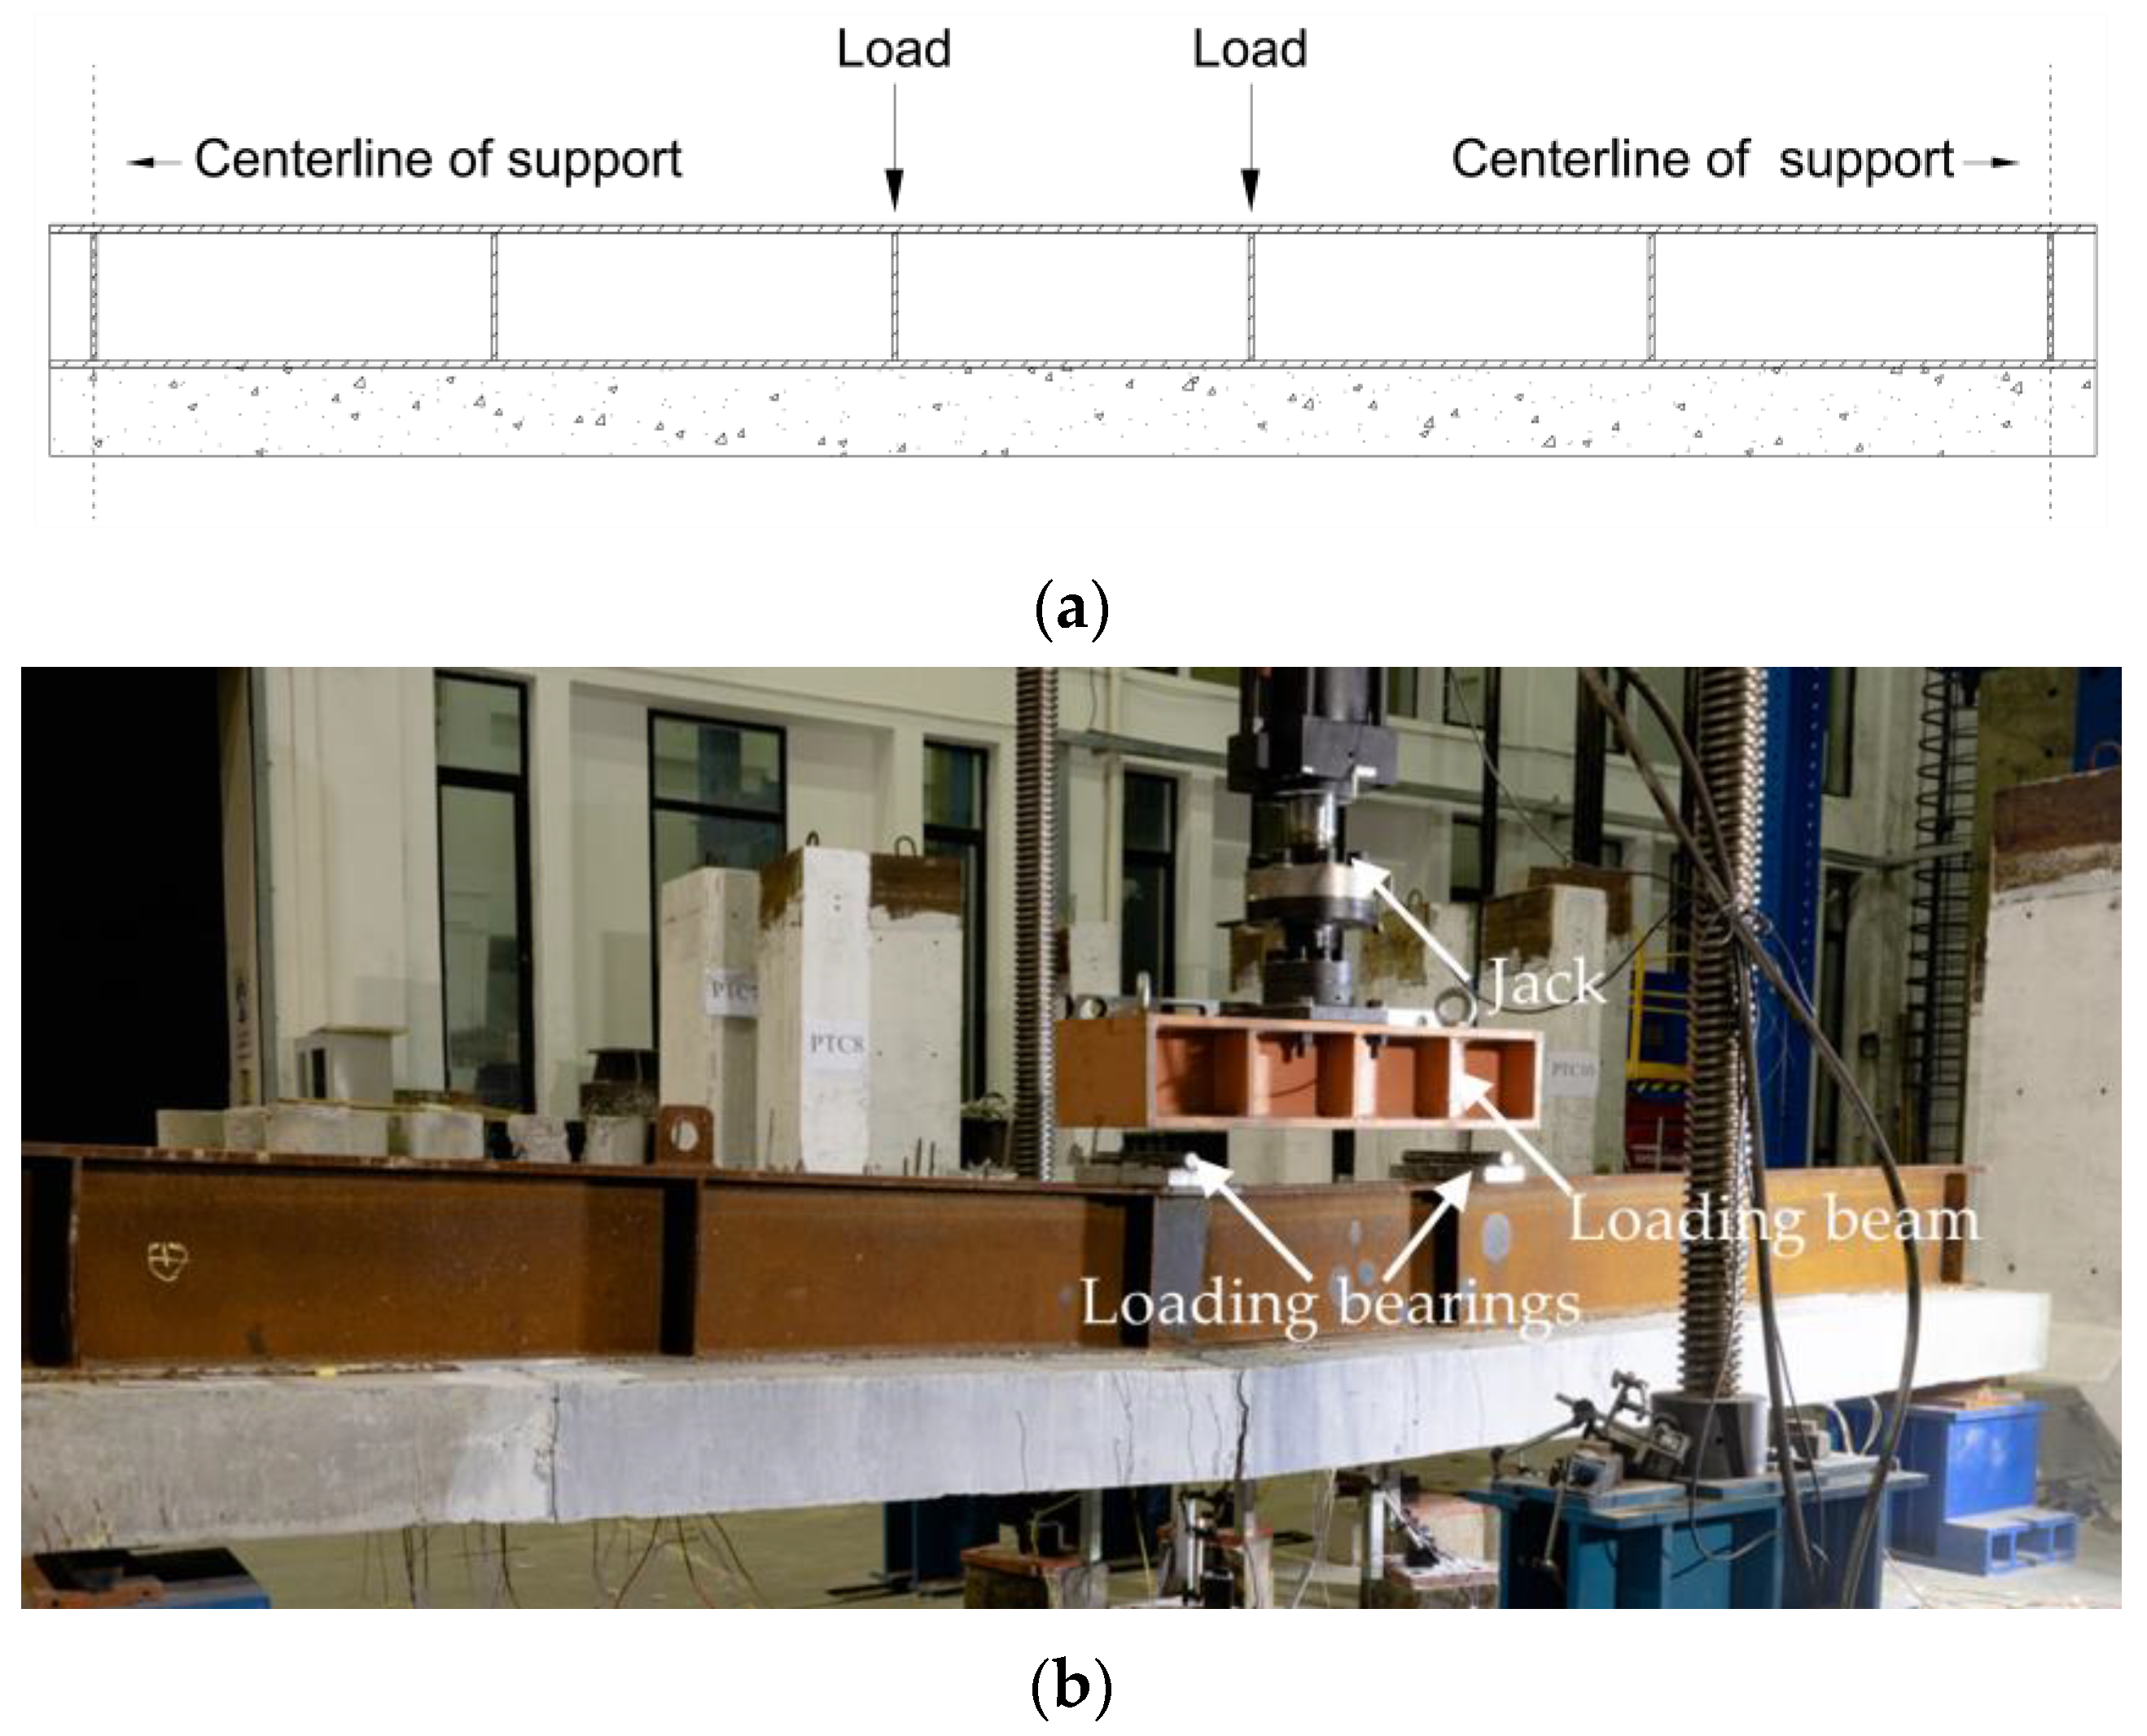
Figure 6.
Pictures of the damaged specimens: (a) picture of specimen A; (b) picture of specimen B; (c) picture of specimen C; (d) picture of specimen D.
Figure 6.
Pictures of the damaged specimens: (a) picture of specimen A; (b) picture of specimen B; (c) picture of specimen C; (d) picture of specimen D.
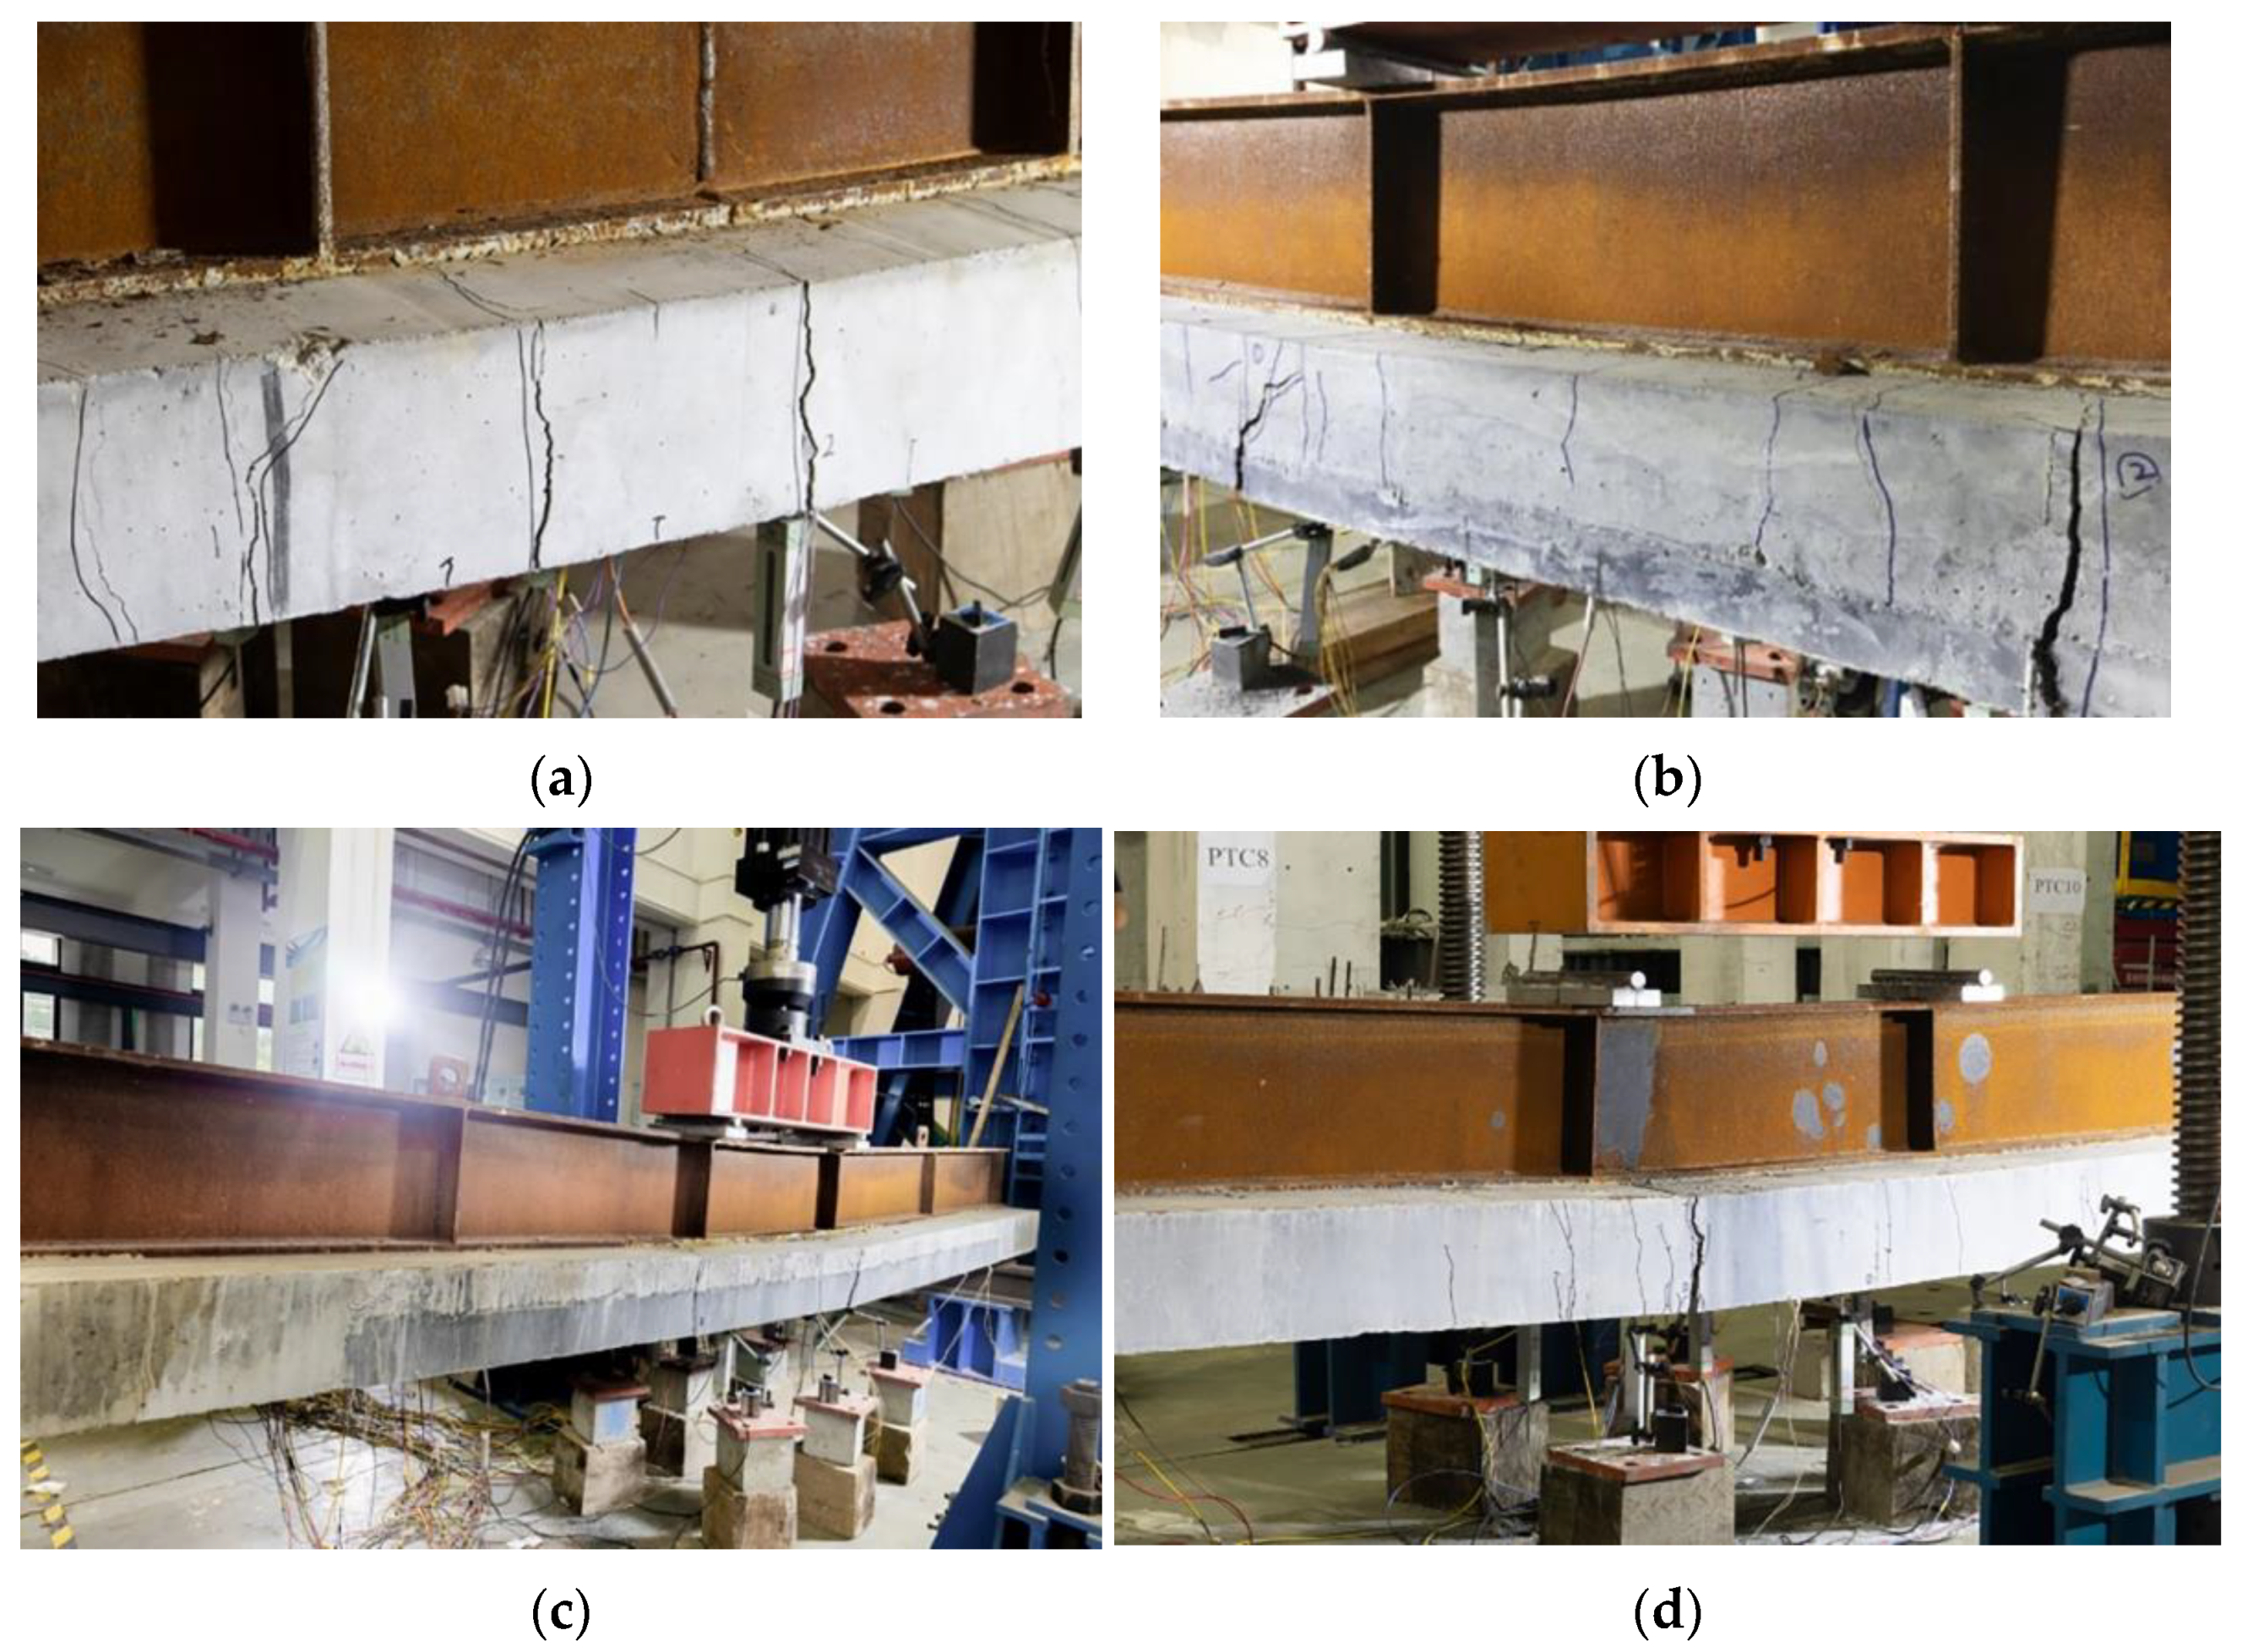
Figure 7.
Finite element model.
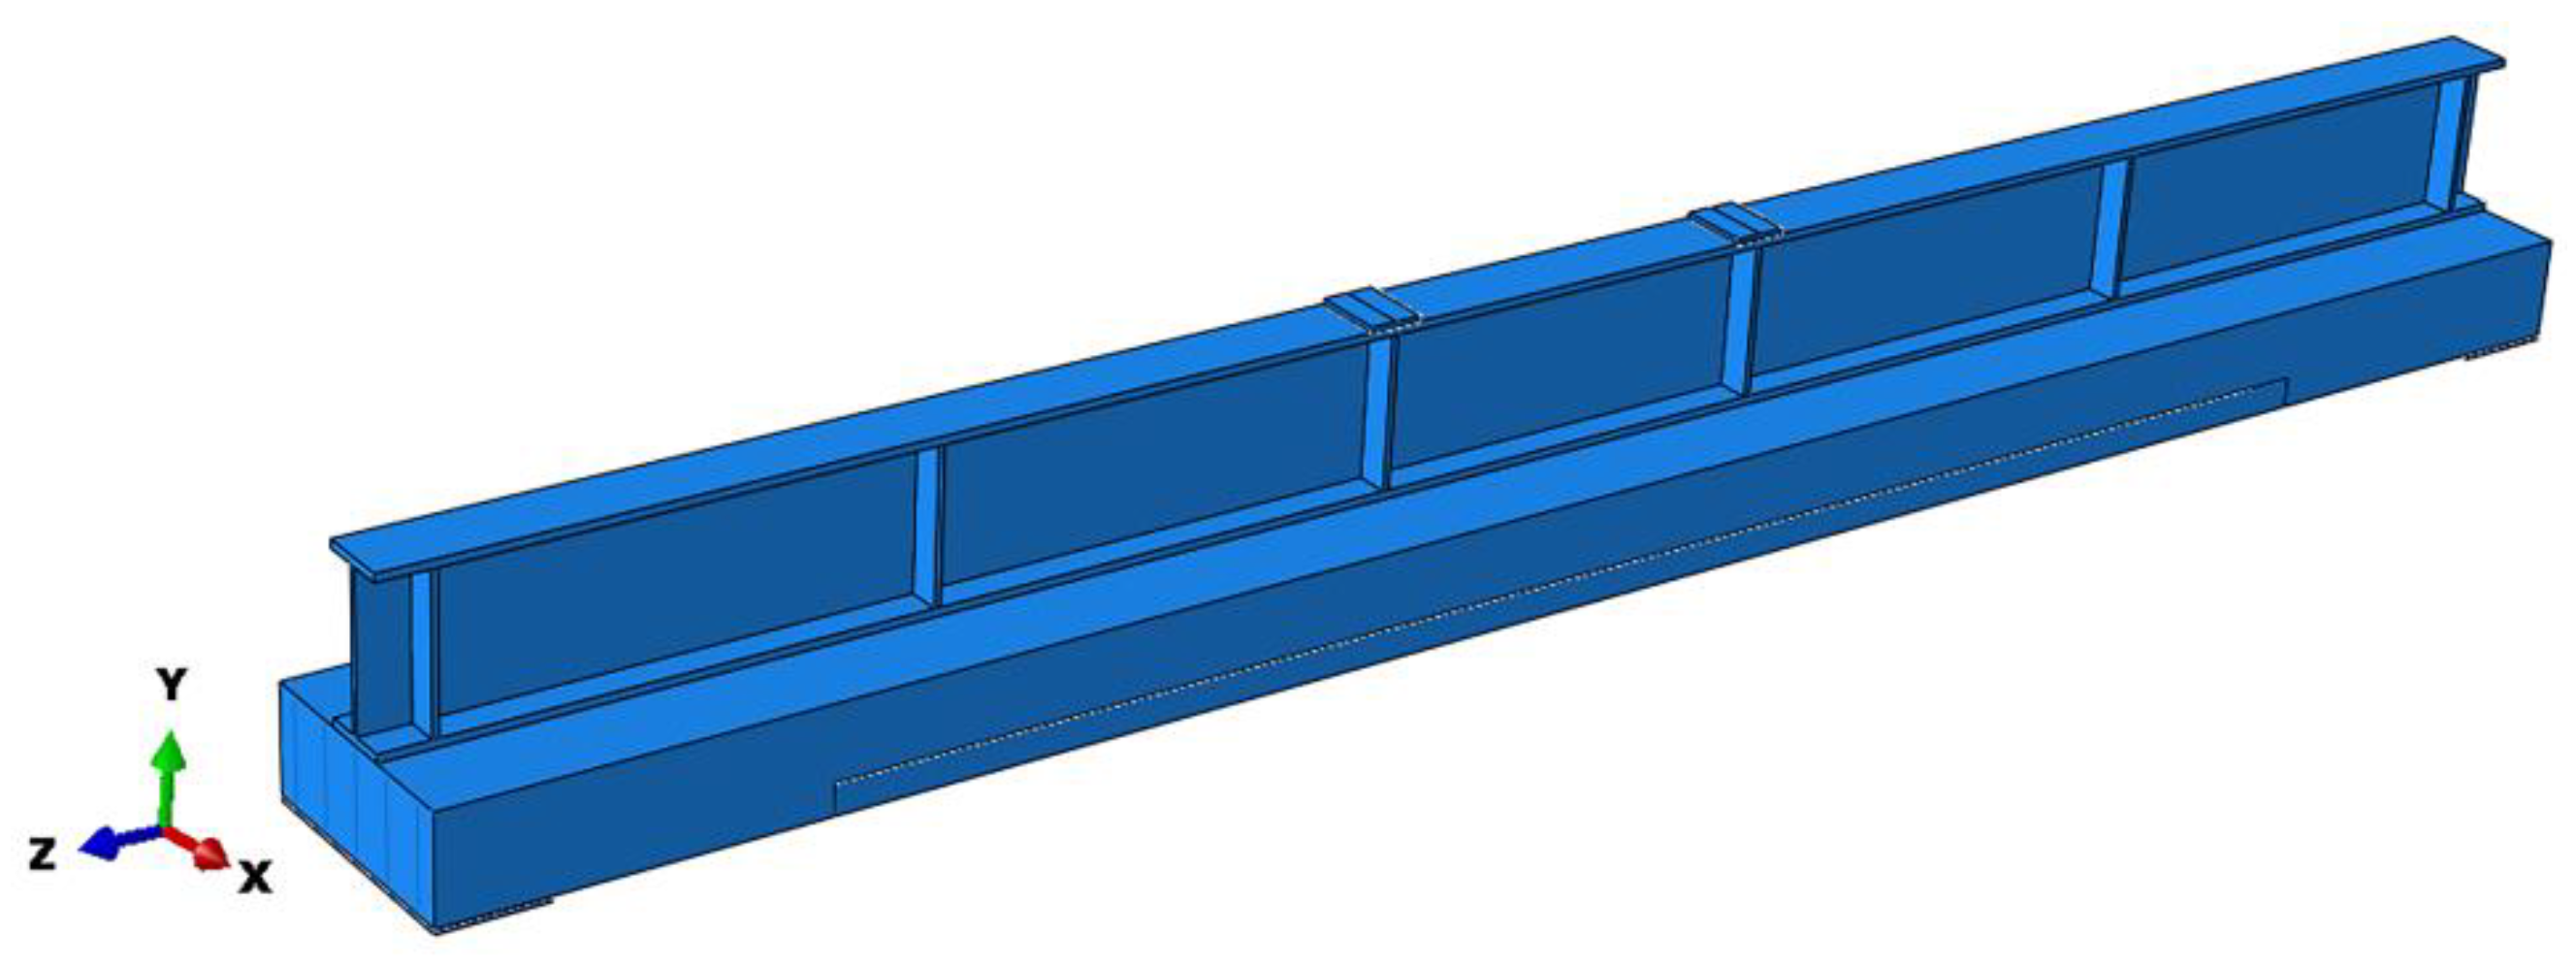
Figure 8.
Crack development for a UHPC layer ratio of 0: (a) applied load equals 100 kN; (b) applied load equals 290 kN; (c) applied load equals 330 kN.
Figure 8.
Crack development for a UHPC layer ratio of 0: (a) applied load equals 100 kN; (b) applied load equals 290 kN; (c) applied load equals 330 kN.
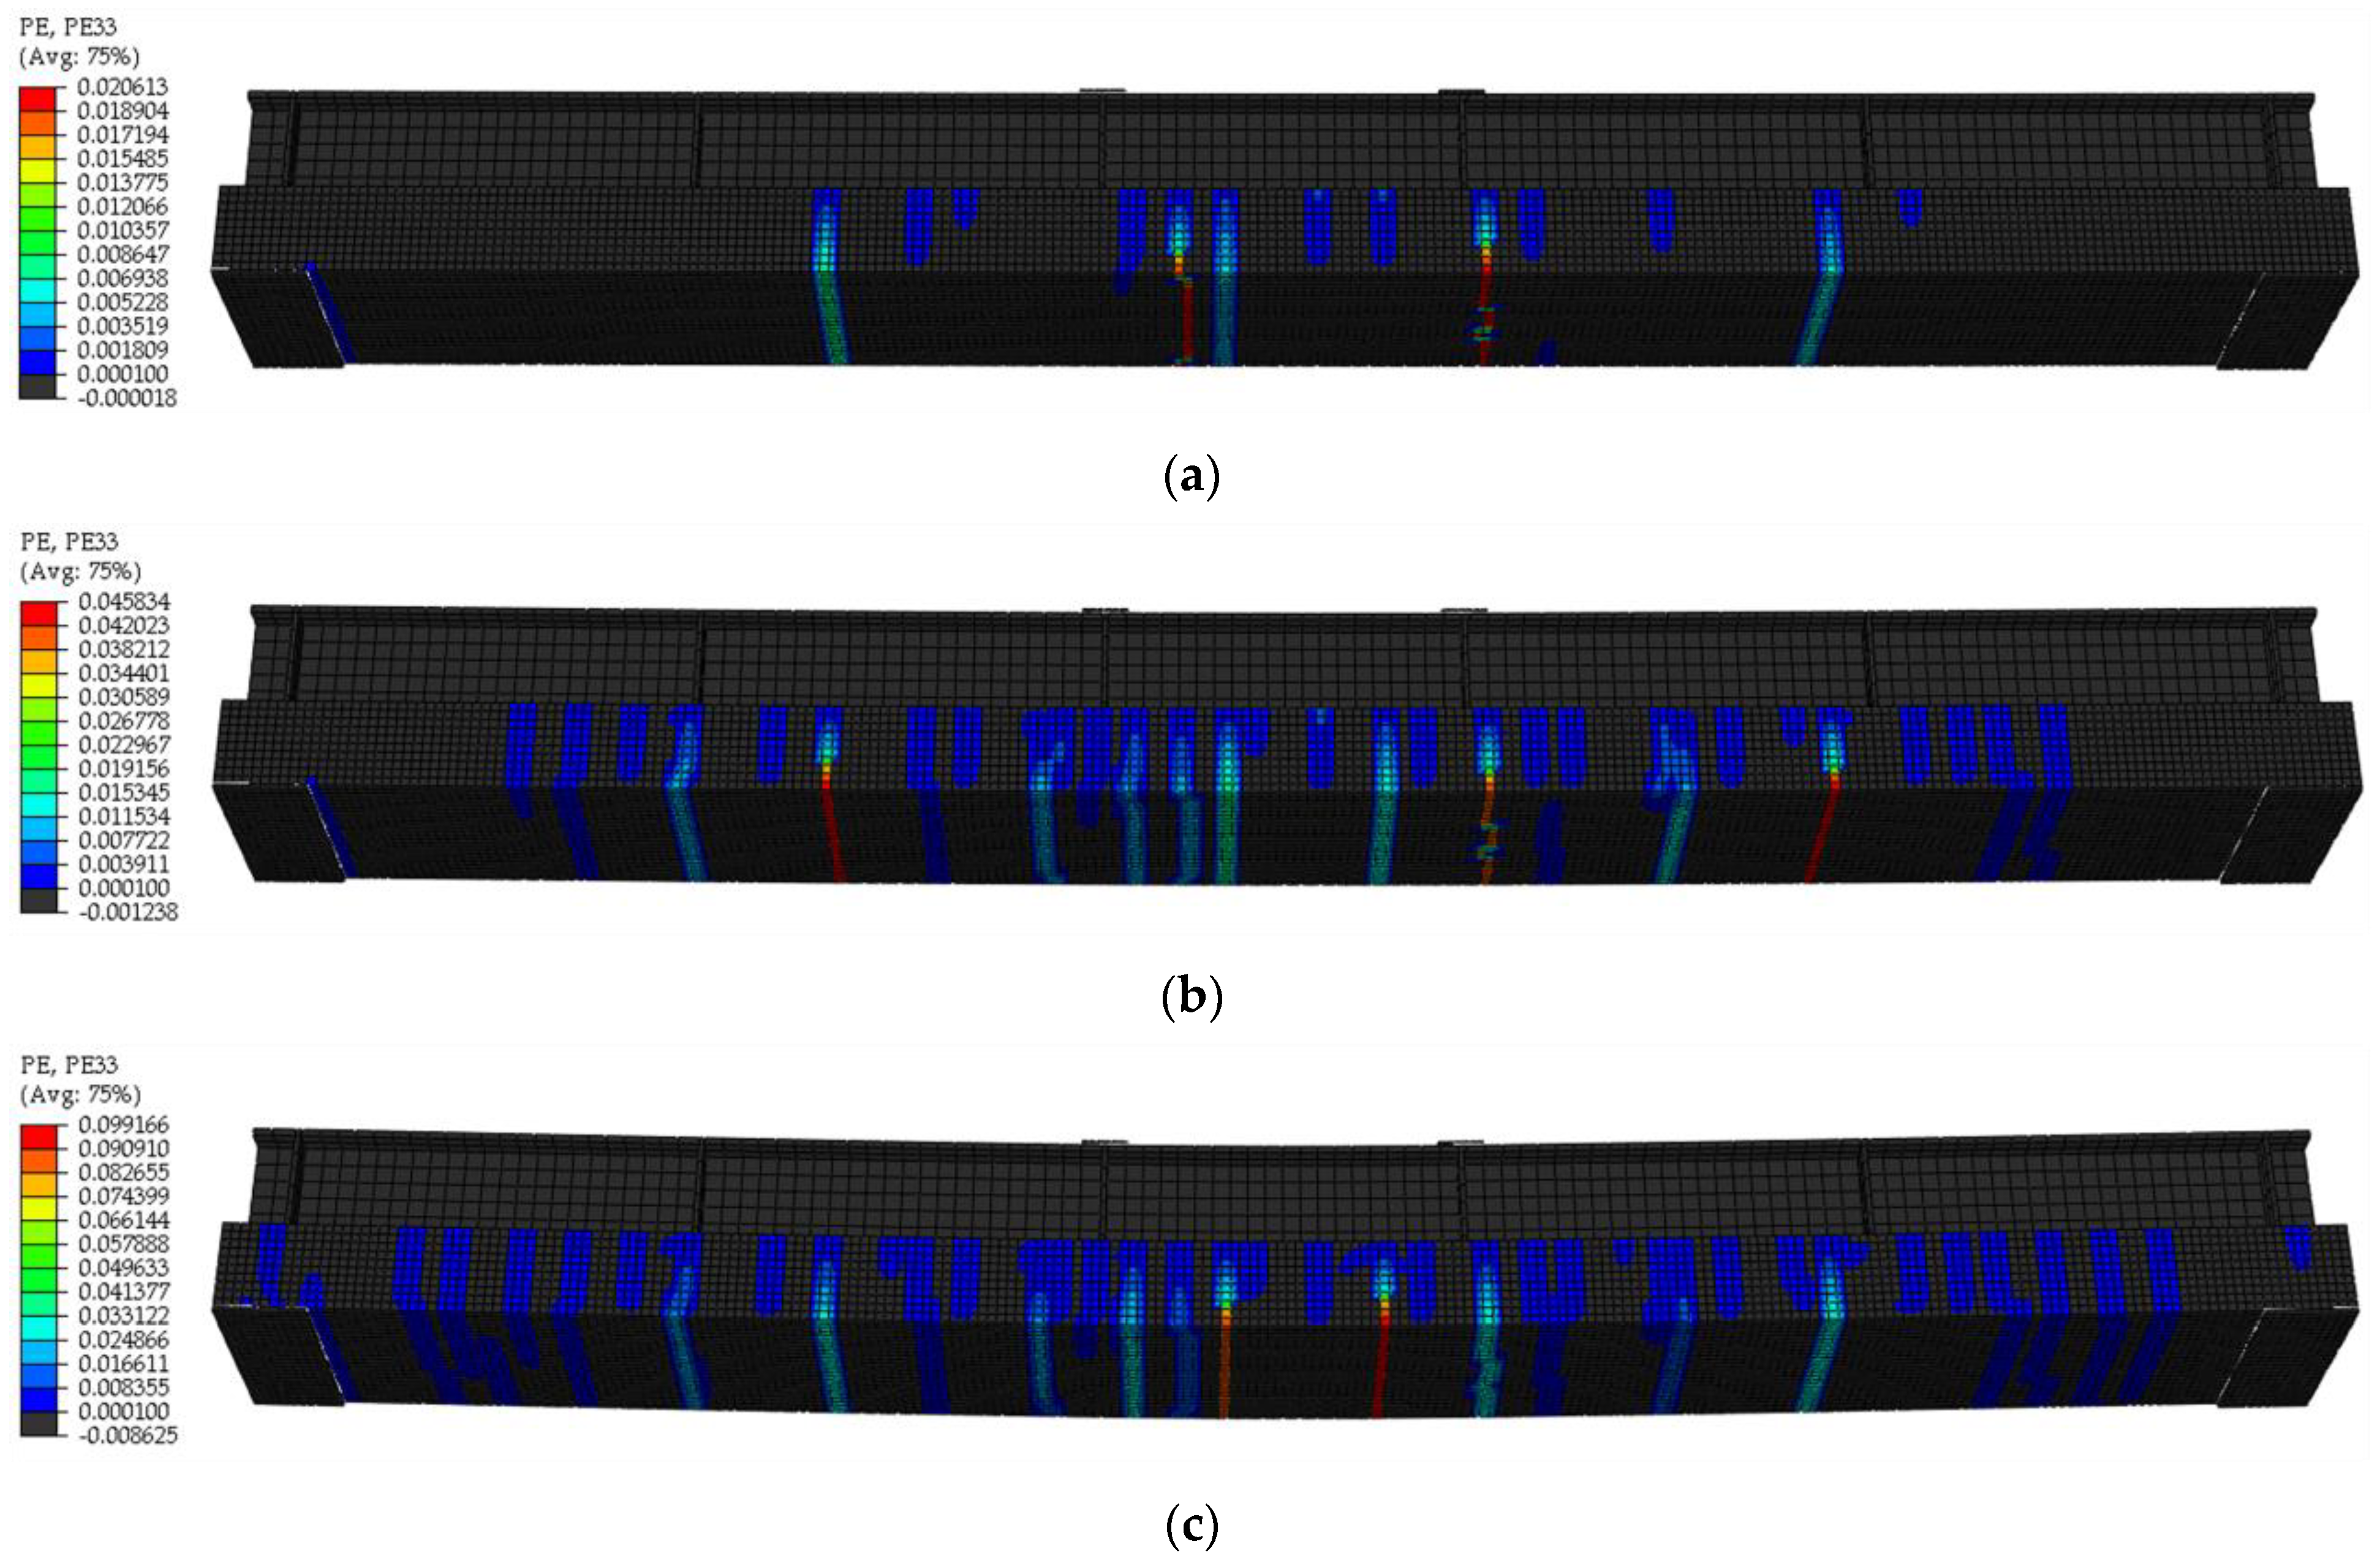
Figure 9.
Load-displacement curve for a UHPC layer ratio of 0.
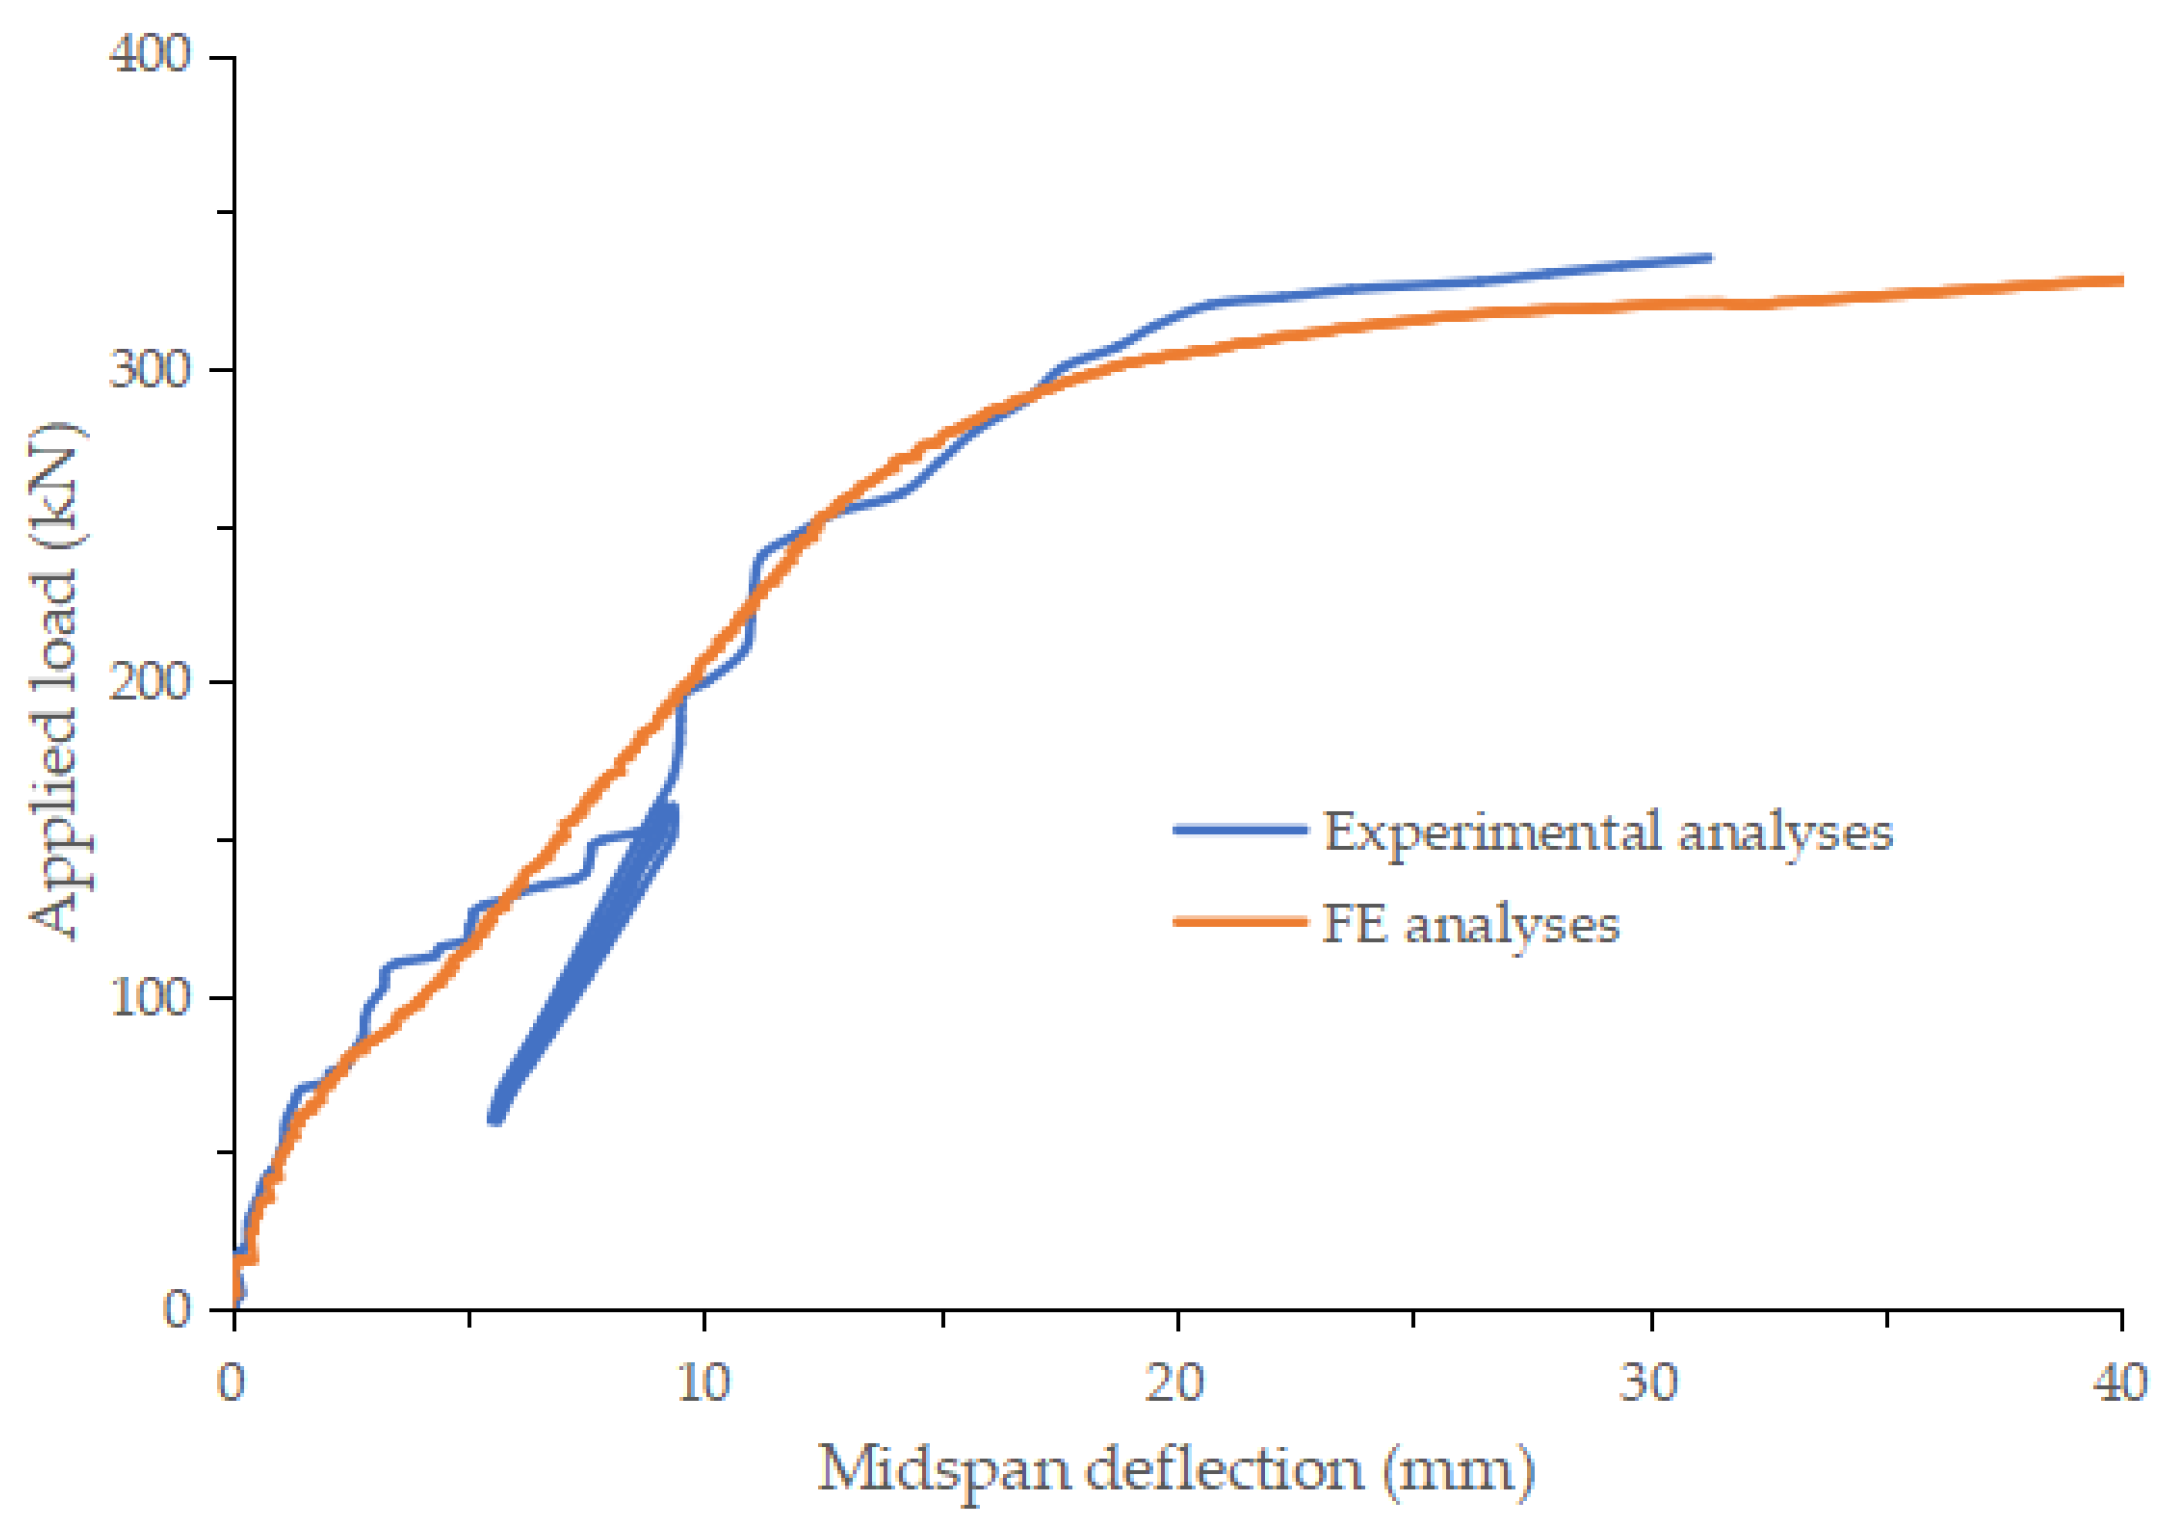
Figure 10.
Crack development for a UHPC layer ratio of 0.3: (a) applied load equals 120 kN; (b) applied load equals 310 kN; (c) applied load equals 345 kN.
Figure 10.
Crack development for a UHPC layer ratio of 0.3: (a) applied load equals 120 kN; (b) applied load equals 310 kN; (c) applied load equals 345 kN.

Figure 11.
Load-displacement curve for a UHPC layer ratio of 0.3.
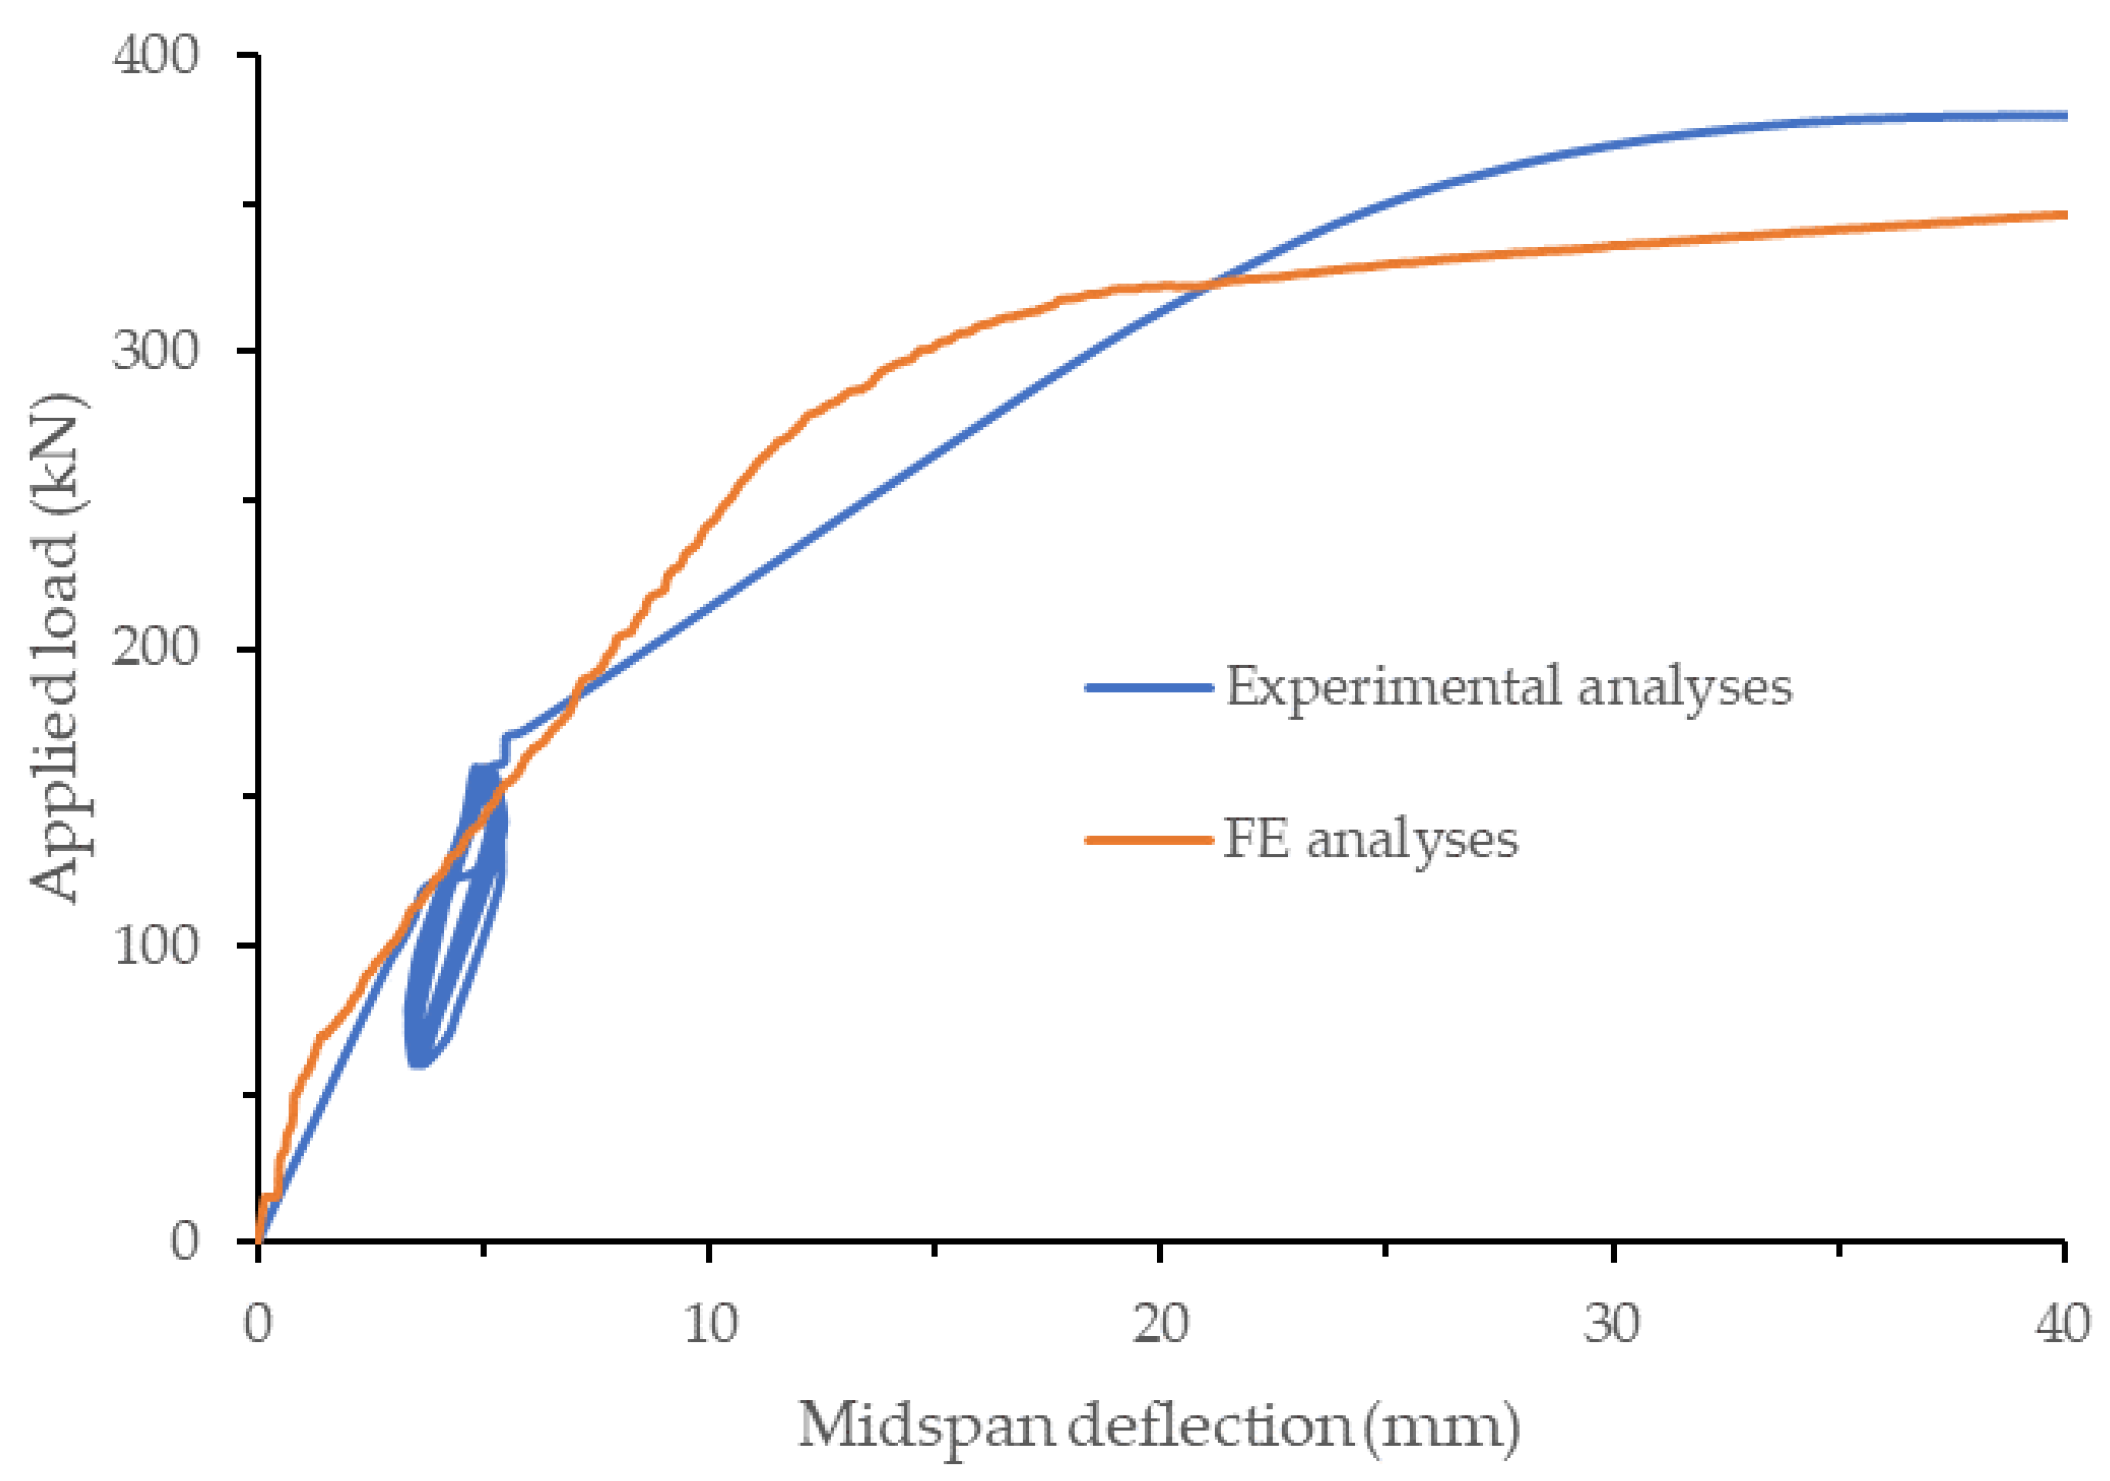
Figure 12.
Crack development for a UHPC layer ratio of 0.6: (a) applied load equals 120 kN; (b) applied load equals 305 kN; (c) applied load equals 335 kN.
Figure 12.
Crack development for a UHPC layer ratio of 0.6: (a) applied load equals 120 kN; (b) applied load equals 305 kN; (c) applied load equals 335 kN.
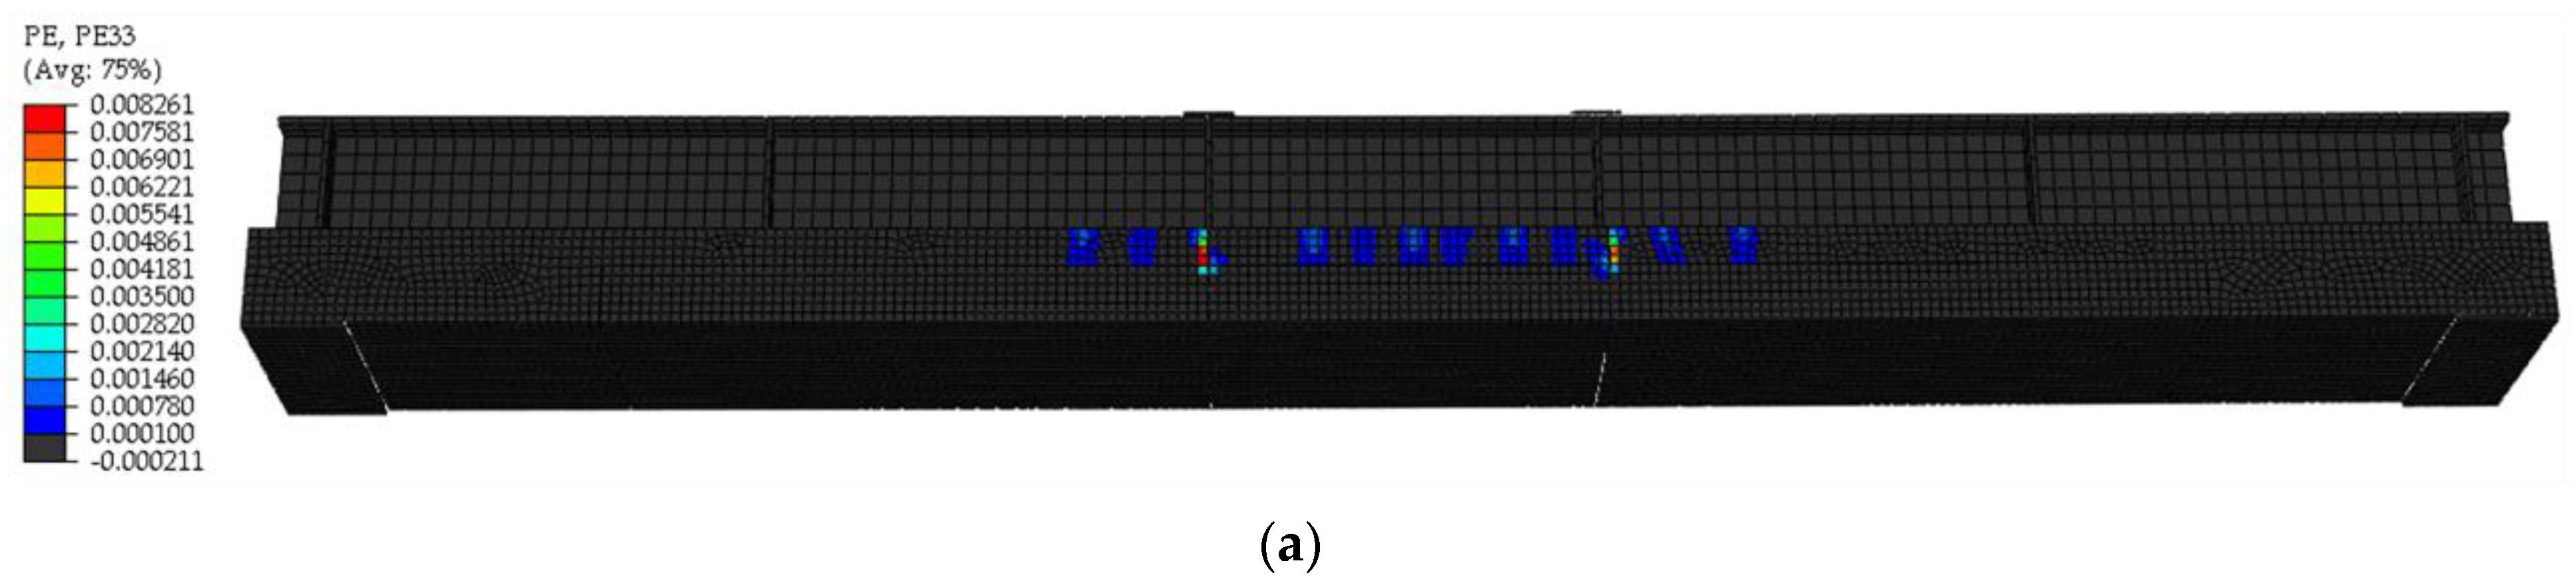
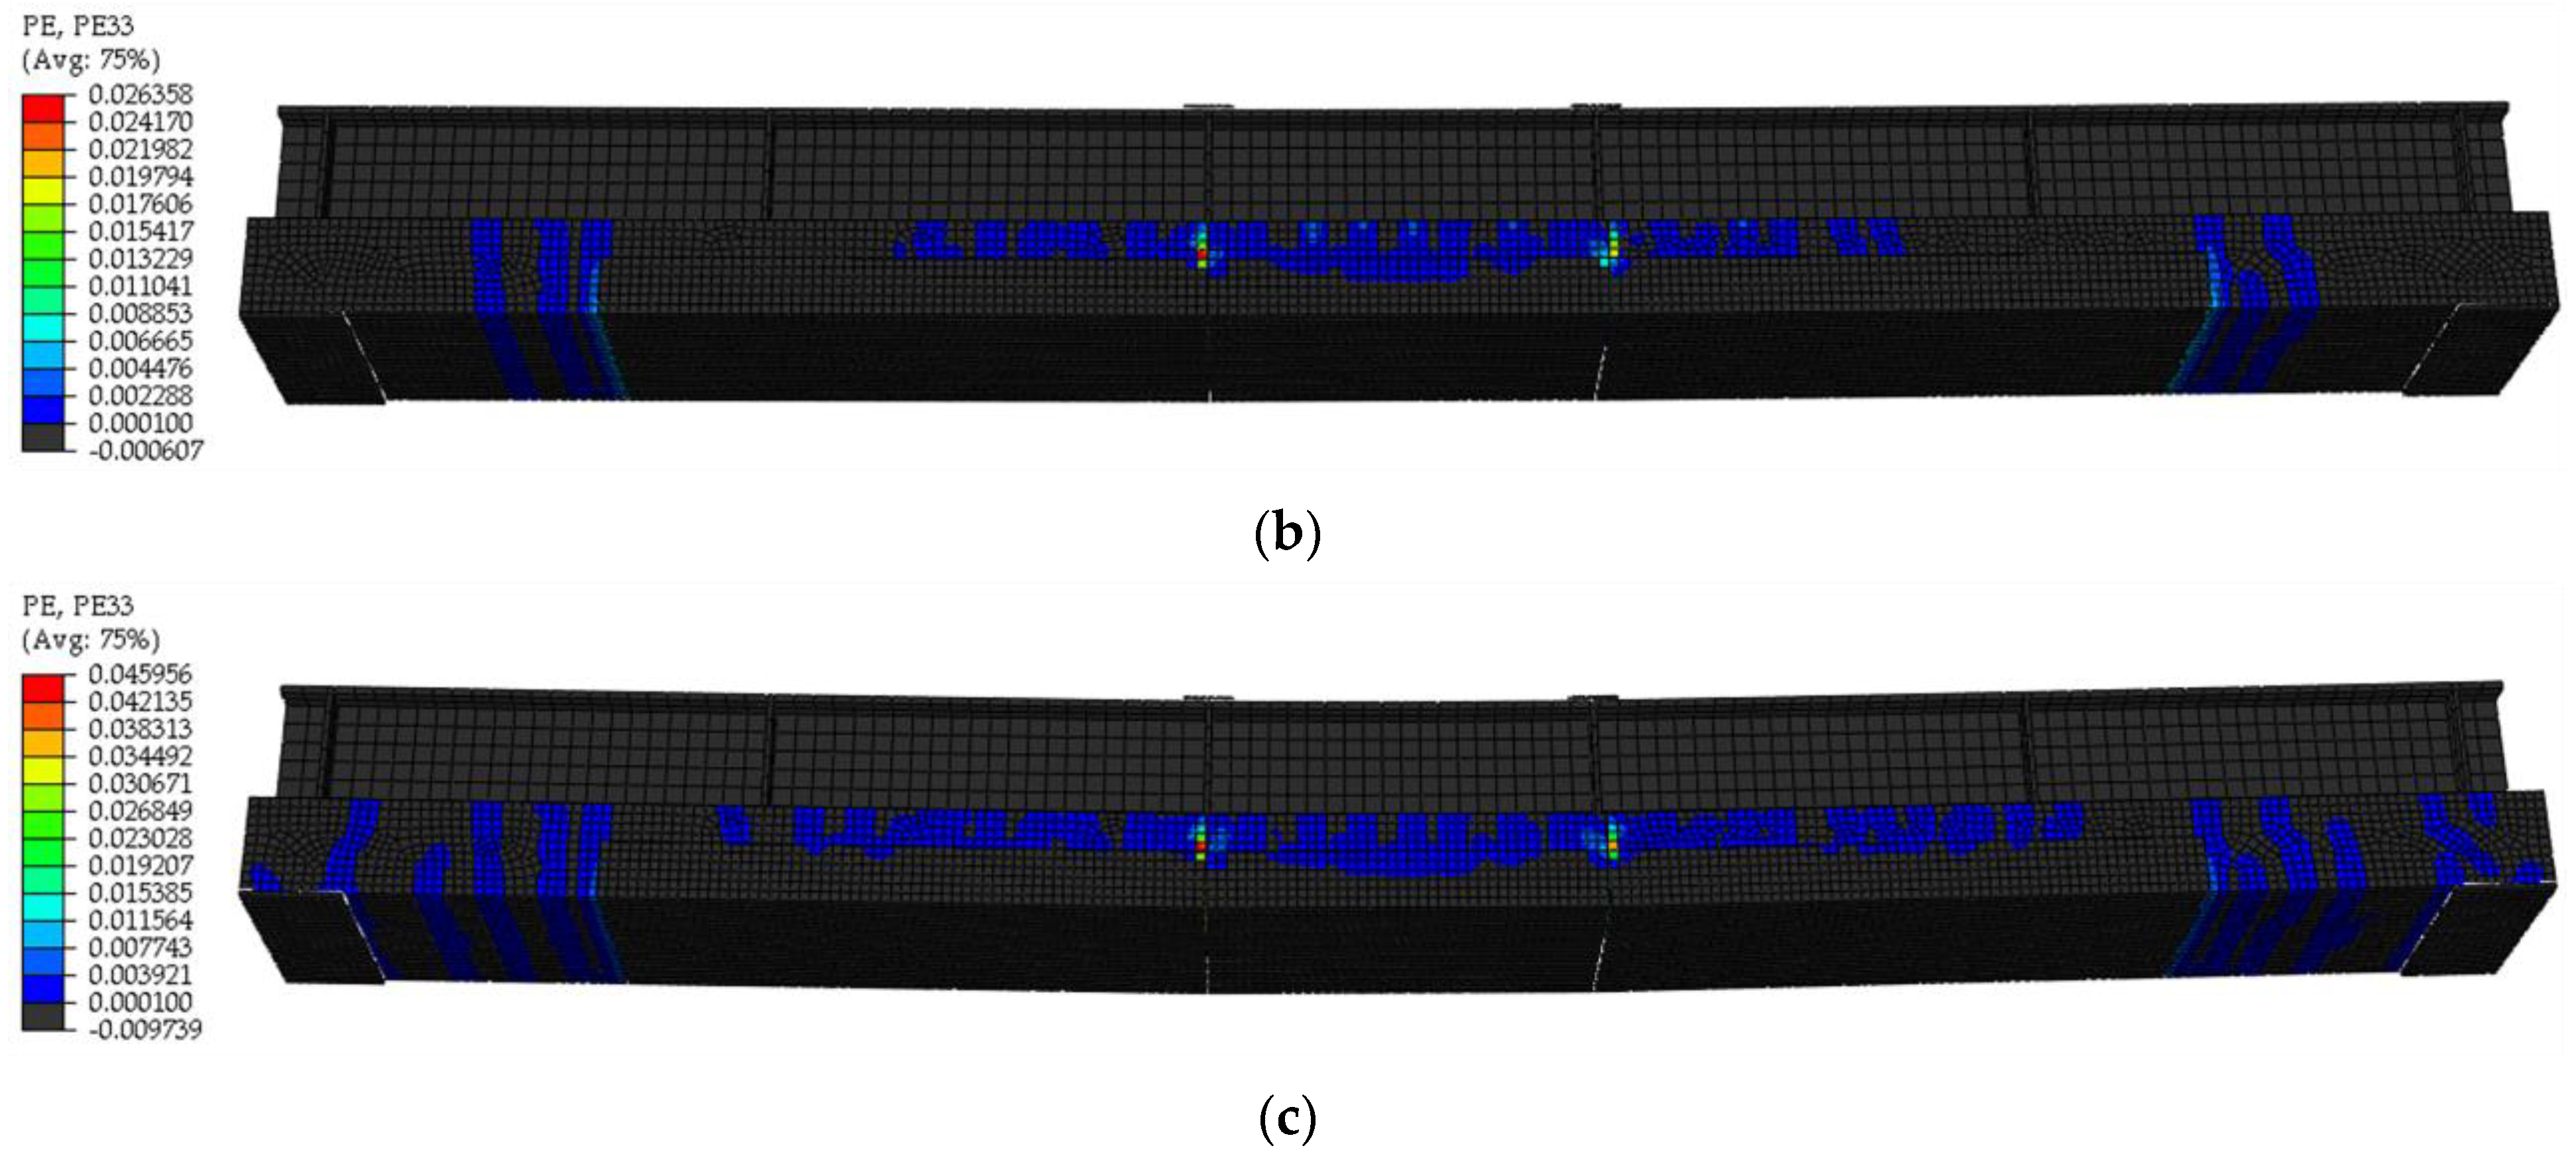
Figure 13.
Load-displacement curve for a UHPC layer ratio of 0.6.

Figure 14.
Crack development for a UHPC layer ratio of 1.0: (a) applied load equals 225 kN; (b) applied load equals 400 kN; (c) applied load equals 425 kN.
Figure 14.
Crack development for a UHPC layer ratio of 1.0: (a) applied load equals 225 kN; (b) applied load equals 400 kN; (c) applied load equals 425 kN.

Figure 15.
Load-displacement curve for a UHPC layer ratio of 1.0.

Table 1.
Specimen groups.
| Group | Size of the Deck |
|---|---|
| A | Conventional concrete deck of 200 mm |
| B | UHPC layer of 60 mm + conventional concrete layer of 140 mm |
| C | UHPC layer of 120 mm + conventional concrete layer of 80 mm |
| D | UHPC layer of 200 mm |
Table 2.
Steel properties.
| Type | Yield Strength (MPa) | Ultimate Strength (MPa) |
|---|---|---|
| Q235 | 235 | 360 |
| HRB400 | 425 | 595 |
Table 3.
Parameters of constitutive models used for UHPC and RC.
| Material | Dilation Angle | Eccentricity | fb01/fc02 | K3 | Viscosity Parameter |
|---|---|---|---|---|---|
| UHPC | 54 | 0.1 | 1.07 | 0.667 | 0.01 |
| RC | 30 | 0.1 | 1.16 | 0.667 | 1 × 10⁻⁵ |
1 fb0: Equibiaxial compressive stress strength. 2 fc0: yield compressive stress.3 K: a constant that governs the spacing between compressive and tensile meridians and the shape of failure surface on deviatory plane.
Publisher’s Note: MDPI stays neutral with regard to jurisdictional claims in published maps and institutional affiliations. |
© 2022 by the authors. Licensee MDPI, Basel, Switzerland. This article is an open access article distributed under the terms and conditions of the Creative Commons Attribution (CC BY) license (https://creativecommons.org/licenses/by/4.0/).
Share and Cite
MDPI and ACS Style
Long, G.; Zhou, R.; Ma, H.; Xin, G.; Emadi, S.; Shi, X. Experimental and Numerical Study on UHPC–RC Decks within Hogging Moment Region. Appl. Sci. 2022, 12, 11446. https://doi.org/10.3390/app122211446
AMA Style
Long G, Zhou R, Ma H, Xin G, Emadi S, Shi X. Experimental and Numerical Study on UHPC–RC Decks within Hogging Moment Region. Applied Sciences. 2022; 12(22):11446. https://doi.org/10.3390/app122211446
Chicago/Turabian StyleLong, Guanxu, Ruigen Zhou, Haiying Ma, Gongfeng Xin, Seyyedbehrad Emadi, and Xuefei Shi. 2022. "Experimental and Numerical Study on UHPC–RC Decks within Hogging Moment Region" Applied Sciences 12, no. 22: 11446. https://doi.org/10.3390/app122211446
Note that from the first issue of 2016, this journal uses article numbers instead of page numbers. See further details here.