

Study on the Removal of Iron and Manganese from Groundwater Using Modified Manganese Sand Based on Response Surface Methodology
School of Municipal and Environmental Engineering, Shenyang Jianzhu University, Shenyang 110168, China
*
Author to whom correspondence should be addressed.
Appl. Sci. 2022, 12(22), 11798; https://doi.org/10.3390/app122211798
Submission received: 24 October 2022
/
Revised: 17 November 2022
/
Accepted: 17 November 2022
/
Published: 20 November 2022
(This article belongs to the Special Issue Low Carbon Water Treatment and Energy Recovery)
Abstract
:This study used modified manganese sand as an adsorbent to explore its adsorption effect on iron and manganese ions from groundwater. The effects of pH, manganese sand dosage, and the initial concentration of Fe/Mn on the removal rate of iron and manganese ions were studied through single-factor experiments. Based on the above three factors, a quadratic polynomial model between the adsorption rate and the above factors was established to determine the optimal adsorption conditions. The response surface analysis showed that pH had the most significant effect on the adsorption process. The optimum conditions for the adsorption of iron and manganese ions by modified manganese sand were pH = 7.20, the dosage of manganese sand = 3.54 g/L, and the initial concentration ratio of Fe/Mn = 3.80. The analysis of variance showed that the RSM model could accurately reflect the adsorption process of manganese sand. In addition, we confirmed that the relative error between model predictions and experimental values was close to 1%, proving that the response surface model was reliable. The kinetic data of the manganese sand were described well with the pseudo-second-order model. The isothermal adsorption of iron and manganese ions by modified manganese sand was fitted well using the Langmuir equation.
1. Introduction
Iron and manganese are natural components in the crust. High levels of iron and manganese in groundwater are common. In China, 20% of groundwater resources have excess iron and manganese [1]. In water supply networks, iron and manganese in tap water are oxidized to high valence during disinfection. The oxide precipitation formed in the pipeline is easily adsorbed into the water supply network, affecting the quality of the drinking water supply [2]. Although iron and manganese are necessary trace elements for the human body, drinking high-iron and -manganese surface water or groundwater for a long time will lead to chronic poisoning and damage to human health [3,4,5]. Physiologically, a large amount of iron ingested by the human body cannot be removed through metabolism. Excessive iron accumulation will induce diabetes, skin diseases, and other diseases, while excessive manganese can cause pathological changes in human organs and even cause neurotoxicity [6,7,8].
The coexistence of iron and manganese is common in groundwater. In recent years, how to efficiently and stably remove iron and manganese has become the focus of research. Iron usually exists in a soluble ferrous (Fe(II)) state. The most stable oxidation state of manganese is +2 valence [9,10]. The traditional removal methods of Fe(II) and Mn(II) in groundwater include natural oxidation, biological, and adsorption [11,12,13,14]. The natural oxidation method is to oxidize Fe2+ to Fe3+ via aeration and then generate Fe(OH)3 precipitation. The removal of manganese requires adding alkali based on aeration to improve pH. The procedure flow of this method is complex, and the high pH in effluent needs acidification treatment, which increases the treatment cost and management difficulty. The biological method mainly depends on microorganisms to reduce iron and manganese concentration in groundwater. However, the metabolism of microorganisms is influenced by the oxygen content, and insufficient oxygen slows down the metabolism of microorganisms [15]. Although oxidation and biological methods are widely used, their disadvantages are unstable effluent quality and difficulty to control reaction conditions. In contrast, the adsorption method has the advantages of large capacity, less energy consumption, and less pollution [16,17]. It is widely used in removing iron and manganese from groundwater and is considered one of the most effective methods to remove iron and manganese [18,19]. Manganese sand is the most widely used adsorbent for water adsorption of iron and manganese ions [20].
This study aimed to determine the best conditions for the adsorption effect of modified manganese sand. Response surface methodology can effectively optimize the optimal process parameters and evaluate the interactions between various influencing factors [21,22]. We established a response surface model (RSM) based on single-factor experiments to determine the optimal adsorption factors. The model helped analyze various factors affecting the experiment in a limited number of experiments. Meanwhile, we analyzed the interaction between the factors and proved the rationality of the response surface model through experiments.
2. Materials and Methods
2.1. Experiment Material and Equipment
A standard solution of iron and manganese ions, hydrochloric acid (Sinopharm Chemical Reagent Co., Ltd., Shanghai, China), NaOH (Tianjin Bodi Chemical Co., Ltd., Tianjin, China), and manganese sand (Shenyang Keer Automation Instrument Co., Ltd., Shenyang, China) were used in this study. MnO2 content was 40%, iron content was 15%, SiO2 content was 18%, MnC2 content was 27%, the solubility of hydrochloric acid was <3.5%, and the particle size was 0.9–1.7 mm. A p611 pH tester (Shanghai Youke Instrument Co., Ltd., Shanghai, China) and a UV-5500 ultraviolet-visible spectrophotometer (Shanghai Yuan Xi Instrument Co., Ltd., Shanghai, China) were used for the analyses.
2.2. Preparation of High-Efficiency Manganese Sand and Determination of Removal Rate
Studies have shown that Mn2+ is very stable under acidic conditions and difficult to remove through oxidation. Nevertheless, modified manganese sand can reduce the lower limit of pH in the manganese removal. In order to obtain high-efficiency manganese sand, we adopted the impregnation method to modify manganese sand [23]. Untreated manganese sand (0.9–1.7 mm) was cleaned with deionized water to remove the impurities on the surface and then placed in a drying oven at a constant temperature of 100 °C. The dried manganese sand was put into a 500 mL beaker and mixed with 5% potassium permanganate solution, and the mixture of manganese sand and the modifier was then heated at 50 °C for 16 h in a constant-temperature water bath. Then, it was dried again for 12 h in an oven at 100 °C to obtain the modified manganese sand.
To confirm the effect of adsorption, we studied the removal rate of the adsorption process and configured several water samples with different iron and manganese ion concentrations. Briefly, 2 mg/L iron together with the manganese ion water sample and the manganese sand adsorbent were added to a 250 mL conical flask. The pH of the solution was adjusted with 0.1 mol/L NaOH and HCl. After sealing, it was placed in a constant temperature shaker at 25 °C with a rotating speed of 120 r/min. For the sampling after adsorption, a 0.45 μm filter membrane was used. The absorbance was measured at 510 nm via o-phenanthroline spectrophotometry (detection limit: 0.03 mg/L; the relative standard deviation of the laboratory was 0.44%). The absorbance was measured at 525 nm through potassium periodate spectrophotometry (detection limit: 0.05 mg/L; the relative standard deviation was 3.94%). The iron and manganese ion removal rate is calculated according to Formula 1.
where C0 is the initial concentration of adsorbate, mg/L. Ce is the final concentration of adsorbate, mg/L.
2.3. Characterization of Properties
The sample pore size distribution and other parameters were determined using an ASAP 2020 physical adsorption meter manufactured by an American microphone instrument company. Nitrogen adsorption was determined at 77 K and within the range of 10−3~1.0 relative pressure (p/p0), using nitrogen as the adsorbing medium. The sample was degassed for 2 h at 300 °C before the test. The micromorphology of manganese sands before and after modification was observed using an S-4800 scanning electron microscope (Hitachi Limited, Tokyo, Japan).
2.4. Single-Factor Experimental Design
In order to obtain reasonable experimental factors, we designed single-factor experiments, which provided guidance for the design of the response surface experiments. The single-factor experiments were based on three influencing factors: pH (4, 5, 6, 7, 8, 9); manganese sand dosage (1.5, 2, 2.5, 3, 3.5, 4, 4.5 g/L); and initial concentration of Fe/Mn (2, 4, 6, 8, 10). The concentrations of iron and manganese ions were 1 and 0.5 mg/L, 2 and 0.5 mg/L, 3 and 0.5 mg/L, 4 and 0.5 mg/L, and 5 and 0.5 mg/L, respectively. Three groups of parallel tests were set up to detect the concentration of iron and manganese in the water sample and calculate the removal rate. The appropriate value range of each factor was determined.
2.5. Response Surface Experimental Design
The interaction of pH, the amount of adsorbent, and the initial concentration ratio of iron and manganese ions on the adsorption of manganese sand was studied. The adsorption conditions were optimized within the experimental range, and the experimental design was optimized using the Box–Behnken response surface. Based on the single-factor experiments described in Section 2.4, the range of three input variables was determined: pH (A), manganese sand dosage (B), and the Fe/Mn initial concentration ratio (C). A central composite design was carried out for the adsorption experiment at three levels: low (−1), medium (0), and high (1). There were 17 groups of experiments; each group of experiments was repeated three times, and the average value was taken as the corresponding response value. Table 1 shows the coding values for each level.
2.6. Adsorption Kinetic Experiment
Several solutions containing 2 mg/L iron and manganese ions were prepared. Briefly, 2 g of manganese sand was weighed for each sample and put into 250 mL conical flasks in an incubator. The temperature of the incubator was set to 25 °C, and the oscillation intensity was set to 120 r/min to ensure full contact between the modified manganese sand and the water sample. The samples were taken at 15, 30, 60, 120, 240, 360, 480, 600, and 720 min, respectively, to determine the concentration of iron and manganese ions in the filtrate. An adsorption kinetic model of manganese sand was established to explore the mechanism of iron and manganese removal.
2.7. Adsorption Isotherm Experiment
Briefly, 2 g of manganese sand was weighed in a 250 mL conical flask to prepare iron and manganese solutions with different initial concentrations. The iron and manganese solutions with different initial mass concentrations were poured into the water samples, and the pH value was adjusted to 7.2. The solutions were placed in a 120 r/min constant temperature oscillator, shaken, and adsorbed for 12 h, and then samples were taken to determine the concentration of iron and manganese ions in the filtrate. The Langmuir and Freundlich models were used to explore the mechanism of iron and manganese removal.
3. Results and Discussion
3.1. SEM Results of Manganese Sand
The unmodified (a) and modified (b) manganese sand were scanned with a scanning electron microscope. From Figure 1b, it can be seen that the manganese sand modified by potassium permanganate had a loose cluster distribution, and the roughness of the surface increased. There were many different sizes of pores on the surface of manganese sand, which may be one of the reasons for the improvement in its adsorption performance.
3.2. Surface Area and Porosity Analysis
Compared with unmodified manganese sands, the specific surface area, the pore volume, and the average pore size of the modified manganese sand samples in Table 2 increased by 26.9%, 41.7%, and 26.9%, respectively. During the modification process, the influence of the potassium permanganate solution on the internal thin layer and impurities of manganese sand samples changed the micropore structure of the manganese sand samples themselves, and through the connection of small pores, intermediate pores were formed. With the increase in the specific surface area and pore diameter, modified manganese sand was more beneficial to the diffusion and adsorption of iron and manganese ions.
The adsorption volume of manganese sand increased with the increase in relative pressure. When the relative pressure was about 0.5 in Figure 2, the curve was divided into two smooth curves. The hysteresis loop occurred at high pressure, and capillary condensation occurred. According to the figure, the nitrogen adsorption–desorption isotherms of manganese sand and modified manganese sand belonged to type IV isotherms in the BDDT classification system. The adsorption–desorption curve revealed an obvious hysteresis phenomenon, which was the result of nitrogen capillary condensation in the mesopore. The adsorption effect of the modified manganese sand was improved, which showed that the pore expanded after being corroded by potassium permanganate.
3.3. Single-Factor Experimental Results and Analysis
3.3.1. Effect of pH on the Iron and Manganese Ion Removal
PH was one of the essential factors for iron and manganese ion removal. We studied the effect of the initial pH value on the adsorption process. As shown in Figure 3, the iron and manganese ions’ removal rate showed an upward trend with the increase in pH. When the pH rose from 6.0 to 7.0, the iron ion removal rate rapidly increased from 69.8% to 80.4%, and the manganese ion removal rate rapidly increased from 62.3% to 75.5%. However, when the pH was greater than 7, the iron and manganese ion removal rate increased slowly, and the change was not significant.
The hydrated ion radius of H+ in water was much smaller than Fe2+ and Mn2+. Under acidic conditions, a large number of H+ competed with iron and manganese ions for adsorption sites [24], resulting in the low removal efficiency of iron and manganese. At the same time, when the pH was too low, an iron filter membrane was easily formed on the surface of manganese sand, and iron infiltrated the filter layer and interfered with the formation of the manganese active filter membrane, thus affecting the manganese removal effect [25,26]. However, if the pH was too high, on the one hand, the iron ions in the solution precipitated in the form of hydroxide, which reduced the catalytic capacity, and on the other hand, it would inhibit the production of OH−. The above results showed that when the pH value was close to neutral, the removal rate of iron and manganese ions was significantly improved. Based on the consideration of economic factors and manganese sand adsorption conditions [27], the optimal pH value of manganese sand adsorption was 7.0.
3.3.2. Effect of Manganese Sand Dosage on the Iron and Manganese Ion Removal
It can be seen from Figure 4 that, with the increase in manganese sand consumption, the system had more adsorption sites, and the removal rate of iron and manganese ions gradually increased. When the amount of manganese sand increased from 1.5 g/L to 3.5 g/L, the iron removal rate increased from 61.6% to 84.5%, and the manganese removal rate increased from 61.1% to 74.7%. When the dosage continued to increase from 3.5 to 4.5 g/L, the iron ion removal rate slowly increased from 84.5% to 85.2%, and the manganese ion removal rate slowly increased from 74.7% to 75.8%. This showed that increasing the dosage of manganese sand has little effect on adsorption in this range.
With the increase in manganese sand dosage and adsorption sites, the removal rate of iron and manganese ions increased. However, an excessive amount of manganese sand also aggravated the collision between the particles, which was not conducive to the adsorption of ions, and the maximum amount of the adsorbed substances when the unit mass of the adsorbent reached equilibrium was reduced. Considering process costs and the regeneration cost of manganese sand, we considered the amount of manganese sand used in this test to be controlled at about 3.5 g/L. Therefore, the optimal dosage of manganese sand was determined to be 3.5 g/L.
3.3.3. Effect of Initial Concentration of Fe/Mn on the Iron and Manganese Ion Removal
As can be seen from Figure 5, with the increase in the initial concentration ratio of Fe/Mn from 2 to 4, the iron ion removal rate in the solution increased from 78.4% to a maximum of 82.9%. The manganese ion removal rate showed a decreasing trend, and the degree of decrease became obvious after the Fe/Mn ion concentration ratio was greater than 4.
The above phenomenon indicated that when the concentration of iron in the solution was small, the generated iron hydroxide acted as a coagulant and adsorbed iron, so the removal rate of iron was slightly increased. With the increase in the iron ion concentration, the system had a dynamic adsorption equilibrium. At the same time, there was a competitive adsorption relationship between iron and manganese ions. Excess iron ions dissociated in the solution and affected the removal of manganese ions. Therefore, a higher Fe/Mn concentration ratio was not favorable for the removal of Fe and Mn ions. Based on the above analysis, the reasonable initial Fe/Mn concentration ratio in this experiment was about 4.
3.4. Analysis of Response Surface Experimental Results
Experimental Results
Based on the single-factor experimental results, 17 groups of comparative experiments were designed by using the response surface method. The experimental results are shown in Table 3.
Design-Expert 10.0 analysis was performed, and the experimental results are shown in Table 4. The quadratic polynomial regression model for the interaction between pH (A), manganese sand dosage (B), and the Fe/Mn initial concentration ratio (C) was obtained as follows:
where Y1 is the predicted Fe removal efficiency (%), Y2 is the predicted Mn removal efficiency (%), A is the pH value, B is the manganese sand dosage, and C is the initial concentration ratio of Fe/Mn.
Y1 = 83.14 + 1.49A − 0.057B − 0.65C + 0.62AB − 0.41AC + 0.16BC − 1.42A2 − 0.97B2 − 1.18C2
Y2 = 76.04 + 1.36A + 1.15B + 0.13C − 0.75AB − 0.70AC − 2.39BC − 3.16A2 − 3.53B2 − 2.89C2
The analysis of variance is an essential statistical method to test the significance and suitability of regression models. The results of the analysis of variance for the regression models of Y1 and Y2 obtained from the response surface are shown in Table 4. The F-value was used for statistical saliency detection, and the p-value was used for each regression coefficient. If the p-value in the model was smaller, the experimental results were more significant. In this experiment, the p-values of the two models were <0.01, indicating that the model had high significance and was suitable for the optimization study of this parameter. Similarly, the F-value in Table 4 showed that the quadratic model had certain sufficiency and significance. The p-values of the lack of fit for both models were greater than 0.05, showing that the model was consistent in the regression study. As can be seen from the data in Table 4, the correlation coefficients of the predicted value of the model’s removal rate and the experimental value were 0.9972 and 0.9747, respectively. This could better reflect the removal effect of iron and manganese ions. The values of C.V. were 0.16 < 10% and 1.20 < 10%, respectively, proving that the experiment had good accuracy and reliability. In the model, the values of Adeq precision referred to the effective signal-to-noise ratio and were considered reasonable if they were greater than 4. The Adeq precision values of the two models, as shown in the table, were 45.006 > 4 and 15.392 > 4, which means the model had high accuracy [28]. In conclusion, the results of this analysis revealed that the model could replace the real point of the test to analyze the results.
Figure 6 illustrates the correlation between the predicted value and the actual value of the removal efficiency in the response surface model. The experimental data points in the figure were more distributed on the straight line or on both sides of the straight line, indicating a good fit of the model. The summary of the fitted output report showed that the quadratic response model was suitable for explaining the relationship between the pollutant variables, so it could be used to analyze and optimize the effect of iron and manganese ions in water on the adsorption system.
3.5. Analysis of Interaction between Factors
The response surface method overcomes the problem with orthogonal experiments, namely that they cannot give intuitive graphics. According to the fitted quadratic equation model, the response surfaces between different test factors can be plotted. Two-dimensional and three-dimensional response surface maps can better explain independent variables and interaction effects [29]. The shape of the contour can reflect the size of the interaction. A circle indicates that the interaction between the two factors is not apparent, and an ellipse indicates that the interaction is obvious. In other words, the greater the flattening degree of the ellipse, the more significant the interaction between the two factors [30]. Using this method, we analyzed and evaluated the effect of manganese sand on ion removal according to the interaction between any two factors. An additional factor was controlled at the intermediate level when discussing the influence of the interaction on the removal rate. The 3D surface plots of the independent and dependent variables are illustrated in Figure 7 and Figure 8.
3.5.1. Interaction of Three Factors in Iron Ion Removal
It can be seen from Figure 7a–c that when the pH was 7.1–7.3, the dosage of manganese sand was 3.4–3.6 g/L; that is, the initial concentration ratio of iron and manganese ions was between 3.5 and 4, the 3D surface had the deepest chromaticity, and the iron ion removal effect was better. It can be seen from the figure that the removal rate of iron ions could be significantly improved by increasing pH, which indicated that the change in pH significantly affected the whole adsorption system during the process of the adsorption of iron ions by manganese sand. The figure shows that with the increase in pH, the dosage of manganese sand, or the concentration of iron and manganese ions, the degradation rate of iron ions first increased and then decreased. Therefore, there was an optimal matching value between the different influencing factors, and appropriate experimental conditions can maximize the economic benefits of the model and effectively improve the iron ion removal rate.
Figure 7a shows the interaction between the pH value and the manganese sand dosage and their effect on the iron ion removal rate when the initial concentration ratio of iron to manganese was 4. It can be seen from the figure that the two-dimensional contour line was oval, indicating that the interaction between the pH and the dosage was significant. Figure 7b shows the interaction between the pH and the initial concentration ratio of iron and manganese when the dosage was fixed at 3.5 g/L. The steepness of the response surface in the figure was not as significant as the above combination, indicating that the interaction between the pH value and the initial concentration ratio of iron and manganese was not as significant as the interaction between the above pH value and the dosage of manganese sand. The slope of the pH in the response surface graph was steep, indicating that the pH value had a greater impact on the iron removal rate than these two factors. The interaction between the manganese sand dosage and the initial concentration ratio of iron and manganese is shown in Figure 7c. The steepness of the response surface in the figure was not obvious, indicating that the interaction between the dosage of manganese sand and the initial concentration ratio of iron and manganese was not significant.
3.5.2. Interaction of the Three Factors in Manganese Removal
The insignificant ellipticity of the contours in Figure 8a indicated that the interaction between the pH and the dosage had no significant effect on the manganese ion removal rate. When the initial concentration ratio of Fe/Mn was fixed at 4, the slope of the pH on the response surface was very steep, indicating that the pH value had a more obvious influence on manganese ion removal in these two factors. Under the condition of a fixed dosage, the removal efficiency of manganese ions changed with the increase in the pH value. It can be seen from the response surface model that, with the increase in the pH value and the dosage of manganese sand, the removal of Mn2+ by manganese sand first increased and then decreased. When the dosage of manganese sand was 3.4–3.6 g/L, the pH value remained between 6.9 and 7.3, and the removal rate of manganese ions was within the maximum range.
As can be seen from the contour lines in Figure 8b, there was an interaction between the pH value and the initial concentration ratio of Fe/Mn. The slope of the pH value in the response surface was large, which means that the influence of the pH value on the experimental adsorption process was more significant. With the increase in the pH value from 6.5 to 7.5, the removal of Mn2+ by manganese sand first increased and then decreased. When the concentration ratio of Fe/Mn was 3.5–4.5, and the pH value was 6.9–7.3, the removal rate of manganese ions by manganese sand was within the maximum range.
Figure 8c shows the interaction model of the manganese sand dosage and the concentration ratio of iron and manganese ions at pH = 7. It can be seen that the response surface had an “arch shape”, indicating that the interaction between these two factors in the manganese ion removal process was very significant. When the initial concentration ratio of Fe/Mn was constant, the removal of manganese ions first increased and then decreased with the increase in dosage. The slope reflecting the dosing amount in the response surface plot was larger, indicating that when considering the interaction between these two factors, the dosage significantly affected the removal of manganese. When the amount of manganese sand was controlled at 3.5–3.6 g/L, and the initial concentration ratio of Fe/Mn was controlled at 3.5–4, the removal effect of manganese ions was the best.
3.6. Validation Experiment
From the response surface analysis, it can be seen that there was an efficient combination of operating parameters for the complex interaction among the three influencing factors. Through the optimization function of the Design-Expert software, the optimal parameters of the reaction system were predicted as follows: pH = 7.20, the dosage of manganese sand was 3.54 g/L, and the initial concentration ratio of iron and manganese was 3.80. Under this optimal condition, the predicted iron ion removal rate was 83.62%, and the manganese ion removal rate was 76.10%. In order to verify the prediction results, three groups of parallel experiments were carried out in the same reaction system. The average removal rate of iron ions was 82.78%, and the average removal rate of manganese ions was 75.89%, both of which were close to the prediction values, and the relative deviation was less than 1%. These results show that the model can truly reflect the influence of the various analyzed factors on iron and manganese ion removal rate.
3.7. Analysis of Adsorption Kinetic Model
Figure 9 shows the adsorption kinetic curves reflecting the adsorption of iron and manganese ions by manganese sand. The trends of the adsorption rate curves of the two models were basically similar. During the initial 240 min of the adsorption process, manganese sand had many adsorption sites, a large curve slope, and a fast adsorption rate. With the progress in adsorption, the adsorption sites on the surface of manganese sand were gradually occupied by iron and manganese ions, and the adsorption rate slowly decreased until the adsorption equilibrium was reached at 480 min.
The quasi-primary and quasi-secondary kinetic fitting parameters are shown in Table 5 and Table 6. In the adsorption of iron and manganese ions by the unmodified manganese sand and modified manganese sand, the fitting regression coefficients of the quasi-first-order kinetic model were less than those of the quasi-second-order kinetic model, so it can be described by the quasi-second-order kinetic model. Compared with the unmodified manganese sand, the theoretical adsorption capacity of the modified manganese sand was improved. This was because the specific surface area of the modified manganese sand increased, and the adsorption point increased, which was conducive to increasing the reaction residence time of the adsorbent and the adsorbate, and at the same time, increasing the equilibrium adsorption capacity.
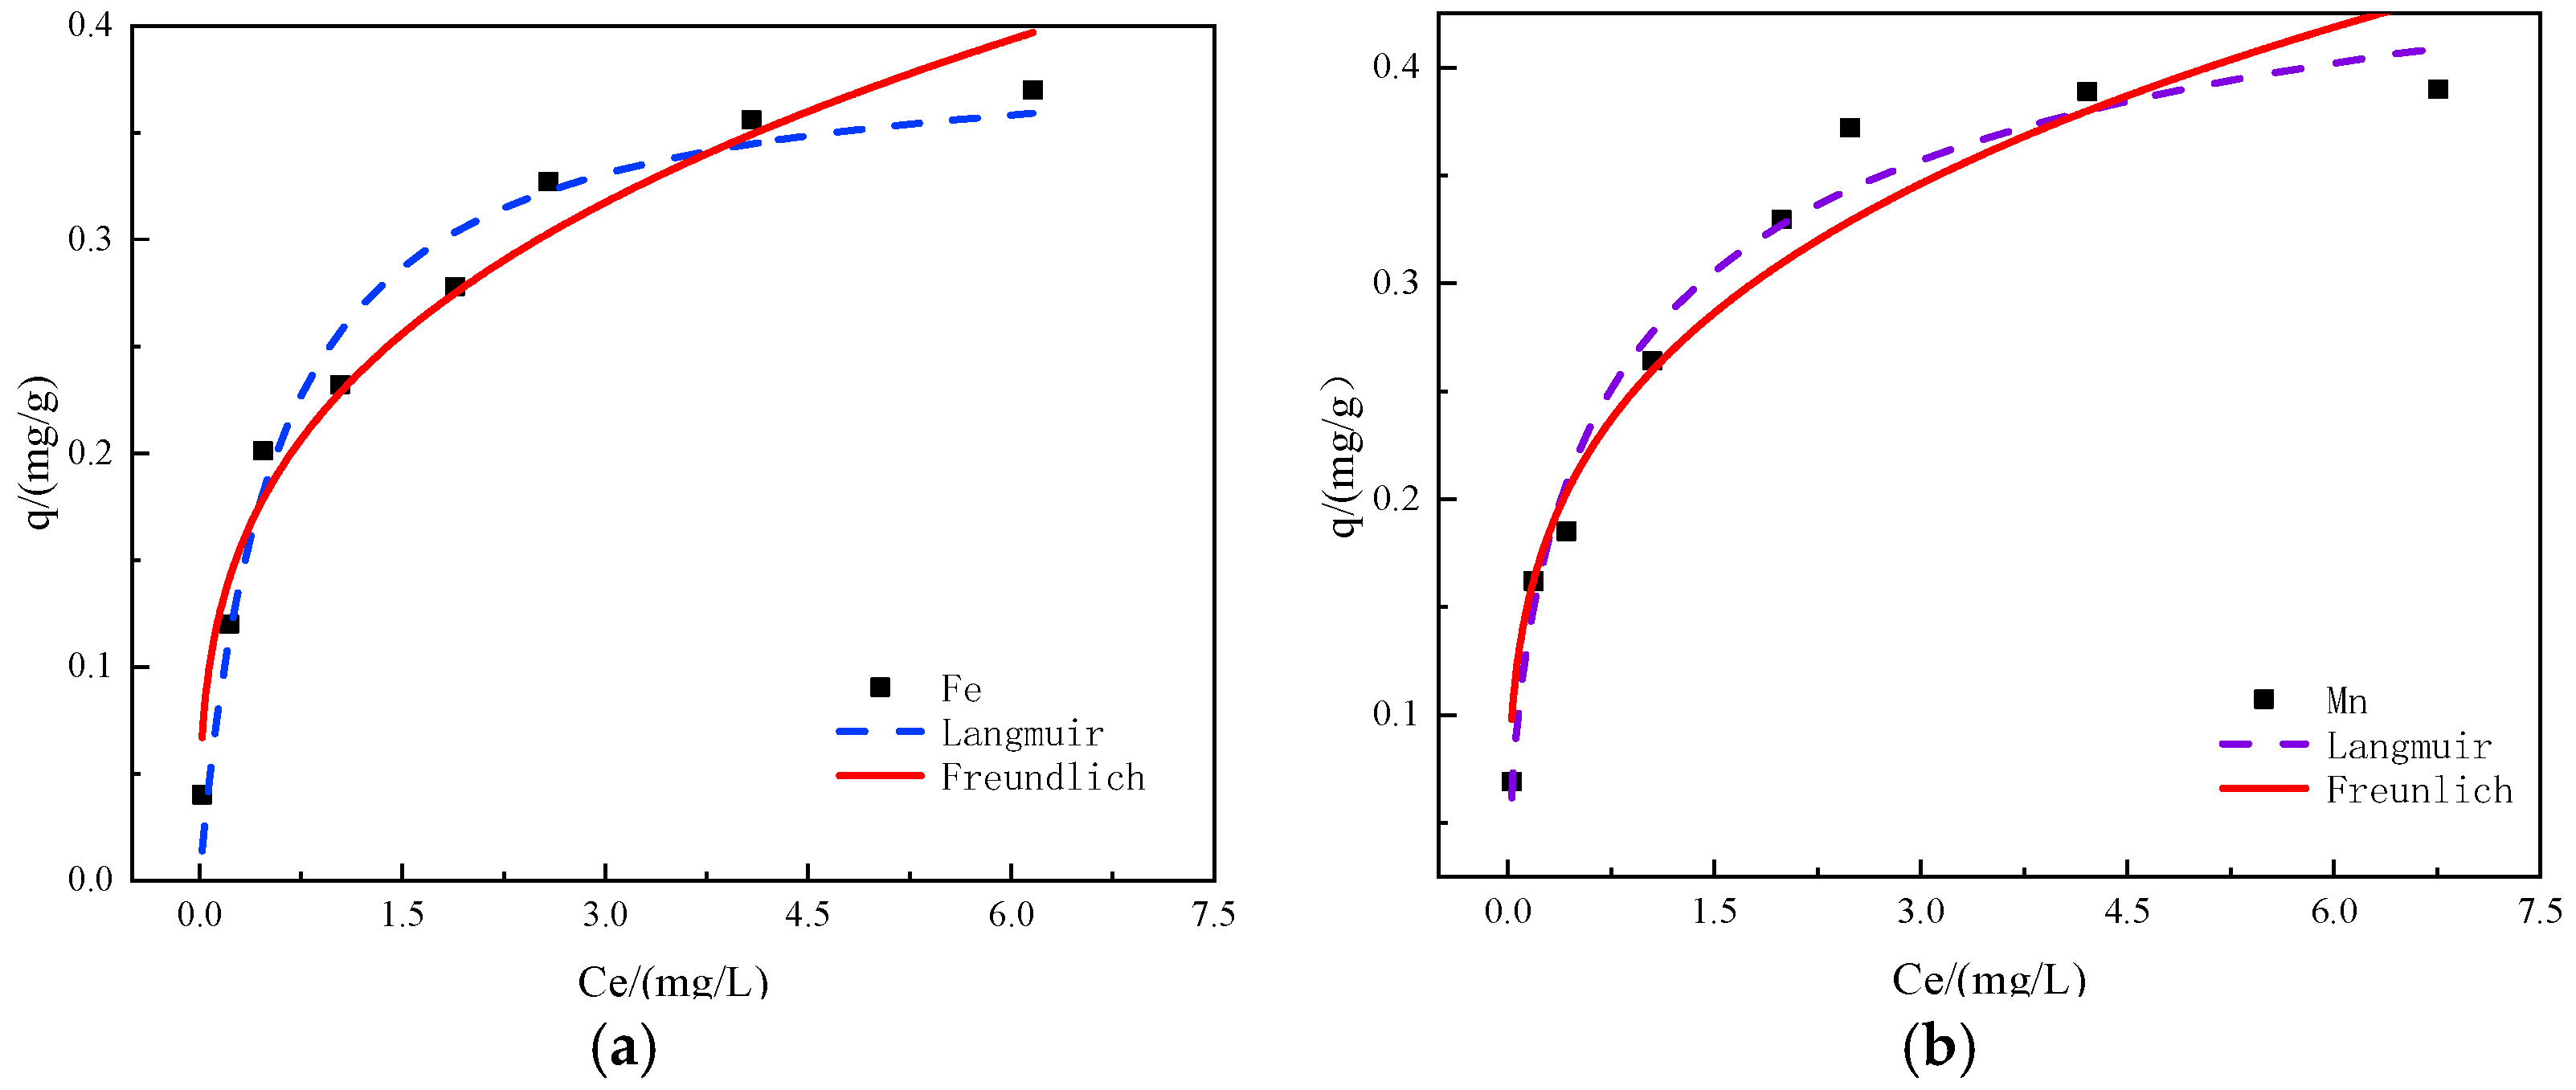
3.8. Analysis of Adsorption Isotherm Model
We used the Langmuir and Freundlich models to fit the adsorption process. The thermodynamic model parameters are shown in Table 7. The Langmuir and Freundlich isotherm models showed a good linear relationship in Figure 10. It can be seen from Table 7 that R2L was greater than R2F. Obviously, the determination coefficient of the Langmuir isotherm equation was closer to 1, and the fitting effect was good. The adsorption of the ions by manganese sand was a single-layer surface chemical adsorption. In the quasi-second-order kinetic model, the adsorption reaction was assumed to be a single-layer adsorption system, and the adsorption mechanism was chemical adsorption, which was consistent with the fitting result of the adsorption isotherm.
4. Conclusions
In this study, we investigated the interaction of three variables (pH, the manganese sand dosage, and the initial concentration ratio of Fe/Mn) on the removal of iron and manganese ions using RSM. We first determined the optimal experimental range of the three factors through single-factor experiments. ANOVA explained the significance of the factors, and the results proved the accuracy of the model. To determine the interactions between the input variables, we developed a three-dimensional response surface. The isothermal model of the adsorption process and the adsorption mechanism were also investigated.
- (i)
- The Box–Behnken experimental design results showed that the interaction between the pH value and the dosage was the most obvious for iron removal. The interaction between the dosage and the initial concentration ratio of iron to manganese was the most obvious for manganese removal;
- (ii)
- The results of response surface optimization showed that when pH was 7.20, the amount of adsorbent was 3.54 g/L, and when the initial concentration ratio of iron and manganese ions was 3.80, the adsorption rates of iron and manganese ions by manganese sand was higher, reaching 83.62% and 76.10%;
- (iii)
- The adsorption of iron and manganese ions by manganese sand followed the Langmuir isotherm adsorption model and the quasi-second-order kinetic model. The modified manganese sand had a remarkable adsorption effect on iron and manganese ions and thus can be used as a good material for a new type of ion adsorbent.
Author Contributions
Conceptualization, H.K. and Y.L.; methodology, D.L.; software, D.L.; validation, H.K. and L.X.; formal analysis, L.X.; investigation, H.K.; resources, Y.L.; data curation, L.X.; writing—original draft preparation, D.L. and Y.L.; writing—review and editing, H.K.; visualization, Y.L.; supervision, H.K.; project administration, H.K.; funding acquisition, H.K. and L.X. All authors have read and agreed to the published version of the manuscript.
Funding
This research was funded by the Department of Science and Technology of Liaoning province (Grant No. 20170520224).
Institutional Review Board Statement
Not applicable.
Informed Consent Statement
Not applicable.
Data Availability Statement
Not applicable.
Conflicts of Interest
The authors declare no conflict of interest.
References
- Zhao, L.; Zhou, L.; Li, G.; Zhang, F.; Li, T. Distribution and genetic analysis of iron and manganese microbial community in soil and groundwater of mining area. Environ. Chem. 2021, 40, 1464–1479. [Google Scholar]
- Zhang, W.; Zhu, J. Iron and Manganese Pollution in Groundwater and Its Treatment Methods. Guangdong Chem. Ind. 2018, 45, 163–164. [Google Scholar]
- Yu, D.; Zhou, J.; Chen, J. Spatial distribution characteristics and genesis of groundwater with high iron and manganese content in Kashi Prefecture, Xinjiang. Environ. Chem. 2020, 39, 3235–3245. [Google Scholar]
- Adeyeye, O.; Xiao, C.; Zhang, Z.; Liang, X. State, source and triggering mechanism of iron and manganese pollution in groundwater of Changchun, Northeastern China. Environ. Monit. Assess 2020, 192, 619. [Google Scholar] [CrossRef] [PubMed]
- Tan, W.; Wang, Y.; Yu, C.; Pan, Z. Treatment of groundwater with high iron and manganese by modified zeolite. Chin. J. Environ. Eng. 2013, 7, 2203–2207. [Google Scholar]
- Fleming, R.E.; PONK, A.P. Iron overload in human disease. N. Engl. J. Med. 2012, 366, 348–359. [Google Scholar] [CrossRef] [Green Version]
- Santra, S.; Agrawal, D.; Kumar, S.; Mishra, S.S. Incidence and prevalence of chronic iron poisoning and it’s management: A review. Int. J. Pharma Bio Sci. 2014, 5, 722–737. [Google Scholar]
- Ferreira, D.C.; Graziele, I.; Marques, R.C.; Gonçalves, J. Investment in drinking water and sanitation infrastructure and its impact on waterborne diseases dissemination: The Brazilian case. Sci. Total Environ. 2021, 779, 146–279. [Google Scholar] [CrossRef]
- Ghazi, M.M.; Qomi, M.H. Removal of manganese from an aqueous solution using micellar-enhanced ultrafiltration (MEUF) with SDS surfactants. Adv. Environ. Technol. 2015, 1, 17–23. [Google Scholar]
- Bright, K.A.; Baah, S.N.; Elizabeth, V.K.; Nkrumah, I.; Williams, C. Adsorptive Removal of Iron and Manganese from Groundwater Samples in Ghana by Zeolite Y Synthesized from Bauxite and Kaolin. Water 2019, 11, 1912. [Google Scholar]
- Bruins, J.H. Manganese Removal from Groundwater: Role of Biological and Physico-Chemical Autocatalytic Processes; CRC Press: Boca Raton, FL, USA, 2017. [Google Scholar]
- Li, G.; Liang, H.; Yu, H.; Du, X.; Yang, H. Research on manganese removal by chemical auto-catalytic oxidation mechanism involved in active manganese oxides film. Water Wastewater Eng. 2019, 45, 1–5. [Google Scholar]
- Diaz-Alarcón, J.A.; Alfonso-Pérez, M.P.; Vergara-Gómez, I.; Díaz-Lagos, M.; Martínez-Ovalle, S.A. Removal of iron and manganese in groundwater through magnetotacticbacteria. J. Environ. Manag. 2019, 249, 109381. [Google Scholar] [CrossRef] [PubMed]
- Elsheikh, M.A.; Guirguis, H.S.; Fathy, A. Removal of Iron and Manganese from Groundwater: A Study of Using Potassium Permanganate and Sedimentation. Mansoura Eng. J. 2017, 42, 7–12. [Google Scholar]
- Marsidi, N.; Hasan, H.A.; Abdullah, S.R.S. A review of biological aerated filters for iron and manganese ions removal in water treatment. J. Water Process Eng. 2018, 23, 1–12. [Google Scholar] [CrossRef]
- Shrestha, S.; Dhami, A.K.; Nyachhyon, A.R. Adsorptive Removal of Fe (II) By NaOH Treated Rice Husk: Adsorption Equilibrium And Kinetics. Sci. World 2021, 14, 75–82. [Google Scholar] [CrossRef]
- Arafat, M.; Marzouk, S.Y.; El Monayeri, O.D. Hybrid system for iron and manganese reduction from polluted water using adsorption and filtration. Ain Shams Eng. J. 2021, 12, 2465–2470. [Google Scholar] [CrossRef]
- Li, X.K.; Chu, Z.R.; Liu, Y.J.; Zhu, M.T.; Yang, L.; Zhang, J. Molecular characterization of microbial populations in full-scale biofilters treating iron, manganese and ammonia containing groundwater in Harbin. Bioresour. Technol. 2013, 147, 234–239. [Google Scholar] [CrossRef]
- Guo, F.; Li, X.; Yang, Y. Effect of Filter Material Characteristics on Iron and Manganese Removal Efficiency during Start-up Period of Manganese Sand Filter. China Water 2018, 34, 16–25. [Google Scholar]
- Ye, M.X.; Pan, J.; Chen, P. Study on optimum operation parameters of modified manganese sand filter for treatment of high iron and manganese water containing ammonia nitrogen. Jiangsu Water Resour. 2018, 9, 11–15. [Google Scholar]
- Liu, J.; Zhang, H.L.; You, K.; Yuan, Y.S. Different Filter Material on the Northeast Biological Iron Manganese Removal Effect of Groundwater in the Countryside. Appl. Mech. Mater. 2014, 522, 465–468. [Google Scholar] [CrossRef]
- Eri, I.R.; Hadi, W.; Slamet, A. Clarification of pharmaceutical wastewater with Moringa oleifera: Optimization through response surface methodology. J. Ecol. Eng. 2018, 19, 126–134. [Google Scholar] [CrossRef]
- Dong, X.; Jin, B.; Sun, Y.; Yu, L. Urban gas production from low H2/CO biogas using Re-promoted Ni catalysts supported on modified manganese sand. Fuel 2018, 220, 60–71. [Google Scholar] [CrossRef]
- Agbovi, H.K.; Wilson, L.D. Optimisation of orthophosphate and turbidity removal using an amphoteric chitosan-based flocculant-ferric chloride coagulant system. Environ. Chem. 2019, 16, 599–612. [Google Scholar] [CrossRef]
- Wang, Y.H.; Lv, W.Y.; Zou, X.G.; Shu, R.J.; Huang, J.L.; Yao, K.; Liu, G.G. The study of adsorption mechanism of Cu(Ⅱ) from aqueous solutions by humin with response surface methodology. Acta Sci. Circumstantiae 2017, 37, 624–632. [Google Scholar]
- Chen, T.Y.; Chen, Z.H.; Jin, S.F.; Li, H.S.; Li, G.B.; Liang, H. Effect of pH Value on Treatment of Groundwater Containing High Concentrations of Iron, Manganese and Ammonia Nitrogen. China Water 2015, 31, 1–9. [Google Scholar]
- Wang, Y.Y.; Li, J.Y.; Lu, Y.W. Optimization of Cu2+ adsorption on corncob by response surface methodology. J. Shanghai Ocean Univ. 2020, 29, 355–363. [Google Scholar]
- Agarwal, M.; Patel, D.; Dinker, A. Optimization of Manganese Removal from Water Using Response Surface Methodology. Iran. Technol. 2016, 40, 63–73. [Google Scholar] [CrossRef]
- Agbovi, H.K.; Wilson, L.D. Flocculation optimization of orthophosphate with FeCl3 and alginate using the Box-Behnken response surface methodology. Ind. Eng. Chem. Res. 2017, 56, 3145–3155. [Google Scholar] [CrossRef]
- Yan, Y.P.; Wang, G.; Jiang, S.J.; Wang, L.L. Response surface methodology for optimizing Cu2+ removal by heavy metal flocculant DTAPAM. Acta Sci. Circumstantiae 2021, 41, 2156–2161. [Google Scholar]
Figure 1.
SEM of unmodified manganese sand (a) and modified manganese sand (b).
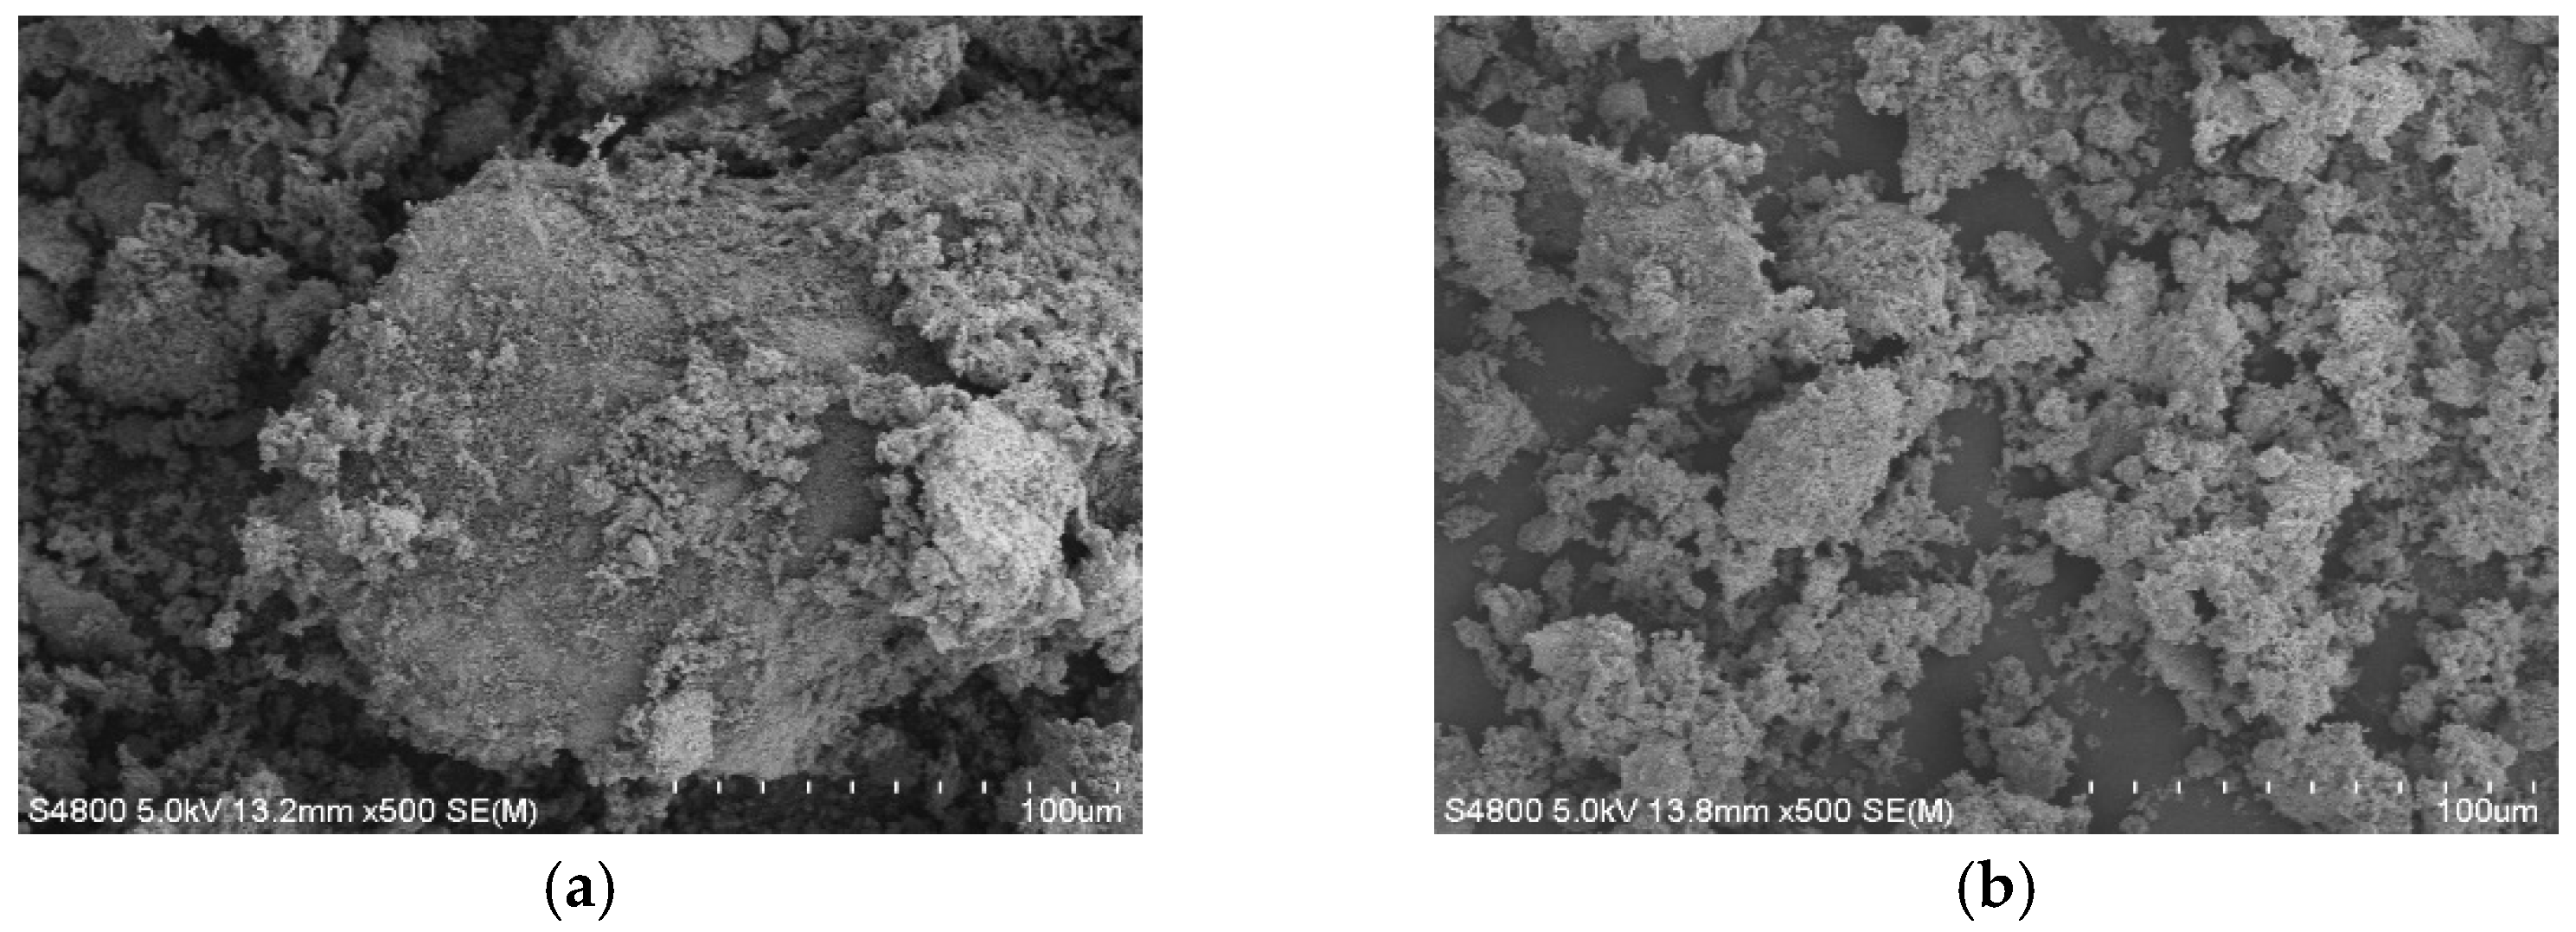
Figure 2.
Nitrogen adsorption–desorption curve.

Figure 3.
Effect of pH on the iron and manganese ions’ removal. R1 is the iron ion removal rate; R2 is the manganese ion removal rate.
Figure 3.
Effect of pH on the iron and manganese ions’ removal. R1 is the iron ion removal rate; R2 is the manganese ion removal rate.
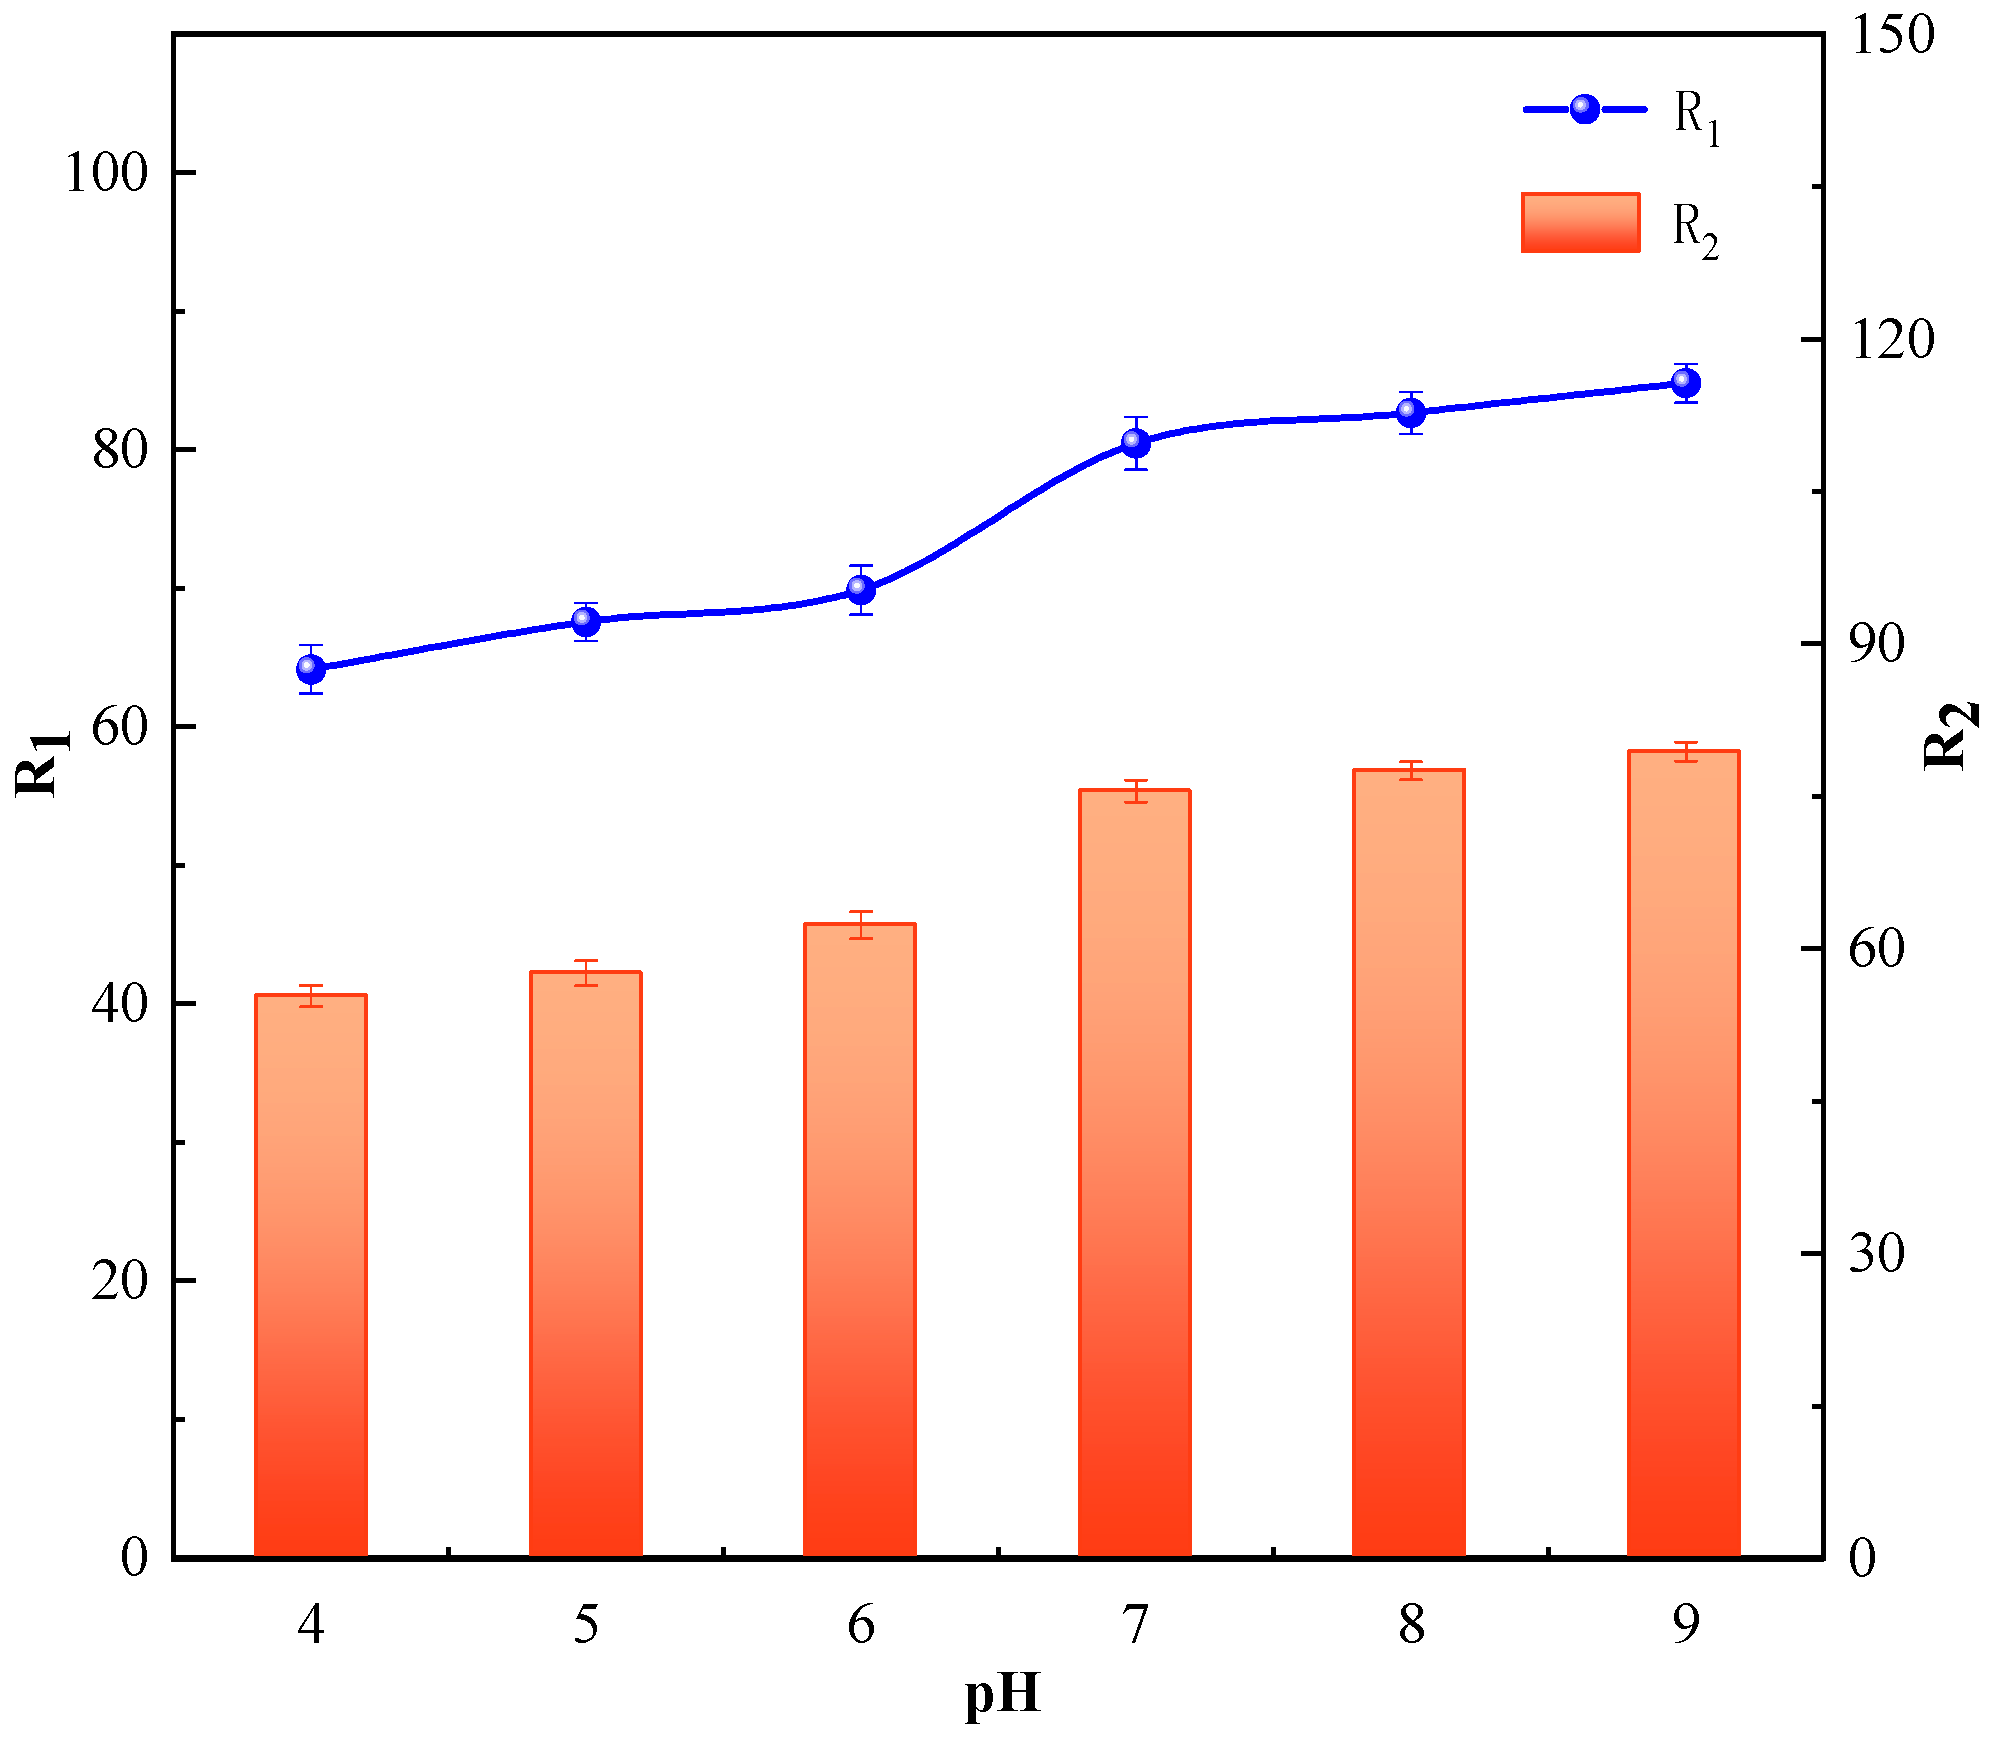
Figure 4.
Effect of manganese sand dosage on the iron and manganese ion removal. R1 is the iron ion removal rate; R2 is the manganese ion removal rate.
Figure 4.
Effect of manganese sand dosage on the iron and manganese ion removal. R1 is the iron ion removal rate; R2 is the manganese ion removal rate.
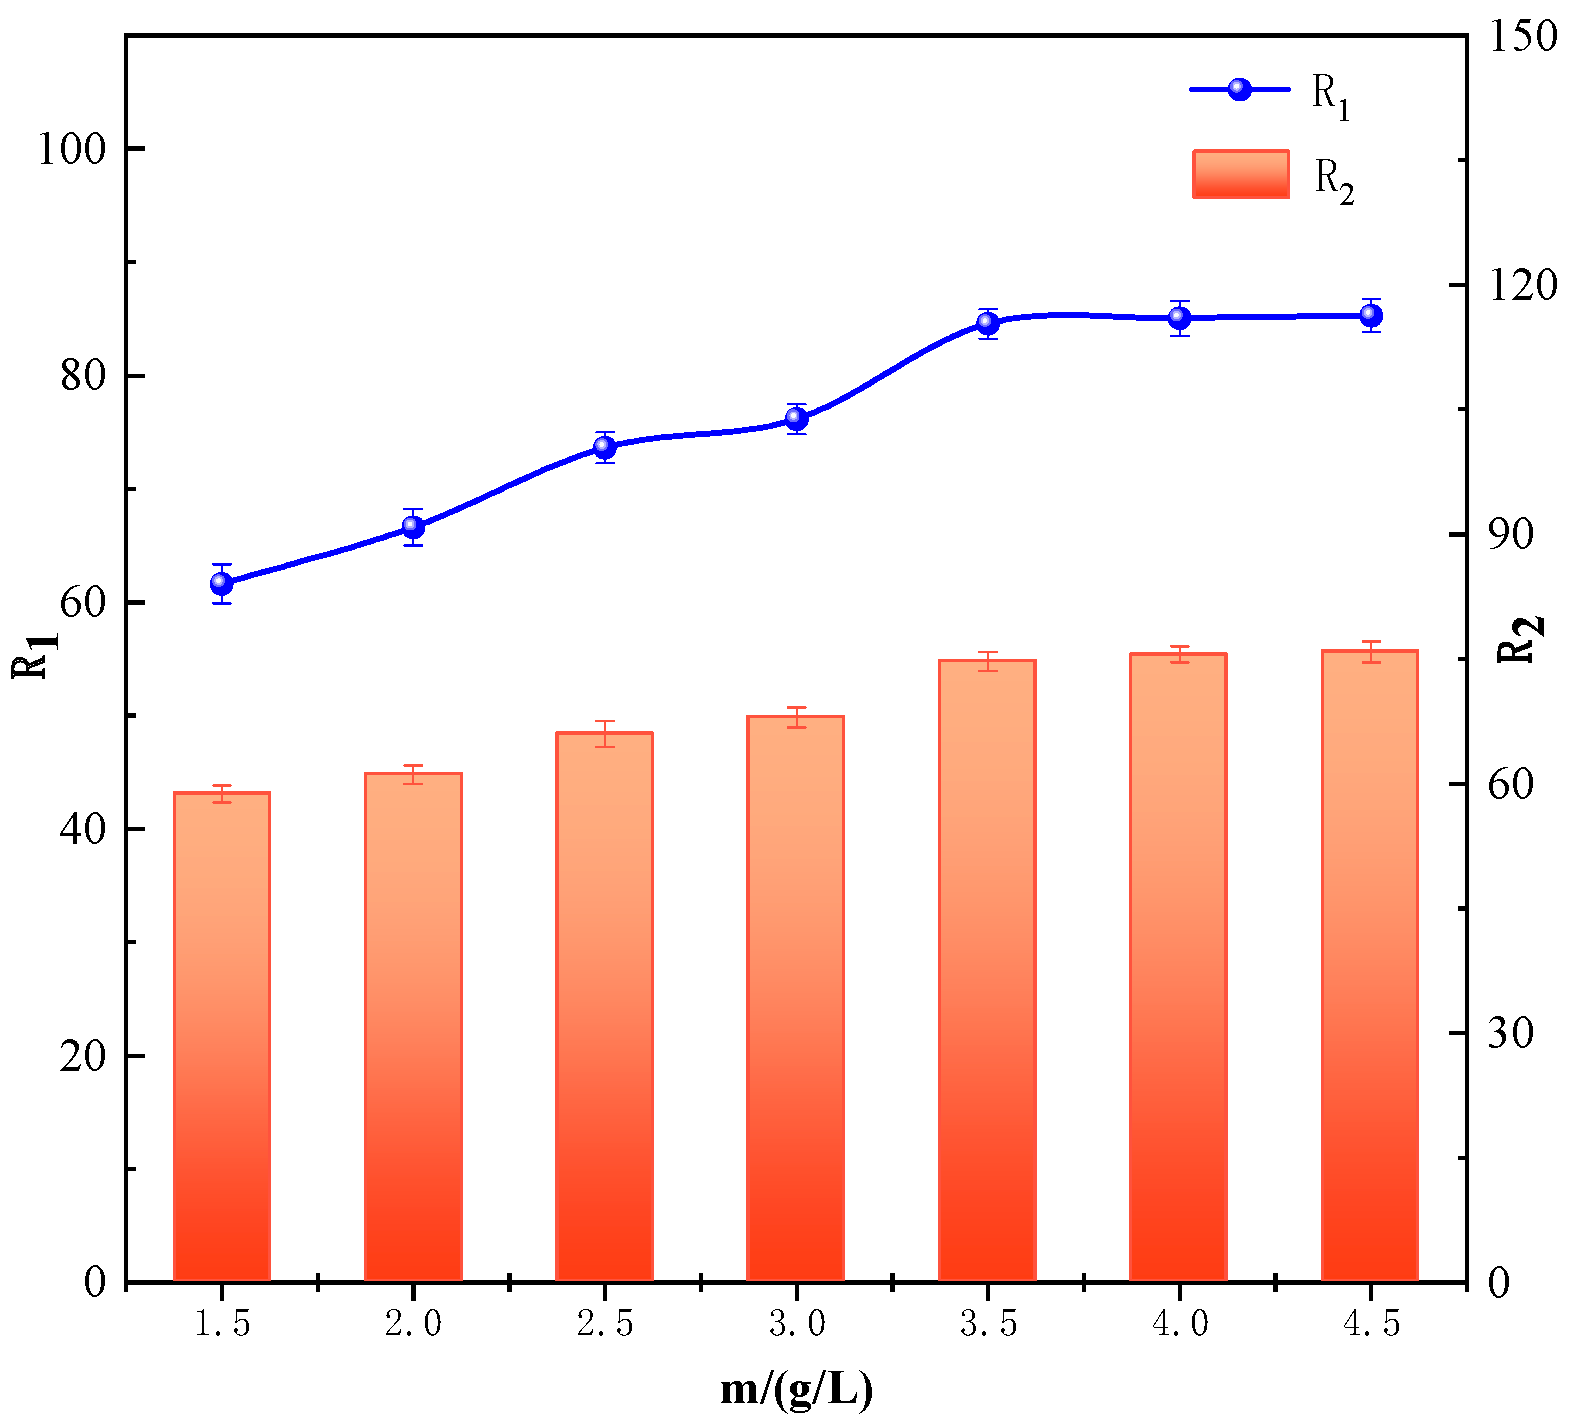
Figure 5.
Effect of the initial concentration ratio of iron and manganese ions on the iron and manganese ions’ removal. R1 is the iron ion removal rate; R2 is the manganese ion removal rate.
Figure 5.
Effect of the initial concentration ratio of iron and manganese ions on the iron and manganese ions’ removal. R1 is the iron ion removal rate; R2 is the manganese ion removal rate.
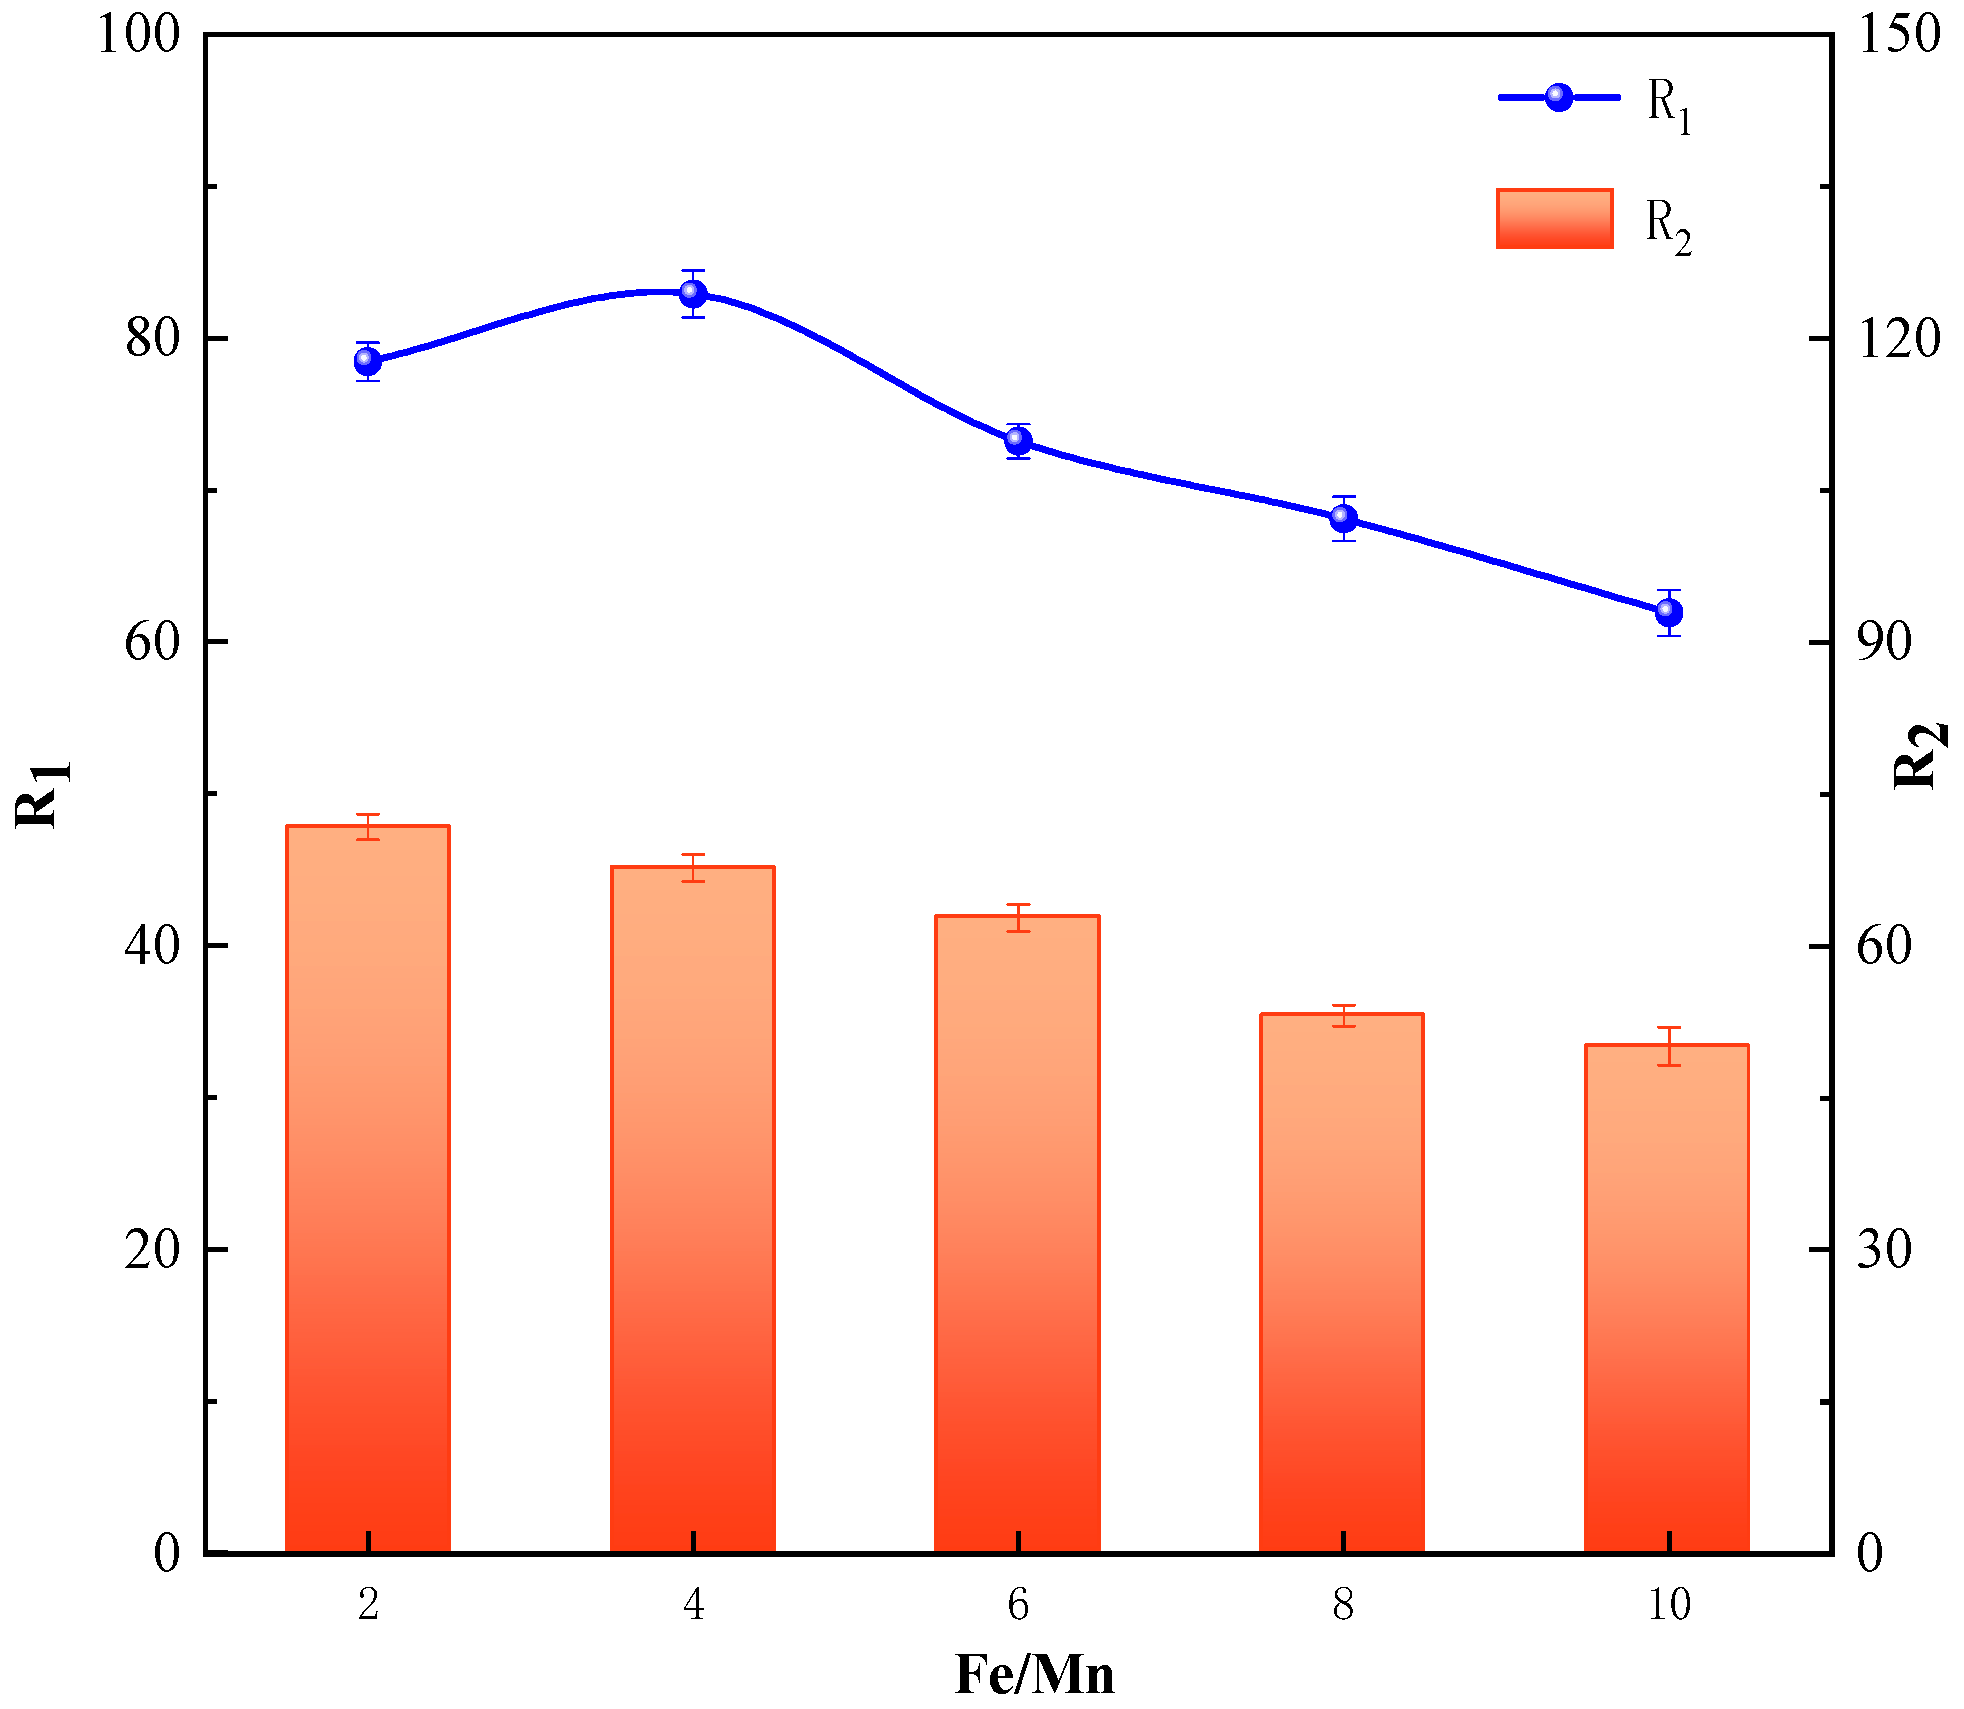
Figure 6.
Residual plots of Fe and Mn ions (a) and plots of predicted vs. actual values (b).

Figure 7.
The 3D response surface diagram of manganese sand dosage and pH (a), initial concentration ratio of Fe/Mn and pH (b), initial concentration ratio of Fe/Mn and manganese sand dosage (c) influence iron ion removal.
Figure 7.
The 3D response surface diagram of manganese sand dosage and pH (a), initial concentration ratio of Fe/Mn and pH (b), initial concentration ratio of Fe/Mn and manganese sand dosage (c) influence iron ion removal.

Figure 8.
The 3D response surface diagram of manganese sand dosage and pH (a), initial concentration ratio of Fe/Mn and pH (b), initial concentration ratio of Fe/Mn and manganese sand dosage (c) influence manganese ion removal.
Figure 8.
The 3D response surface diagram of manganese sand dosage and pH (a), initial concentration ratio of Fe/Mn and pH (b), initial concentration ratio of Fe/Mn and manganese sand dosage (c) influence manganese ion removal.
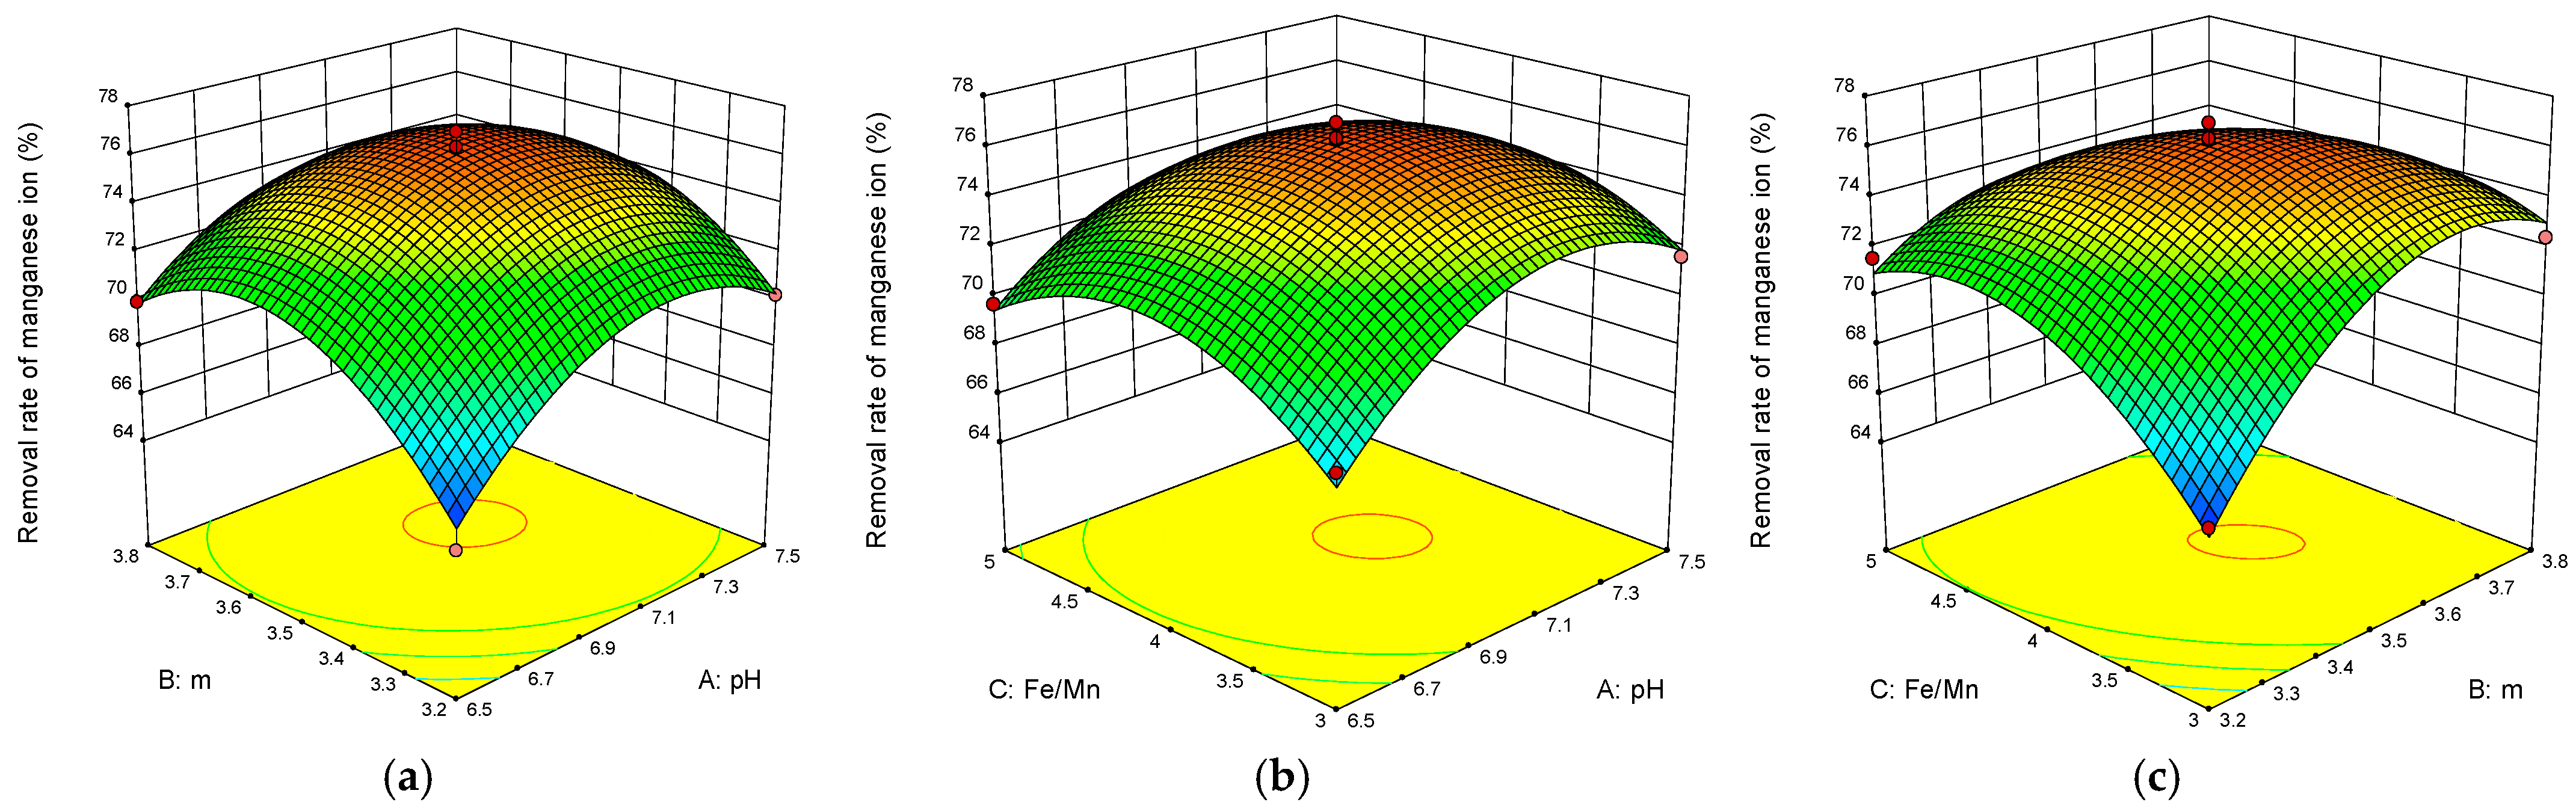
Figure 9.
The adsorption kinetic model of iron (a) and manganese (b) ions.
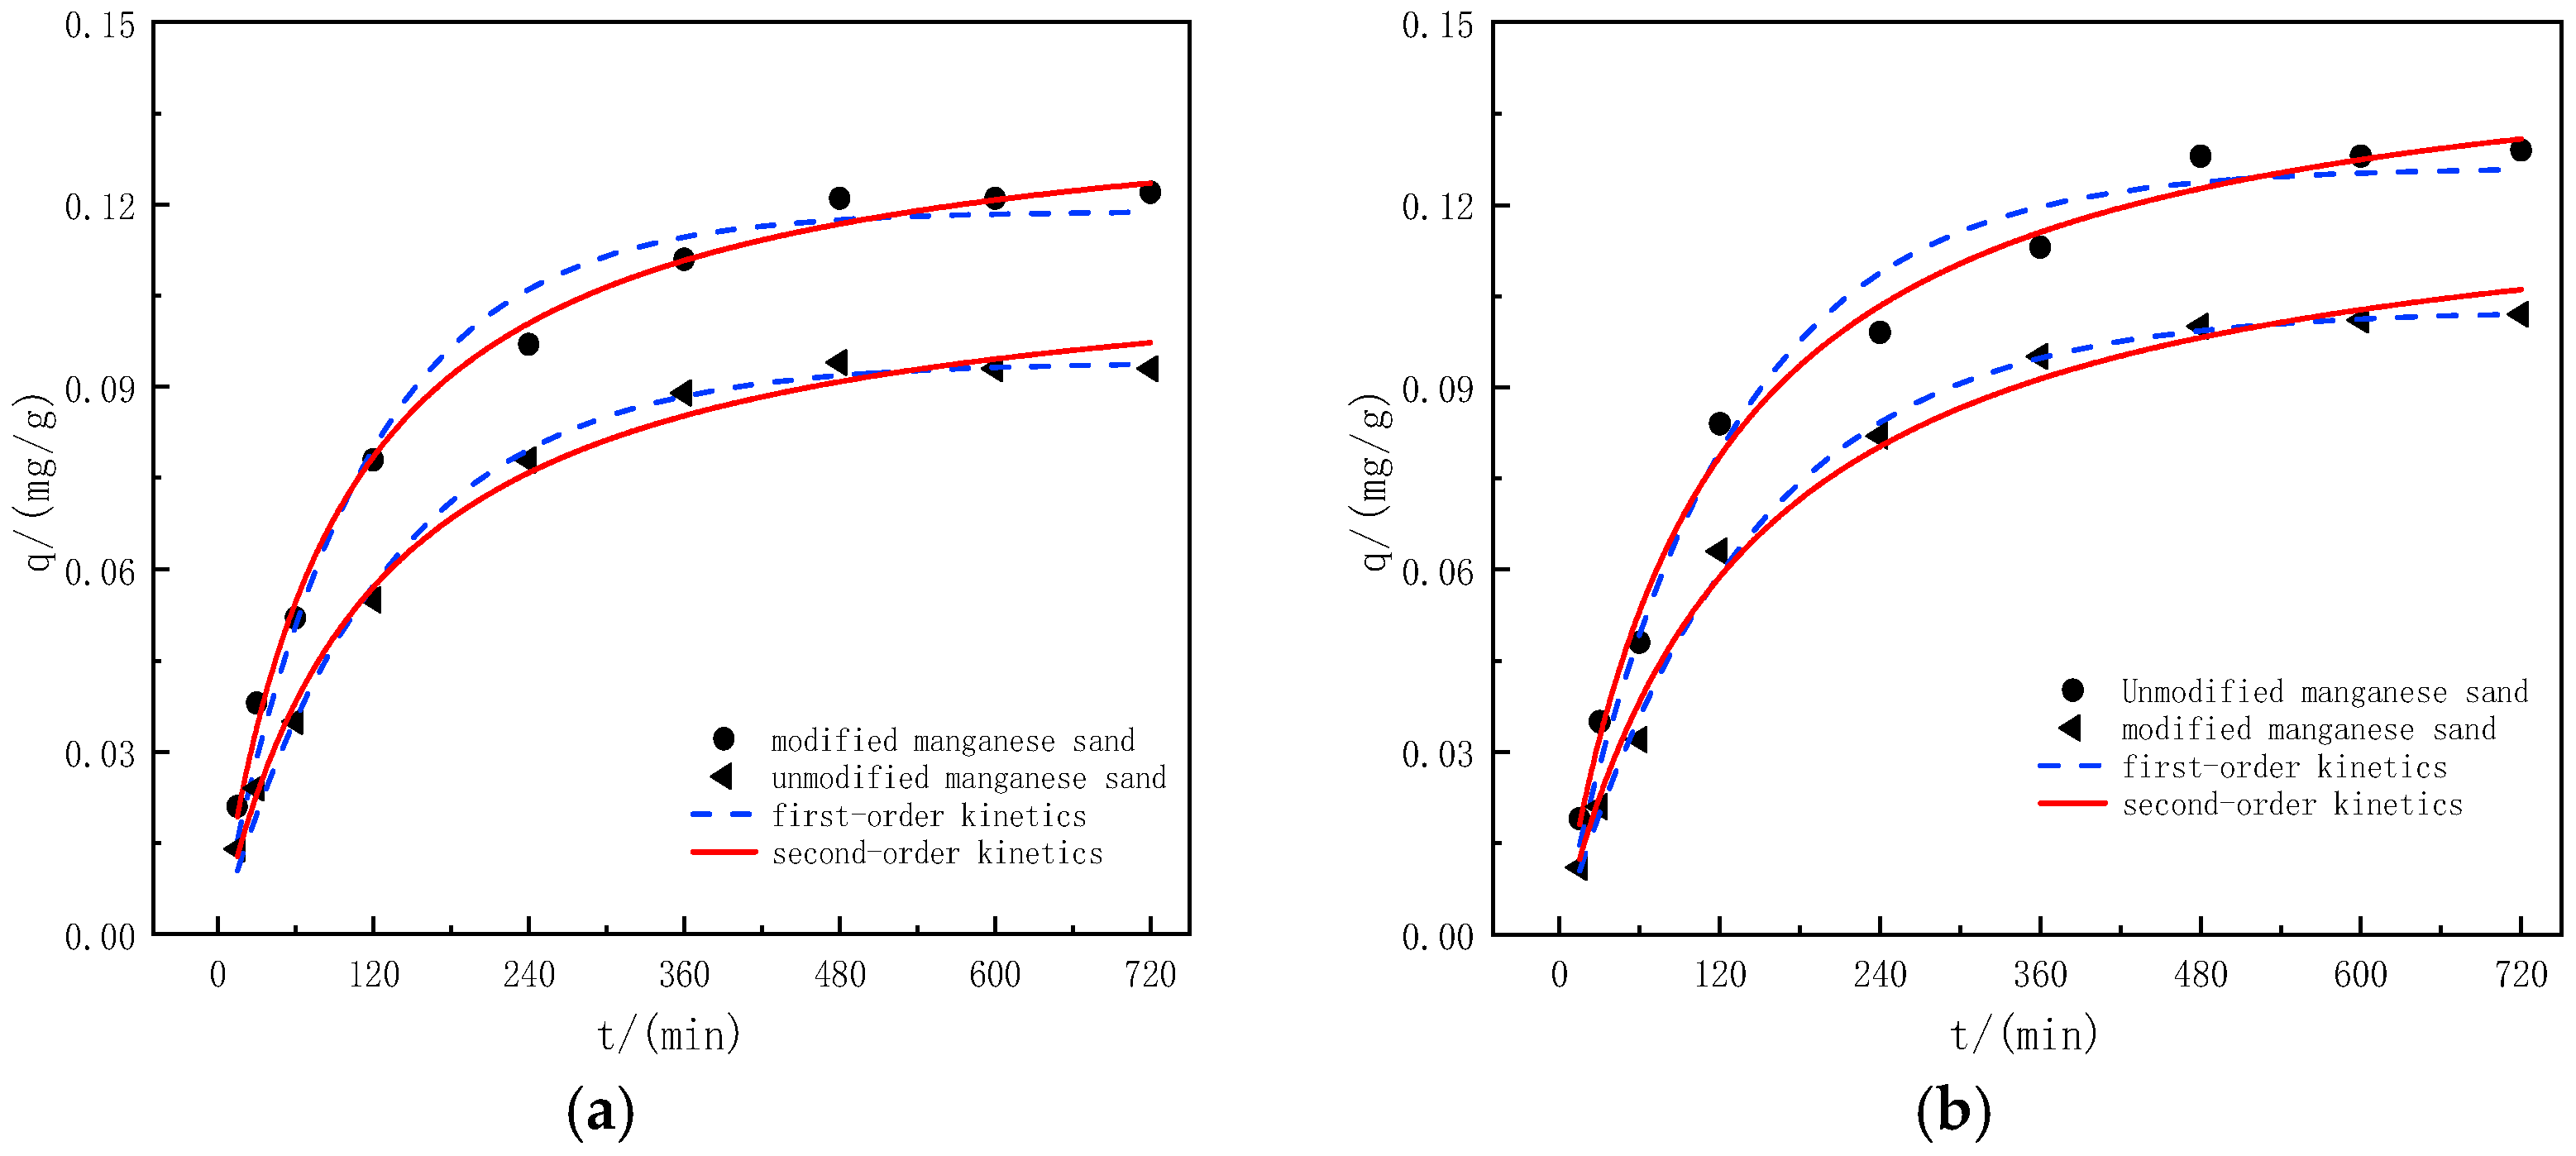
Figure 10.
Adsorption isotherm models of iron (a) and manganese (b) ions.

Table 1.
Variables and experimental design levels for the Box–Behnken design.
| Factors | Code | Levels | ||
|---|---|---|---|---|
| −1 | 0 | 1 | ||
| pH | A | 6.5 | 7 | 7.5 |
| Manganese sand dosage (g/L) | B | 3.2 | 3.5 | 3.8 |
| Initial concentration of Fe/Mn | C | 3 | 4 | 5 |
Table 2.
BET test results of manganese sand.
| Sample | BET Surface Area m2/g | Total Pore Volume cm3/g | Average Pore Size nm |
|---|---|---|---|
| Unmodified manganese sand | 19.281 | 0.060 | 12.451 |
| Modified manganese sand | 24.459 | 0.085 | 15.797 |
Table 3.
Experimental design and results.
| No. | Independent Factors | Removal Rate % | No. | Independent Factors | Removal Rate % | ||||||
|---|---|---|---|---|---|---|---|---|---|---|---|
| A | B | C | Fe2+ | Mn2+ | A | B | C | Fe2+ | Mn2+ | ||
| 1 | −1 | −1 | 0 | 79.92 | 65.24 | 10 | 0 | 1 | −1 | 81.34 | 72.43 |
| 2 | 1 | −1 | 0 | 81.60 | 70.24 | 11 | 0 | −1 | 1 | 80.32 | 71.58 |
| 3 | −1 | 1 | 0 | 78.57 | 69.95 | 12 | 0 | 1 | 1 | 80.52 | 68.17 |
| 4 | 1 | 1 | 0 | 82.81 | 71.94 | 13 | 0 | 0 | 0 | 83.15 | 75.23 |
| 5 | −1 | 0 | −1 | 79.37 | 68.32 | 14 | 0 | 0 | 0 | 83.24 | 76.37 |
| 6 | 1 | 0 | −1 | 83.15 | 71.65 | 15 | 0 | 0 | 0 | 83.29 | 76.95 |
| 7 | −1 | 0 | 1 | 78.74 | 69.72 | 16 | 0 | 0 | 0 | 82.95 | 75.38 |
| 8 | 1 | 0 | 1 | 80.89 | 70.24 | 17 | 0 | 0 | 0 | 83.06 | 76.28 |
| 9 | 0 | −1 | −1 | 81.78 | 66.27 | ||||||
Table 4.
Analysis of variance of regression models.
| Source | Sum of Squares | df | Mean Square | F-Value | p-Value | |||||
|---|---|---|---|---|---|---|---|---|---|---|
| Fe2+ | Mn2+ | Fe2+ | Mn2+ | Fe2+ | Mn2+ | Fe2+ | Mn2+ | |||
| Model | 43.87 | 197.39 | 9 | 4.84 | 21.93 | 279.12 | 30.02 | <0.0001 | <0.0001 | significant |
| A-pH | 17.79 | 14.69 | 1 | 17.79 | 14.69 | 1018.64 | 20.01 | <0.0001 | 0.0029 | |
| B-Dosage | 0.026 | 10.49 | 1 | 0.026 | 10.49 | 1.51 | 14.35 | 0.2582 | 0.0068 | |
| C-Fe/Mn | 3.34 | 0.14 | 1 | 3.34 | 0.14 | 191.30 | 0.219 | <0.0001 | 0.6800 | |
| AB | 1.54 | 2.27 | 1 | 1.54 | 2.27 | 88.04 | 3.10 | <0.0001 | 0.1217 | |
| AC | 0.66 | 1.97 | 1 | 0.66 | 1.97 | 38.03 | 2.70 | 0.0005 | 0.1442 | |
| BC | 0.10 | 22.90 | 1 | 0.10 | 22.90 | 5.86 | 31.34 | 0.0460 | 0.0008 | |
| A2 | 8.52 | 42.09 | 1 | 8.52 | 42.09 | 488.01 | 57.61 | <0.0001 | 0.0001 | |
| B2 | 3.96 | 52.52 | 1 | 3.96 | 52.52 | 226.95 | 71.88 | <0.0001 | <0.0001 | |
| C2 | 5.84 | 35.21 | 1 | 5.84 | 35.21 | 334.41 | 48.19 | <0.0001 | 0.0002 | |
| Residual error | 0.12 | 5.11 | 7 | 0.017 | 0.73 | |||||
| Lack of fit | 0.047 | 3.05 | 3 | 0.016 | 1.02 | 1.07 | 1.97 | 0.5395 | 0.2613 | not significant |
| Pure error | 0.075 | 2.07 | 4 | 0.019 | 0.52 | |||||
| summation | 44 | 202.51 | 16 | |||||||
| C.V.% | 0.16 | Adeq Precision | 45.006 | R2 | 0.9972 | |||||
| 1.20 | 15.392 | 0.9747 | ||||||||
Table 5.
Kinetic fitting parameters of the adsorption of iron ions by manganese sand.
| First-Order Kinetic Equation | Second-Order Kinetic Equation | |||||
|---|---|---|---|---|---|---|
| Qe | k1 | R2 | Qe | k1 | R2 | |
| Unmodified manganese sand | 0.0941 | 0.4701 | 0.9839 | 0.110 | 5.059 | 0.995 |
| Modified manganese sand | 0.1189 | 0.5564 | 0.9772 | 0.139 | 4.828 | 0.998 |
Table 6.
Kinetic fitting parameters of the adsorption of manganese ions by manganese sand.
| First-Order Kinetic Equation | Second-Order Kinetic Equation | |||||
|---|---|---|---|---|---|---|
| Qe | k1 | R2 | Qe | k1 | R2 | |
| Unmodified manganese sand | 0.1026 | 0.4298 | 0.9819 | 0.126 | 3.307 | 0.992 |
| Modified manganese sand | 0.1261 | 0.4961 | 0.9790 | 0.150 | 3.687 | 0.996 |
Table 7.
Constants of Langmuir and Freundlich isotherms.
| Langmuir | Freundlich | |||||
|---|---|---|---|---|---|---|
| KL | qm | R2 | KF | 1/n | R2 | |
| Fe | 1.97 | 0.395 | 0.9908 | 0.2148 | 0.395 | 0.9670 |
| Mn | 2.05 | 0.444 | 0.9918 | 0.2505 | 0.337 | 0.9759 |
Publisher’s Note: MDPI stays neutral with regard to jurisdictional claims in published maps and institutional affiliations. |
© 2022 by the authors. Licensee MDPI, Basel, Switzerland. This article is an open access article distributed under the terms and conditions of the Creative Commons Attribution (CC BY) license (https://creativecommons.org/licenses/by/4.0/).
Share and Cite
MDPI and ACS Style
Kang, H.; Liu, Y.; Li, D.; Xu, L. Study on the Removal of Iron and Manganese from Groundwater Using Modified Manganese Sand Based on Response Surface Methodology. Appl. Sci. 2022, 12, 11798. https://doi.org/10.3390/app122211798
AMA Style
Kang H, Liu Y, Li D, Xu L. Study on the Removal of Iron and Manganese from Groundwater Using Modified Manganese Sand Based on Response Surface Methodology. Applied Sciences. 2022; 12(22):11798. https://doi.org/10.3390/app122211798
Chicago/Turabian StyleKang, Han, Yan Liu, Dan Li, and Li Xu. 2022. "Study on the Removal of Iron and Manganese from Groundwater Using Modified Manganese Sand Based on Response Surface Methodology" Applied Sciences 12, no. 22: 11798. https://doi.org/10.3390/app122211798
Note that from the first issue of 2016, this journal uses article numbers instead of page numbers. See further details here.