
Methodology for the Assessment of Multi-Hazard Risk in Urban Homogenous Zones


1
Faculty of Civil Engineering, Architecture and Geodesy, University of Split, 21000 Split, Croatia
2
Faculty of Electrical Engineering, Mechanical Engineering and Naval Architecture, University of Split, 21000 Split, Croatia
3
Engineering Department, University of Ferrara, 44121 Ferrara, Italy
*
Author to whom correspondence should be addressed.
Appl. Sci. 2022, 12(24), 12843; https://doi.org/10.3390/app122412843
Submission received: 27 October 2022
/
Revised: 24 November 2022
/
Accepted: 9 December 2022
/
Published: 14 December 2022
(This article belongs to the Special Issue Natural-Hazards Risk Assessment for Disaster Mitigation)
Abstract
:The multi-hazard risk assessment of urban areas represents a comprehensive approach that can be used to reduce, manage and overcome the risks arising from the combination of different natural hazards. This paper presents a methodology for multi-hazard risk assessment based on Spatial Multi-Criteria Decision Making. The PROMETHEE method was used to assess multi-hazard risks caused by seismic, flood and extreme sea waves impact. The methodology is applied for multi-hazard risk evaluation of the urban area of Kaštel Kambelovac, located on the Croatian coast of the Adriatic Sea. The settlement is placed in a zone of high seismic risk with a large number of old stone historical buildings which are vulnerable to the earthquakes. Being located along the low-lying coast, this area is also threatened by floods due to climate change-induced sea level rises. Furthermore, the settlement is exposed to flooding caused by extreme sea waves generated by severe wind. In the present contribution, the multi-hazard risk is assessed for different scenarios and different levels, based on exposure and vulnerability for each of the natural hazards and the influence of additional criteria to the overall risk in homogenous zones. Single-risk analysis has shown that the seismic risk is dominant for the whole pilot area. The results of multi-hazard assessment have shown that in all combinations the highest risk is present in the historical part of Kaštel Kambelovac. This is because the historical part is most exposed to sea floods and extreme waves, as well as due to the fact that a significant number of historical buildings is located in this area.
1. Introduction
Natural hazards are threatening the population throughout the world more than ever. Efficient planning and preparation are vital, since the question “will the disaster happen?”, has changed into “when will it happen?”. Enhancing the safety and resilience for disasters requires knowledge about individual territorial hazards, vulnerabilities and risks. Appropriate multi-risk methodology based on existing data and knowledge should produce an interactive and easily understanding map that will enable the visualization of individual and combined risks. Integration of this methodology into the Geographic Information System gives important information to local and regional authorities for preventing, managing and overcoming multi-hazard natural disasters [1], such as river and sea floods, meteotsunamis (or extreme sea waves) and earthquakes. To reduce the possible loss of life and damage to property caused by hazards [2], it is crucial to conduct risk assessments and make decisions pertaining to natural hazards before the hazards occur [3].
A common practice in the hazard risk assessment is to focus on the hazard frequency and intensity in combination with area vulnerability or severity of damage caused by the hazard [4]. Furthermore, the severity is not just the result of hazard intensity and area vulnerability, but it is also influenced by the coping capacity of the emergency units in the area [5]. Hazard occurs in some periods with particular intensity and causes damage in relation to area vulnerability and coping capacity. A brief literature survey was made among scientific and professional papers to investigate what are the common factors used to calculate the risk of natural hazards (Table 1).
Table 1 shows that hazard frequency (or probability of occurrence) is the most common factor used in risk assessment. Some approaches are focused on hazard intensity and some of them on vulnerability in combination with damage or loss. However, half of the papers dealing with multi-hazard approach are taking into account all three emphasized factors—frequency, intensity and vulnerability—including other factors. In the context of the multi-hazard risk assessment, many factors are used. Since each factor can represent one criterion, evaluation of these factors can be used as an input matrix for the Multi-Criteria Analysis (MCA). The reason for using so many criteria (factors) for multi-hazard risk assessments is due to its complexity. According to the standard for risk assessment IEC 31010:2009 [14], the risk assessment is the overall following process: risk identification, risk analysis and risk evaluation, and it is recommended to use multi-criteria analysis or multi-criteria decision-analysis method for the risk assessment.
The problem of the multi-hazard risk assessment is not just in designing a proper calculation to aggregate all hazard risks in one area [15,16], but also to take into account hazards’ mutual correlation [9], since one hazard can trigger another one. For instance, fire is usually spread after earthquakes, and earthquakes can produce tsunamis, thus flooding the area.
Although the world is dealing with hazards that have an increasing frequency, like flood disasters that are caused by extreme climate and urbanization processes [17], another problem of the single-hazard or multi-hazard risk assessment lies in a specific type of hazards. There are specific hazards, earthquakes, for instance, that can be represented as low-probability/high-consequence events [10]. This issue represents a large problem, as earthquakes can have high intensity while their frequency is usually very low, so the risk calculation of multiplying intensity and frequency will result in a low risk level. Therefore, additional factors need to be taken into calculation to emphasize the risk from earthquakes and similar hazards that are low-probability/high-consequence events.
Vulnerability is one of the most important factors in the risk assessment [18]. Namely, high vulnerability of some areas can result in severe losses during a low-intensity hazard, and low vulnerability can result in minor losses during a high-intensity hazard. Many different criteria are used for vulnerability calculation, because the criteria set is also defined by the type of hazard [4]. However, assessing the vulnerability to natural hazards such as earthquakes can be characterized as an ill-structured problem or a problem without unique, identifiable and objectively optimal solution. A review of the literature indicates a number of contrasting definitions of what vulnerability means, as well as numerous conflicting perspectives on what should or should not be included within the broad assessment of vulnerability in cities [19]. For instance, some authors also include coping capacity (emergency units) of the area in the vulnerability analysis [5]. But this is not necessarily a good approach, since coping capacity is something that can dynamically change each year, and other common vulnerability criteria (building age, building structure, building height, etc.) are less or more static. Furthermore, it is important to mention that different vulnerability analyses are used at different scales [20]. The different criteria sets (factors) are used and sometimes different methods must be used, as well.
The aim of this study is the assessment of multi-hazard risk for Kaštel Kambelovac, a small city placed along the Adriatic Sea near the city of Split, Croatia (Figure 1).
Due to its location in a zone of high seismic risk and considering the large number of stone-made and several-centuries-old historical buildings, Kaštela is a settlement with pronounced seismic vulnerability and risk [18]. The historical center, built right next to the low-lying coast, is also threatened by floods due to rising sea levels caused by climate change. Furthermore, the settlement is exposed to flooding caused by extreme sea waves generated by severe wind. Therefore, the present multi-hazard risk assessment is aimed at determining the combined risk of the settlement caused by earthquakes, sea floods and extreme sea waves. The multi-hazard risk investigation of the Kaštel Kambelovac is a part of the project “Preventing, managing, and overcoming natural-hazards risks to mitigate economic and social impact” (PMO-GATE) [24].
The main challenge in the multi-hazard risk assessment is to evaluate, use and mutually compare different mathematical variables that describe the hazard’s frequency, intensity and vulnerability. In this research, this issue is addressed by using the multi-criteria analysis that is commonly used to evaluate and compare quantitative and qualitative criteria in completely different units and the order of magnitude. However, a proper multi-criteria analysis must be selected. An additional challenge in the multi-hazard risk assessment is the data collection and evaluation, which can become complex on the settlement or regional level. Therefore, a proper spatial analysis must be used to organize and aggregate spatial thematic layers. Accordingly, the Geographic Information System is used in combination with multi-criteria analysis in order to establish a Spatial Multi-Criteria Decision Making system.
2. Methodology
The methodology used in this research relies on the combination of the Multi-Criteria Analysis/Multi-Criteria Decision-Making (MCA/MCDM) and Geographic Information System (GIS) to evaluate and visualize this risk assessment in this particular area. The advantage of GIS is in its ability to visualize spatial data (Figure 2) and enhance the spatial decision-making in the risk assessment [25,26,27].
Furthermore, GIS supports the usage of the multi-scale approach and different criteria sets: the vulnerability analysis can be made for each building, the whole settlement, the settlement’s municipality, and for the whole region. The multi-scale approach was discussed in the already-mentioned paper by Vicente et al. [20], but greater contribution was given by Aubrecht et al. [28] that presented multi-level geospatial modeling of vulnerability indicators from building level to country level. Another example of a multi-level and multi-criteria approach is presented in Figure 3.
Regarding the risk assessment, it is usually made for a particular assessment area. These areas need to be defined by mutual spatial characteristics or by some already defined urban entity.
The first and simplest approach is to use some administrative areas as assessment areas: settlements, municipalities, provinces, counties, etc. This approach was used in the combined seismic and flood risk assessment for municipalities in the province of Ferrara [15].
The second approach is the definition of assessment areas as “working units” by using a grid of blocks. The working unit is the geographical entity in which the calculations will be computed, hereby controlling the geographical resolution of the study. The definition of the working unit depends strongly on two factors: the geographical unit in which the original data is expressed and the scale of the study. For instance, in the urban-scale seismic risk study for city Almería, a 200 m squared grid was considered appropriate to cover the entire city of Almería, totaling an amount of 400 equal cells or working units [27].
The third approach is to define assessment areas as “homogeneous zones”, which are generated by intersecting relevant thematic layers in the assessment area. The intersection of the defined number of layers becomes an assessment area (zone). This approach has been used in this research for Croatian settlement Kaštel Kambelovac, a part of Kaštela City.
2.1. Multi-Criteria Analysis and Decision-Making Approach to Risk Assessment
In the analysis of natural hazards, impacts are often expressed in terms of hazard, vulnerability and exposure. A hazard (H) presents the probability that a harmful event will appear in a particular area and in a certain time interval. Vulnerability (V) is defined as the characteristics and circumstances of a community, system or asset that make it susceptible to the damaging effects of a hazard. Exposure (E) is the totality of people, property, systems or other elements present in hazard zones that are thereby subject to potential losses.
In this research, the hazard (H) is presented by seismic hazard maps with a Peak Ground Acceleration—PGA for the earthquake, while, in the case of sea floods and extreme sea waves, it is based on a flood depth and a wave height in inundation areas, respectively. The exposure (E) that corresponds to the measure of hazard will be presented by intensity and Area Impact (e.g., area exposed to earthquake, flood or extreme waves). Furthermore, vulnerability is evaluated by vulnerability index on multiple levels (for the particular building, for the settlement, etc.) with the use of additional criteria set which is different for each level. Therefore, in this research, function f represents mathematical PROMETHEE (Preference Ranking Organisation METHod for Enrichment Evaluations) method [29] that will connect all criteria and assess the risk for the observed area.
Obviously, there are many other mathematical methods for multi-criteria analysis and decision-making, but some of them are better accepted and more widely used. Three of them have recently become the most popular: AHP [25], TOPSIS [26] and PROMETHEE [30,31]. There is also a need to decide which of the available methods is the most adequate for a particular problem, but very often, the outranking methods like PROMETHEE are the most suitable choice [32]. This is especially because PROMETHEE method can be simplified to be used by non-expert users [33,34].
Furthermore, using the concept of vulnerability makes it more explicit that the impacts of a hazard are also a function of the preventive and preparatory measures that are employed to reduce the risk. Depending on the particular risk analyzed, the measurement of risk can be carried out with a greater number of different variables and factors, depending inter alia on the complexity of the chain of impacts, the number of impact factors considered and the requisite level of precision. The scheme of assessment of single-hazard and multi-hazard exposure for the investigated coastal urban area is shown in Figure 4.
2.2. Risk Assessment of Buildings
In this research, the risk assessment is made for different levels, starting from the lowest level (micro level), i.e., an individual building. At this micro level, the risk assessment of a single-hazard exposure is based on the calculation of vulnerability indexes of buildings for individual natural disasters:
- -
- Flood vulnerability index for buildings,
- -
- Extreme coastal waves vulnerability index for buildings,
- -
- Seismic vulnerability index for buildings,
as well as on assessment of the single hazards:
- -
- Flood hazard,
- -
- Extreme coastal waves hazard,
- -
- Seismic hazard.
Seismic vulnerability indexes of the buildings for investigated area are calculated according to the seismic vulnerability method [35]. The method is based on the evaluation of 11 geometrical, structural and non-structural vulnerability parameters of the building. They consider the influence of the type and quality of the structural system, the shear resistance in two horizontal directions, the position and the foundations, the properties of floors, the configuration in plan and elavation, the maximum wall spacing, the roof’s typology and weight, the existence of non-structural elements, and the state of preservation. Four possibilities for each parameter were decided: from “A”, indicating an optimal state, to “D”, indicating a poor state. The relative importance of each parameter in the overall vulnerability is computed by using weight coefficients relating to each parameter. Finally, the vulnerability index Iv is calculated in a form , where svi is the numerical score for each class, and wi is the weight of each parameter. The vulnerability index is normalized in a 0–100% range; a low index indicates high seismic resistance and low vulnerability, while a high vulnerability index is characteristic of the buildings with low seismic resistance and high vulnerability. Vulnerability indexes of the buildings located in the pilot area are presented in Figure 5 [35].
The flood vulnerability index and the extreme coastal waves vulnerability index are calculated according to the methodology developed in the PMO-GATE project [25]. This methodology is based on the approach of Miranda and Ferreira [36], which takes into consideration different parameters such as building material, overall object condition, number of storeys, building age, importance of exposed objects and level of exposure. The approach has been modified for application in the multicriteria analysis, with each vulnerability index calculated as the weighted sum of set of parameters and evaluated through vulnerability classes (Figure 6).
The seismic hazard for Croatia is presented with two maps for return periods of 475 and 95 years, expressed in terms of the peak ground acceleration during an earthquake for a soil class A [37]. According to HRN EN 1998-1:2011 [36], the soil types A, B, C, D and E, may be used to account for the influence of local ground conditions on the seismic action. The site can be classified according to the value of the average shear wave velocity vs,30. An investigation of the deep geology and characteristics of the terrains, performed at pilot area [38], has shown that shear wave velocity vs,30 is higher than 800 m/s at the wholearea, which define soil class A. Therefore, local ground conditions do not influence to seismic hazard in the investigated area, i.e., the seismic hazard for all buildings at the pilot area has been assumed to be constant [35].
The flood hazard caused by climate-induced sea level rise is estimated according to IPCC Fifth Assessment Report (AR5) [39] and Strategy for climate change adaptation for The Republic of Croatia [40], considering changes in the mean sea level. However, the EU Flood Directive [41] requires an analysis of a high, moderate and low probability scenario in the flood hazard assessment. The sea level in the Adriatic Sea is dominantly caused by sea tides and the effect of the barometric pressure [42]. The tidal component can be represented by the set of periodic functions [43], and the residual sea level can be represented with a probability distribution due to its randomness and stochastic behavior. In order to fulfil the Flood Directive requirements, probability scenarios are estimated from the particular probability distribution, corresponding to the return periods of 25, 100 and 250 years, respectively [44]. Finally, sea level is estimated as a superposition of mean sea level, maximum estimated tide and each probabilistic scenario. The distribution of the critical zones most prone to flood due to the impacts of climate change on sea level rise for the most critical scenario for year 2100 is shown in Figure 7 [45].
The extreme coastal waves hazard is determined based on the evaluation of wave heights and their propagation toward the coast (Figure 8). The methodology for computing the wave heights by using values of wind speeds in critical wind directions for the investigated area has been developed [46], where probability distribution function is used to fit wind speed histograms and to evaluate return period values.
Vulnerability indexes of buildings for individual natural disasters coupled by the corresponding hazards are the basis for the multi-hazard risk assessment of the area [47].
2.3. Risk Assessment of Homogenous Zones
At the higher level of analysis, which is the intermediate level, the previously-analyzed objects are grouped into spatial units (assessment area) that are called “homogeneous zones” [47]. The process of creation of homogenous zones for the pilot site is presented in Figure 9. In this case, three different layers are intersected: a layer of specific urban characteristics, a layer of areas surrounded by the main roads and a layer of terrain height.
The seismic vulnerability indexes of individual buildings are used to calculate the seismic vulnerability index of a homogeneous zone. In the same way, the other vulnerabilities indexes are evaluated. However, it is important to highlight that the additional criteria are very important at this level of analysis. Since homogeneous zones have complex characteristics, additional criteria are used for both single-hazard and a multi-hazard approach, beside vulnerability and hazard.
The literature review shows that the level of risk to the community depends on a number of other parameters whose activation in a particular hazard reduces the resilience to extraordinary events. Each area due to difference in size requires a special approach in identifying the relevant parameters. For example, the most common parameters (criteria) for seismic hazard are grouped into area characteristics (geology, soil, slope, historical earthquake events, fault line, etc.), the characteristics of human intervention in space (land use, built communal infrastructure and roads, etc.), and social characteristics (housing density, social purpose of buildings, social structure, etc.).
For the pilot site at the intermediate level, additional parameters that can be quantified are detected, different for each homogeneous zone. They represent additional criteria for the risk assessment of homogenous zones: communal infrastructure, road network, construction density (distance between buildings), inhabitation density, importance factor (public building, school, etc.), and historical buildings.
3. Results
3.1. Single-Hazard Risk Asssessment of Homogenous Zones
Single-hazard risk assessment is made for 14 homogeneous zones of the pilot site. Since the flood and extreme waves are affecting only a small coastal area, the seismic risk assessment will be presented here. The input data are calculated, or expert estimates are given for the following criteria:
- -
- Seismic hazard—PGA,
- -
- Buildings’ seismic vulnerability,
- -
- Geology,
- -
- Communal infrastructure—electricity supply,
- -
- Communal infrastructure—water supply and drainage,
- -
- Road network,
- -
- Construction density (distance between buildings),
- -
- Inhabitation density,
- -
- Importance factor (public, school, etc.),
- -
- Historical buildings.
Since seismic hazard (PGA) and geology have the same values in each of the 14 homogeneous zones, they do not need be included in the numerical processing. The average seismic vulnerability has been calculated for each homogenous zone (Table 2).
The criterion inhabitation density is generated from a digitized population census. For all other additional criteria a profound GIS analysis has been made, and criteria evaluations for each homogenous zone have been calculated or estimated (Figure 10).
All the above-mentioned data have been collected into the decision matrix to be used by the PROMETHEE method with the help of Visual PROMETHEE software (Figure 11).
The preliminary results of the PROMETHEE method are given in Figure 12, in which better rank represents higher risk. It means that the best-ranked homogenous zone HZ13 has the highest seismic risk in this case.
Visual representation of the results has been made in GIS, where green represents low risk and red represents high risk (Figure 13).
3.2. Multi-Hazard Risk Asssessment of Homogenous Zones
Three natural-hazards—seismic, flood and extreme waves—are combined and evaluated together to assess the multi-hazard risk, and the analysis is made on the level of homogenous zones.
The two combined risk analysis are made: combination of two risks for seismic and flood hazard; and combination of three risks for seismic, flood and extreme waves hazard. Each analysis is made on three levels. The first level of analysis is based on hazard and vulnerability data aggregated for each homogenous zone. A second and third level of analysis are using additional criteria for each homogenous zone (Table 3).
Therefore, six multicriteria analyses are made on three different levels for each of the two scenarios. These multi-criteria analyses are classifying homogenous zones in accordance with multi-hazard risk.
The first analysis is the combined seismic-flood risk (Scenario S-F) on three different levels. Each level represents different criteria sets. Criteria are grouped in two major groups: main criteria, which are related to hazard and vulnerability and additional criteria, which are related to some important spatial data. Each criteria group has its own weight. In this case, an equal weight is given to each group—50%. An example of distribution of the criteria weights within the group are presented in Table 4. Criteria weights in this particular application are estimated comparing the estimated Expected Annual Damage values for each observed natural hazard. The Expected Annual Damage concept is based on the combination of occurrence probability and corresponding damage caused by each natural hazard [48], and it has proved to be an effective method since it enables a practical comparison of significantly different natural phenomena.
The input data for analysis is presented as a matrix with alternatives, in this case 14 homogenous zones (HZ) and up to 11 criteria depending on the level of analysis (Figure 14).
The input data (Figure 14) and criteria weights (Table 4) are imported in a multi-criteria analysis application based on the PROMETHEE method and results have been calculated for all three levels of analysis. The first analysis was made for the criteria set defined as Level 1, a second analysis for Level 2 and a third for Level 3. The criteria for each analysis were submitted to PROMETHEE method and the results for all three levels are presented in Figure 15, Figure 16 and Figure 17, respectively. There are no significant variations in results except zone HZ 13, which becomes more exposed when additional criteria are used (Level 1 and 2). At the end, the results are exported into GIS for better visualization and a further analysis of results (Figure 18).
The second analysis is a combined seismic–flood–extreme waves risk (Scenario S-F-EW) on three different levels. Again, each level represents different criteria sets, and criteria are grouped into two groups: main criteria, which are related to hazard and additional criteria, which are related to some important spatial data. Each criteria group has its own weight. In this case, an equal weight is given to each group: 50%. Other criteria weights are presented in Table 5. The input data for analysis are presented as a matrix with alternatives, in this case 14 homogenous zones (HZ) and up to 13 criteria depending on the level of analysis (Figure 19).
The input data (Figure 19) and criteria weights (Table 5) are imported in a multi-criteria analysis application based on PROMETHEE method and results have been calculated for all three levels of analysis. The first analysis was made for a criteria set defined as Level 1, a second analysis for Level 2 and a third for Level 3. The criteria for each analysis were submitted to PROMETHEE method and the results for all 3 levels are presented in Figure 20, Figure 21 and Figure 22, respectively. Again, there are no significant variations in results except zone HZ 13, which becomes more exposed when additional criteria are used (Level 1 and 2). At the end, the results are exported into GIS for better visualization and a further analysis of results (Figure 23).
4. Conclusions
The multi-hazard risk assessment of urban areas is an important step in the risk management process. It can be used to reduce, manage and overcome the risks arising from the combination of different multiple hazards. This paper uses Spatial Multi-Criteria Decision-Making based on PROMETHEE method, coupled with the Geographic Information System, to assess the single-hazard and multi-hazard risk caused by seismic, sea floods and extreme sea waves. A case study for the application of the method is Kaštel Kambelovac, an urban settlement placed at the Croatian part of the Adriatic coast. The observed area has been divided into the homogenous zones that have been identified as areas of the test site with some mutual spatial characteristics. The homogeneity was identified by intersecting spatial layers in the GIS. The multi-hazard risk assessment method is based on the validation of the main components of the risk caused by natural hazard phenomena, such us vulnerability expressed in terms of the vulnerability index, hazard and influence of additional criteria, to overall risk in homogenous zones. The main specificity of this research is multi-hazard risk evaluation based on a previous detailed calculation of vulnerability indexes of each building in the test area for all observed threats.
The methodology ranks the various homogenous zones in terms of the relative proneness to coupled seismic, sea floods and extreme sea waves hazards. It enables a risk analysis for different scenarios for both single and multiple hazards at the level of buildings and homogenous zones. In the case study presented here, the analysis has shown that the seismic risk is a dominant threat in all scenarios. The results of a multi-hazard analysis for the combination of seismic and sea floods hazard have shown that the area with the highest risk is related to the historical part of Kaštel Kambelovac. This is due to the fact that this area, along with high seismic risk, has the highest level of exposure to flooding. Furthermore, the vulnerability of exposed objects in the historical part is highest for both hazards. Likewise, the results of the multi-hazard analysis for the combination of seismic, sea floods and extreme waves hazard are analogous to previous ones, showing that the highest risk is again in the historical part of Kaštel Kambelovac. The vulnerability of exposed objects to extreme waves is the highest in the historical part, and this particular area is most exposed to extreme waves due its low-lying coast. Performed analyses provide useful information for decision makers and public authorities to define priorities in future interventions through the process of risk management planning.
Author Contributions
Conceptualization, Ž.N. and N.M.; data curation, M.M., N.M. and T.K.; funding acquisition, Ž.N. and E.B.; investigation, Ž.N., N.M., M.M., E.B. and T.K.; methodology, N.M. and M.M. and Ž.N.; software, N.M. and M.M.; supervision, Ž.N. and E.B.; validation, Ž.N., N.M., M.M., E.B. and T.K.; visualization, M.M. and T.K.; writing—original draft, Ž.N., N.M., M.M., E.B. and T.K. All authors have read and agreed to the published version of the manuscript.
Funding
This research was funded by the European Union, Programme Interreg Italy–Croatia, Project “Preventing, managing and overcoming natural-hazards risks to mitigate economic and social impact”—PMO-GATE ID 10046122. The research is also partially supported through project KK.01.1.1.02.0027, co-financed by the Croatian Government and the European Union through the European Regional Development Fund—the Competitiveness and Cohesion Operational Programme.
Institutional Review Board Statement
Not applicable.
Informed Consent Statement
Not applicable.
Data Availability Statement
Some of the datasets that were analyzed in this research are publicly available on the website of PMO-GATE project: https://www.italy-croatia.eu/web/pmo-gate (accessed on 25 October 2022).
Acknowledgments
This research was part of the Work Packages 4 and 5 of the European Union, Programme Interreg Italy–Croatia, Project “Preventing, managing and overcoming natural-hazards risks to mitigate economic and social impact”—PMO-GATE ID 10046122. The results of this research were published in the Deliverables: “4.1.1. Methodology for provision assessment indexes based on Spatial Multi-Criteria Decision-Making—Croatia” and “5.1.6. Map of spatial distribution of the critical zones most prone to flood, extreme waves and seismic risks for HR test site”.
Conflicts of Interest
The authors declare no conflict of interest.
References
- Zerger, A. Examining GIS decision utility for natural hazard risk modelling. Environ. Model. Softw. 2002, 17, 287–294. [Google Scholar] [CrossRef]
- Yum, S.-G.; Son, K.; Son, S.; Kim, J.-M. Identifying Risk Indicators for Natural Hazard-Related Power Outages as a Component of Risk Assessment: An Analysis Using Power Outage Data from Hurricane Irma. Sustainability 2020, 12, 7702. [Google Scholar] [CrossRef]
- Chen, P. On the Diversity-Based Weighting Method for Risk Assessment and Decision-Making about Natural Hazards. Entropy 2019, 21, 269. [Google Scholar] [CrossRef] [PubMed] [Green Version]
- Kappes, M.S.; Keiler, M.; Von Elverfeldt, K.; Glade, T. Challenges of analyzing multi-hazard risk: A review. Nat. Hazards 2012, 64, 1925–1958. [Google Scholar] [CrossRef] [Green Version]
- Greiving, S.; Fleischhauer, M.; Luckenkotter, J. A methodology for an integrated risk assessment of spatially relevant hazards. J. Environ. Plan. Manag. 2006, 49, 1–19. [Google Scholar] [CrossRef]
- Di Mauro, C.; Bouchon, S.M.; Carpignano, A.; Golia, E.; Peressin, S. Definition of Multi-Risk Maps at Regional Level as Management Tool: Experience Gained by Civil Protection Authorities of Piemonte Region. In Atti del 5° Convegno sulla Valutazione e Gestione del Rischio negli Insediamenti Civili ed Industriali; University of Pisa: Pisa, Italy, 2006. [Google Scholar]
- Fleischhauer, M.; Greiving, S.; Schlusemann, B.; Schmidt-Thomé, P.; Kallio, H.; Tarvainen, T.; Jarva, J. Multi-risk assessment of spatially relevant hazards in Europe. In Proceedings of the ESPON, ESMG Symposium, Nürnberg, Germany, 11–13 October 2005. [Google Scholar]
- Kunz, M.; Hurni, L. Hazard maps in Switzerland: State-of-the-art and potential improvements. In Proceedings of the 6th ICA Mountain Cartography Workshop, Lenk, Switzerland, 11–15 February 2008; ICA: Lenk, Switzerland, 2008. [Google Scholar]
- Liu, B.; Siu, Y.L.; Mitchell, G. A quantitative model for estimating risk from multiple interacting natural hazards: An application to northeast Zhejiang, China. Stoch. Environ. Res. Risk Assess. 2017, 31, 1319–1340. [Google Scholar] [CrossRef] [Green Version]
- Mignan, A.; Wiemer, S.; Giardini, D. The quantification of low-probability–high-consequences events: Part I. A generic multi-risk approach. Naural. Hazards 2014, 73, 1999–2022. [Google Scholar] [CrossRef] [Green Version]
- Munich Re Group. Topics—Annual Review: Natural Catastrophes 2002; Munich Re Group: Munich, Germany, 2003. [Google Scholar]
- Odeh Engineers, Inc. Statewide Hazard Risk and Vulnerability Assessment for the State of Rhode Island. Tech. Rep., NOAA Coastal Services Center. Available online: http://www.csc.noaa.gov/rihazard/pdfs/rhdisl_hazard_report.pdf (accessed on 23 October 2019).
- Van Westen, C.J. Multi-hazard risk assessment and decision making. Environ. Hazards Methodol. Risk Assess. Manag. 2017, 31–94. [Google Scholar] [CrossRef]
- IEC 31010:2009; Risk Management—Risk Assessment Techniques. International Organization for Standardization ISO: Geneva, Switzerland, 2009.
- Soldati, A.; Chiozzi, A.; Nikolić, Ž.; Vaccaro, C.; Benvenuti, E. A PROMETHEE Multiple-Criteria Approach to Combined Seismic and Flood Risk Assessment at the Regional Scale. Appl. Sci. 2022, 12, 1527. [Google Scholar] [CrossRef]
- Rocchi, A.; Chiozzi, A.; Nale, M.; Nikolic, Z.; Riguzzi, F.; Mantovan, L.; Gilli, A.; Benvenuti, E. A Machine Learning Framework for Multi-Hazard Risk Assessment at the Regional Scale in Earthquake and Flood-Prone Areas. Appl. Sci. 2022, 12, 583. [Google Scholar] [CrossRef]
- Li, Z.; Song, K.; Peng, L. Flood Risk Assessment under Land Use and Climate Change in Wuhan City of the Yangtze River Basin, China. Land 2021, 10, 878. [Google Scholar] [CrossRef]
- Nikolić, Ž.; Runjić, L.; Ostojić Škomrlj, N.; Benvenuti, E. Seismic Vulnerability Assessment of Historical Masonry Buildings in Croatian Coastal Area. Appl. Sci. 2021, 11, 5997. [Google Scholar] [CrossRef]
- Rashed, T.; Weeks, J. Assessing vulnerability to earthquake hazards through spatial multicriteria analysis of urban areas. Int. J. Geogr. Inf. Sci. 2003, 17, 547–576. [Google Scholar] [CrossRef]
- Vicente, R.; Parodi, S.; Lagomarsino, S.; Varum, H.; Silva, J.A.R.M. Seismic vulnerability and risk assessment: Case study of the historic city centre of Coimbra, Portugal. Bull. Earthq. Eng. 2011, 9, 1067–1096. [Google Scholar] [CrossRef]
- Marinas.com. Kastel Kambelovac Harbour. Available online: https://marinas.com/view/marina/eyc39lv_Kastel_Kambelovac_Harbour_Kastel_Gomilica_Croatia (accessed on 26 October 2022).
- Portal Grada Kaštela. Novosti. Available online: https://www.kastela.org/novosti/aktualnosti/43639-zbog-podizanja-mora-u-vitturiju-pojedinci-odustali-od-glasanja-policija-zatvorila-promet-rivom-u-sucurcu (accessed on 26 October 2022).
- Jutarnji List. Vijesti. Available online: https://www.jutarnji.hr/vijesti/hrvatska/orkansko-jugo-poplavilo-kastel-stafilic-9607921 (accessed on 26 October 2022).
- EU Interreg Italy-Croatia, PMO-GATE Project. Preventing, Managing and Overcoming Natural-Hazards Risks to Mitigate Economic and Social Impact (PMO-GATE). Available online: https://www.italy-croatia.eu/web/pmo-gate/site (accessed on 3 October 2022).
- Palchaudhuri, M.; Biswas, S. Application of AHP with GIS in drought risk assessment for Puruliya district, India. Nat. Hazards 2016, 84, 1905–1920. [Google Scholar] [CrossRef]
- Nyimbili, P.H.; Erden, T.; Karaman, H. Integration of GIS, AHP and TOPSIS for earthquake hazard analysis. Nat. Hazards 2018, 92, 1523–1546. [Google Scholar] [CrossRef]
- Rivas-Medina, A.; Gaspar-Escribano, J.M.; Benito, B.; Bernabé, M.A. The role of GIS in urban seismic risk studies: Application to the city of Almería (southern Spain). Nat. Hazards Earth Syst. Sci. 2013, 13, 2717–2725. [Google Scholar] [CrossRef] [Green Version]
- Aubrecht, C.; Ozceylan, D.; Steinnocher, K.; Freire, S. Multi-level geospatial modeling of human exposure patterns and vulnerability indicators. Nat. Hazards 2013, 68, 147–163. [Google Scholar] [CrossRef]
- Brans, J.P.; Vincke, P.; Mareschal, B. How to select and how to rank projects: The Promethee method. Eur. J. Oper. Res. 1986, 24, 228–238. [Google Scholar] [CrossRef]
- Mladineo, N.; Margeta, J.; Brans, J.P.; Mareschal, B. Multicriteria ranking of alternative locations for small scale hydro plants. Eur. J. Oper. Res. 1987, 31, 215–222. [Google Scholar] [CrossRef]
- Mladineo, N.; Lozic, I.; Stosic, S.; Mlinaric, D.; Radica, T. An evaluation of multicriteria analysis for DSS in public policy decision. Eur. J. Oper. Res. 1992, 61, 219–229. [Google Scholar] [CrossRef]
- Nemery, P. On the Use of Multicriteria Ranking Methods in Sorting Problems. Ph.D. Thesis, Université Libre de Bruxelles, Brussels, Belgium, 2008. [Google Scholar]
- Mladineo, N.; Mladineo, M.; Knezic, S. Web MCA-based decision support system for incident situations in maritime traffic: Case study of Adriatic Sea. J. Navig. 2017, 70, 1312. [Google Scholar] [CrossRef]
- Mladineo, M.; Mladineo, N.; Jajac, N. Project Management in mine actions using Multi- Criteria-Analysis-based decision support system. Croat. Oper. Res. Rev. 2014, 5, 415–425. [Google Scholar] [CrossRef] [Green Version]
- Nikolić, Ž.; Benvenuti, E.; Runjić, L. Seismic Risk Assessment of Urban Areas by a Hybrid Empirical-Analytical Procedure Based on Peak Ground Acceleration. Appl. Sci. 2022, 12, 3585. [Google Scholar] [CrossRef]
- HRN EN 1998-1:2011; Eurocode 8: Design of Structures for Earthquake Resistance. Part 1: General Rules, Seismic Actions and Rules for Buildings. Croatian Standards Institute: Zagreb, Croatia, 2011.
- Miranda, F.N.; Ferreira, T.M. A simplified approach for flood vulnerability assessment of historic sites. Nat. Hazards 2019, 96, 713–730. [Google Scholar] [CrossRef]
- Da Col, F.; Accaino, F.; Bohm, G.; Meneghini, F. Characterization of shallow sediments by processing of P, SH and SV wave-fields in Kaštela (HR). Eng. Geol. 2021, 293, 106336. [Google Scholar] [CrossRef]
- Intergovernmental Panel on Climate Change (IPCC) Fifth Assessment Report (AR5). Available online: https://www.ipcc.ch/assessment-report/ar5/ (accessed on 26 October 2022).
- Strategy for Climate Change Adaptation for Republic of Croatia (Official Gazette NN 46/2020; in Croatian). Available online: https://narodne-novine.nn.hr/clanci/sluzbeni/2020_04_46_921.html (accessed on 26 October 2022).
- Directive 2007/60/EC of the European Parliament and of the Council of 23 October 2007 on the Assessment and Management of Flood Risks. Available online: https://eur-lex.europa.eu/legal-content/EN/TXT/PDF/?uri=CELEX:32007L0060&from=EN (accessed on 26 October 2022).
- Srzić, V.; Lovrinović, I.; Racetin, I.; Pletikosić, F. Hydrogeological Characterization of Coastal Aquifer on the Basis of Observed Sea Level and Groundwater Level Fluctuations: Neretva Valley Aquifer, Croatia. Water 2020, 12, 348. [Google Scholar] [CrossRef] [Green Version]
- Janeković, I.; Kuzmić, M. Numerical Simulation of the Adriatic Sea Principal Tidal Constituents. Ann. Geophys. 2005, 23, 3207–3218. [Google Scholar] [CrossRef] [Green Version]
- EU Interreg Italy-Croatia, PMO-GATE Project. Deliverable 3.1.2. Definition of Flood Exposure Indexes for the HR Test Site. Available online: https://www.italy-croatia.eu/web/pmo-gate/docs-and-tools-details?id=1877461&nAcc=4&file=1 (accessed on 20 October 2022).
- EU Interreg Italy-Croatia, PMO-GATE Project. Deliverable 5.1.6. Map of Spatial Distribution of the Critical Zones Most Prone to Flood, Extreme Waves and Seismic Risks for HR Test Site. Available online: https://www.italy-croatia.eu/web/pmo-gate/docs-and-tools-details?id=1877461&nAcc=6&file=8 (accessed on 20 October 2022).
- EU Interreg Italy-Croatia, PMO-GATE Project. Deliverable 3.2.1. Definition of Extreme Waves Exposure Indexes for the HR Test Site. Available online: https://www.italy-croatia.eu/web/pmo-gate/docs-and-tools-details?id=1877461&nAcc=4&file=9 (accessed on 20 October 2022).
- EU Interreg Italy-Croatia, PMO-GATE Project. Deliverable 4.1.1. Methodology for Provision Assessment Indexes based on Spatial Multi-Criteria Decision Making. Available online: https://www.italy-croatia.eu/web/pmo-gate/docs-and-tools-details?id=1877461&nAcc=5&file=1 (accessed on 20 October 2022).
- Wang, Q.; Liu, K.; Wang, M.; Koks, E.E. A River Flood and Earthquake Risk Assessment of Railway Assets along the Belt and Road. Int. J. Disaster Risk Sci. 2021, 12, 553–567. [Google Scholar] [CrossRef]
Figure 1.
The City of Kaštela: (a) Historical center of Kaštel Kambelovac [21]; (b) Coastal flooding events in the City of Kaštela [22,23].
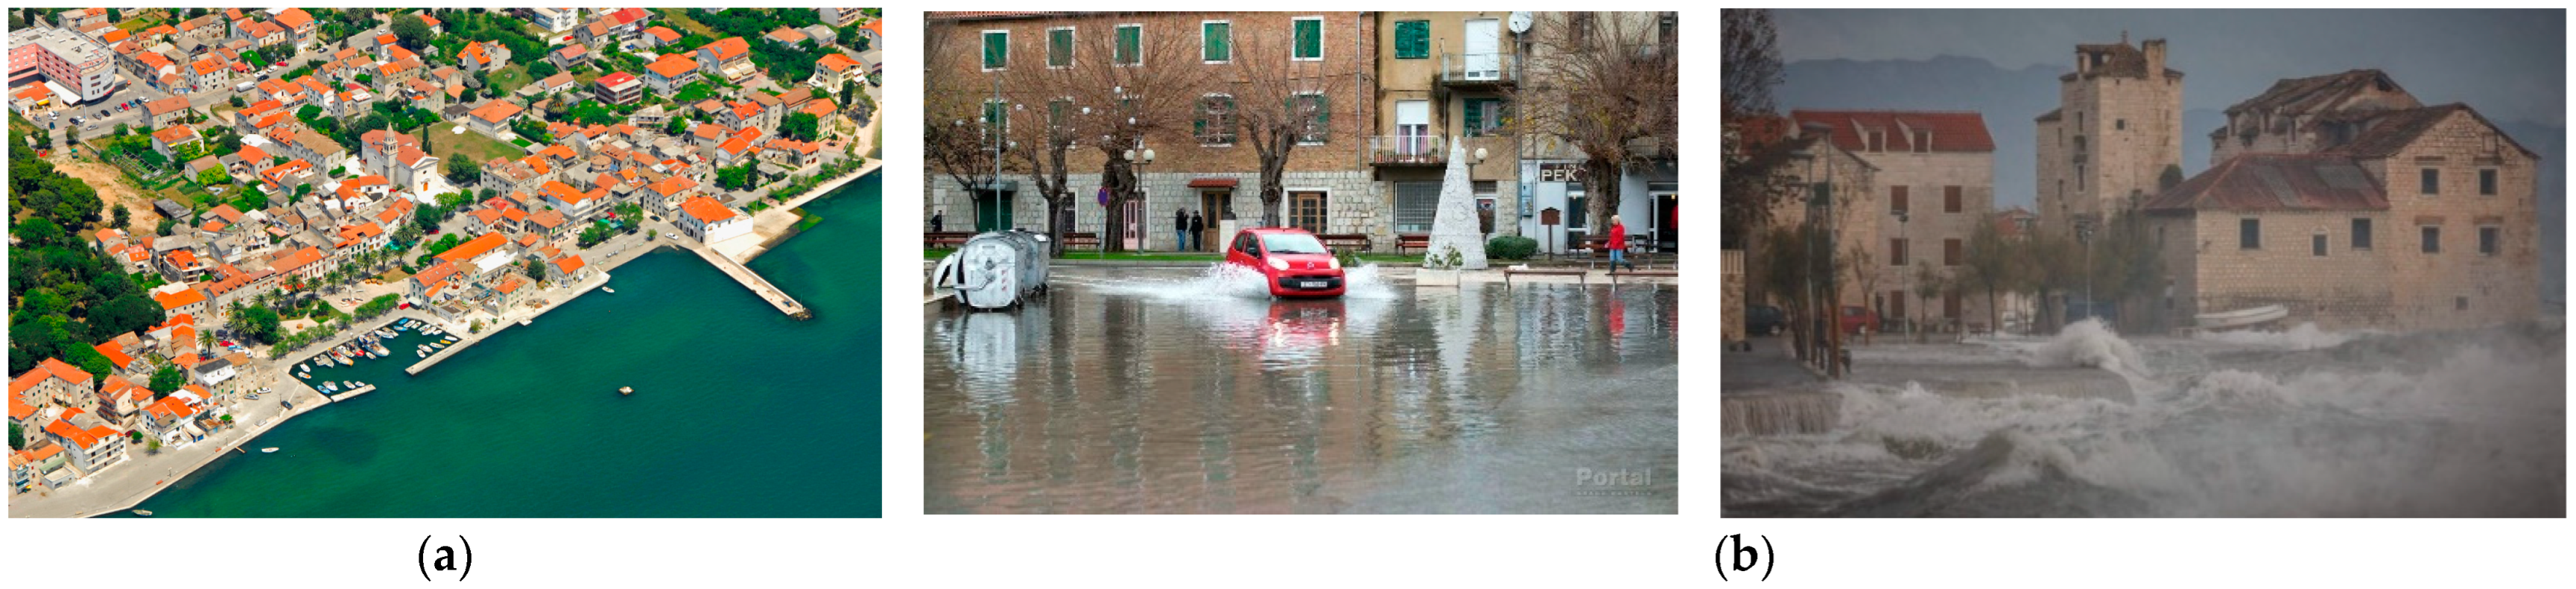
Figure 2.
An example of multiple-risk map for the Ferrara province [15].
Figure 2.
An example of multiple-risk map for the Ferrara province [15].
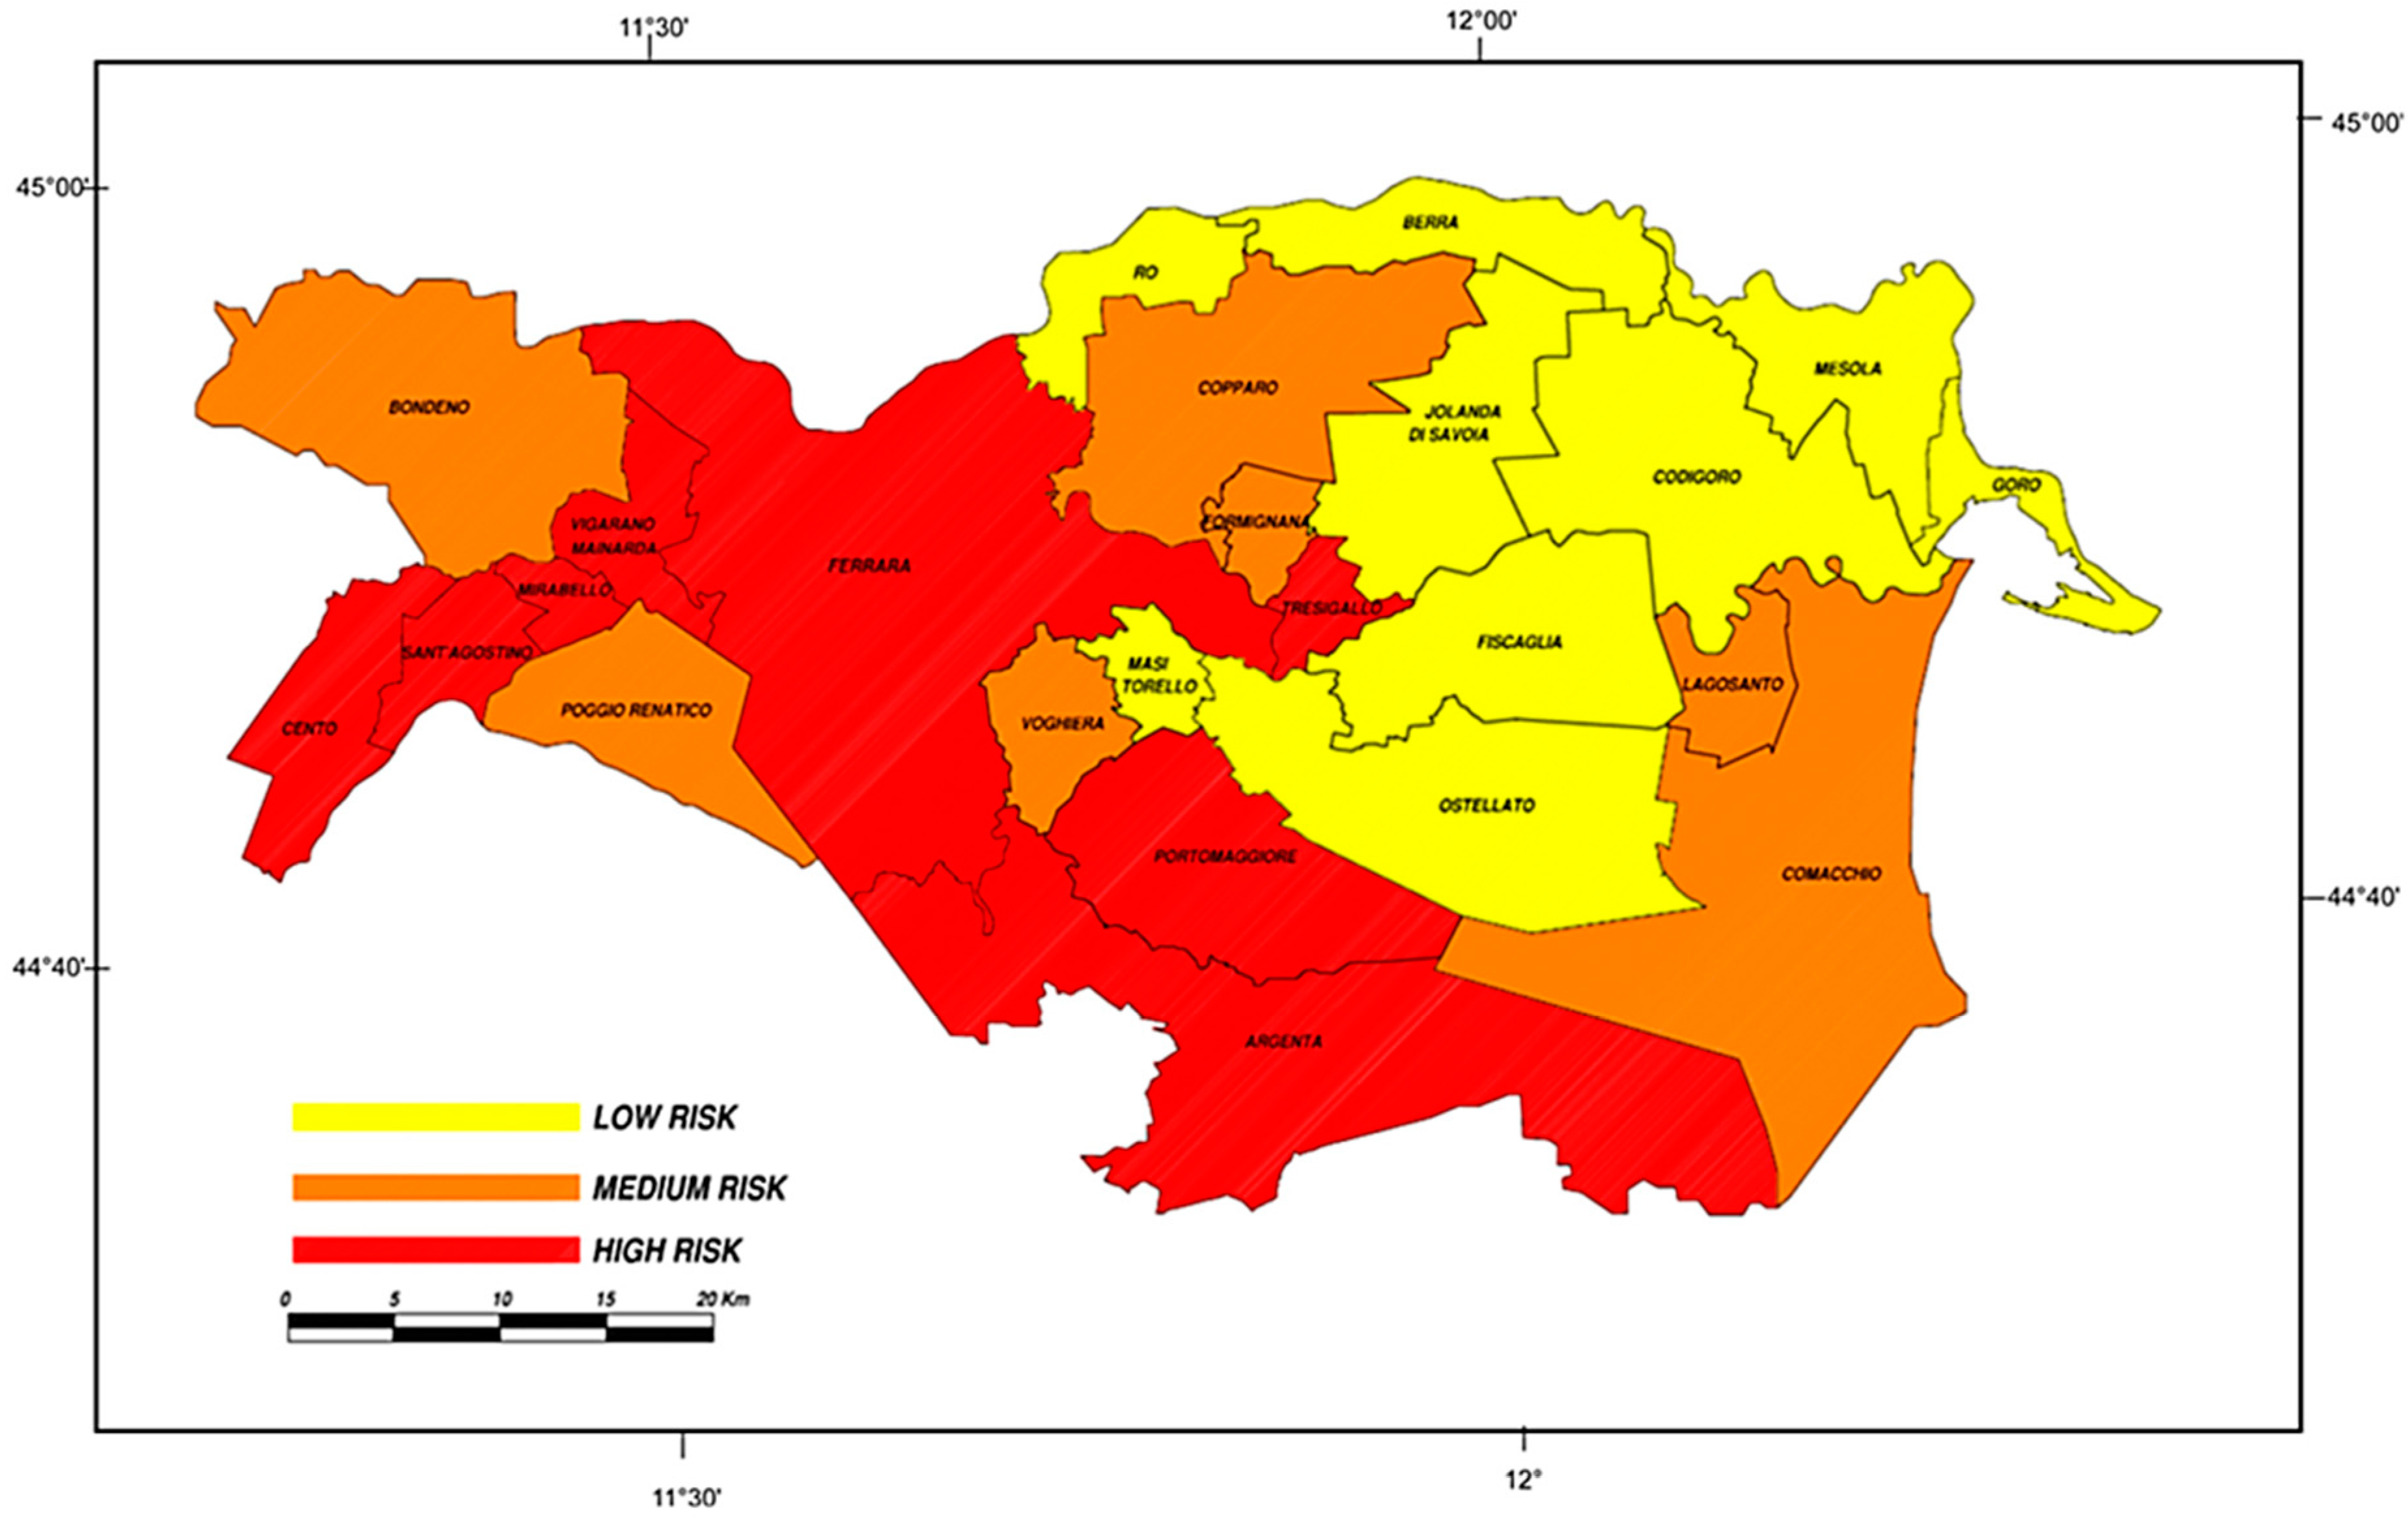
Figure 3.
Vulnerability analysis at different scales with multi-criteria approach.

Figure 4.
The scheme of the risk assessment for investigated area: (a) single-hazard exposure; (b) multi-hazard exposure.
Figure 4.
The scheme of the risk assessment for investigated area: (a) single-hazard exposure; (b) multi-hazard exposure.
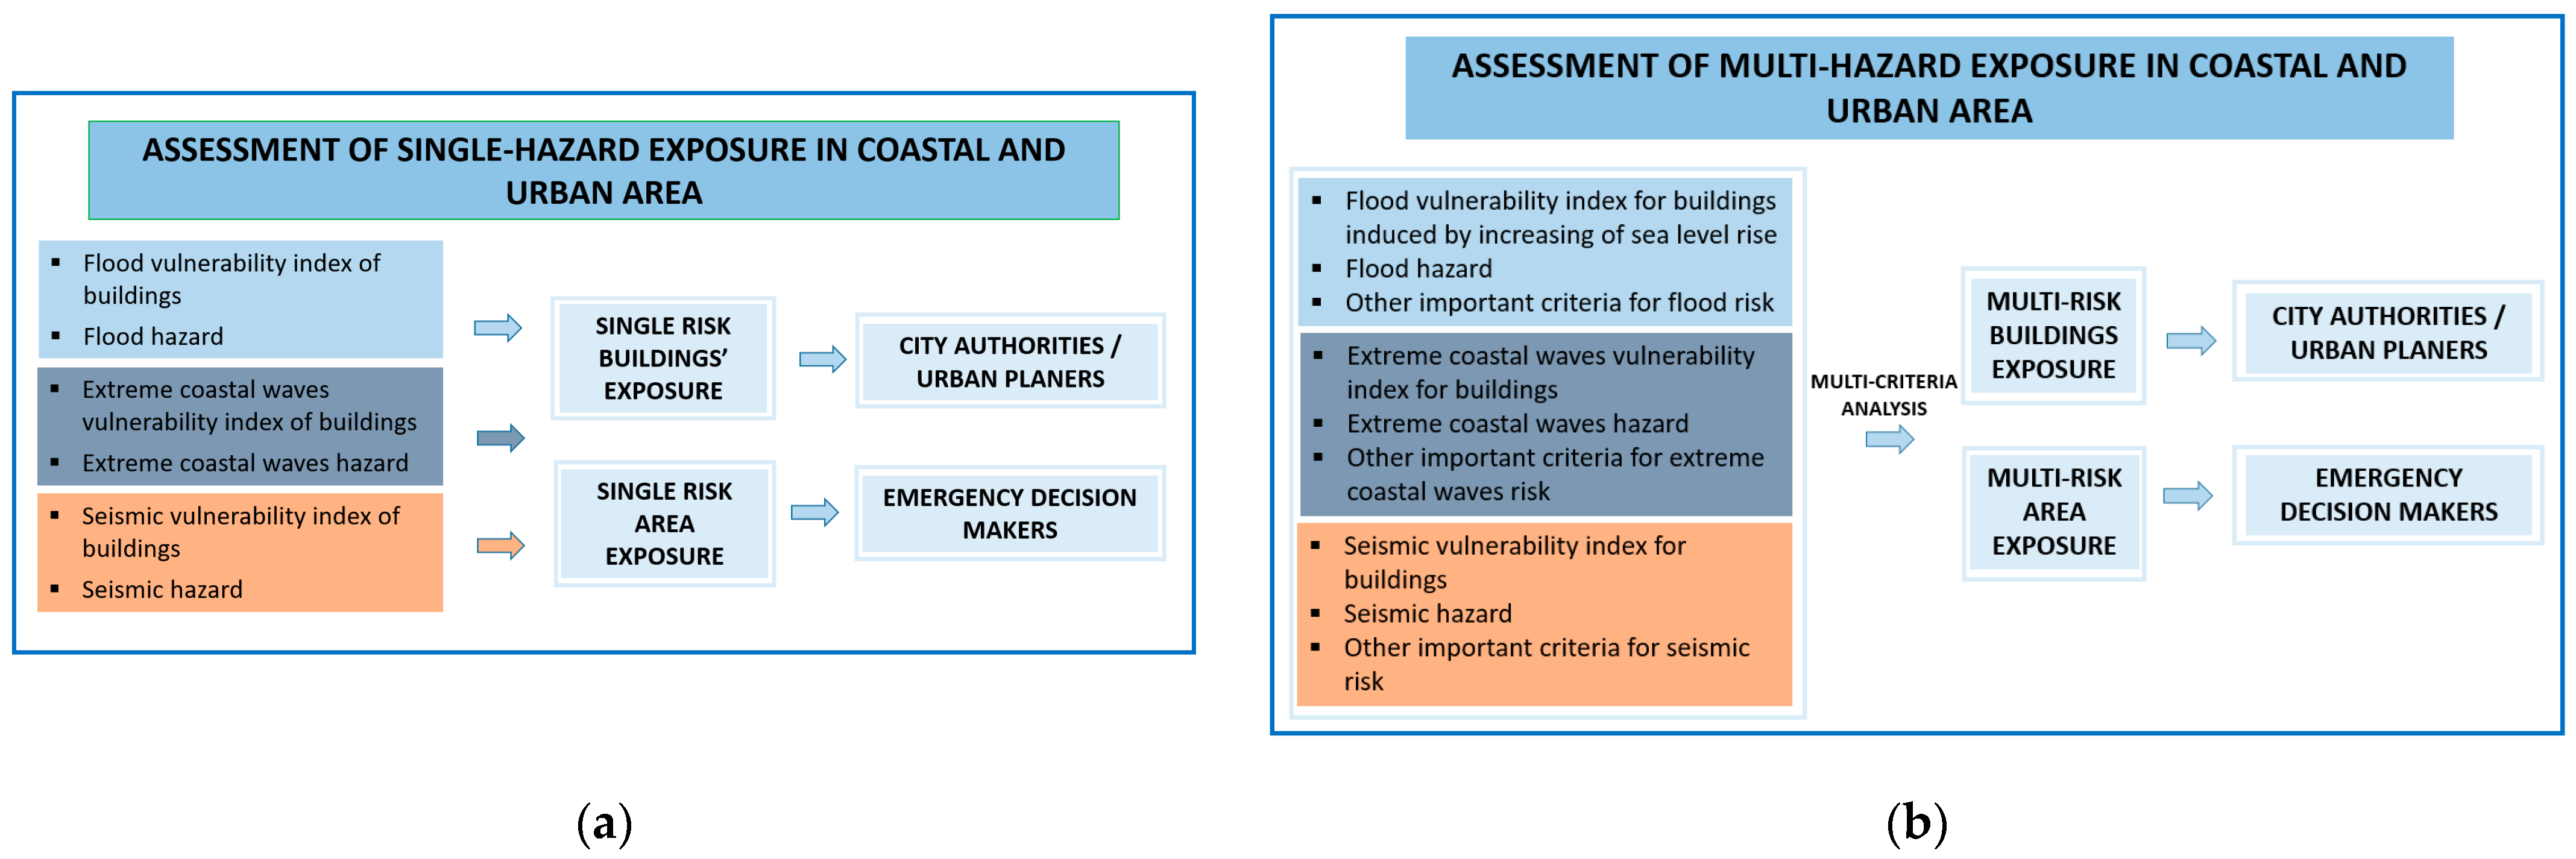
Figure 5.
Seismic vulnerability index of buildings divided into 10% intervals.

Figure 6.
Vulnerability index of buildings for: (a) sea floods; (b) extreme sea waves.
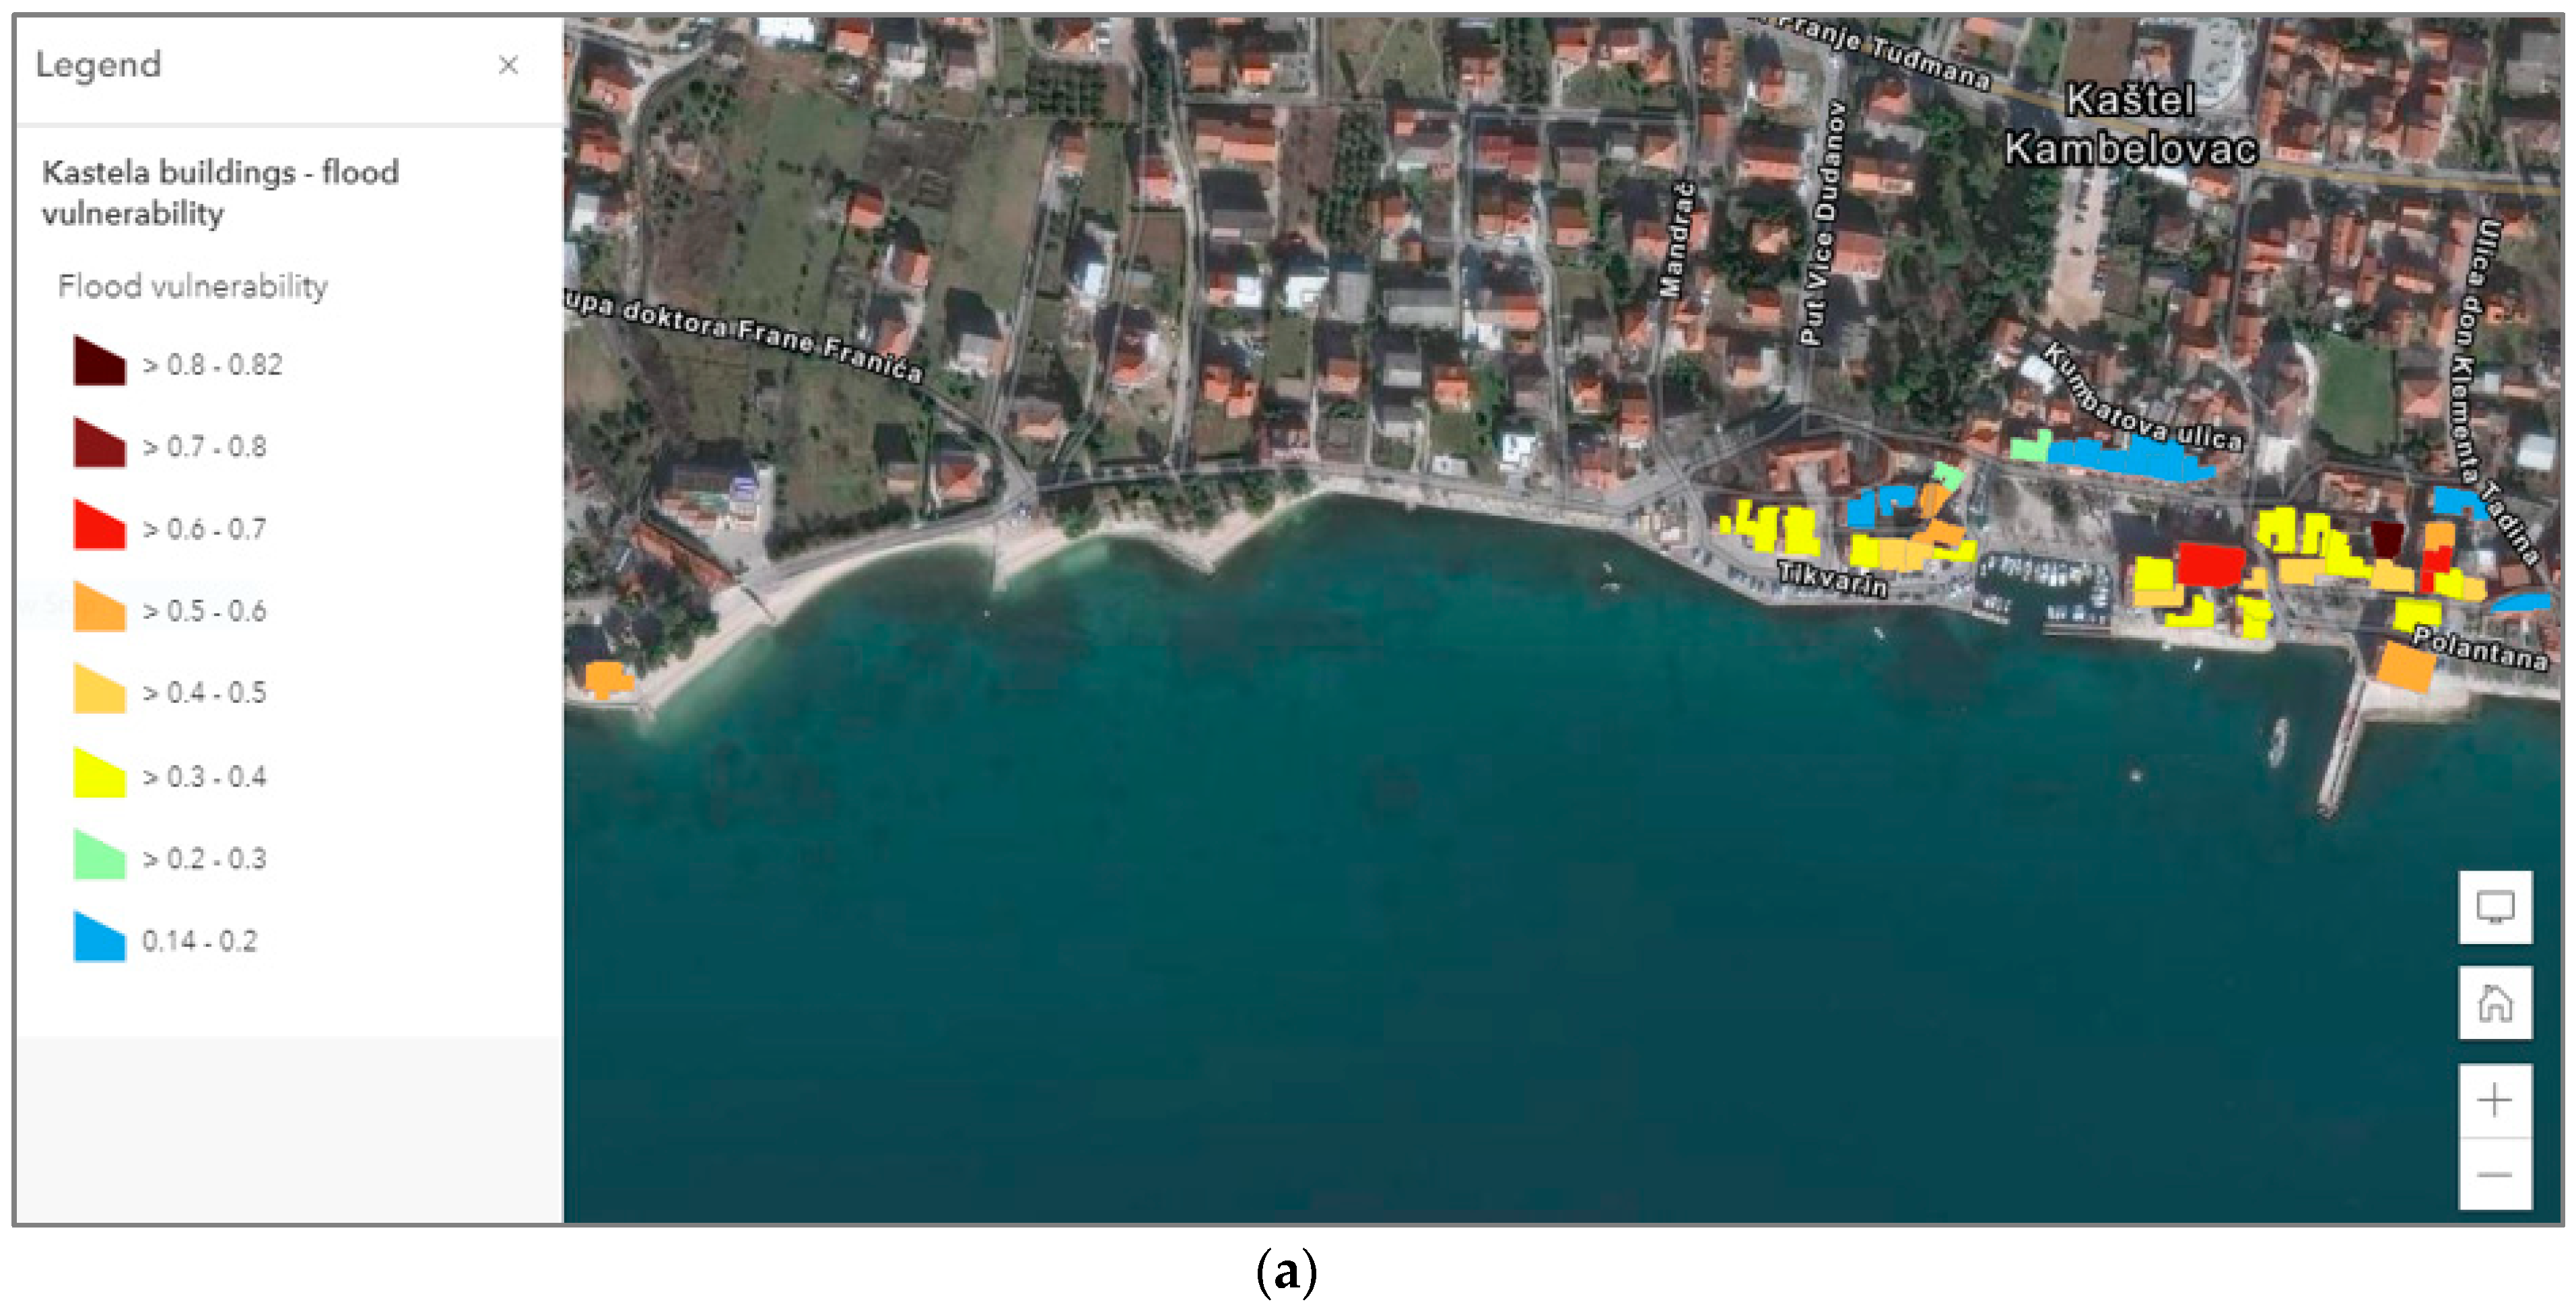
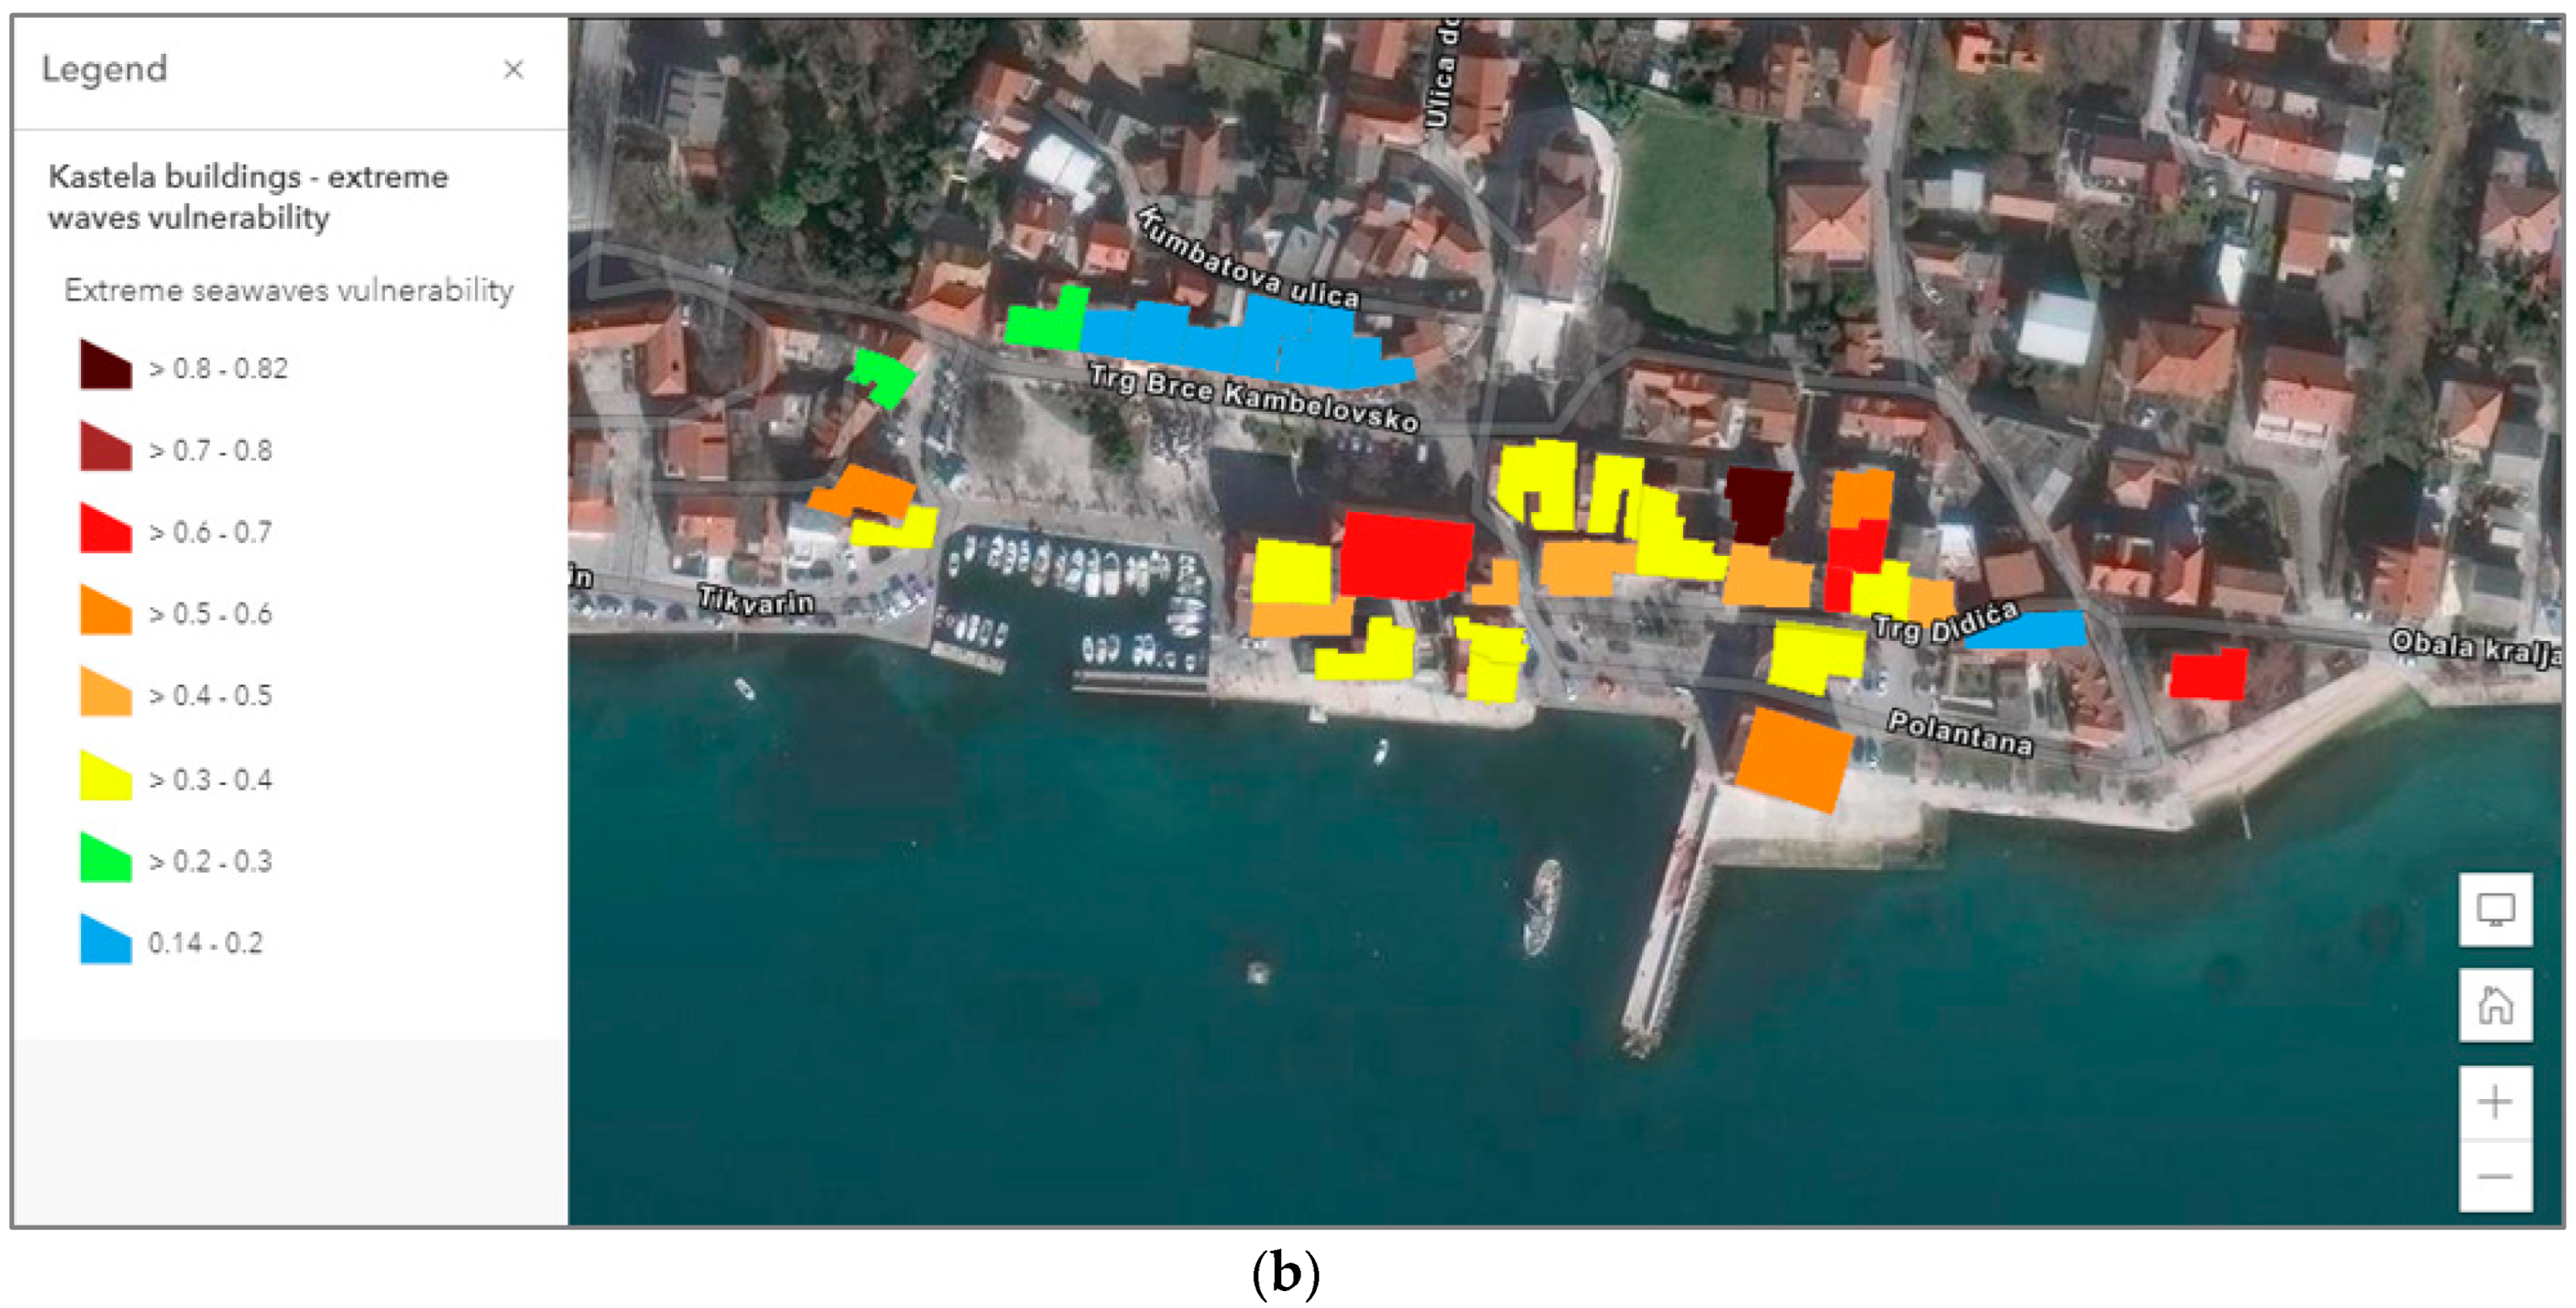
Figure 7.
Distribution of critical zones most prone to flood due to impact of climate changes on sea level rise: scenario for year 2100.
Figure 7.
Distribution of critical zones most prone to flood due to impact of climate changes on sea level rise: scenario for year 2100.
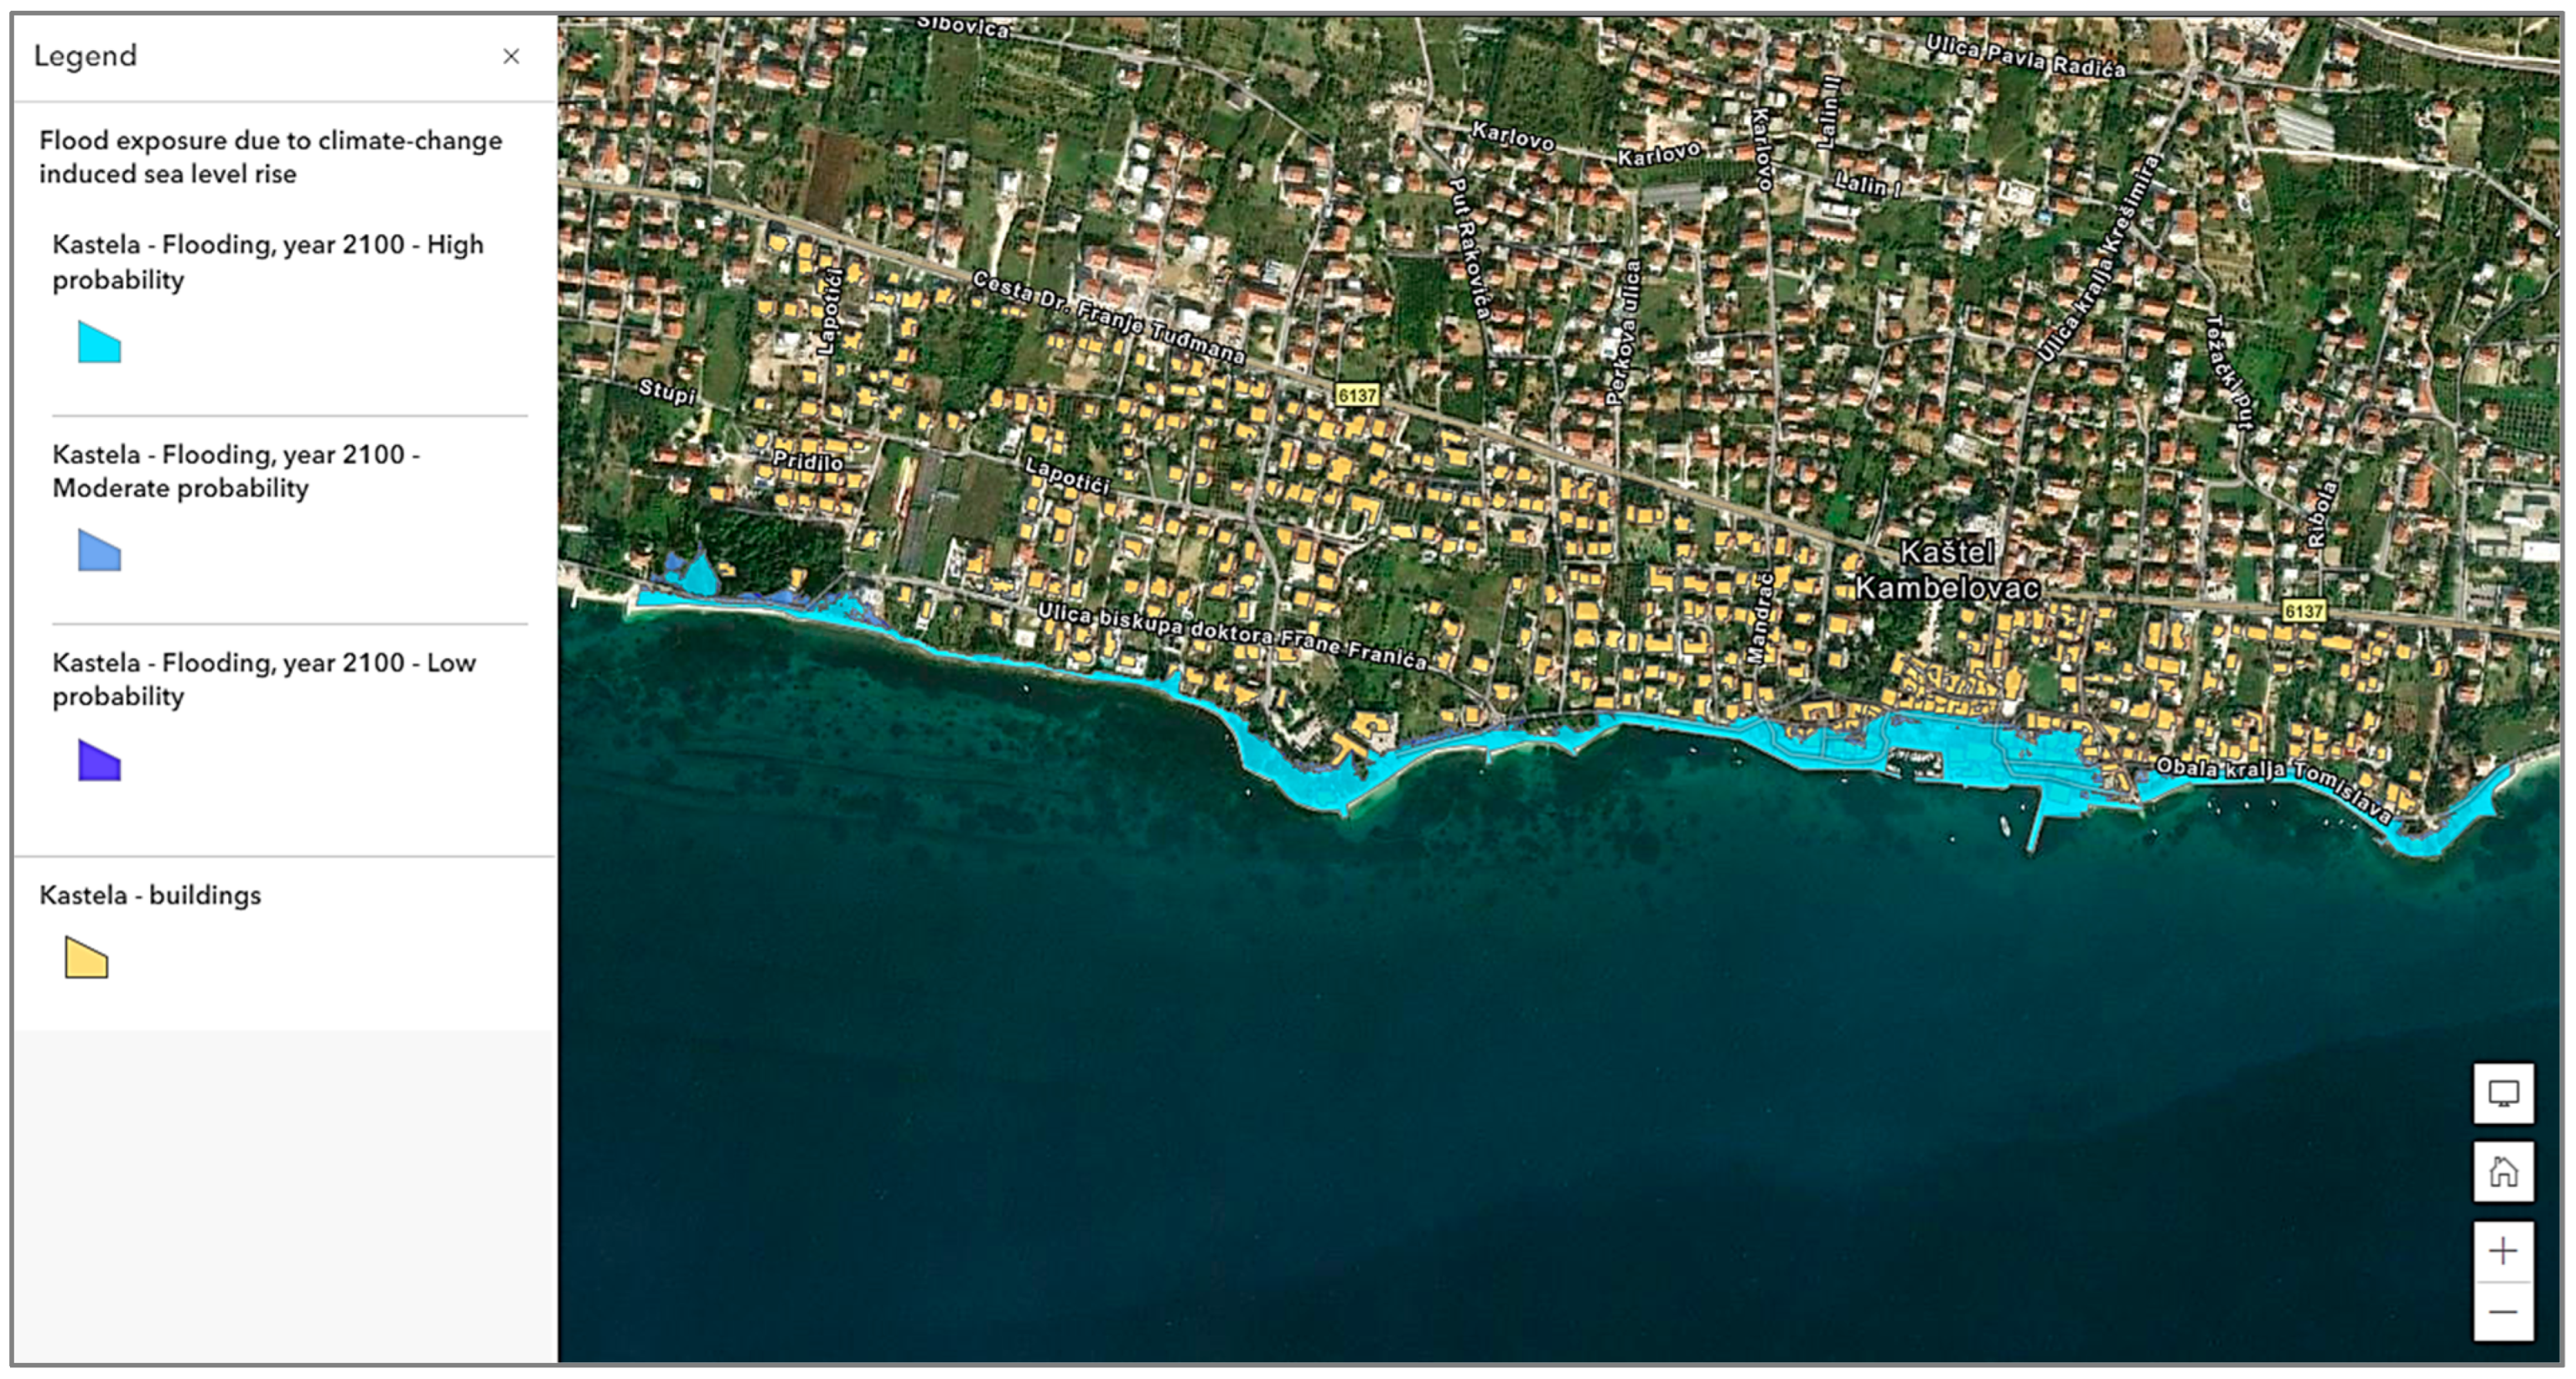
Figure 8.
Distribution of critical zones most prone to extreme sea waves exposure.

Figure 9.
The creation of homogenous zones: (a) four areas defined by specific urban characteristics; (b) four areas defined by main roads; (c) three areas defined by terrain (contours 5 and 10 m); (d) intersection of layers resulted with 15 homogenous zones.
Figure 9.
The creation of homogenous zones: (a) four areas defined by specific urban characteristics; (b) four areas defined by main roads; (c) three areas defined by terrain (contours 5 and 10 m); (d) intersection of layers resulted with 15 homogenous zones.

Figure 10.
GIS analysis of additional criteria: (a) electricity supply; (b) water supply and drainage; (c) road network; (d) construction density; (e) importance factor (public, school, etc.); (f) historical buildings.
Figure 10.
GIS analysis of additional criteria: (a) electricity supply; (b) water supply and drainage; (c) road network; (d) construction density; (e) importance factor (public, school, etc.); (f) historical buildings.
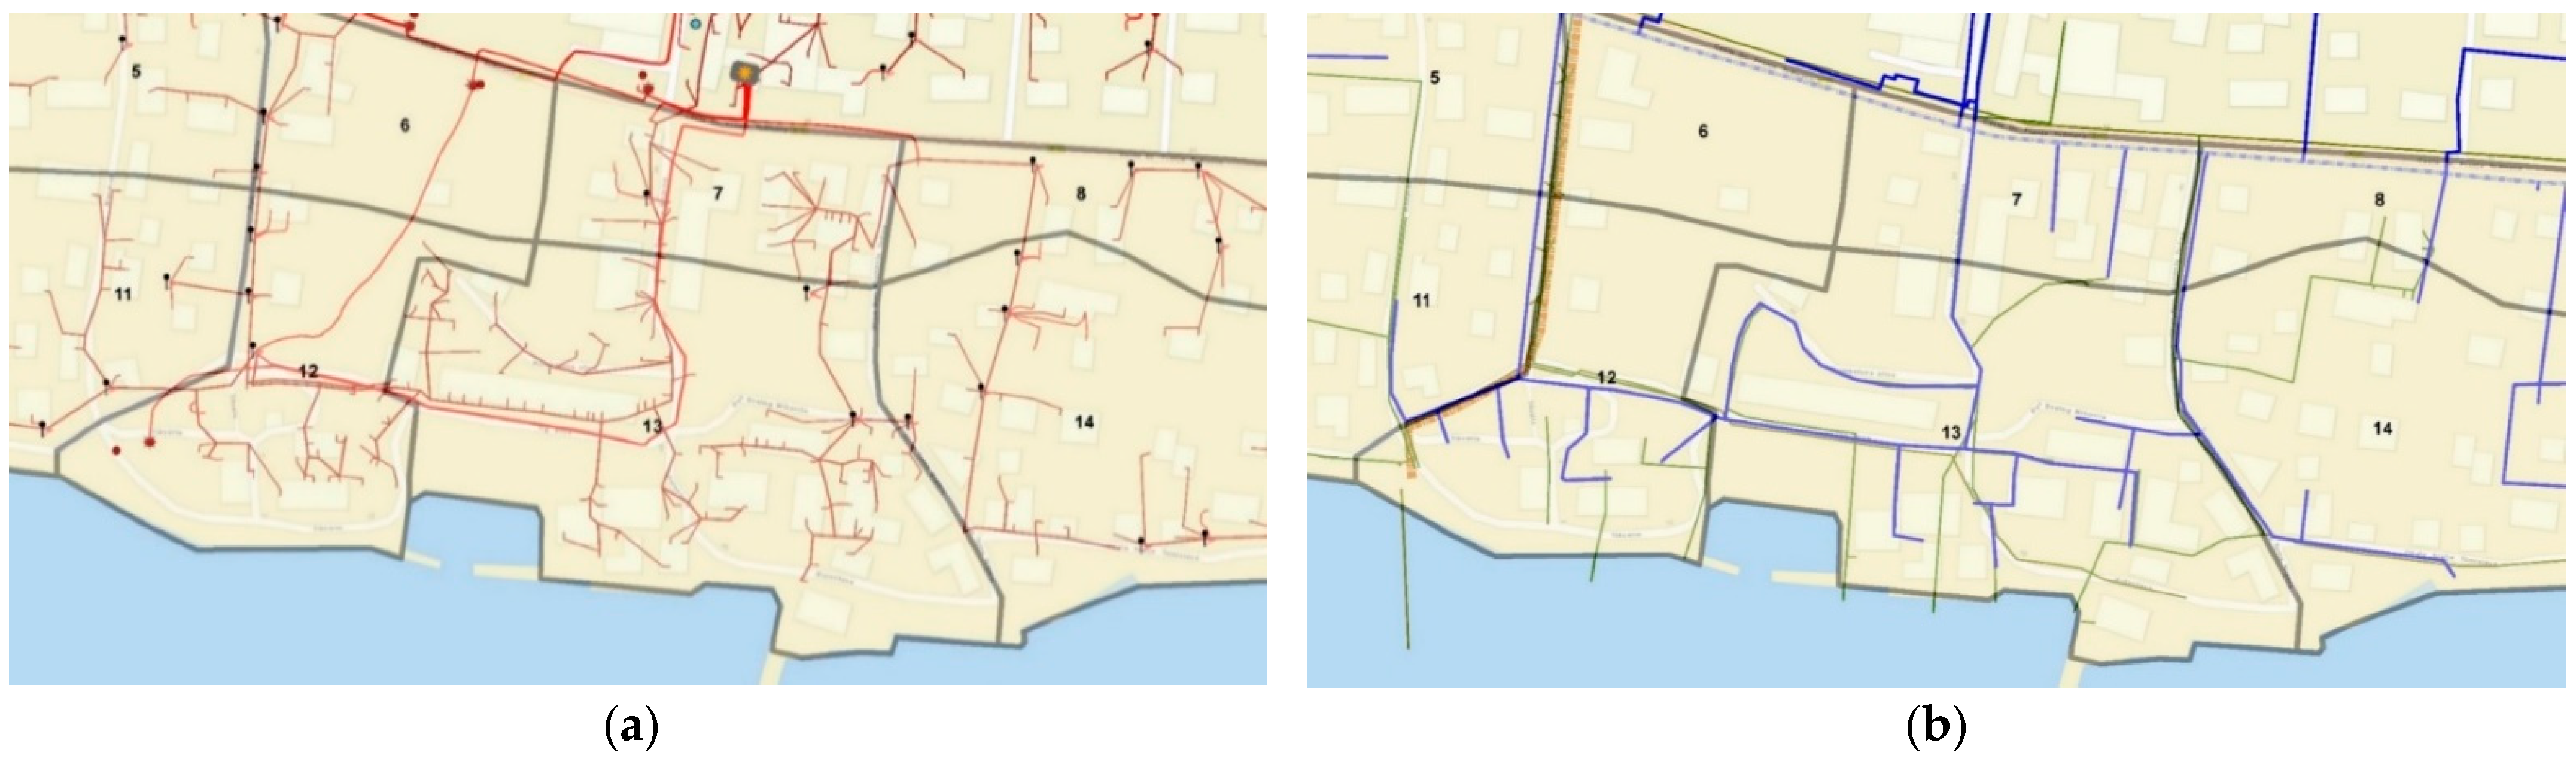
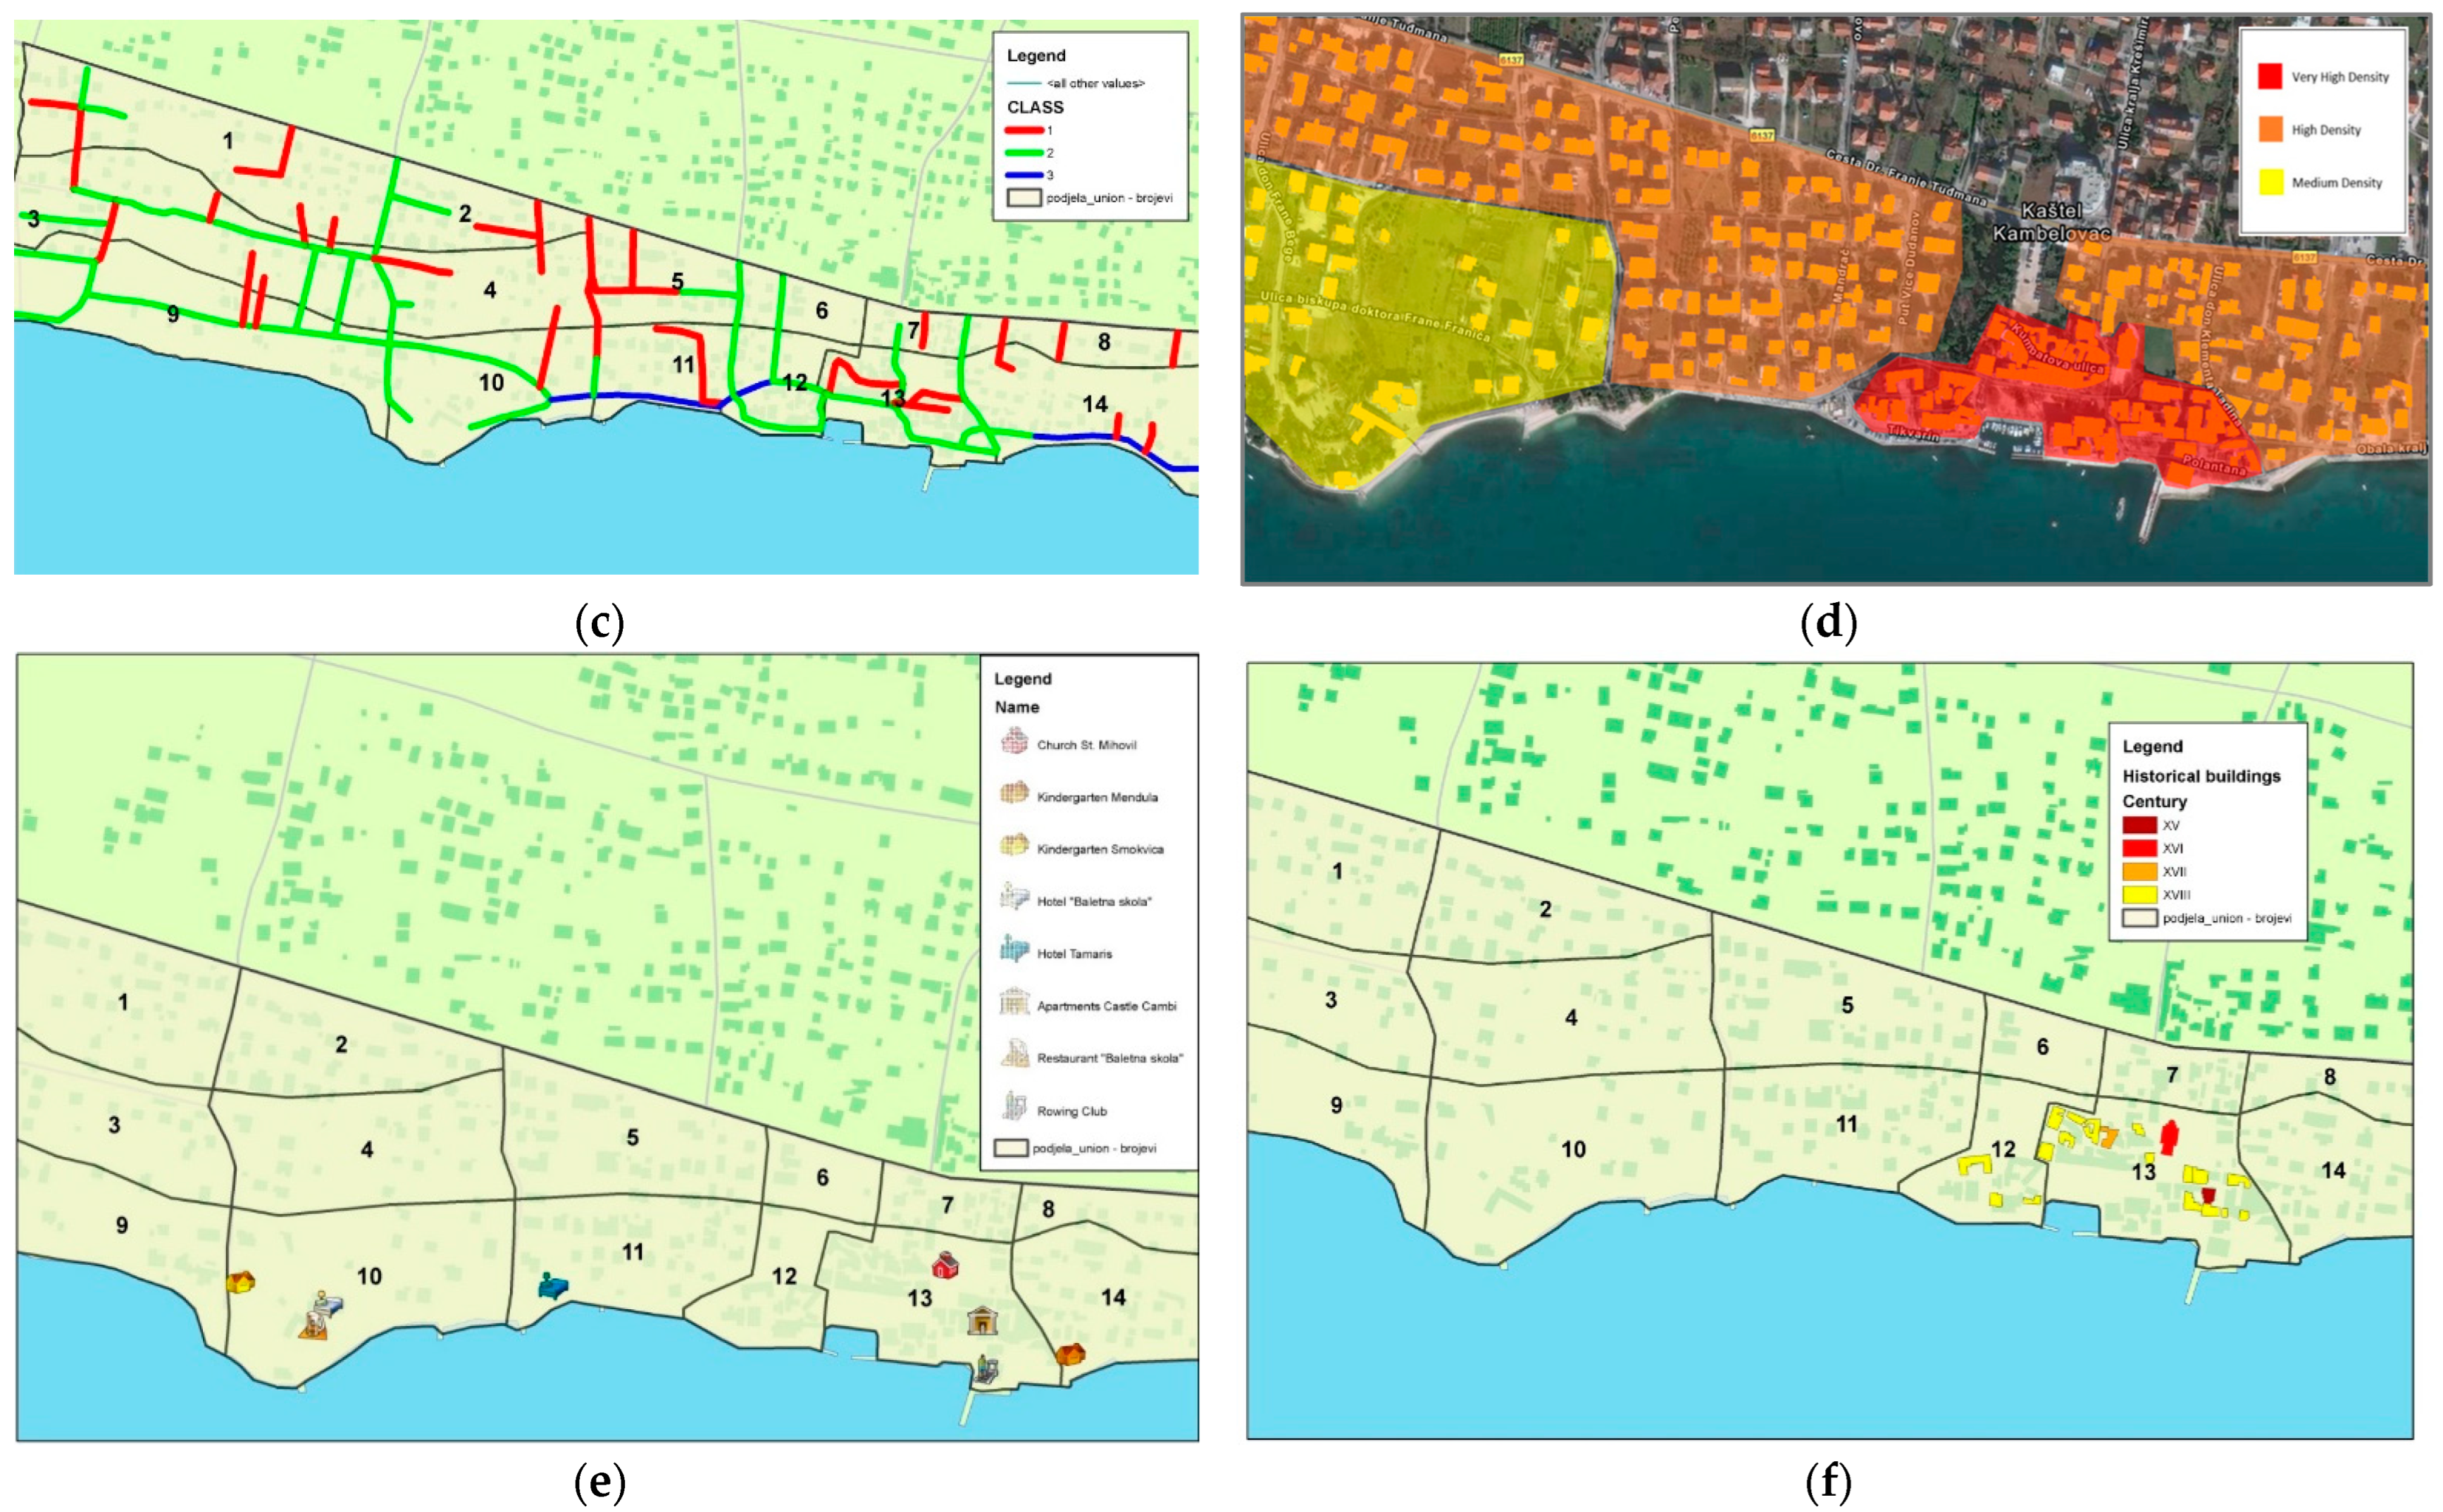
Figure 11.
Homogenous zones input data for PROMETHEE method (decision matrix).
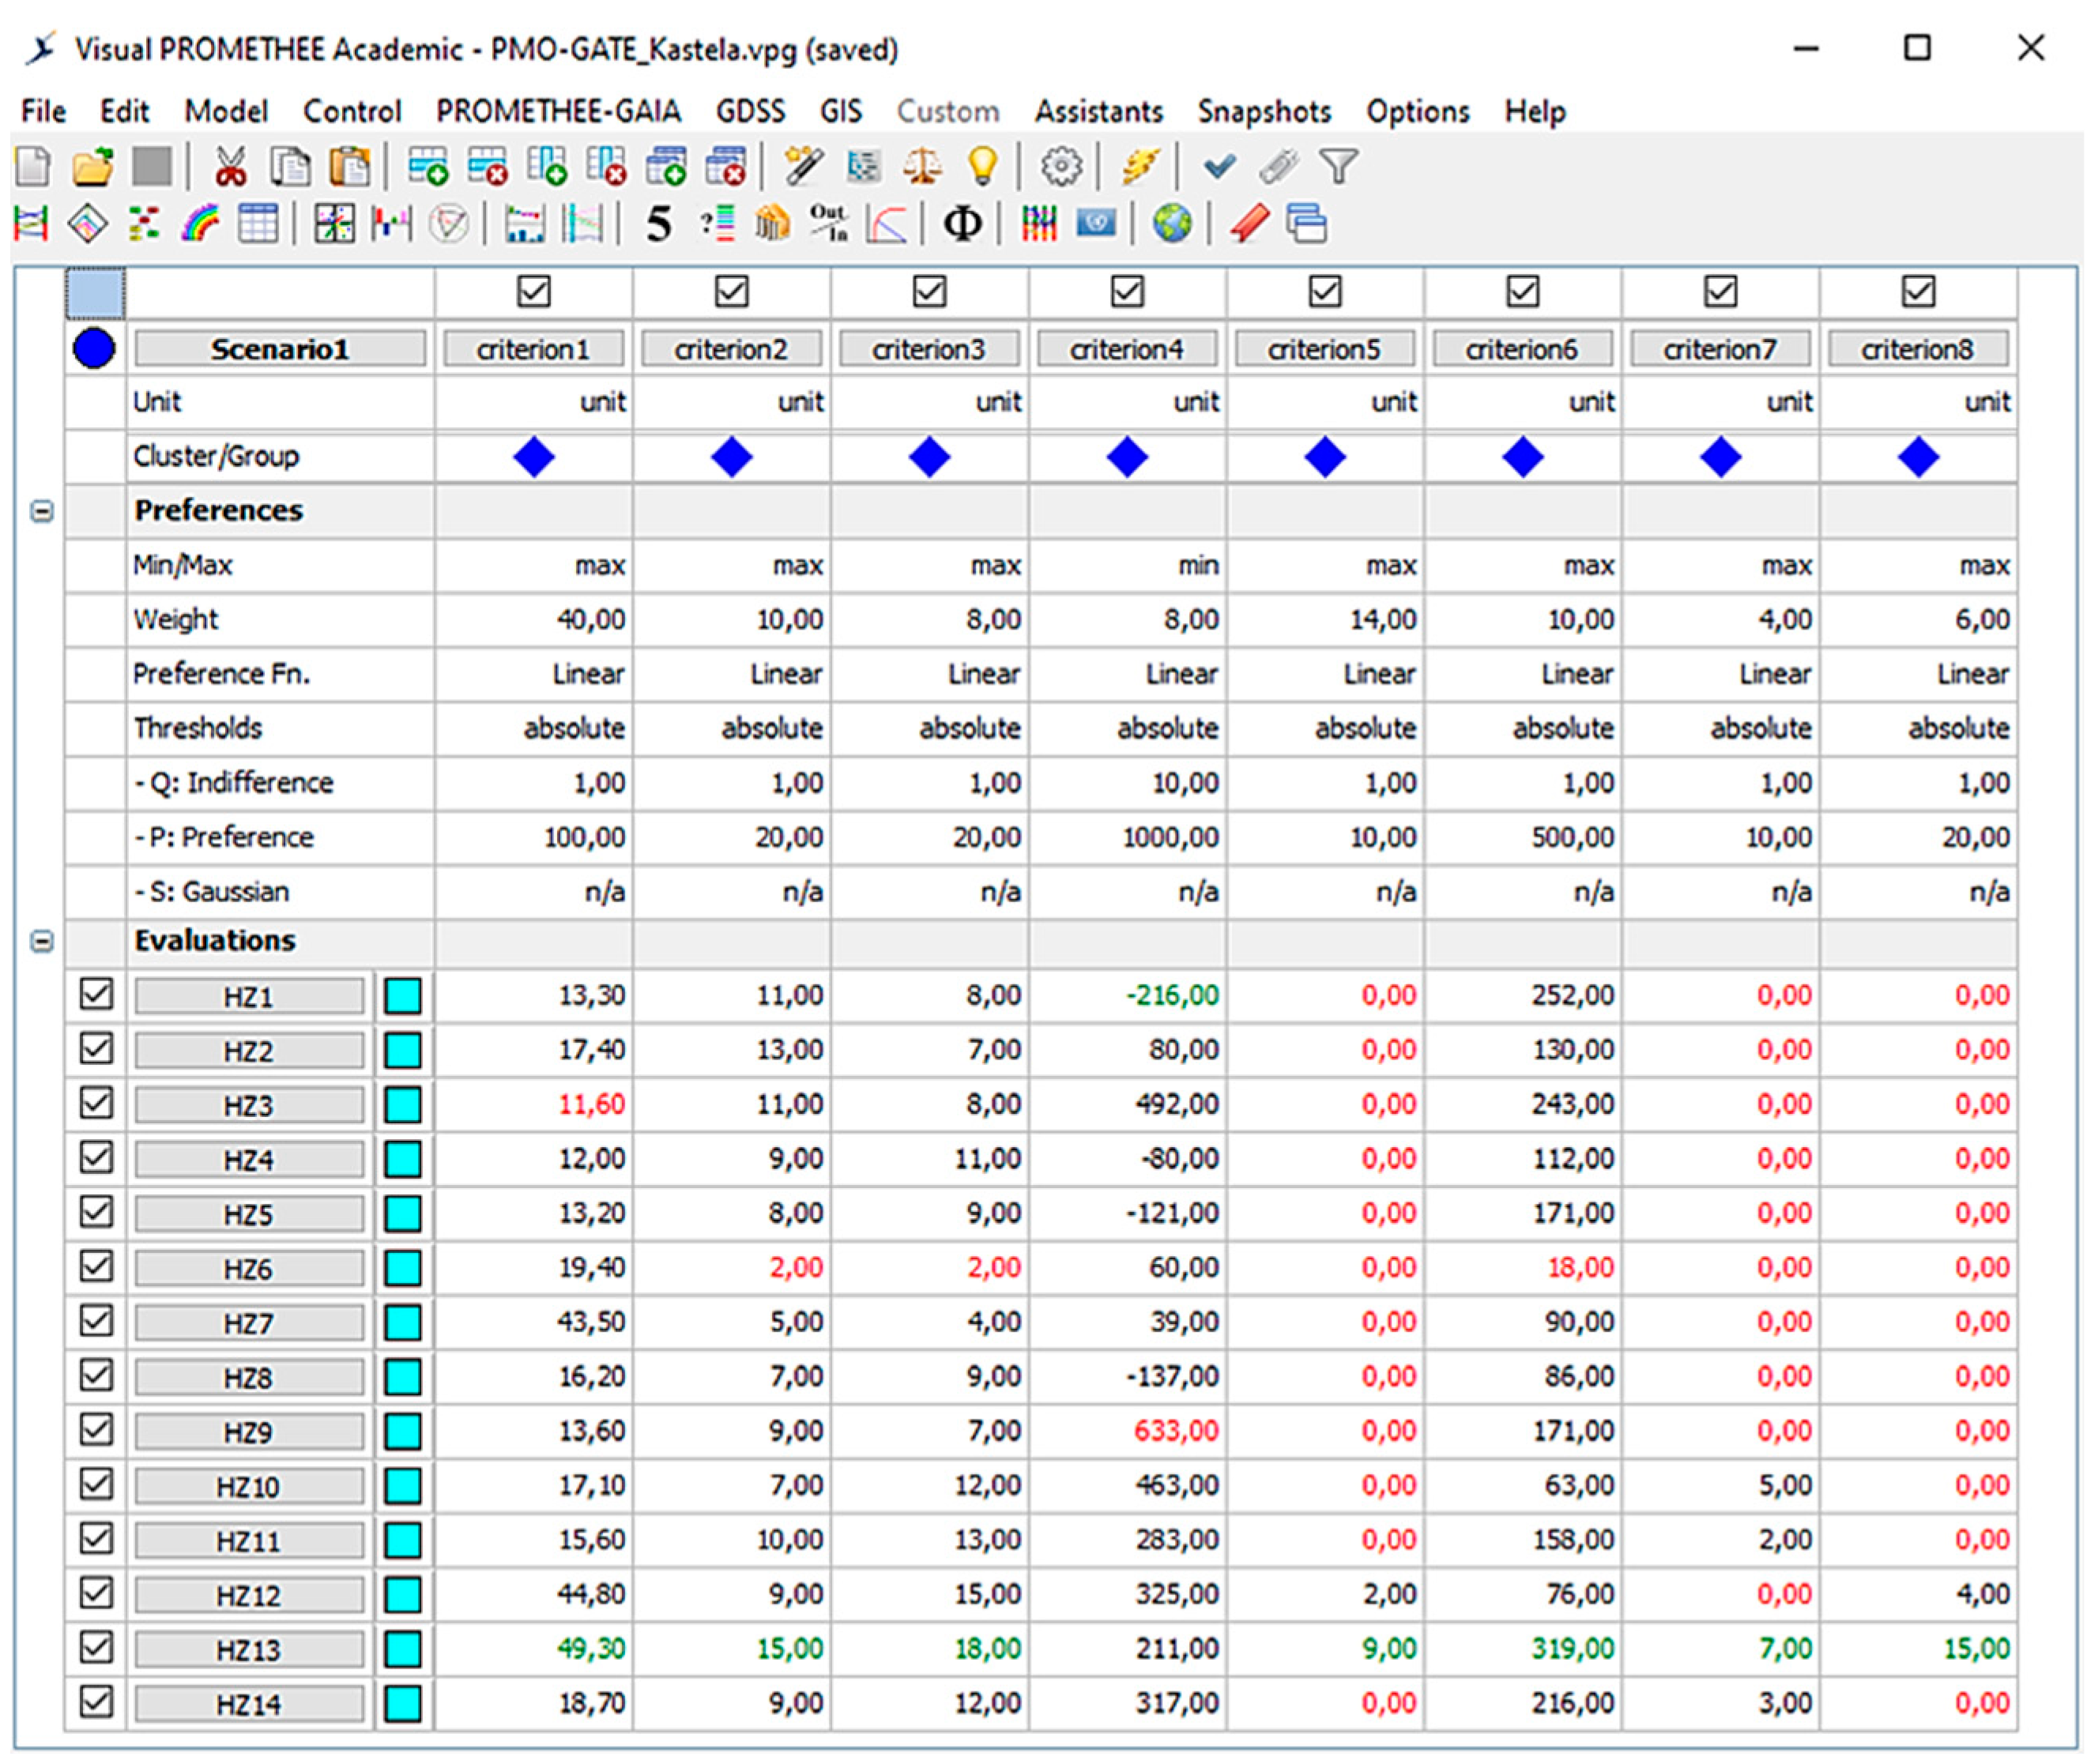
Figure 12.
Results of the PROMETHEE method for 14 homogeneous zones (better rank represents higher risk).
Figure 12.
Results of the PROMETHEE method for 14 homogeneous zones (better rank represents higher risk).
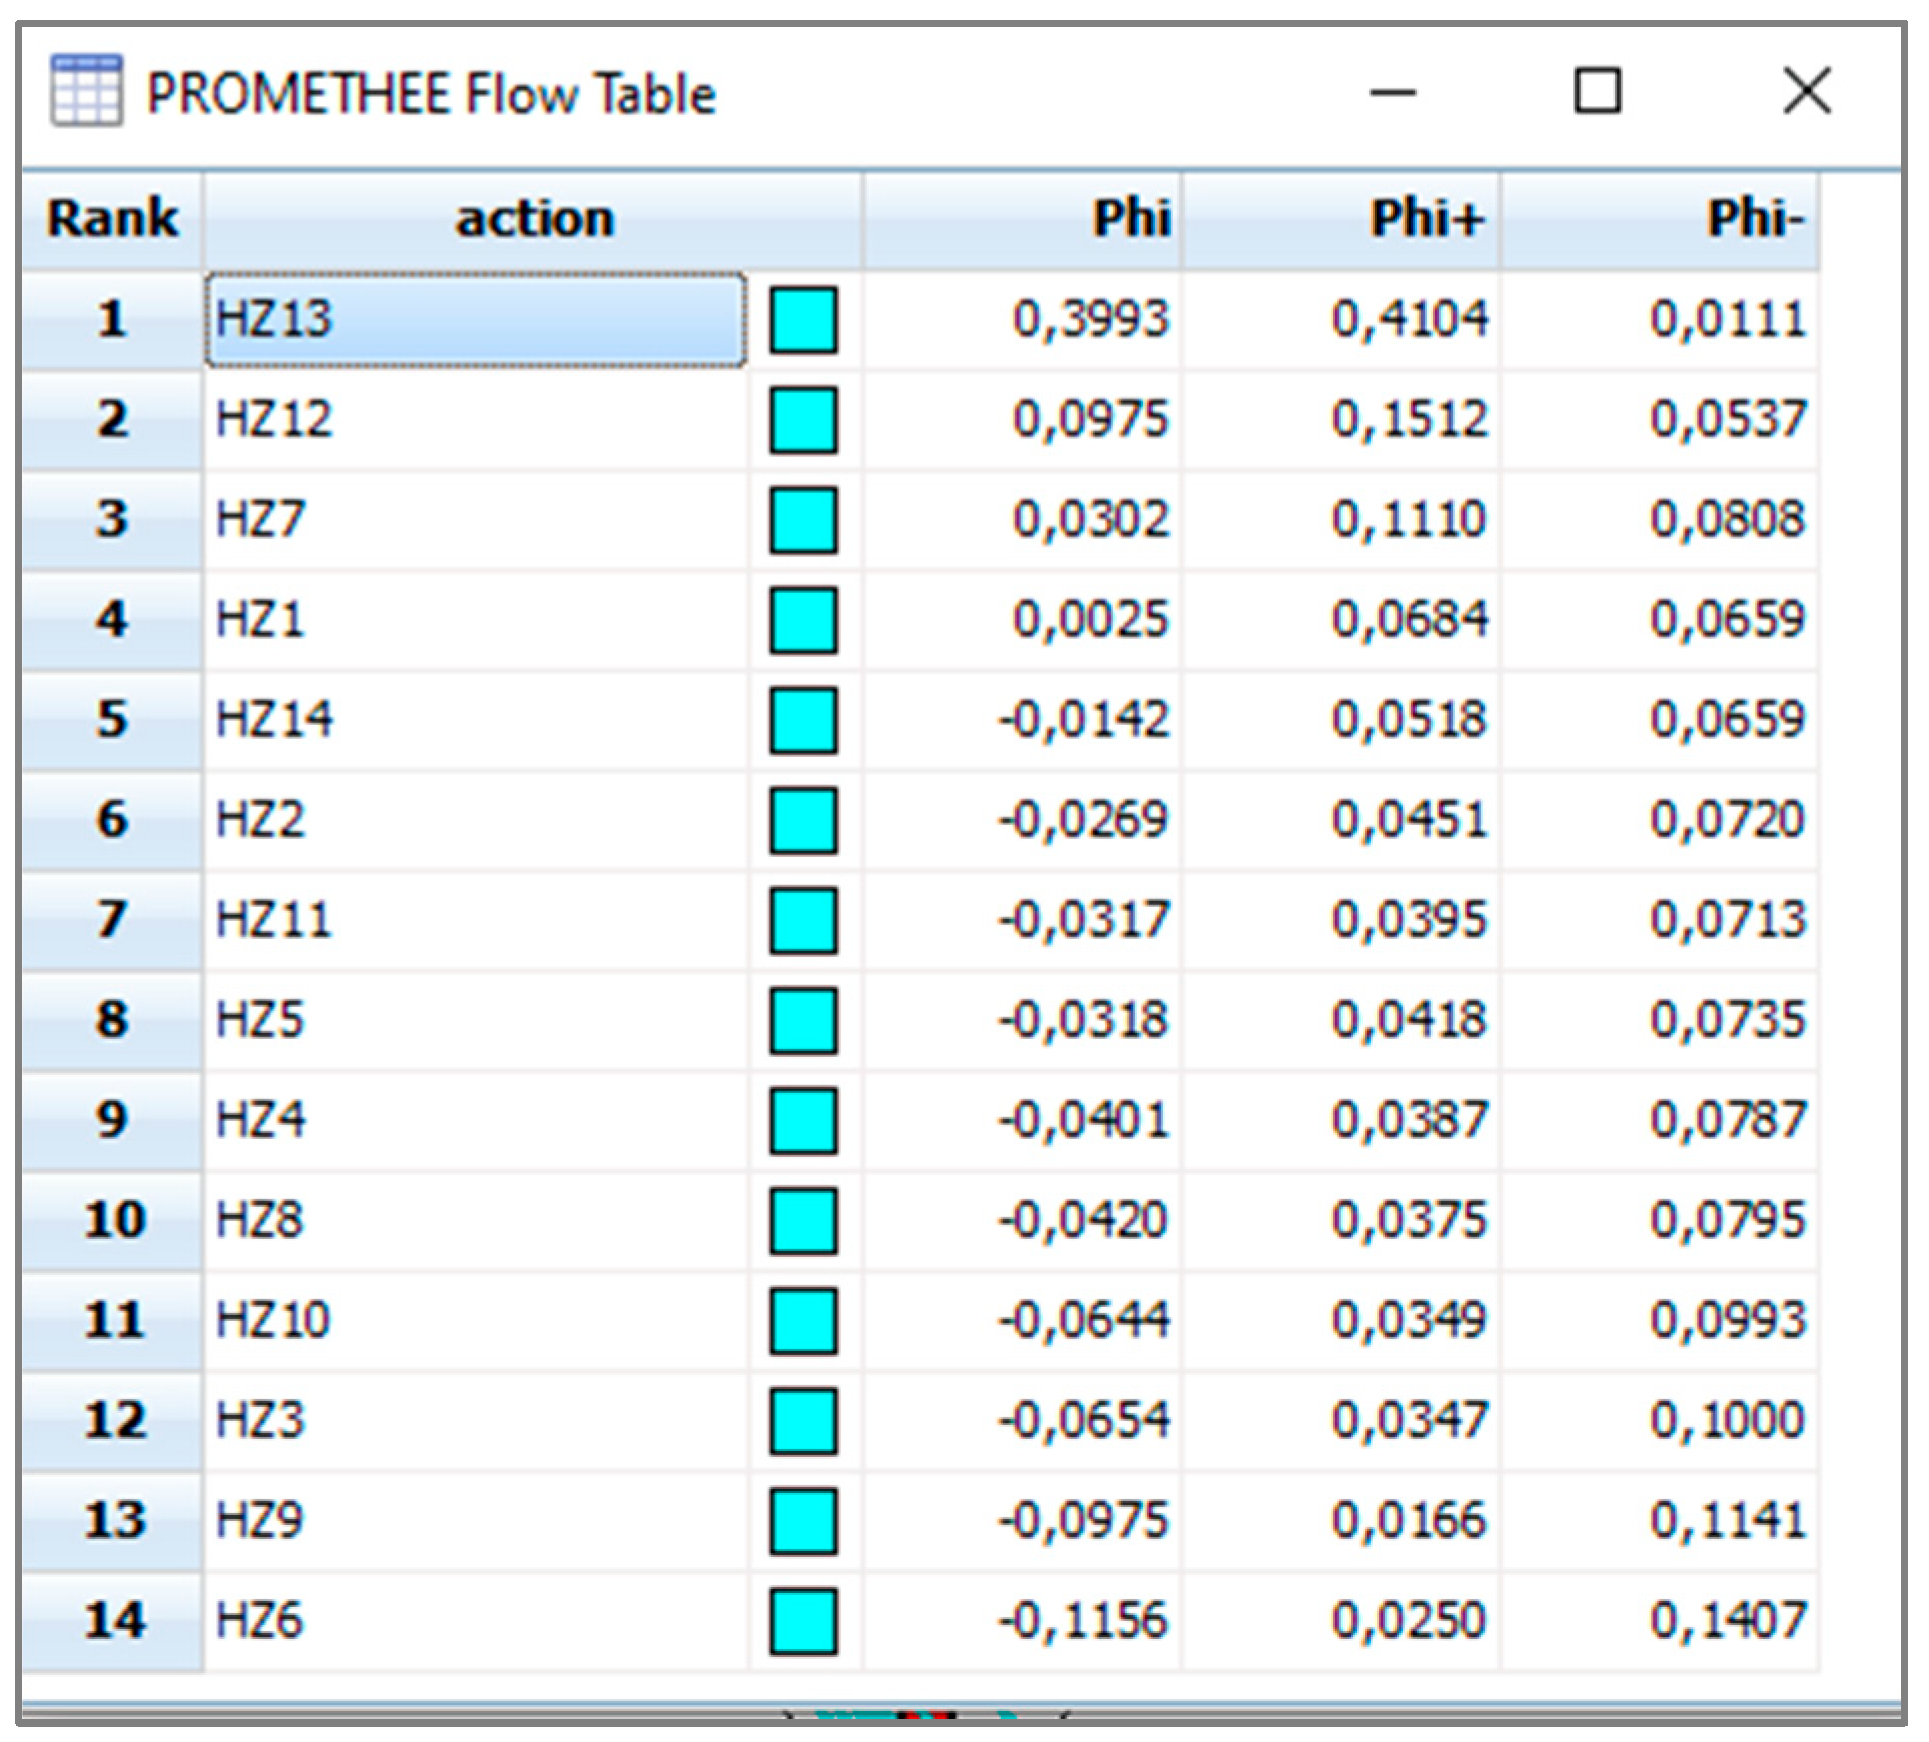
Figure 13.
Seismic risk assessment for homogenous zones (green represents low risk, red represents high risk).
Figure 13.
Seismic risk assessment for homogenous zones (green represents low risk, red represents high risk).
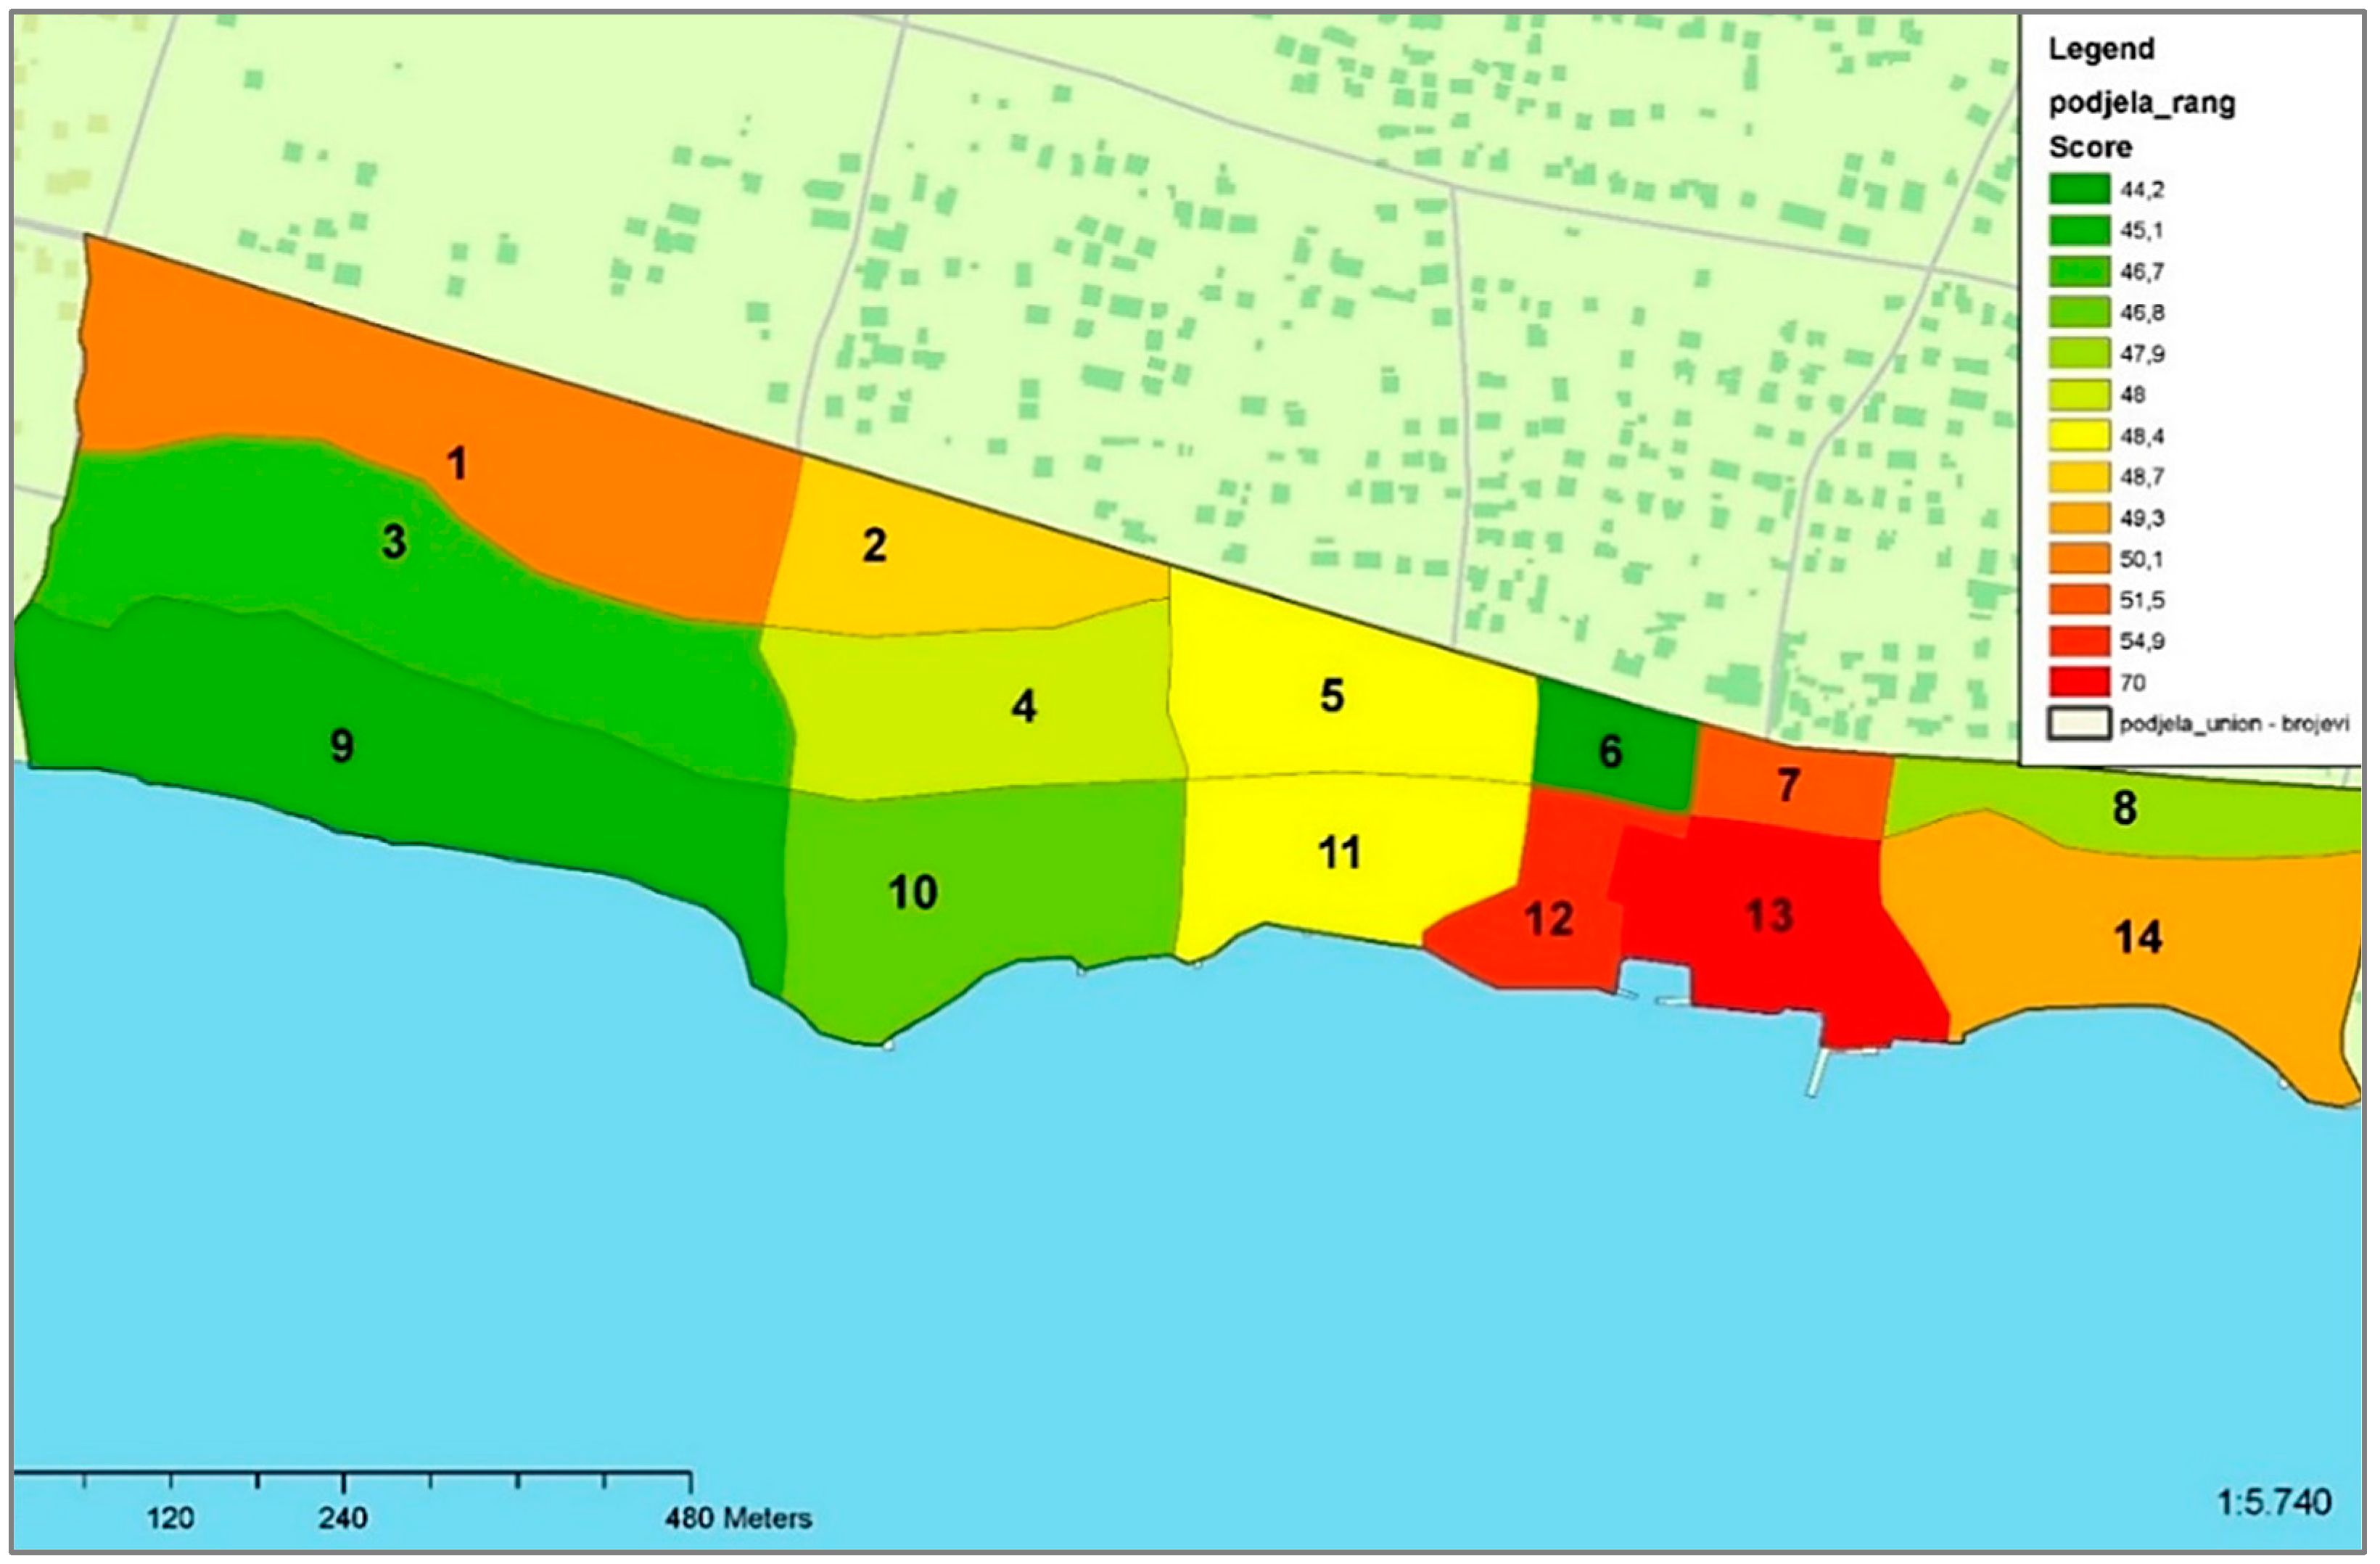
Figure 14.
Input matrix for combined seismic-flood risk (Scenario S-F) multi-criteria analysis with criteria evaluation for all three levels.
Figure 14.
Input matrix for combined seismic-flood risk (Scenario S-F) multi-criteria analysis with criteria evaluation for all three levels.

Figure 15.
Results of risk analysis for seismic and flood hazard for Level 1 (Scenario S-F L1).
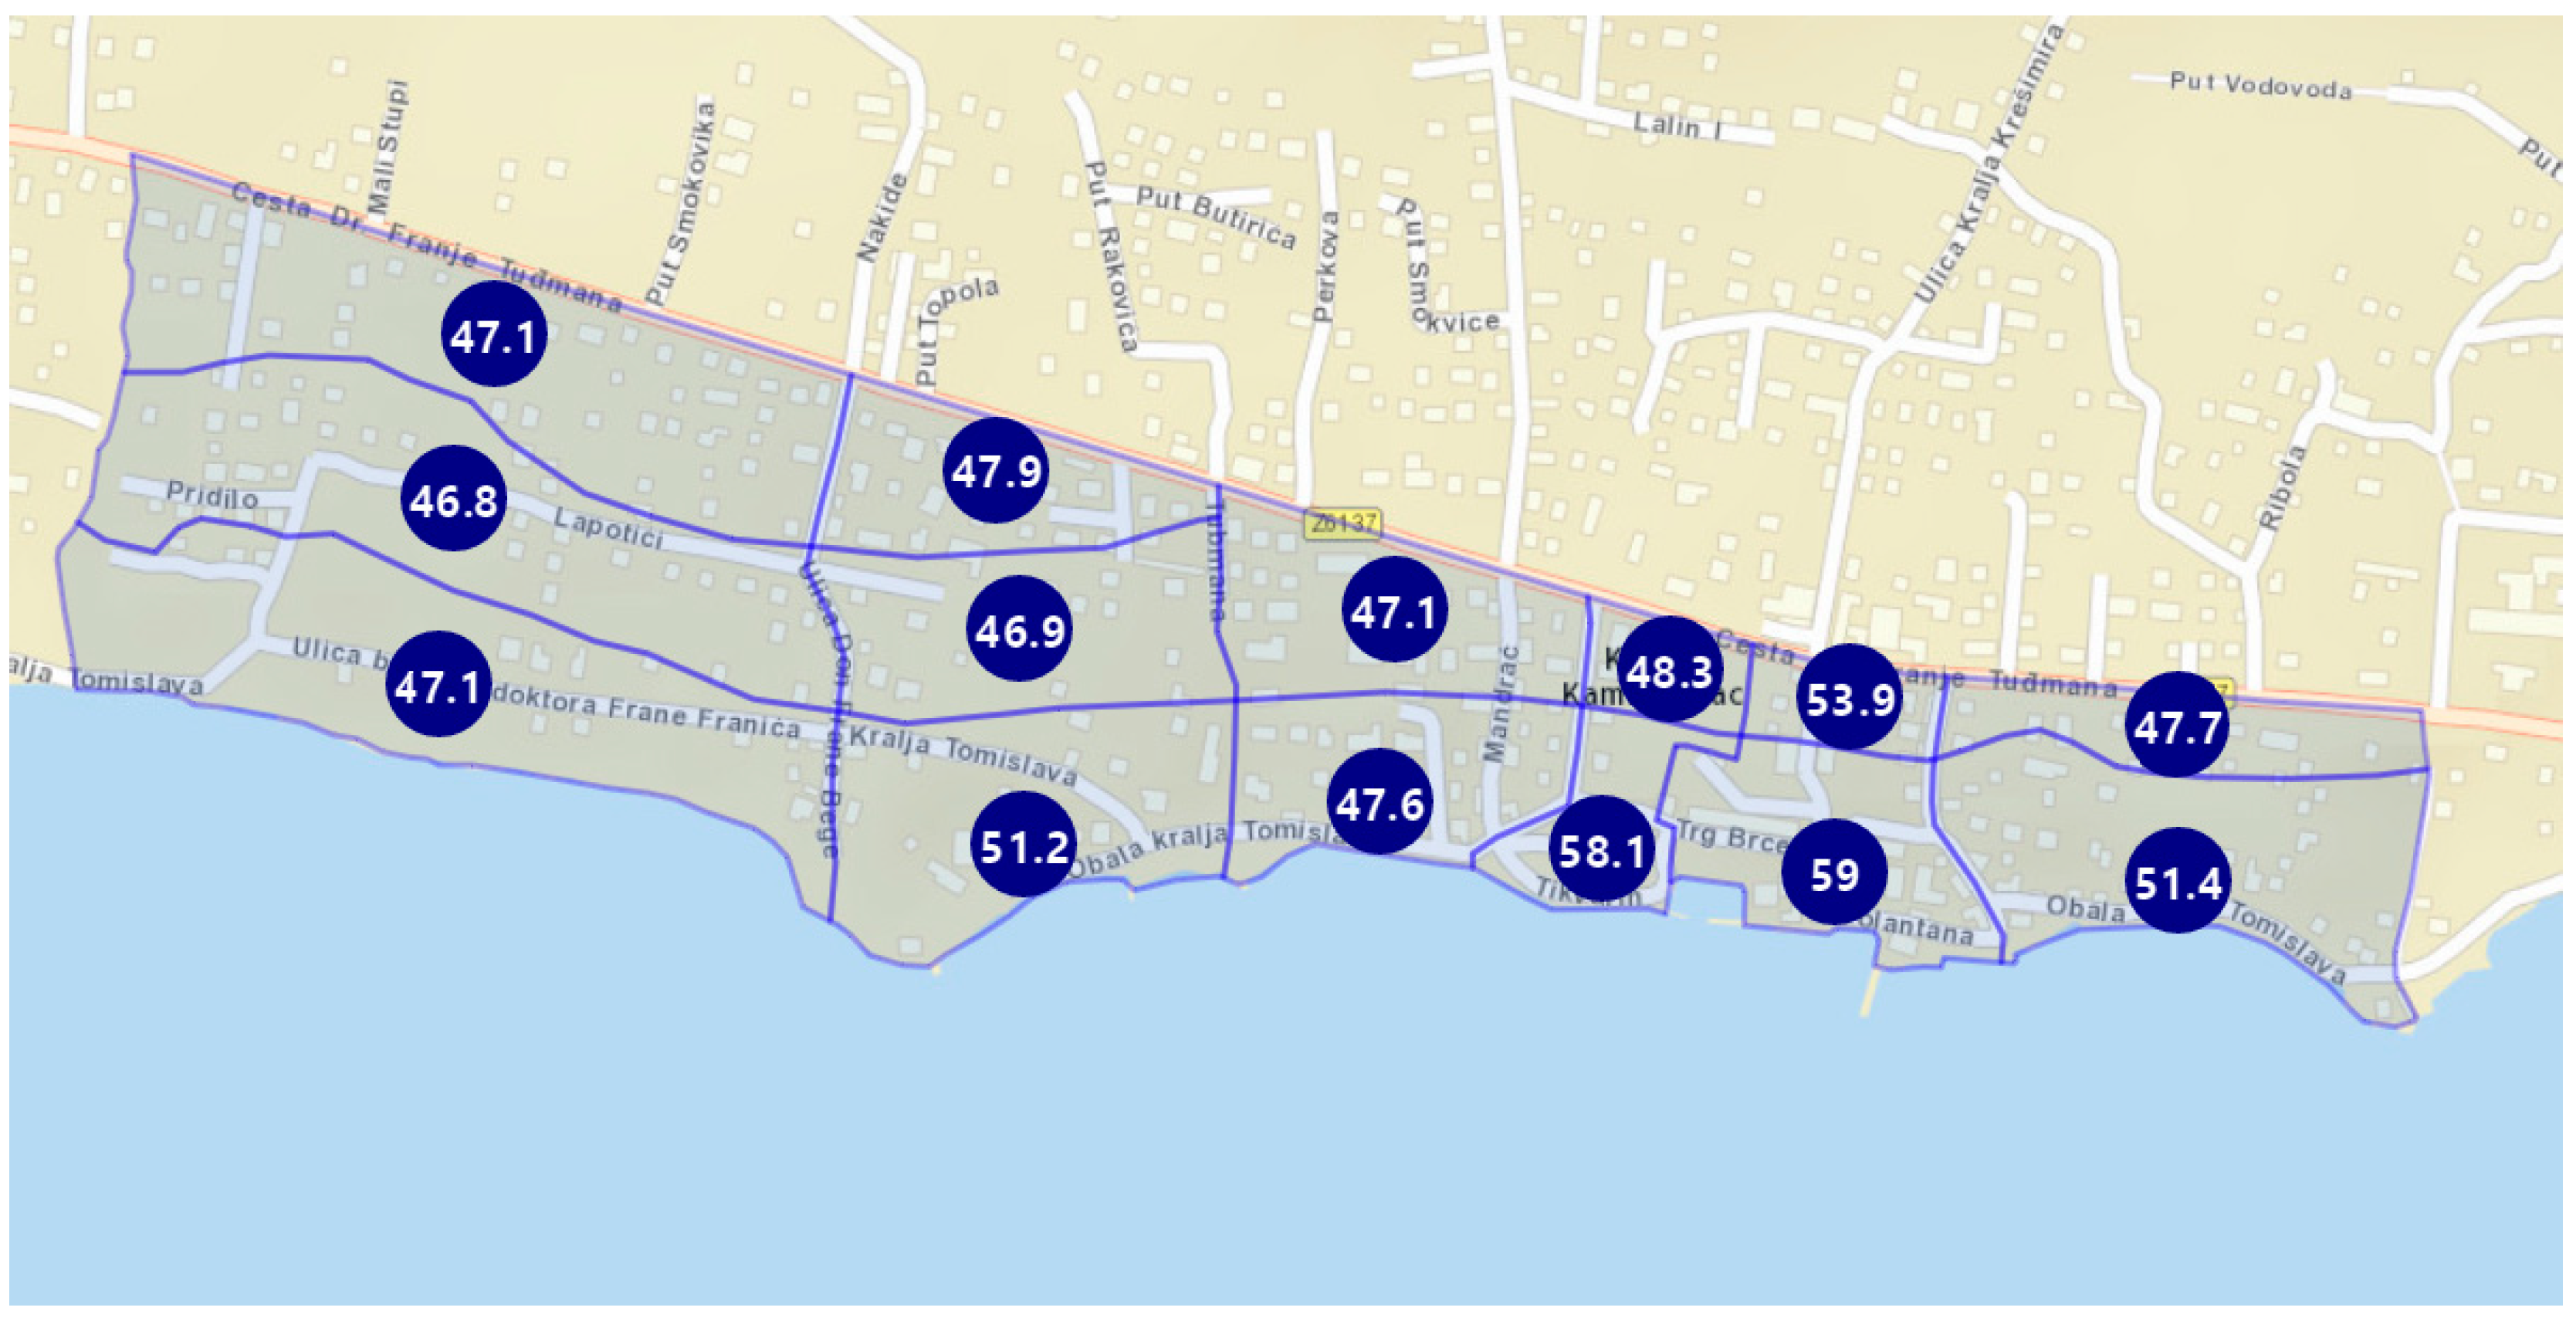
Figure 16.
Results of risk analysis for seismic and flood hazard for Level 2 (Scenario S-F L2).

Figure 17.
Results of risk analysis for seismic and flood hazard for Level 3 (Scenario S-F L3).
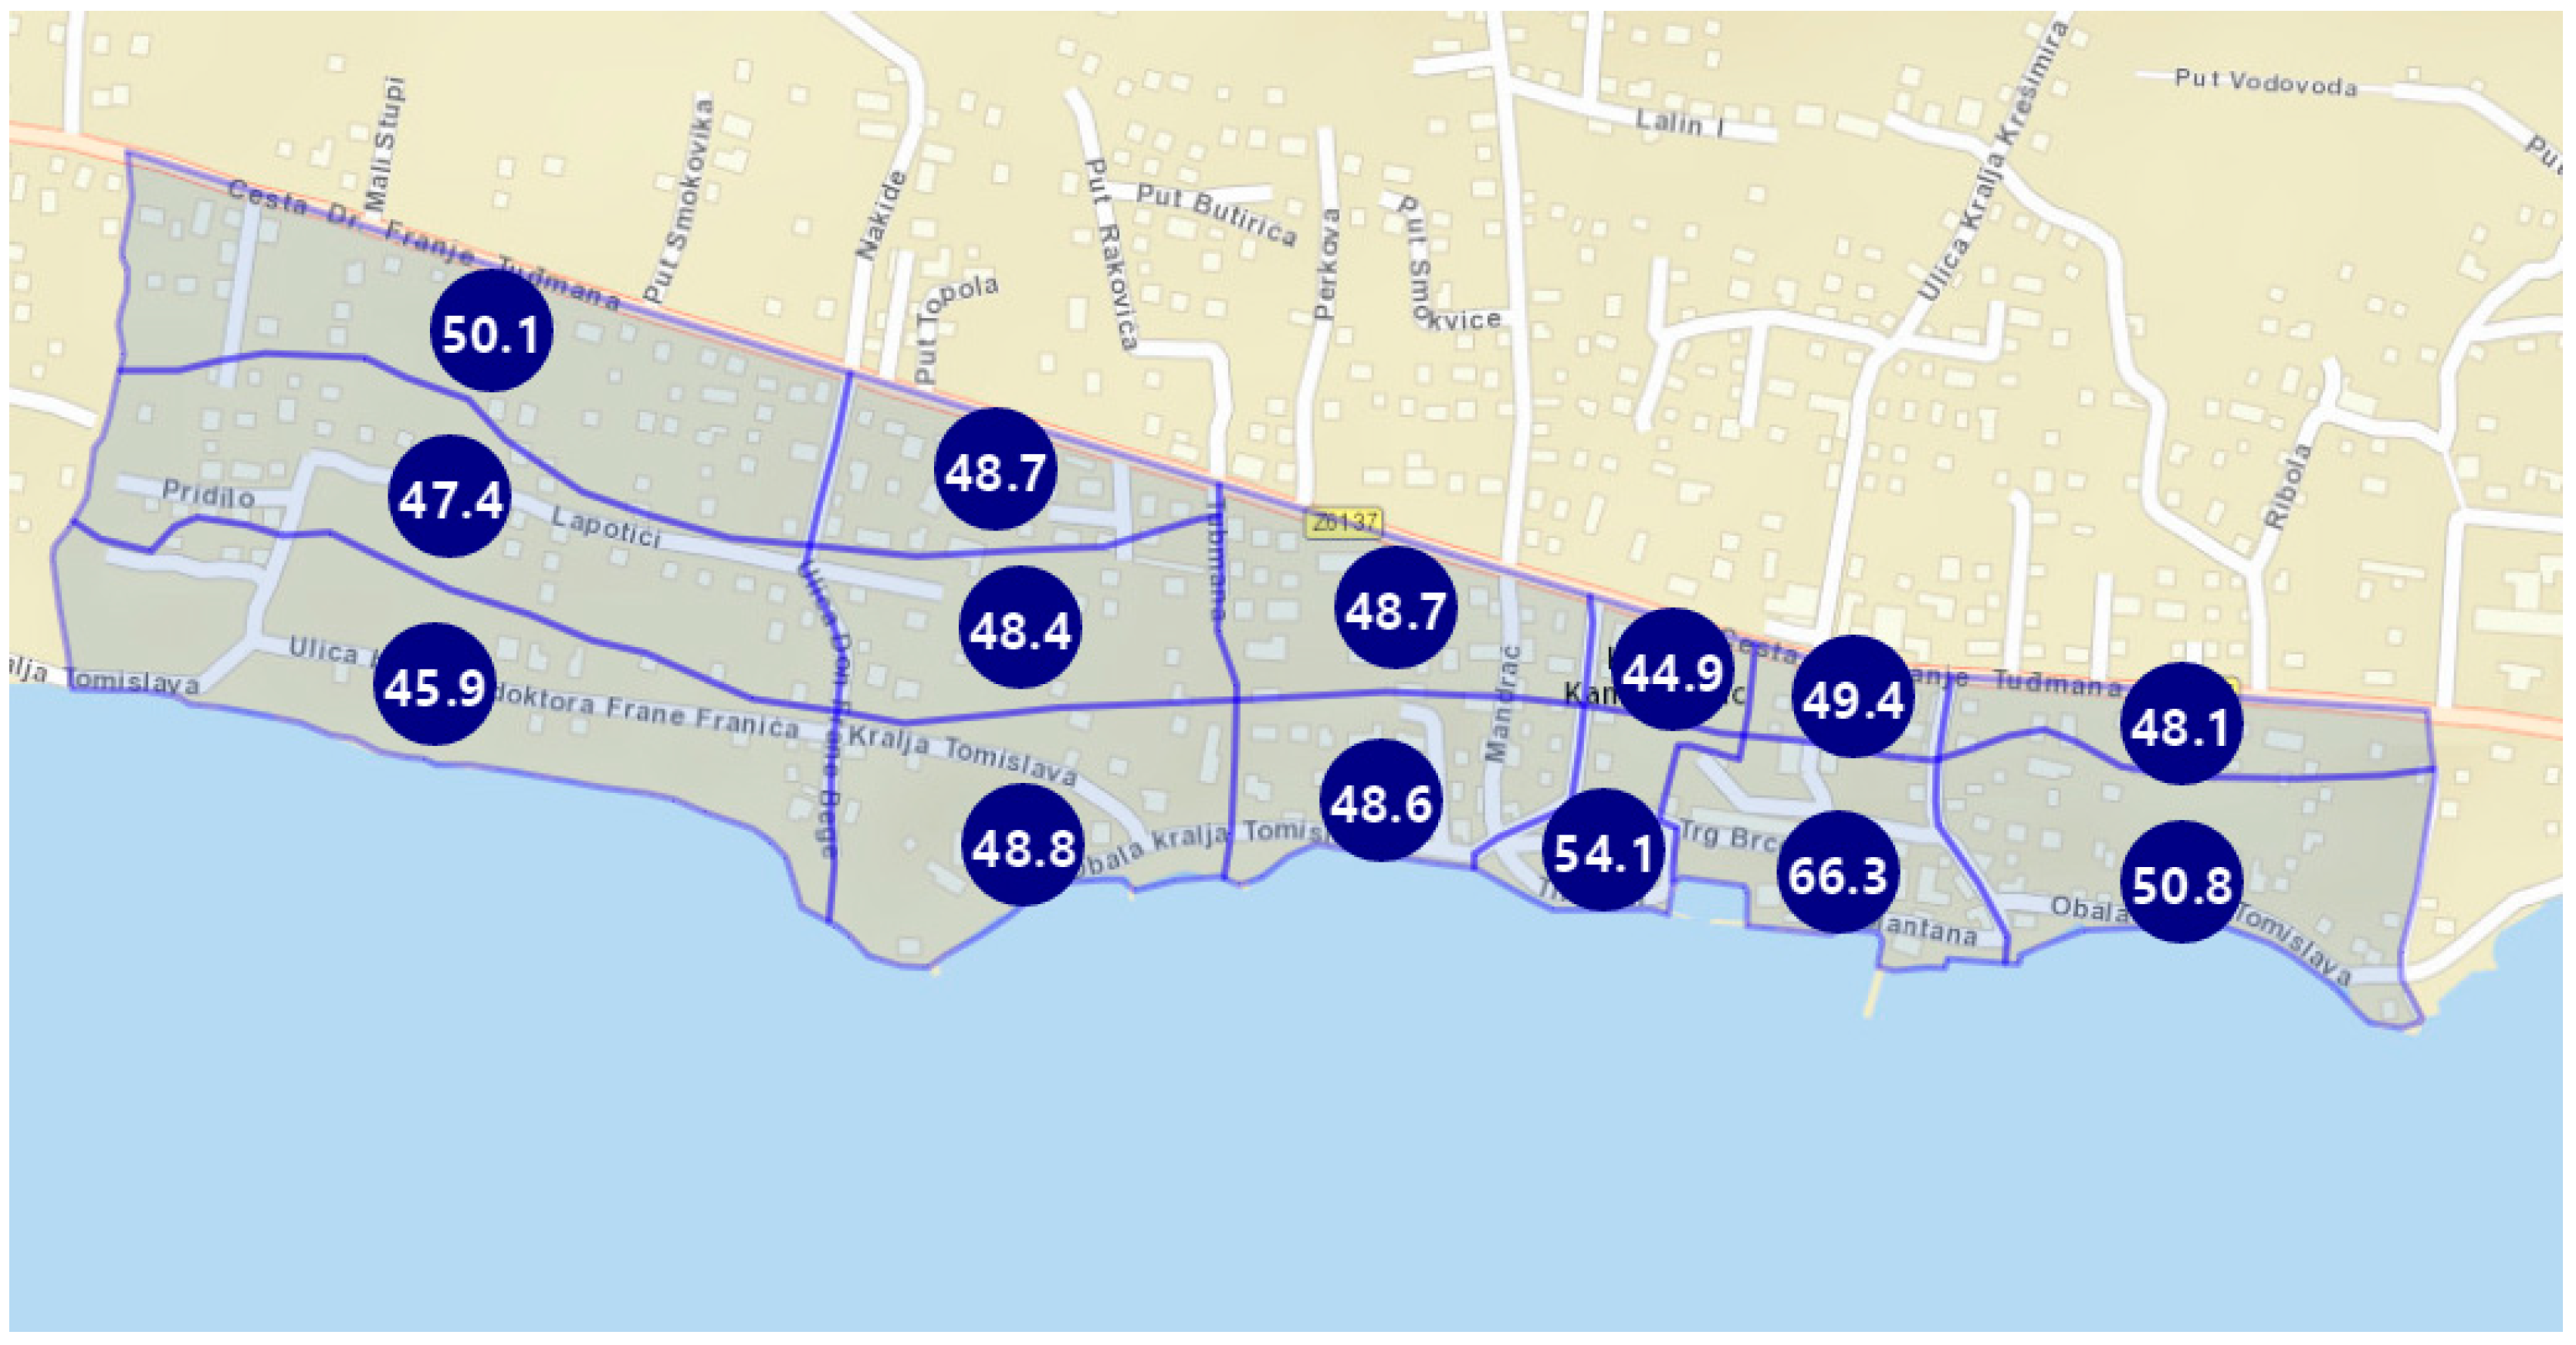
Figure 18.
GIS visualization of risk for seismic and flood hazard for Level 3 (Scenario S-F L3).
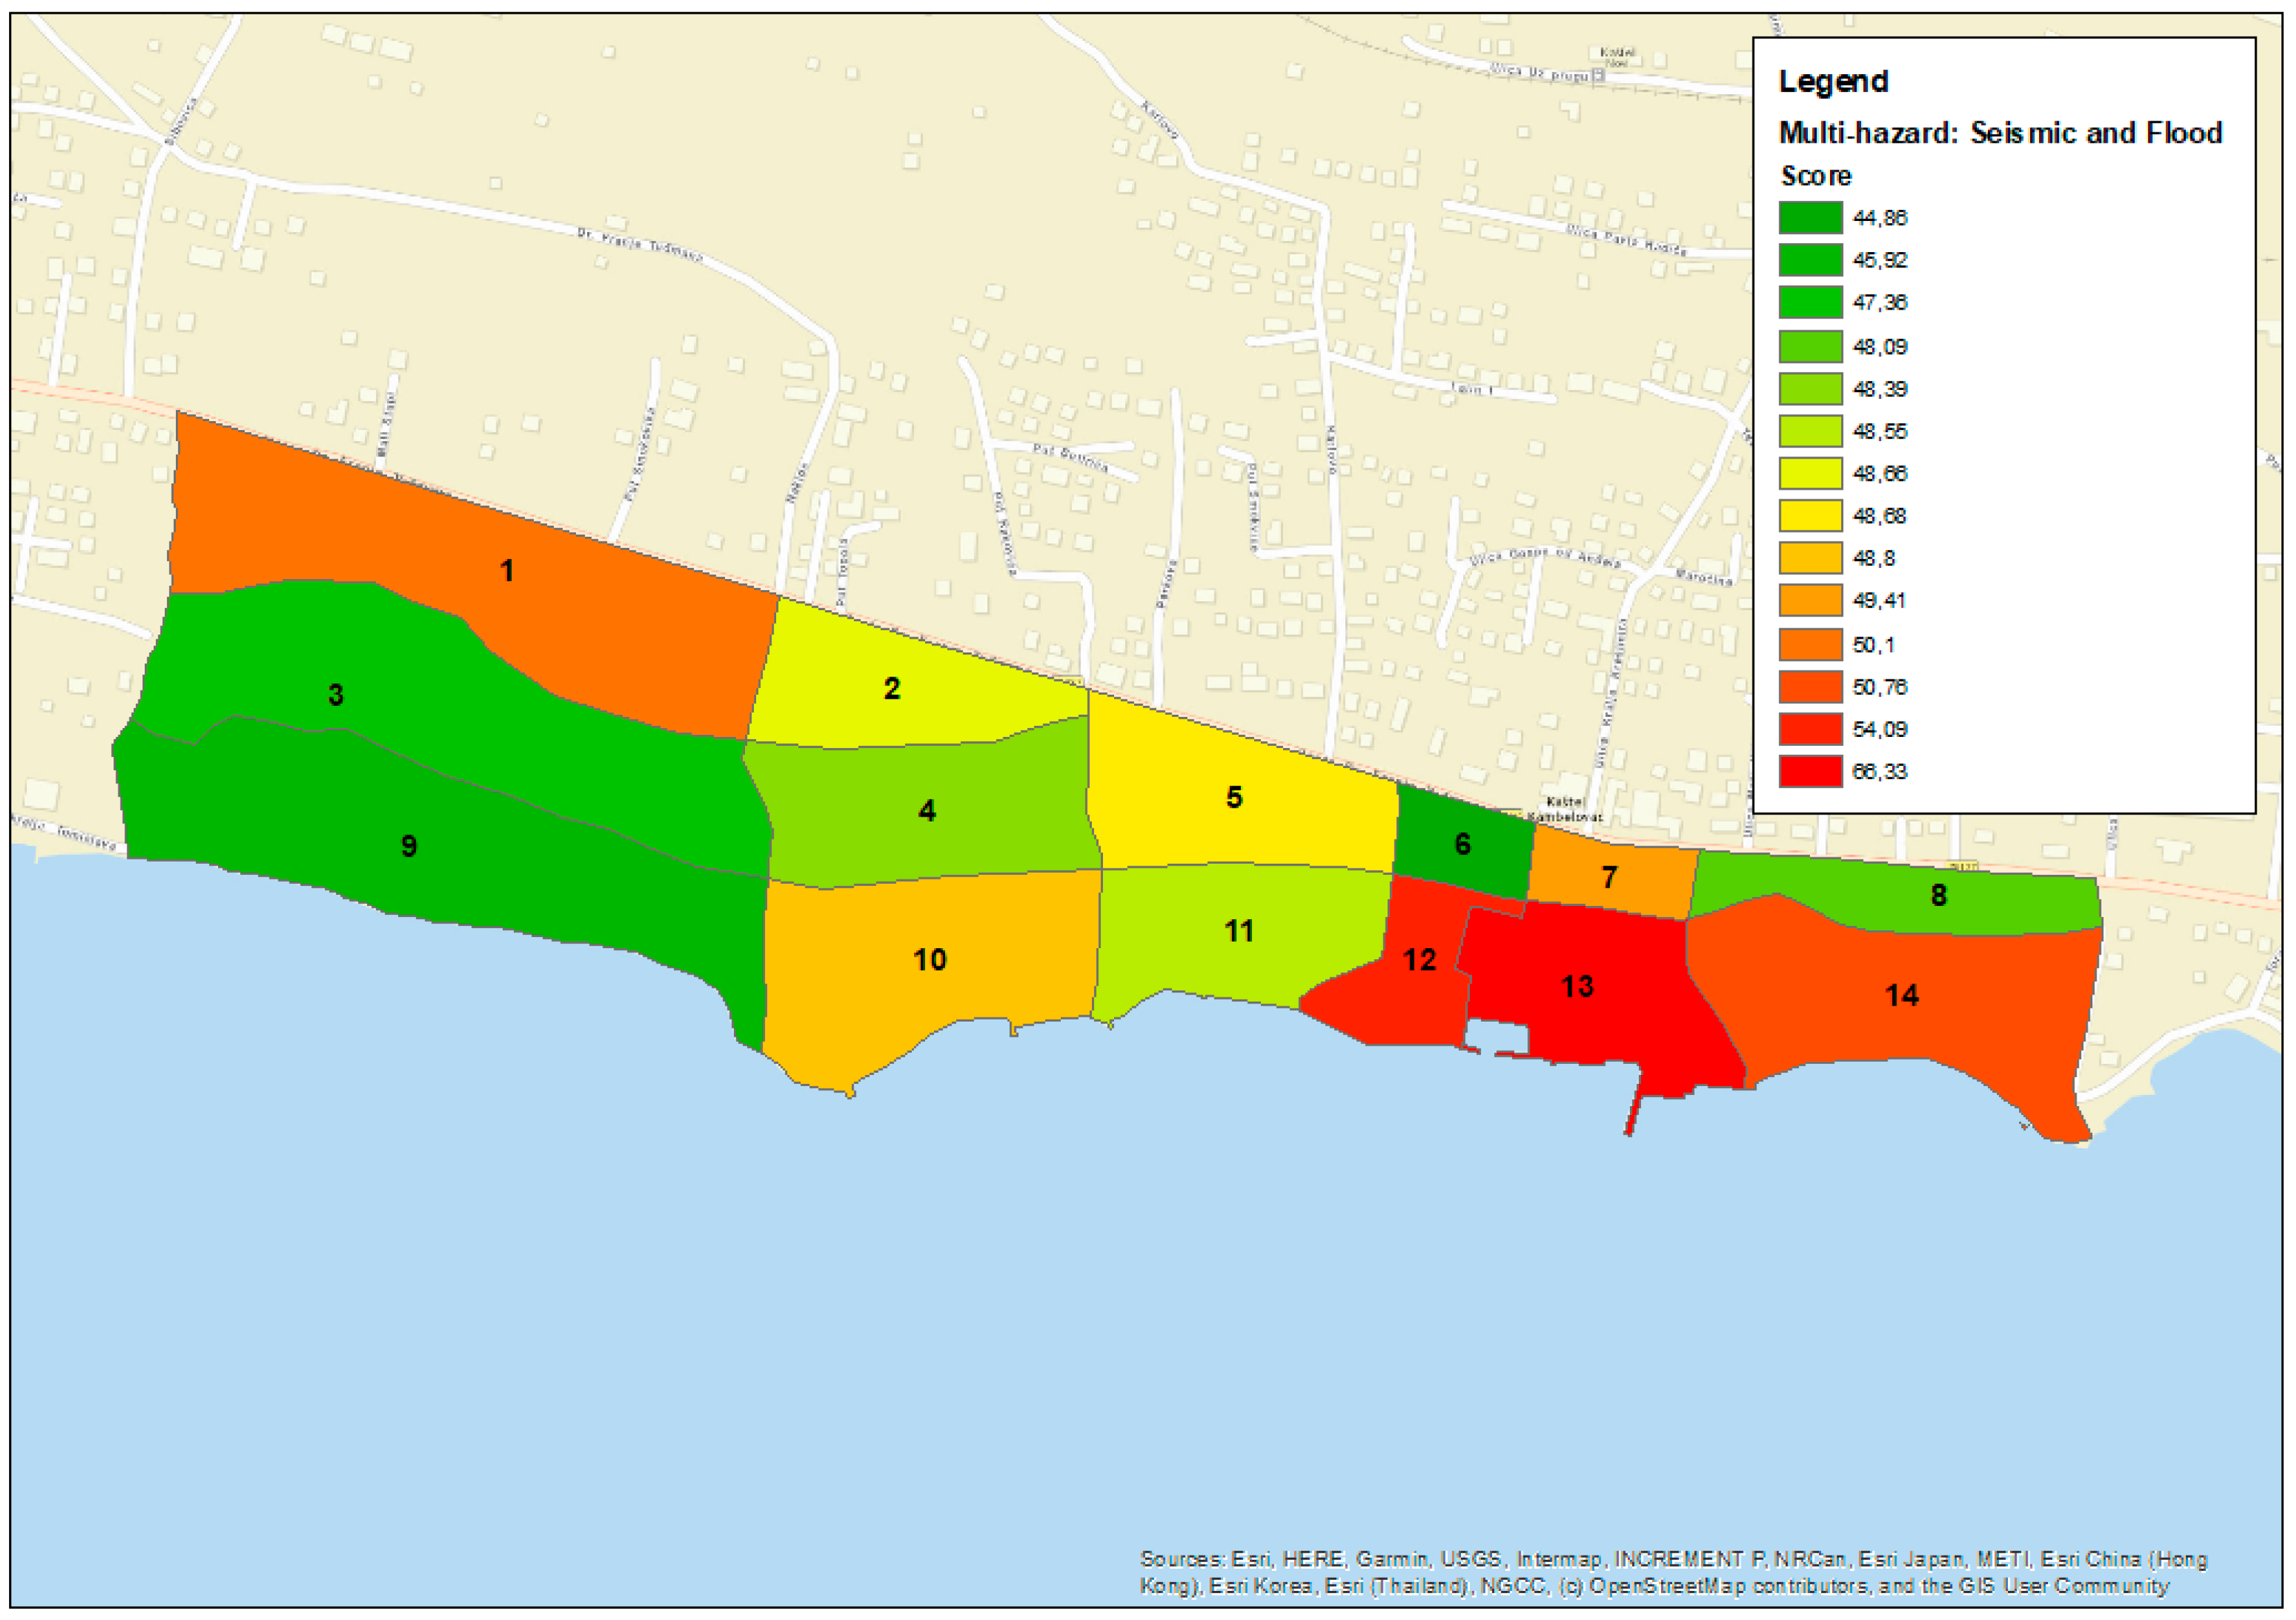
Figure 19.
Input matrix for combined seismic–flood–extreme waves risk (Scenario S-F-EW) multi-criteria analysis with criteria evaluation for all three levels.
Figure 19.
Input matrix for combined seismic–flood–extreme waves risk (Scenario S-F-EW) multi-criteria analysis with criteria evaluation for all three levels.
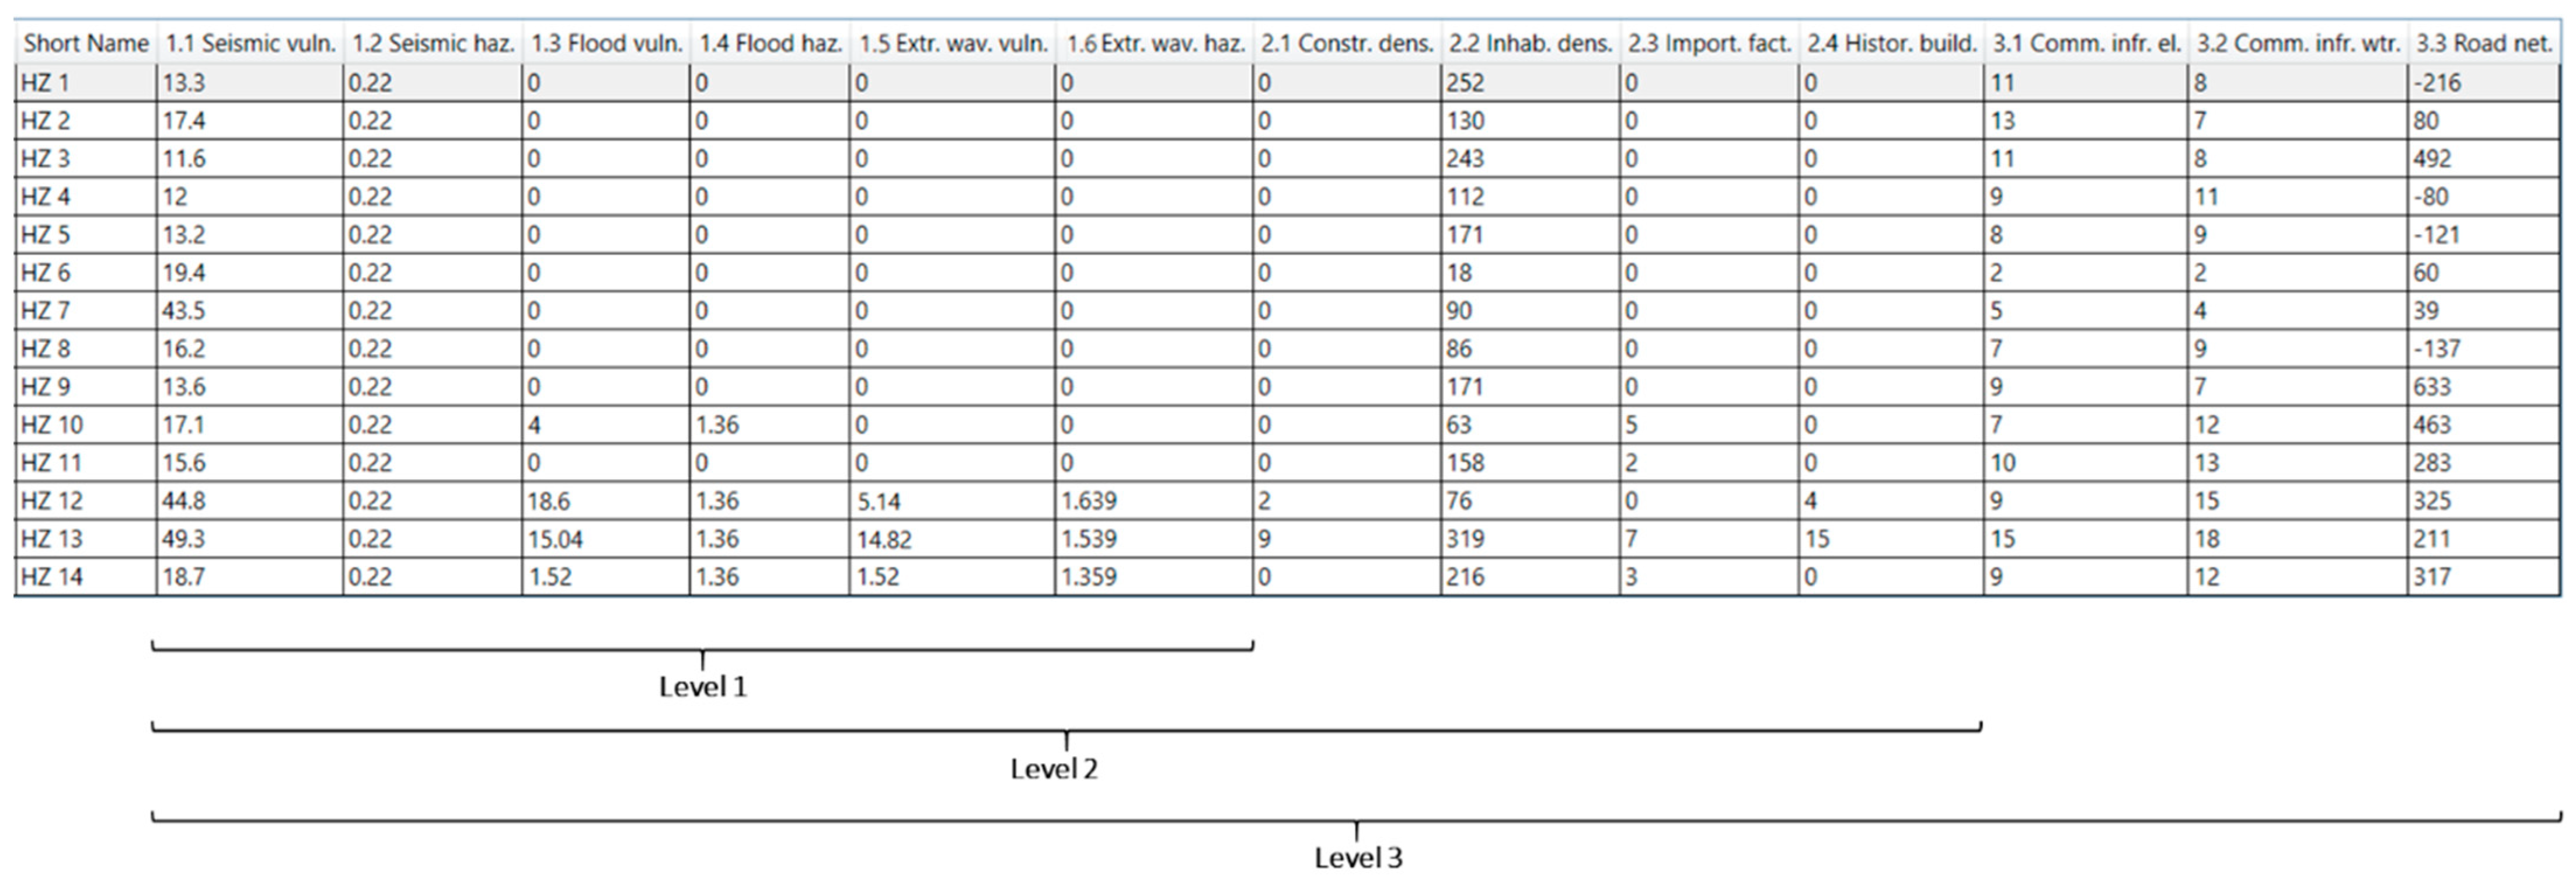
Figure 20.
Results of the risk analysis for seismic, flood and extreme waves hazards for Level 1 (Scenario S-F-EW L1).
Figure 20.
Results of the risk analysis for seismic, flood and extreme waves hazards for Level 1 (Scenario S-F-EW L1).

Figure 21.
Results of the risk analysis for seismic, flood and extreme waves hazards for Level 2 (Scenario S-F-EW L2).
Figure 21.
Results of the risk analysis for seismic, flood and extreme waves hazards for Level 2 (Scenario S-F-EW L2).
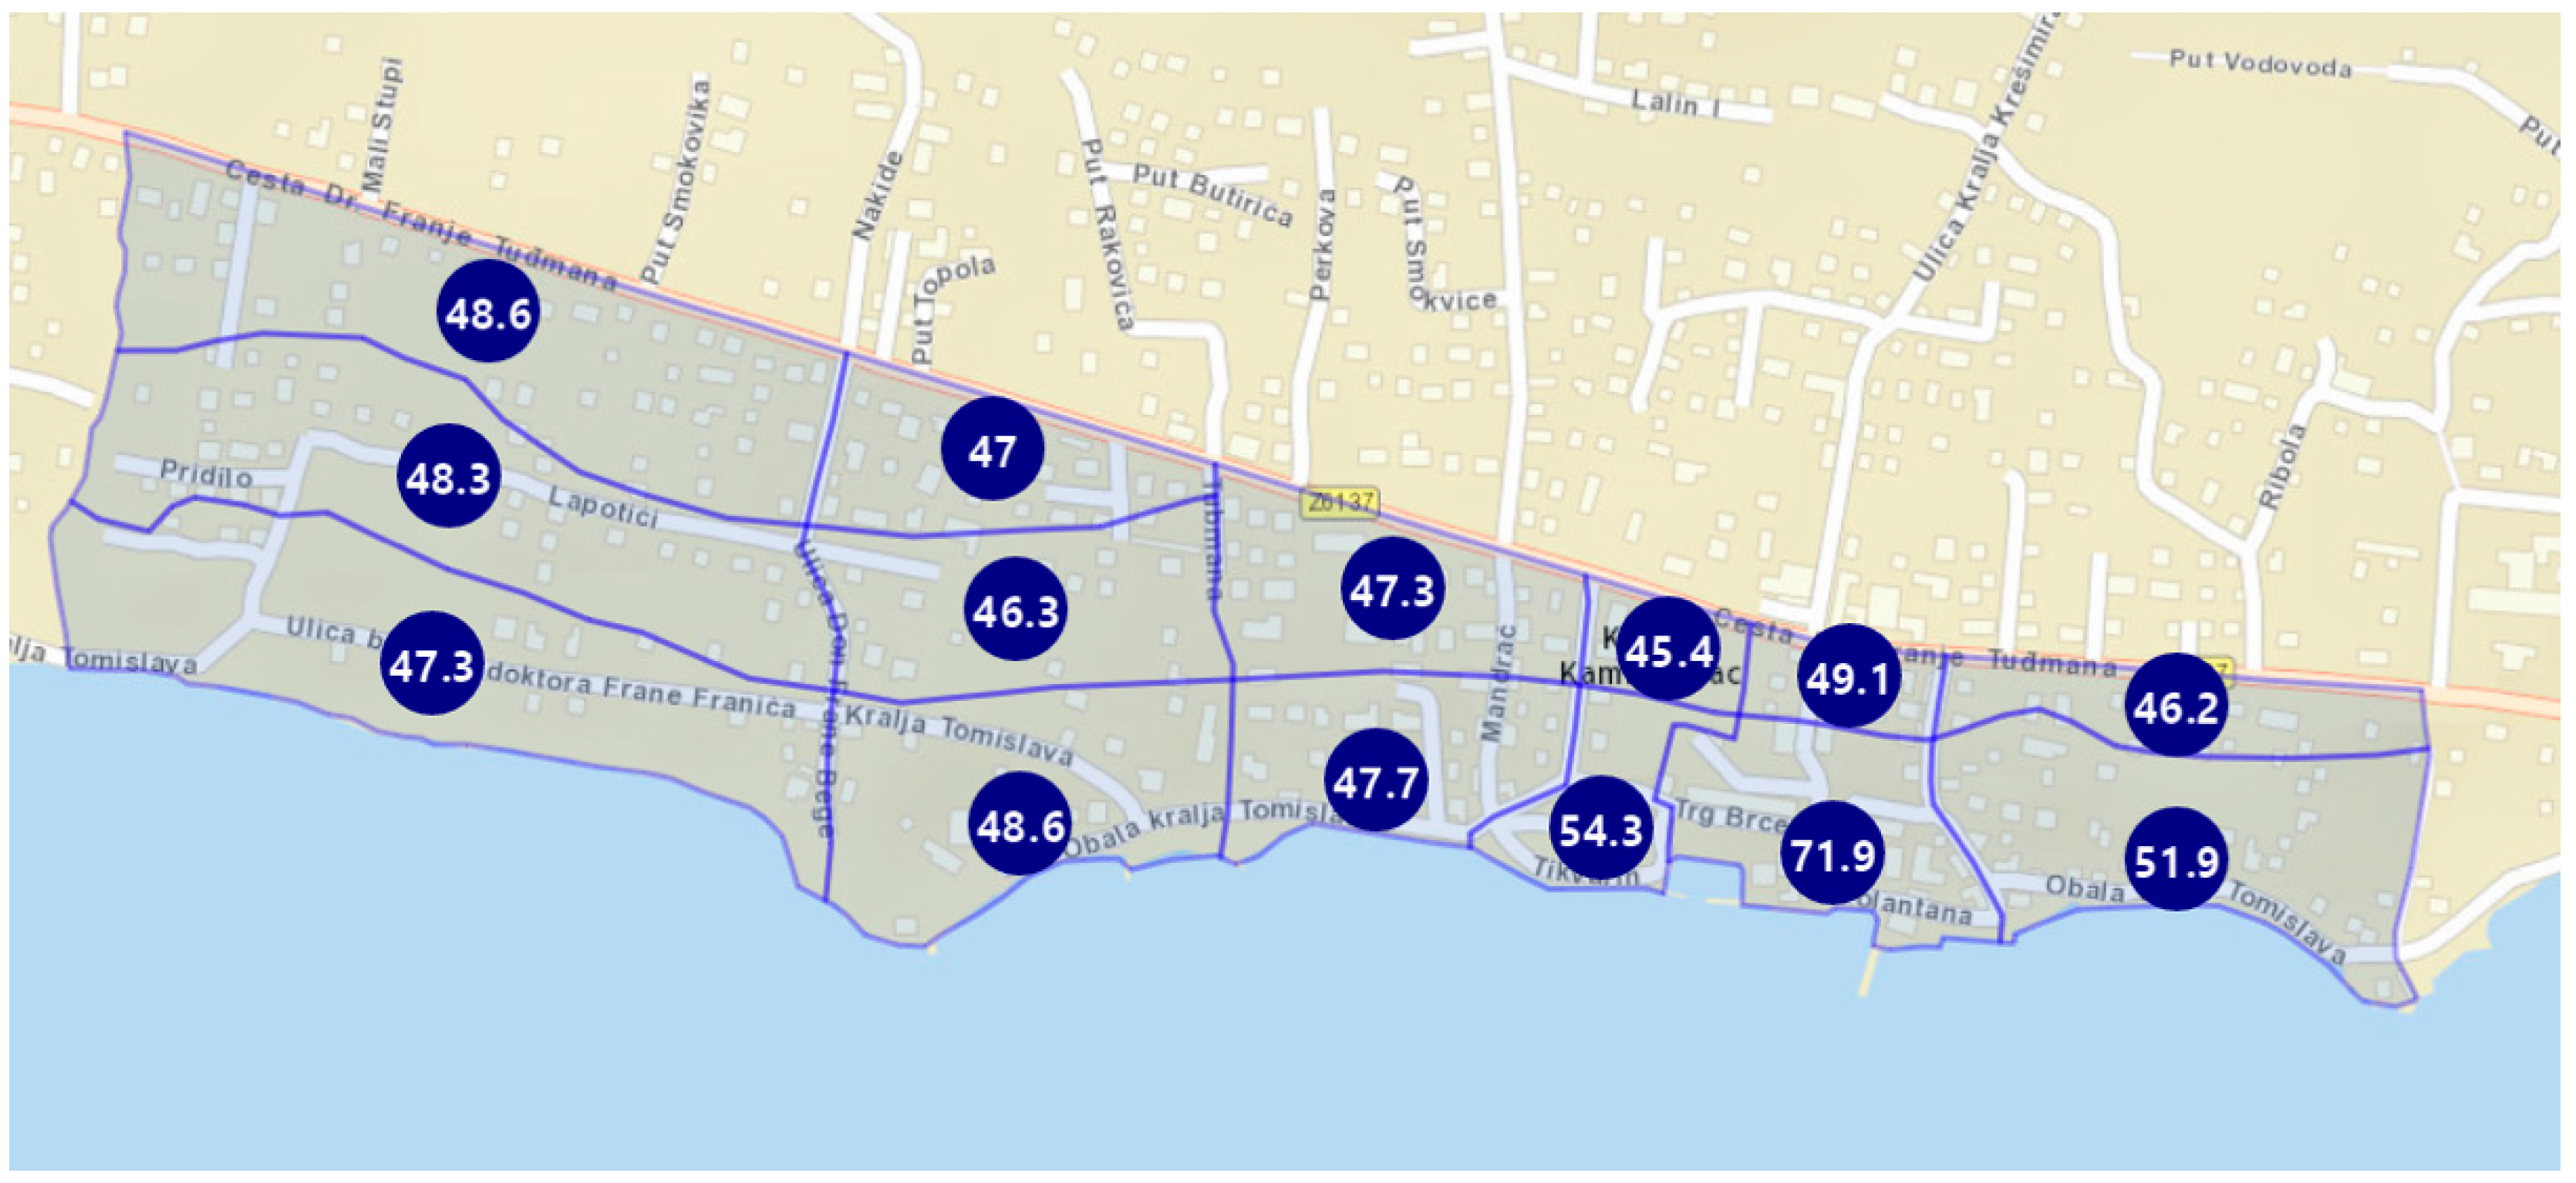
Figure 22.
Results of the combined risk analysis for seismic, flood and extreme waves hazards for Level 3 (Scenario S-F-EW L3).
Figure 22.
Results of the combined risk analysis for seismic, flood and extreme waves hazards for Level 3 (Scenario S-F-EW L3).
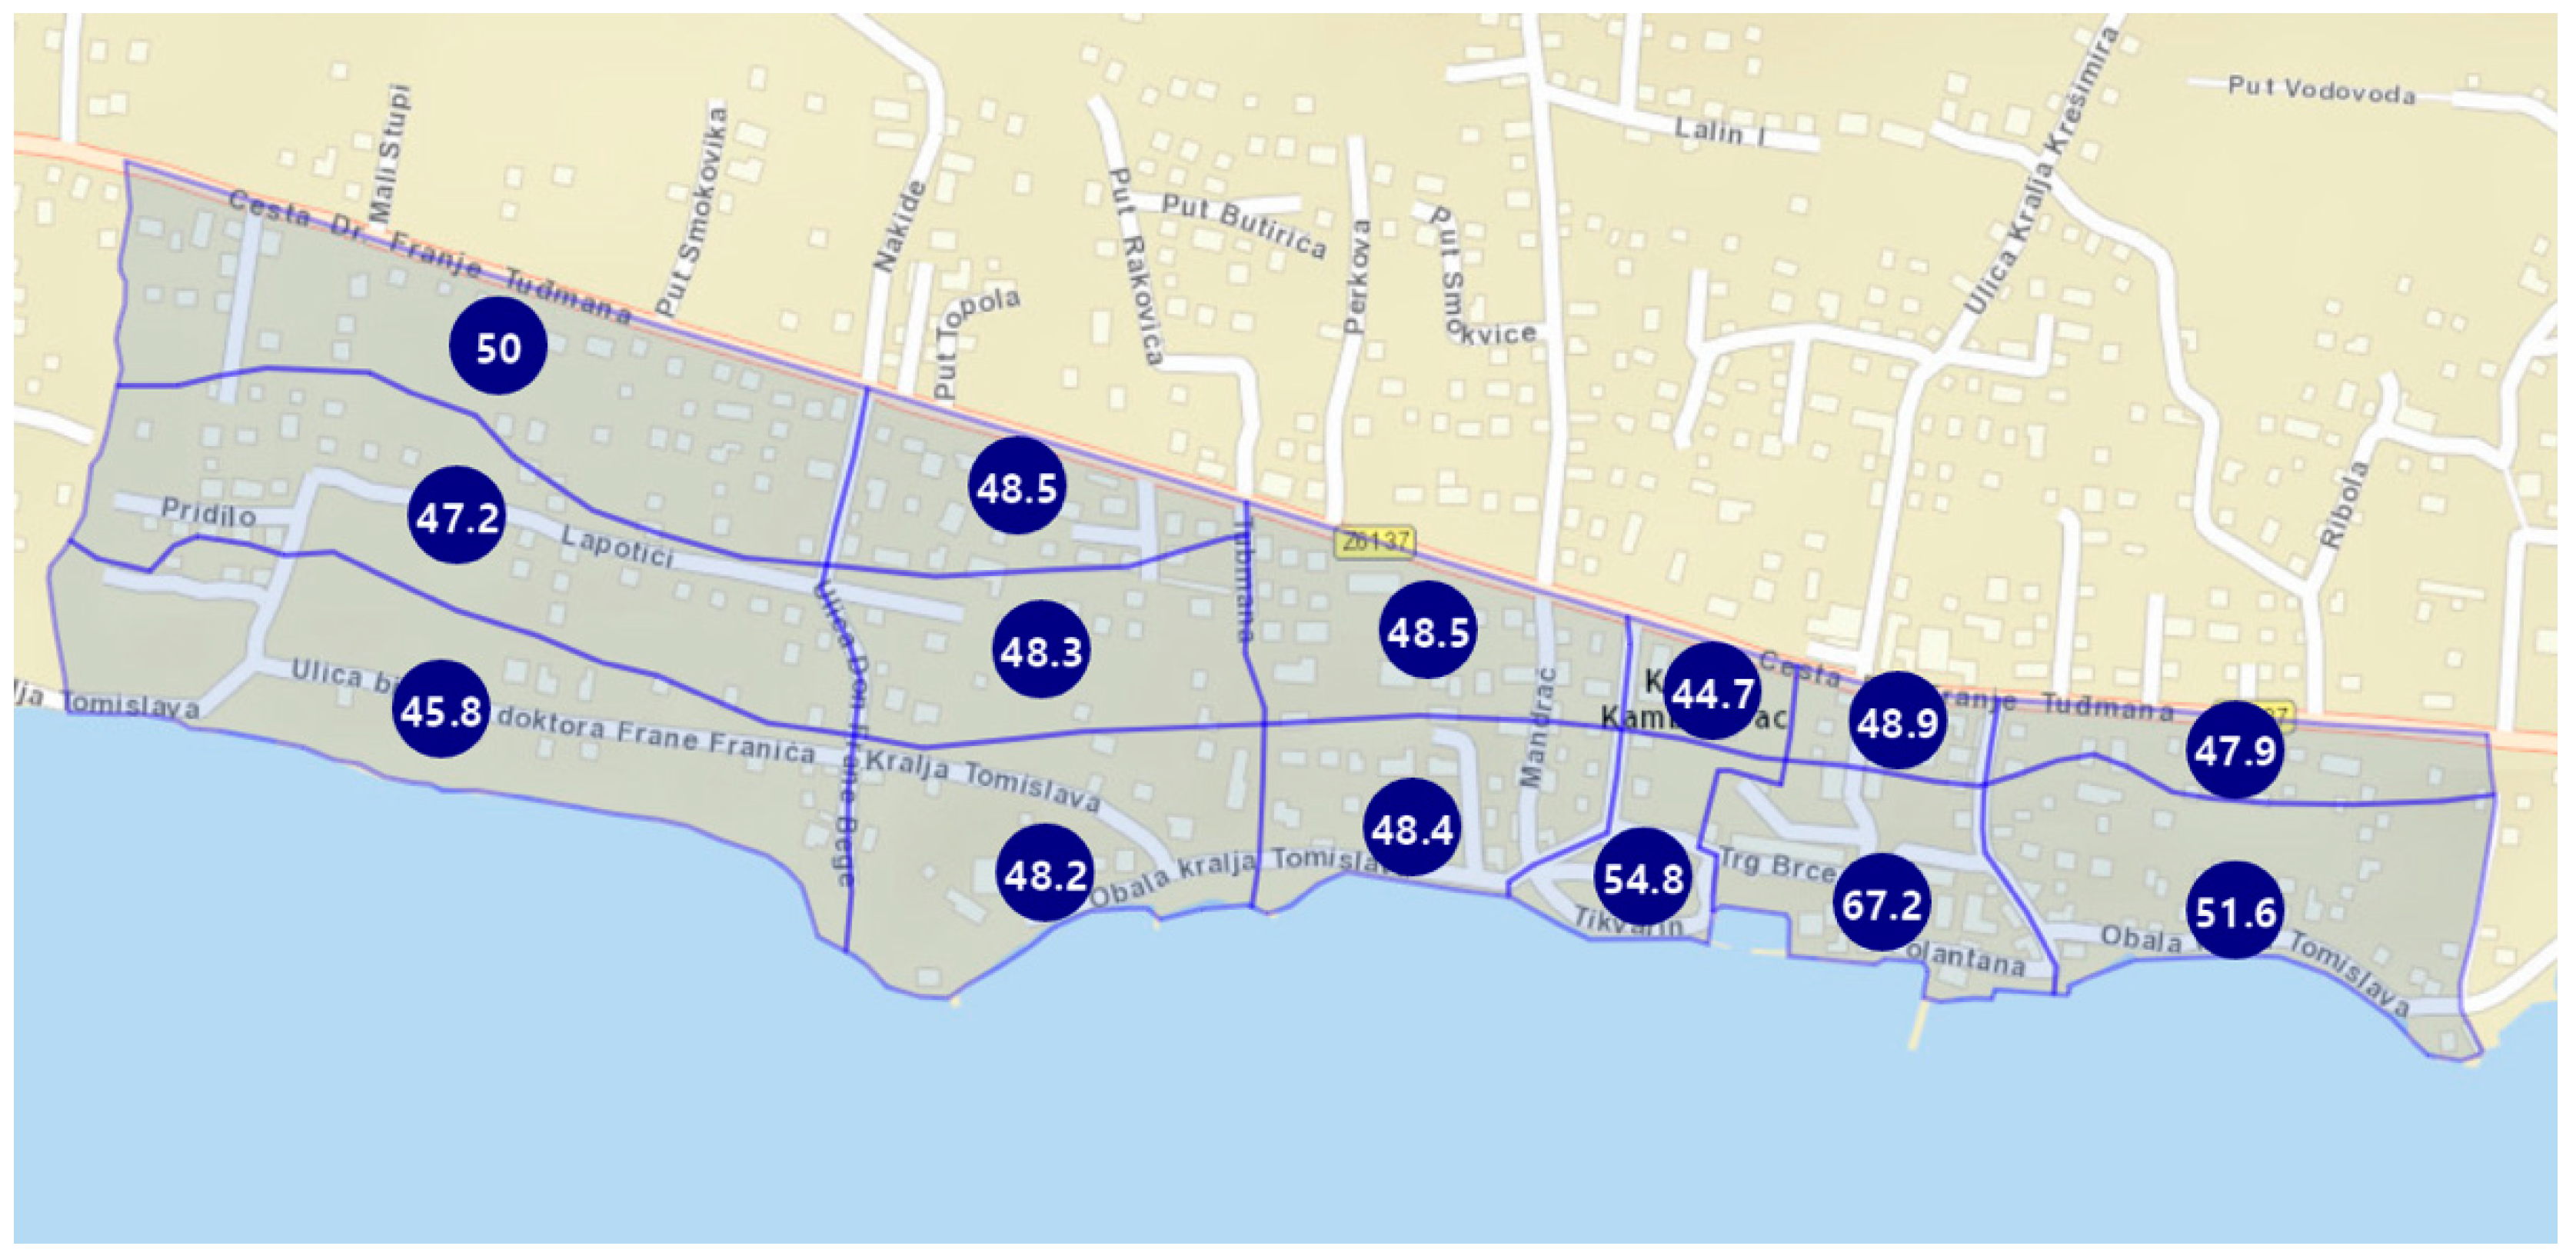
Figure 23.
GIS visualization of risk for seismic, flood and extreme waves hazard for Level 3 (Scenario S-F-EW L3).
Figure 23.
GIS visualization of risk for seismic, flood and extreme waves hazard for Level 3 (Scenario S-F-EW L3).


Table 1.
Brief literature survey on factors used to calculate the risk of natural hazards.
| Approach | Factors | Output | Source | |||
|---|---|---|---|---|---|---|
| Frequency | Intensity | Vulnerability | Other | |||
| Single hazard | Yes | No | No | Damage | Risk | Di Mauro et al. [6] |
| Multi-hazard | Yes | Yes | Yes | Coping capacity | Risk | Fleischhauer et al. [7] |
| Multi-hazard | No | Yes | Yes | Coping capacity | Integrated risk | Greiving et al. [5] |
| Single hazard | Yes | Yes | No | No | Risk | Kunz et al. [8] |
| Multi-hazard | Yes | Yes | Yes | Consequence (loss) | Risk | Liu et al. [9] |
| Multi-hazard | Yes | No | No | Aggregated losses | Risk | Mignan et al. [10] |
| Single hazard | No | No | Yes | Hazard exposure, Exposed value | Risk index | Munich Re Group [11] |
| Single hazard | Yes | Yes | No | Area impact | Hazard score | Odeh Engineers, Inc. [12] |
| Multi-hazard | Yes | Yes | Yes | Elements at risk, Temporal/Spatial probability | Risk | Van Westen [13] |
Table 2.
The basic data of homogenous zones and average seismic vulnerability index.
| Homogenous Zone (HZ) | Area (m2) | Number of Buildings | Seismic Vulnerability Index of Homogenous Zone |
|---|---|---|---|
| HZ1 | 58.627 | 56 | 0.133 |
| HZ2 | 21.865 | 29 | 0.174 |
| HZ3 | 57.189 | 54 | 0.116 |
| HZ4 | 30.925 | 25 | 0.120 |
| HZ5 | 26.972 | 38 | 0.132 |
| HZ6 | 7.763 | 4 | 0.194 |
| HZ7 | 7.767 | 20 | 0.435 |
| HZ8 | 16.168 | 19 | 0.162 |
| HZ9 | 60.068 | 38 | 0.136 |
| HZ10 | 38.133 | 14 | 0.171 |
| HZ11 | 24.972 | 35 | 0.156 |
| HZ12 | 12.696 | 17 | 0.448 |
| HZ13 | 24.903 | 71 | 0.493 |
| HZ14 | 40.782 | 48 | 0.187 |
Table 3.
Combined risks analysis and criteria for each level of analysis.
| Level | Combined Seismic-Flood Risk: Scenario S-F | Combined Seismic-Flood-Extreme Waves Risk: Scenario S-F-EW |
|---|---|---|
| Level 1 criteria | Seismic hazard (1.1) Seismic vulnerability (1.2) Flood hazard (1.3) Flood vulnerability (1.4) | Seismic hazard (1.1) Seismic vulnerability (1.2) Flood hazard (1.3) Flood vulnerability (1.4) Extreme waves hazard (1.5) Extreme waves vulnerability (1.6) |
| Level 2 criteria | Seismic hazard (1.1) Seismic vulnerability (1.2) Flood hazard (1.3) Flood vulnerability (1.4) Construction density (2.1) Inhabitation density (2.2) Importance factor (2.3) Historical buildings (2.4) | Seismic hazard (1.1) Seismic vulnerability (1.2) Flood hazard (1.3) Flood vulnerability (1.4) Extreme waves hazard (1.5) Extreme waves vulnerability (1.6) Construction density (2.1) Inhabitation density (2.2) Importance factor (2.3) Historical buildings (2.4) |
| Level 3 criteria | Seismic hazard (1.1) Seismic vulnerability (1.2) Flood hazard (1.3) Flood vulnerability (1.4) Construction density (2.1) Inhabitation density (2.2) Importance factor (2.3) Historical buildings (2.4) Electrical infrastructure (3.1) Water supply infrastructure (3.2) Road network (3.3) | Seismic hazard (1.1) Seismic vulnerability (1.2) Flood hazard (1.3) Flood vulnerability (1.4) Extreme waves hazard (1.5) Extreme waves vulnerability (1.6) Construction density (2.1) Inhabitation density (2.2) Importance factor (2.3) Historical buildings (2.4) Electrical infrastructure (3.1) Water supply infrastructure (3.2) Road network (3.3) |
Table 4.
An example of criteria weights for combined seismic-flood risk for Scenario S-F Level 2.
| Criteria Group | Group Weight | Criteria | Criteria Weight |
|---|---|---|---|
| Main criteria | 50% | Seismic hazard (1.1) | 21.7% |
| Seismic vulnerability (1.2) | 21.7% | ||
| Flood hazard (1.3) | 3.3% | ||
| Flood vulnerability (1.4) | 3.3% | ||
| Additional criteria (n—number of additional criteria) | 50% | Construction density (2.1) | 50/n = 12.5% |
| Inhabitation density (2.2) | 50/n = 12.5% | ||
| Importance factor (2.3) | 50/n = 12.5% | ||
| Historical buildings (2.4) | 50/n = 12.5% |
Table 5.
An example of criteria weights for combined seismic–flood–extreme waves risk for Scenario S-F-EW Level 2.
Table 5.
An example of criteria weights for combined seismic–flood–extreme waves risk for Scenario S-F-EW Level 2.
| Criteria Group | Group Weight | Criteria | Criteria Weight |
|---|---|---|---|
| Main criteria | 50% | Seismic hazard (1.1) | 19.5% |
| Seismic vulnerability (1.2) | 19.5% | ||
| Flood hazard (1.3) | 2.5% | ||
| Flood vulnerability (1.4) | 2.5% | ||
| Extreme waves hazard (1.5) | 3.0% | ||
| Extreme waves vulnerability (1.6) | 3.0% | ||
| Additional criteria (n—number of additional criteria) | 50% | Construction density (2.1) | 50/n = 12.5% |
| Inhabitation density (2.2) | 50/n = 12.5% | ||
| Importance factor (2.3) | 50/n = 12.5% | ||
| Historical buildings (2.4) | 50/n = 12.5% |
Publisher’s Note: MDPI stays neutral with regard to jurisdictional claims in published maps and institutional affiliations. |
© 2022 by the authors. Licensee MDPI, Basel, Switzerland. This article is an open access article distributed under the terms and conditions of the Creative Commons Attribution (CC BY) license (https://creativecommons.org/licenses/by/4.0/).
Share and Cite
MDPI and ACS Style
Mladineo, N.; Mladineo, M.; Benvenuti, E.; Kekez, T.; Nikolić, Ž. Methodology for the Assessment of Multi-Hazard Risk in Urban Homogenous Zones. Appl. Sci. 2022, 12, 12843. https://doi.org/10.3390/app122412843
AMA Style
Mladineo N, Mladineo M, Benvenuti E, Kekez T, Nikolić Ž. Methodology for the Assessment of Multi-Hazard Risk in Urban Homogenous Zones. Applied Sciences. 2022; 12(24):12843. https://doi.org/10.3390/app122412843
Chicago/Turabian StyleMladineo, Nenad, Marko Mladineo, Elena Benvenuti, Toni Kekez, and Željana Nikolić. 2022. "Methodology for the Assessment of Multi-Hazard Risk in Urban Homogenous Zones" Applied Sciences 12, no. 24: 12843. https://doi.org/10.3390/app122412843
Note that from the first issue of 2016, this journal uses article numbers instead of page numbers. See further details here.