Article

Experimental Assessment of the Influence of the Design on the Performance of Novel Evaporators with Latent Energy Storage Ability

1
GREiA Research Group, Universitat de Lleida, Pere de Cabrera s/n, 25001 Lleida, Spain
2
AKG Verwaltungsgesellschaft mbH, Am Hohlen Weg 31, 34369 Hofgeismar, Germany
*
Author to whom correspondence should be addressed.
Appl. Sci. 2022, 12(4), 1813; https://doi.org/10.3390/app12041813
Submission received: 19 January 2022 / Revised: 5 February 2022 / Accepted: 8 February 2022 / Published: 10 February 2022
(This article belongs to the Special Issue Advances in Thermal Energy Storage Technology)

Abstract

:
This study was carried out within the HYBUILD project, as part of the task aimed at developing novel evaporators for compact and direct integration of phase-change materials (PCM) into air-conditioning systems for efficient utilization of solar energy. To achieve this, novel evaporators were designed to contain PCM between refrigerant and heat transfer fluid (HTF) channels, allowing a three-media heat exchange mechanism. This paper experimentally assesses the influence of the configuration/arrangement of the channels on the performance of the evaporators, using three different lab-scale prototypes. Key performance indicators (KPI) relevant for thermal energy storage (TES) and heat exchangers (HEX) were used to study the influence of the design on the performance of the different designs of the novel evaporators. The results show that the change in the PCM, refrigerant, and HTF channel configuration affects the performance of the novel evaporators independently. The coefficient of performance (COP) of the refrigeration system and the energy storage density of the modules are the least affected KPIs (less than 16%), whereas the state of charge (SOC) at thermal equilibrium is the most affected KPI (about 44%). A discussion on how these effects provide unique strength for specific applications is included.

1. Introduction

The integration of phase-change materials (PCM) for thermal energy storage (TES) into refrigeration, heat pumps (HP), and air-conditioning systems started as early as 1966 [1], and according to a bibliometric study reported in [2], the topic has gained more interest among researchers in the last 10 years. Such a motivation responds to the rapid increase in climate change and aligns with the calls for more green, efficient, and sustainable systems in the decarbonization process [3,4,5]. In the literature, the implementation of PCM is reported to improve the performance of the refrigeration systems through increasing their coefficient of performance (COP) [6] and peak shifting for intermittent energy demand or supply [7]. The strength of the use of PCM is based on their high energy storage density, which could be about 5 to 15 times that of sensible materials [8]. In practical application, the conventional incorporation of PCM into refrigeration systems includes placing the PCM at external surfaces of the evaporator [9] or condenser [10], and placing PCM at the refrigerator/freezer compartment [11,12], among others. This conventional integration of PCM into the systems contains some constraints that include reducing useful space, increasing the overall number of components, and increasing the bulkiness of the systems.
In response to these essential concerns and to develop more compact and efficient systems, recent studies focused on developing three-media heat exchangers. Major contributions noted in the literature include the recent outputs obtained within the HYBUILD project involving novel “refrigerant-PCM-HTF heat exchangers” acting as evaporators and desuperheaters [13].
For the first case, where the novel “refrigerant-PCM-HTF exchangers” are used as the evaporators, the studies include the introduction of the novel concept of compact direct integration of PCM into a refrigeration system performed in [14]. The study included a parametric analysis that assessed the charging and discharging of the novel evaporator-TES module focusing on the PCM behaviour. The results showed that a homogenous charging of the PCM was achieved at a lower compressor power, whereas charging at a higher compressor power led to a pronounced stratification effect and compressor shutdown for security reasons before the PCM was completely charged. Another study consisted of a detailed energy analysis highlighting the energy contribution in each material and the performance of the whole component in three operating modes and different boundary conditions [15]. The results showed that the highest charging/discharging power was around the PCM phase change temperature and, although the sensible material accounted for 87% of the total weight, more than 54% of the energy was stored in the PCM, due to its high energy density. Moreover, a study was carried out on the novel evaporator-TES module in a complex hybrid system that includes a sorption module working as a topping cycle in a cascade configuration of a compression heat pump (HP) [16]. The results showed that the energy efficiency of the heat pump in cascade operation was double compared with compression-only configuration and that, when the system operated in simultaneously charging and discharging of the latent storage mode in a cascade configuration, there was no penalization in terms of efficiency compared with the compression-only configuration. Furthermore, an energy assessment was performed based on a semi-dynamic model of a vapour compression chiller coupled with the novel evaporator-TES module [17]. The model was built in TRNSYS, based on custom-built lumped parameters, and was used to assess the performance of the proposed system on annual basis. The results indicated an enhanced solar fraction, especially for partial cooling loads, and enhanced performance when using the system with the novel module in comparison with the conventional system.
In the second case, where the novel modules are used as the desuperheater in HPs, the studies developed include a techno-economic analysis to optimize the size of the novel three-media module in [18]. In the study, a model of the whole system was developed and validated to assess the performance of the system operated for heating, cooling, and domestic hot water (DHW) in three buildings of different typology, located at three climate zones. The results showed increased energy savings with the novel module compared with a standard system, and significant energy savings in hot climates, whereas from an economic point of view the system is more suitable in a low-energy building in cold climates. Furthermore, a dynamic system operation and control was examined, with the novel module used as a desuperheater in the HP to generate DHW more efficiently by taking profit of the hot refrigerant at the compressor discharge in [19,20]. The PCM charging and discharging, as well as three-fluids HEX operating mode were analysed, based on several weeks of operation. The results indicated that this configuration was capable of stable operation under a wide range of operating conditions with an improved COP. In addition, a study was carried out through simulations at a system level for typical operating conditions for a system with the novel module as a desuperheater [21]. The results predicted annual energy savings of up to 11%.
From the aforementioned literature review, the aspects covered in previous studies include the determination of optimal operating conditions for charging and discharging processes [14], the possible operating modes and energy contribution of each material in the module [15], the testing of the module at demo scale in a heat pump that works with a sorption system in a cascade configuration [16], the determination of the optimal size of the novel module [18], the determination of stable operation ranges [20], and the performance analysis of a system coupled with the novel concept in comparison with conventional batteries [17]. One critical aspect not addressed in previous studies is the impact of the design/configuration of the modules on their performance, which is covered in this paper. The novel concept of developing compact modules taking advantage of the three-media heat exchange is reported to foster both technical and economic benefits over the conventional integration of PCM into refrigeration, HP, and air conditioning systems. Given its potential, and as a new technology, the open literature lacks in-depth investigations, especially experimental studies.
In response to that, this study focuses on characterizing the novel evaporator designs, assessing their performance based on different possible arrangements of the PCM layers, the refrigerant channels, and HTF channels. The novel evaporator-TES modules were developed for compact and direct integration of PCM into refrigeration and air-conditioning applications. In this study, three distinct modules characterized with different configurations/arrangements of the PCM layers between the refrigerant and HTF passages were used. The main characteristics of the modules are as follows: the first module ( TES 1 ) contains each PCM layer in contact with the refrigerant and HTF channels, the second module ( TES 2 ) contains every two PCM layers in contact with the refrigerant and HTF channels, and the third module ( TES 3 ) contains every four PCM layers between the refrigerant and HTF channels. The scope of this paper includes testing the three modules in a dedicated set-up, assessing the impact of the configuration/arrangement of the channels (refrigerant, PCM, and HTF) on their performance as heat exchangers and as TES modules. Thereafter, several key performance indicators (KPIs) related to the evaporator-TES modules were analyzed, such as: the energy storage density, the response to the energy demand side and supply side (charging and the discharging power), the state of charge (SOC) at thermal equilibrium, the effectiveness of the modules, and the COP of the system.

2. Materials and Methods

This section presents the methodology applied in studying the three designs of the novel evaporator-TES module. It includes the description of the components, experimental set-up, material characterization, experimental methodology, and theoretical methodology. In this study, the novel “refrigerant-PCM-HTF heat exchangers” are referred to as “evaporator-TES modules” or as “TES” or “modules” for simplicity.

2.1. Description of the Modules

The investigated modules are three novel evaporator-TES modules with latent energy storage ability, designed by the company AKG (Hofgeismar, Germany) [22]. They are constructed of dense aluminum alloy with high mechanical stability, and the internal design is such that PCM layers are between refrigerant channels and the HTF channels. The arrangement of the channels and the dimensions of the modules are presented in Figure 1. The external dimensions of TES 2 and TES 3 are similar and are presented in Figure 1d; block A (300 × 94 × 310 mm), block W1 and W2 (60 × 94 × 310 mm), block R1 and R2 (45 × 55 × 310 mm), and block P1 and P2 (65 × 55 × 310 mm). However, the external dimension of TES 1 is also similar, with the exception of the height, which is 274 mm instead of 310 mm. The design allows three distinct operating modes, i.e., charging process, discharging process, and three fluids heat-transfer mode, where heat/cold is exchanged simultaneously among the refrigerant, the PCM, and the HTF. The characteristics of the modules are reported in Table 1, showing the structure characteristics and the quantity of material filled. The modules are quite similar in size, with a weight of the empty module of 18 kg, 20.38 kg, and 20.15 kg for TES 1 , TES 2 , and TES 3 , respectively. All modules were filled with the following amounts of commercial RT4 PCM manufactured by Rubitherm [23]: 3.2 kg in TES 1 and 3.7 kg in TES 2 , and TES 3 .
The main difference between the modules is the order of the arrangement of the PCM layers, the refrigerant channels, and the HTF channels. TES 1 refers to the module with one PCM layer between each refrigerant and HTF channel,   TES 2 refers to the module with two PCM layers between each refrigerant and HTF channel, whereas TES 3 refers to the module with four PCM layers between refrigerant and HTF channels, as shown in Figure 1. One noticeable difference between the three modules is that in the case of TES 1 and TES 3 , the HTF and refrigerant channels are in close thermal contact, whereas in TES 2 the HTF and refrigerant layers are separated by two PCM layers. The height of the HTF and the refrigerant channels is 3 mm, whereas that of the PCM layer is 10 mm.

2.2. Experimental Set-up and Experimental Methodology

The modules were mounted into the experimental test rig shown in Figure 2, which consists of two loops. The first loop is a cold loop in which the modules act as an evaporator in a refrigeration system. The refrigerant enters the modules at the bottom and leaves at the top. The refrigeration system used, described in [14], is a variable cooling capacity condensing unit (Zanotti model GCU2030ED01B) with a hermetic scroll compressor (CU E scroll digital), air-cooled condenser and an electronic expansion valve. The condensing unit has a maximum cooling power of 4.956 kW and a COP of 2.12 when working under ambient temperature of 32 °C with fixed evaporation temperature of −10 °C, according to the manufacturer. The second loop is a hot loop that consists of a thermostatic bath working with a water-glycol mixture as the HTF. The cold loop was used to charge (solidify) the PCM and the hot loop was used to discharge (melt) the PCM.
For the comparison of the three modules, experiments were performed for three operating modes, i.e., charging mode, discharging mode, and three-fluids HEX mode. To ensure repeatability and robustness of the results, at least three experiments were performed in each operating mode. The results reported in this paper were obtained from charging the module with compressor power at 30% and discharging the module with the HTF inlet conditions at 12 °C and 100 L/h. For the three-fluids HEX operating mode, a combination of both was applied, i.e., compressor power at 30% and the HTF flow inlet conditions at 12 °C and 100 L/h. The data acquisition was realized using nine temperature sensors (Pt-100 class B type), in direct contact with the PCM, one temperature sensor at each inlet and outlet of both the refrigerant and the HTF, and one temperature sensor at the liquid line at the condenser outlet. The data were recorded every 10 s during the process using a STEP DL-01 data logger connected to a computer with Indusoft SCADA software. Moreover, to minimize the cold losses from the modules to the ambient during the process, each evaporator-TES module was insulated with 12 cm thick mineral wool [23].

2.3. Materials and Its Characterization

The properties of the PCM and the HTF are summarized in Table 2. The PCM filled in the modules is an organic commercial paraffin thermally stable and chemically inert. Some of its properties according to the manufacturer datasheet [24] are: phase change temperature between 2 °C and 4 °C, thermal conductivity k P C M = 0.2   W·m−1·K−1, density ρ P C M , s = 880 kg·m−3 in solid-state and ρ P C M , l = 770 kg·m−3 in liquid-state. According to the manufacturer, the TES capacity between −8 °C and 7 °C is 180 kJ·kg−1. To obtain the PCM enthalpy and specific heat capacity over a wider range of temperature, experiments were carried out using DSC 3+ Toledo equipment with 0.1 K precision for temperature and ± 3 J·s−1 for enthalpy. The results obtained from the DSC measurements were reported in [25] and used to generate the PCM enthalpy curve h P C M (in kJ·kg−1) as a function of its temperature T (in °C), as shown in Equation (1) [15].
h P C M ( T ) = { 152.49 + 2.64 · ( 4 T )   [ kJ · kg 1 ] ,     if     T < 4   ° C 0.1139 · T 3 1.3116 · T 2 8.5545 · T + 131.97   [ kJ · kg 1 ] ,   if 4   ° C T < 6   ° C 0.0985 · T 3 + 2.8732 · T 2 28.629 · T + 99.839   [ kJ · kg 1 ] ,   if   6   ° C T 12   ° C   2.38 · ( T 12 )   [ kJ · kg 1 ] ,     if   T > 12   ° C
The HTF used in the heating/discharging loop is a water-glycol mixture of 30% of glycol. Among the thermo-physical properties according to the manufacturer datasheet [26], one can mention a freezing temperature of −18 °C, an average density ρ H T F = 1050.45 kg·m−3, an average specific heat capacity C p H T F = 3602 J·kg−1·K−1, and a thermal conductivity k H T F = 0.4275 W·m−1·K−1, in the temperature range of operation. Moreover, another relevant material in the module is aluminum (Al), which accounts for more than 70% of the total weight of each module when filled with PCM and HTF. The specific heat capacity of aluminum was obtained from the literature [27] as C p A l = 900 J·kg−1·K−1.

2.4. Theoretical Evaluation Methodology

The overall cold energy transferred to the module during the charging process, E c h (in kJ), was evaluated as shown in Equation (2).
E c h = i = 1 n [ m P C M , i · ( h P C M ( T i , t = t c h ) h P C M ( T i , t = 0 ) ) + ( m A l , i · C p A l + m H T F , i · C p H T F ) · ( T i , t = 0 T i , t = t c h ) ]
where the sub-index i refers to each of the volume elements, n = 9 is the total number of volume elements considered (equal to the number of PCM temperature sensors), m P C M , i is the mass of PCM, m H T F , i is the mass of HTF, and m A l , i is the mass of aluminium in volume element i , a sub-index t refers to the time instant, with t c h being the time taken to complete the charging process. The enthalpy or the specific heat capacity, the measured temperature and the mass of each material were incorporated into the finite element method detailed in [15,28] to obtain the energy level in the module. Thereafter, basic equations of thermodynamics {Equations (3)–(9)} on heat transfer and energy balance adapted from [29] were used to complete the evaluation.
The average power during the charging process, E ˙ ¯ c h (in kW), was evaluated as in Equation (3).
E ˙ ¯ c h = E c h t c h
The energy discharged from the systems during the discharging process, E d i s (in kJ), was evaluated as shown in Equation (4).
E d i s = t = 0 t d i s [ V ˙ H T F · ρ H T F · C p H T F · ( T H T F , i n T H T F , o u t ) ] t · Δ t + t = 0 t d i s [ U A l o s s · ( T a T a v ) t ] · Δ t
where V ˙ H T F is the volume flow rate of the HTF, T H T F , i n and T H T F , o u t are the temperatures of the HTF at the inlet and outlet of the module, respectively, t d i s is the time taken to complete the discharging process, U A l o s s is the overall heat transfer coefficient for heat losses, T a is the ambient air temperature, T a v is the average PCM temperature, and Δ t = 10 s is the time interval between two consecutive measurements.
The average power during the discharging process, E ˙ ¯ d i s (in kW), was evaluated as in Equation (5).
E ˙ ¯ d i s = E d i s t d i s c
The effectiveness ε of the TES module was evaluated using Equation (6).
ε = E ˙ H T F a c t u a l E ˙ H T F m a x
The actual HTF power, E ˙ H T F a c t u a l , was evaluated using Equation (7), whereas the maximum HTF power, E ˙ H T F m a x , was evaluated using Equation (8).
E ˙ H T F a c t u a l = V ˙ H T F · ρ H T F · C p H T F · ( T H T F , i n T H T F , o u t )
E ˙ H T F m a x = V ˙ H T F · ρ H T F · C p H T F · ( T H T F , i n T r e f , i n )
where T r e f , i n is the refrigerant inlet temperature.
The state of charge (SOC) at thermal equilibrium was obtained as in Equation (9)
SOC = E c h , @ e q E c h , @ 4 ° C  
where E c h , @ e q = E c h ( T i , t = t c h = T i , t = t e q ,   T i , t = 0 = 12   ° C ) is the energy level (stored) in the module until thermal equilibrium is achieved, whereas E c h , @ 4 ° C = E c h ( T i , t = t c h = 4   ° C ,   T i , t = 0 = 12   ° C ) is the theoretical energy stored when charging the module from 12 °C to −4 °C, being each E c h , @ T evaluated using Equation (2) reported above.
To evaluate the coefficient of performance (COP) of the refrigeration equipment, a commercial software “Copeland select software” by Emerson [30] was used. For any output parameter, it requires selecting the compressor model, the name of the refrigerant, and including some input parameters such as temperature and pressure at different locations of the refrigeration cycle. The parameters of the experimental test rig and the measured values were introduced to the software, i.e., the compressor model (ZF13KVE-TFD EVI), refrigerant (R449a), evaporator pressure P e v a , condenser pressure P c o n d , and suction gas temperature T r e f , o u t .
The simple empirical correlation shown in equation Equation (10) was derived, using a regression tool, for the evaluation of the COP from experimental data.
C O P = 0.785 · P e v a 0.249 · P c o n d + 4.149
The results reported include the uncertainty evaluated using Equation (11). The overall uncertainty is contributed from the accumulated errors from the measurements of the temperature (using Pt-100 with an accuracy of ±0.3 °C), the volumetric flow rate given as 0.3% by the manufacturer, the density of HTF as 0.31% obtained from [31], and the specific heat capacity as 3.09% obtained from [32]).
u ( E ˙ H T F ) = [ [ δ E ˙ δ ρ u ( ρ H T F ) ] 2 + [ δ E ˙ δ V ˙ u ( V ˙ H T F ) ] 2 + [ δ E ˙ δ Cp u ( C p H T F ) ] 2 + [ δ E ˙ δ Δ T H T F u ( Δ T H T F ) ] 2   ] 0.5
where u ( ρ H T F ) is the uncertainty in the density, u ( V ˙ H T F ) is the uncertainty in the volumetric flow, u ( C p H T F ) is the uncertainty in the specific heat capacity, and u ( Δ T H T F ) is the uncertainty in the temperature measurements. The uncertainty was evaluated according to the GUM methodology [33], providing an expanded relative uncertainty for u ( E ˙ H T F ) of 4.6% (at 95% confidence level and normal probability distribution, with k = 2 ).

3. Results

This section presents the experimental results of the three novel evaporator-TES modules in terms of temperature evolution, energy storage, charging and discharging power, effectiveness, and COP of the system, starting with the repeatability and robustness of the results.

3.1. Repeatability and Robustness of the Results

Figure 3 shows the repeatability and robustness of the results, in terms of average temperature evolution in charging, discharging, and three fluid heat-exchange modes. At least three tests were performed for each experiment, and the results show a reasonable degree of agreement. For the charging process, an average standard deviation of 0.87 °C was obtained, with a maximum standard deviation of 1.56 °C. (The standard deviation was evaluated from the nine thermocouple readings at every time step and the average and maximum values were obtained using the entire process). For the discharging process, the average standard deviation was 0.55 °C, with a maximum deviation of about 1.02 °C. Likewise, the repeatability in the three-media HEX operating mode is quite reasonable. The average deviation in the HTF temperature difference between the inlet and outlet ( Δ T H T F ) was 0.2 °C, with a maximum of 0.67 °C, and refrigerant temperature difference between the inlet and outlet ( Δ T r e f ) was 0.41 °C, with a maximum deviation of 1.49 °C.

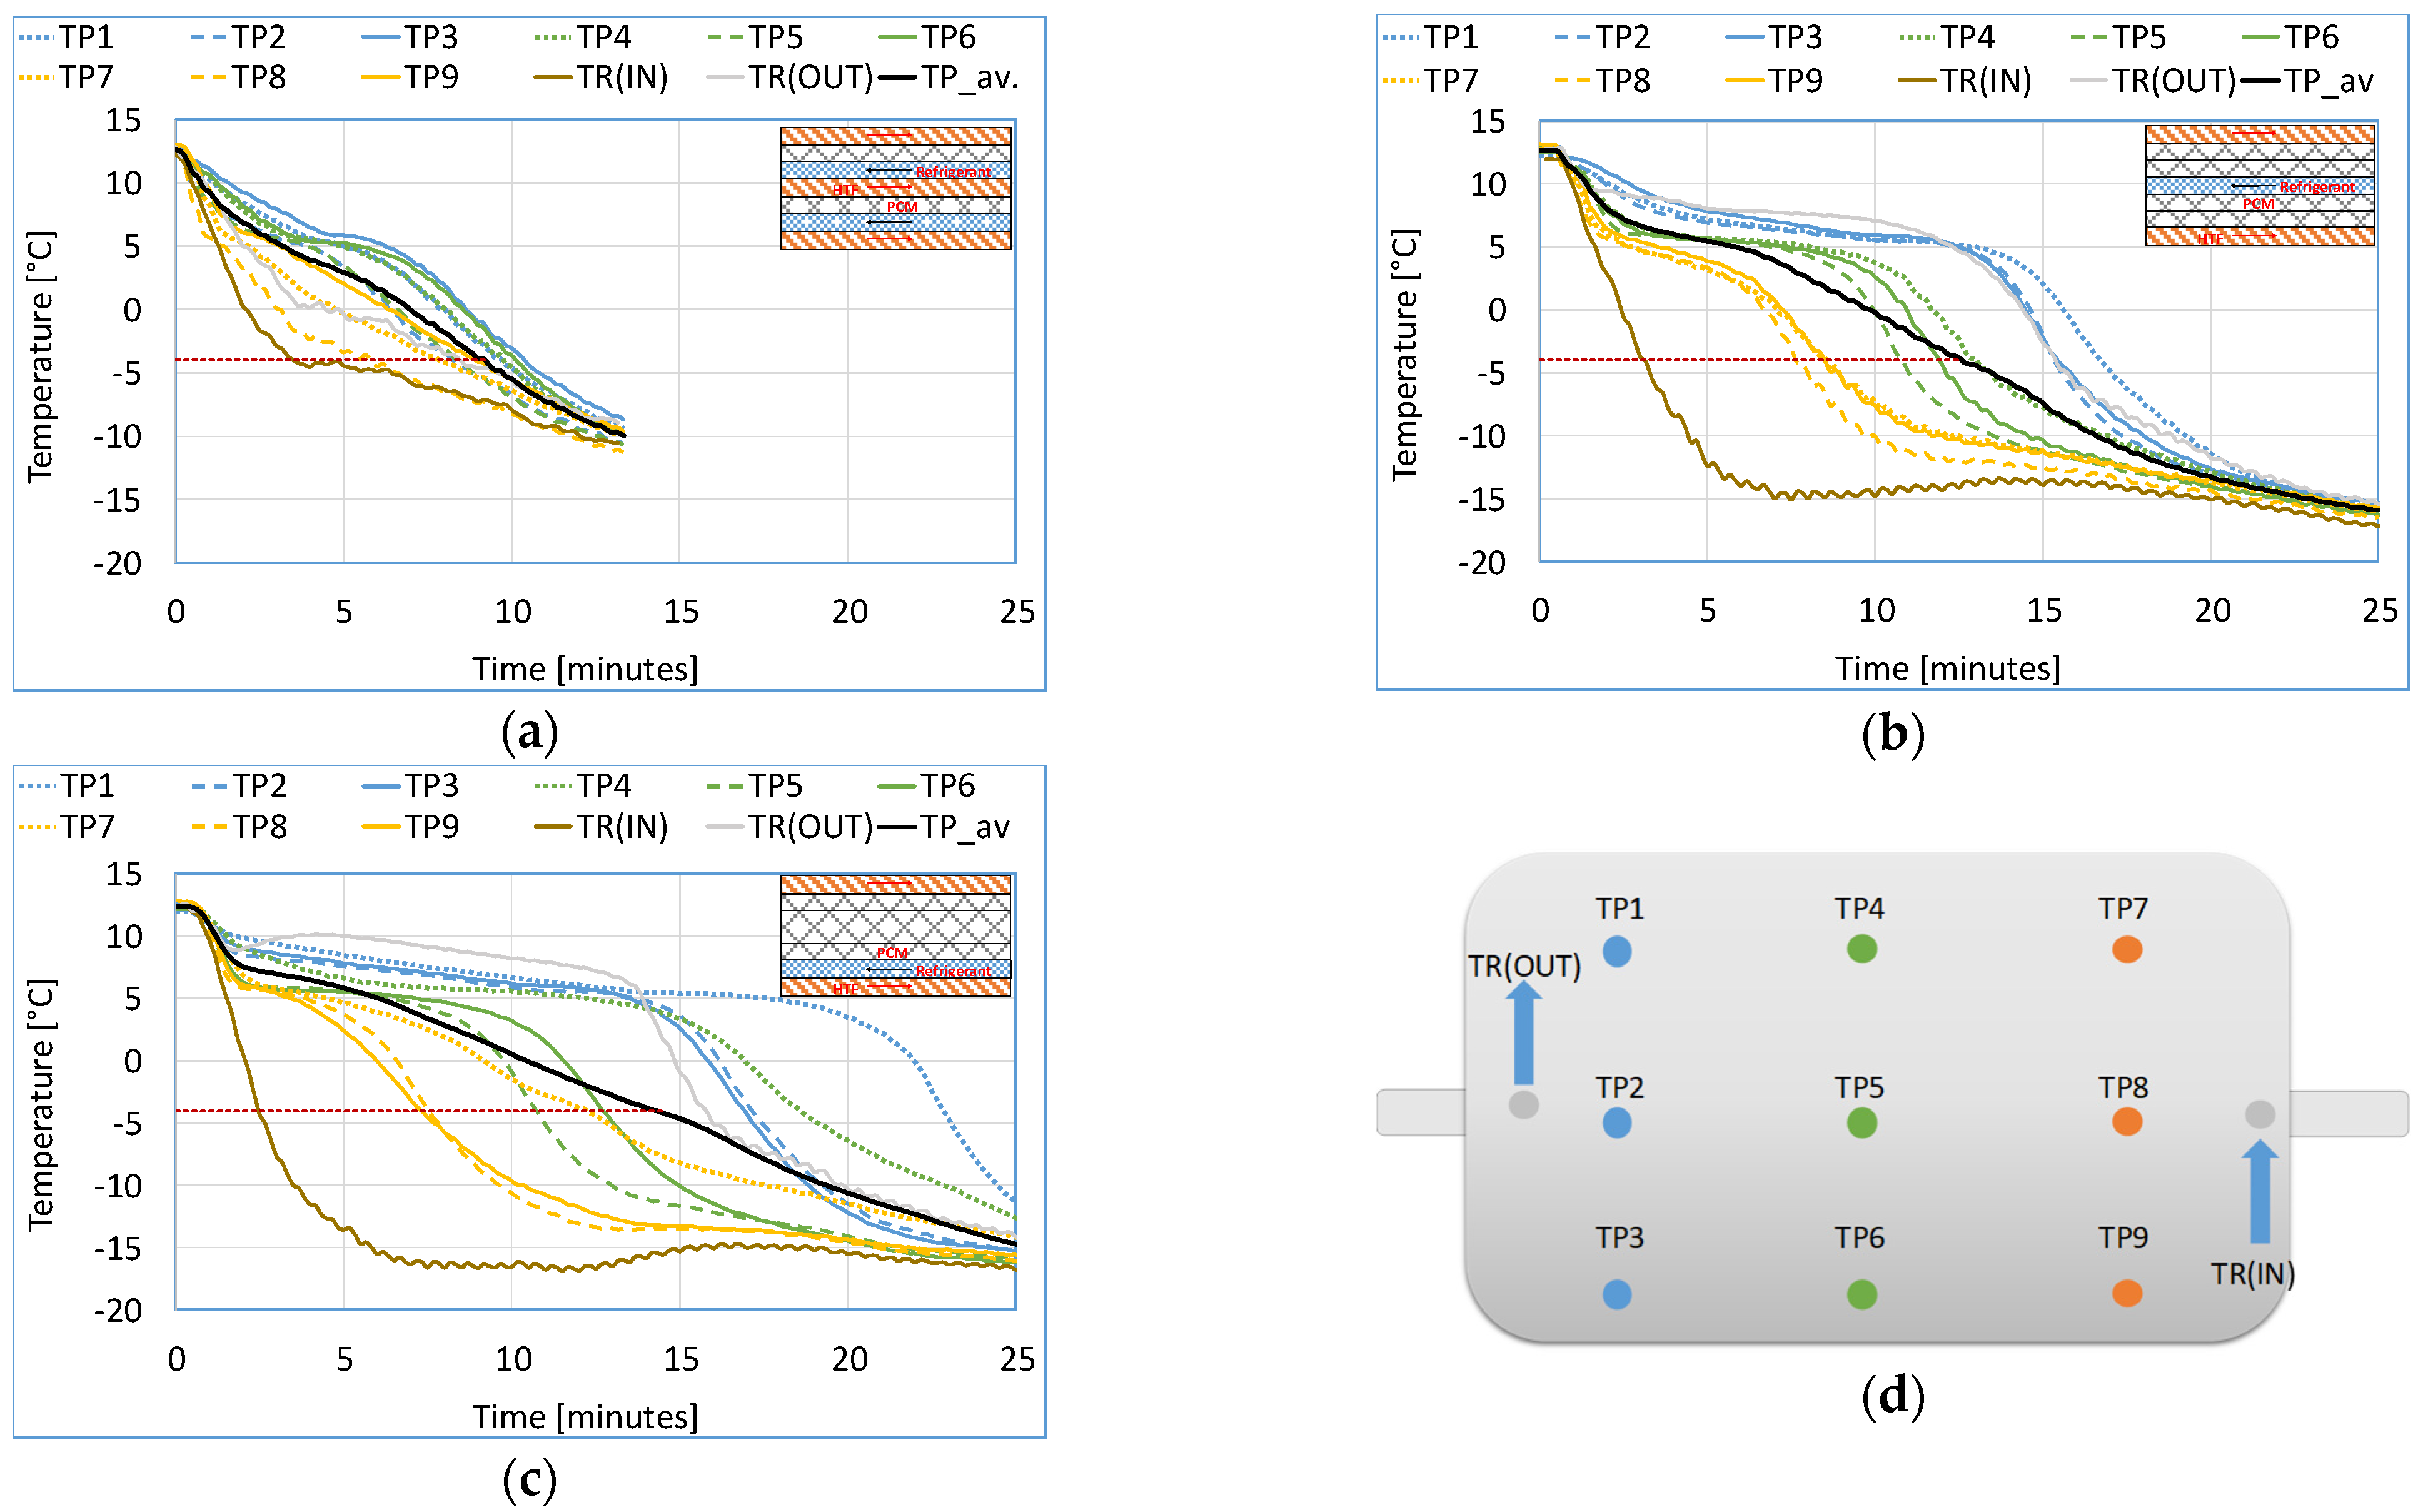
3.2. Temperature Evolution in the Charging Process

Figure 4 shows the temperature profiles for the charging process of the three modules. The temperature profile for TES 1 (Figure 4a) presents the most homogenous charging of the PCM. Considering the average temperature of the PCM (black curve) as a reference, the temperature gradient is minimal in TES 1 , whereas it is quite pronounced in TES 2 and TES 3 , (Figure 4b,c, respectively). This means that, for practical applications, where the average temperature is normally used to set the minimum threshold for the charging process, care must be taken since this could lead to partial charging of the PCM. Indeed, it is evident that the PCM in TES 2 and TES 3 was only partially charged when the average temperature was around −4 °C.

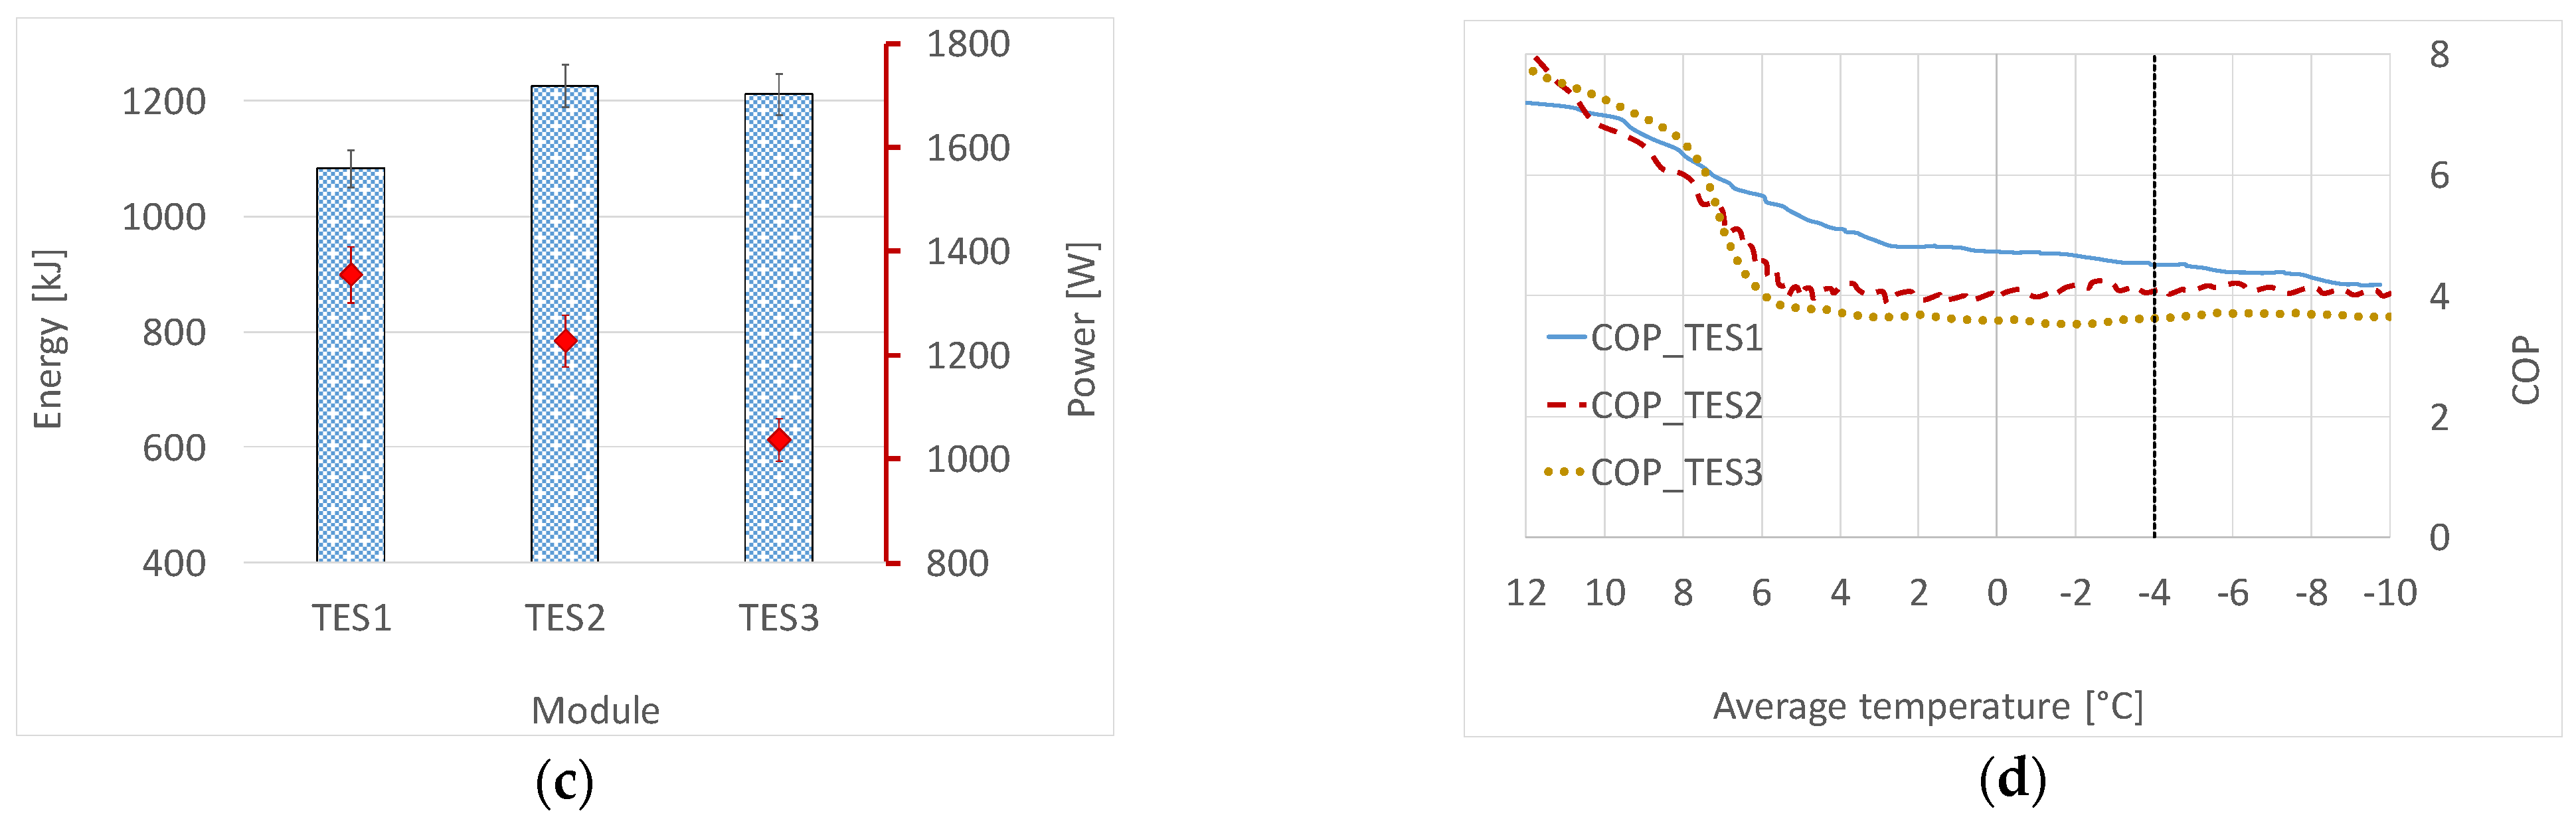
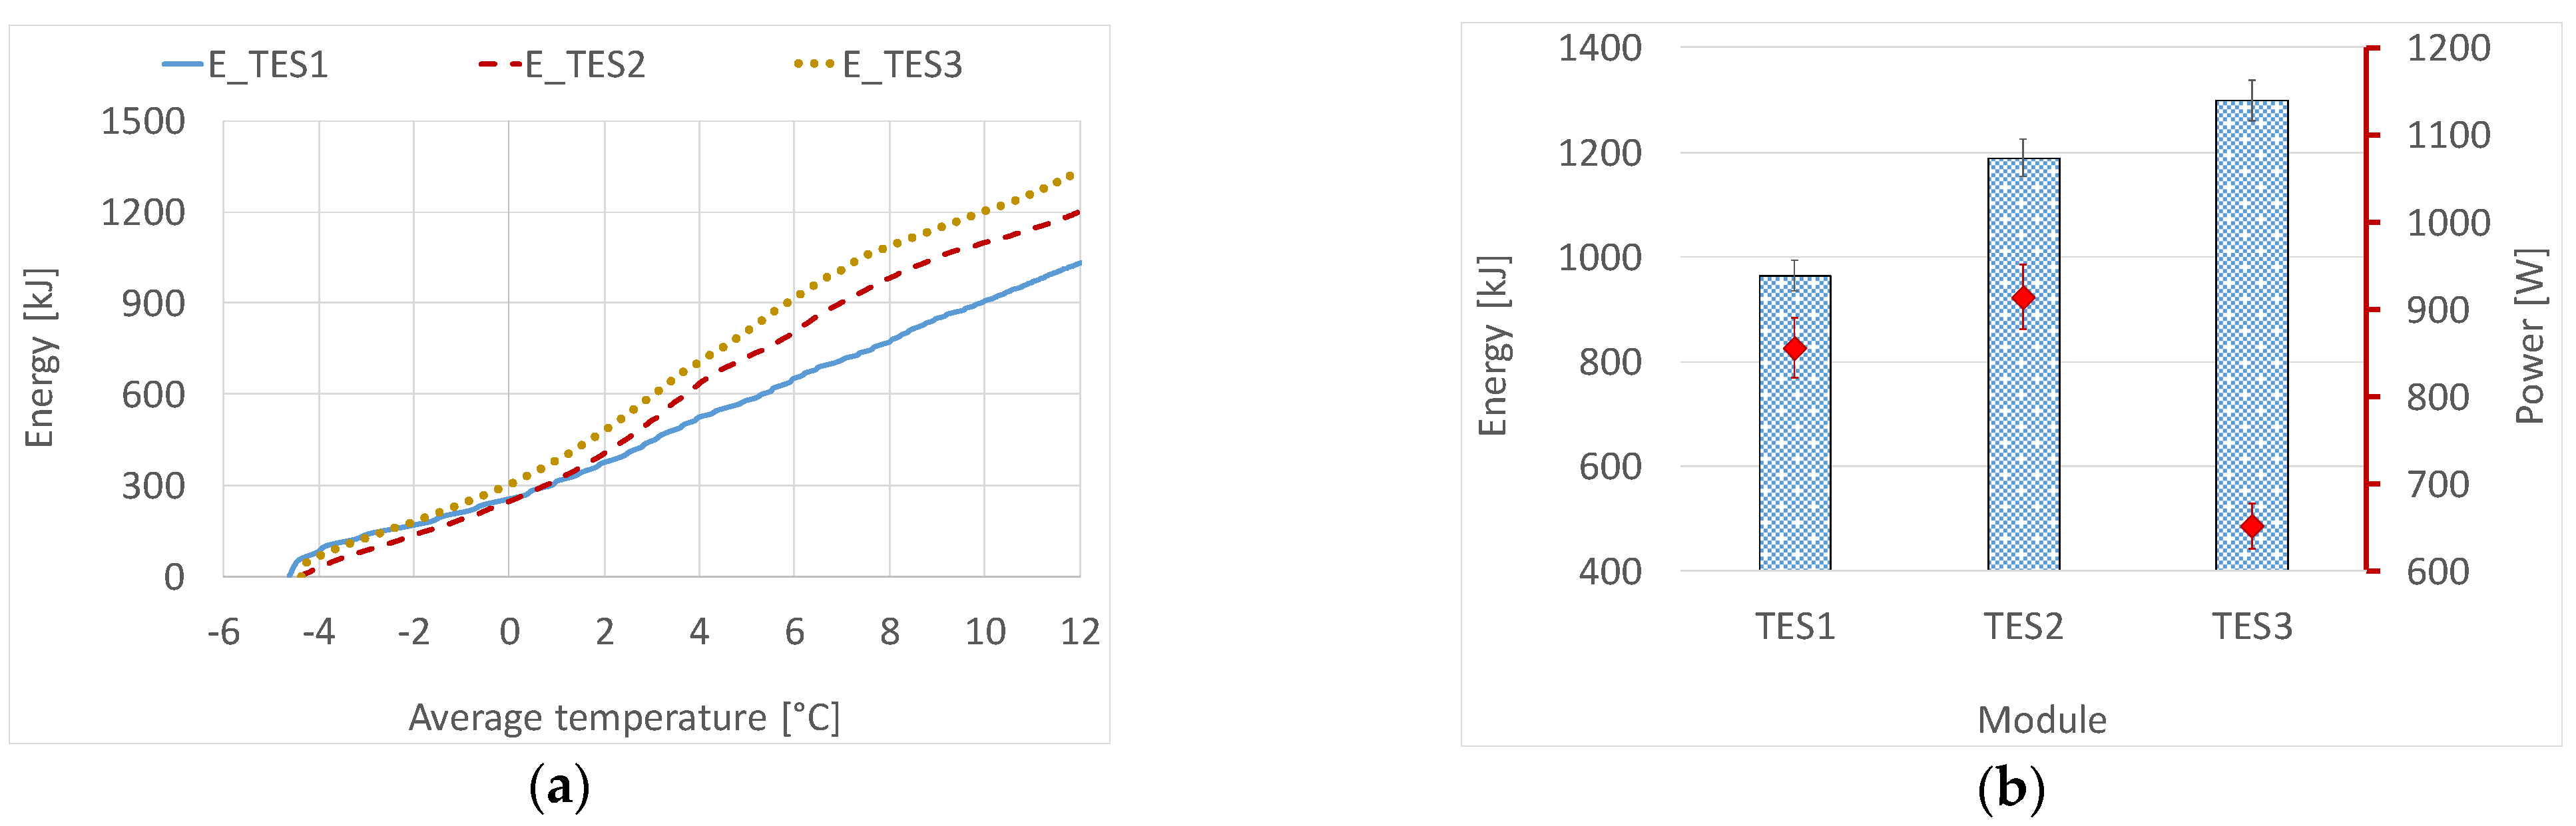
3.3. Energy Storage, Power, and COP during the Charging Process

Figure 5 summarizes the results obtained during the charging process based on energy, average power, and the COP of the system. Figure 5a presents the energy stored as the module charges from 12 °C to lower temperature values. It is observed that at an average temperature of −4 °C, TES 1 had stored the highest amount of energy despite containing the minimum amount of PCM due to the high stratification effect in TES 2 and TES 3 (seen in Figure 4). TES 1 shows the highest potential when operating at a narrow temperature range, which is evident in Figure 5a,b, due to its ability to charge the PCM homogeneously. To fully utilize the potential of the PCM (latent energy storage) in TES 2 and TES 3 , it is evident in Figure 5b,c that the module should be charged to lower temperature values beyond −4 °C. For instance, by allowing the PCM to charge until −10 °C, the energy stored in the two modules was higher than that stored in TES 1 , which is expected since the two modules contain more PCM. Considering the COP of the system while using the three modules (Figure 5d), TES 1 achieved the highest values, followed by TES 2 . Therefore, for a fair comparison of the modules and to reduce errors arising from the melting fraction, the KPIs were evaluated after complete phase change was ensured.

3.4. Temperature Evolution in the Discharging Process

Figure 6 shows the temperature profiles for the discharging process of the three modules. Unlike the charging process, the temperature evolution profiles of the discharging process are quite similar and the phase change period can easily be identified in all cases. All modules were discharged from an average temperature of −4 °C to 12 °C, and the PCM completely underwent a phase change.

3.5. Energy Storage and Power during the Discharging Process

Figure 7 presents the energy discharged and the discharging power for the three modules. As the modules were discharged from −4 °C to 12 °C, the highest energy storage capacity corresponded to TES 3 followed by TES 2 . This is expected because TES 3 and TES 2 were filled with about 14% more PCM in comparison with TES 1 . The slight difference between TES 2 and TES 3 is attributed to the sensible material, since TES 3 weighs slightly more than TES 2 .

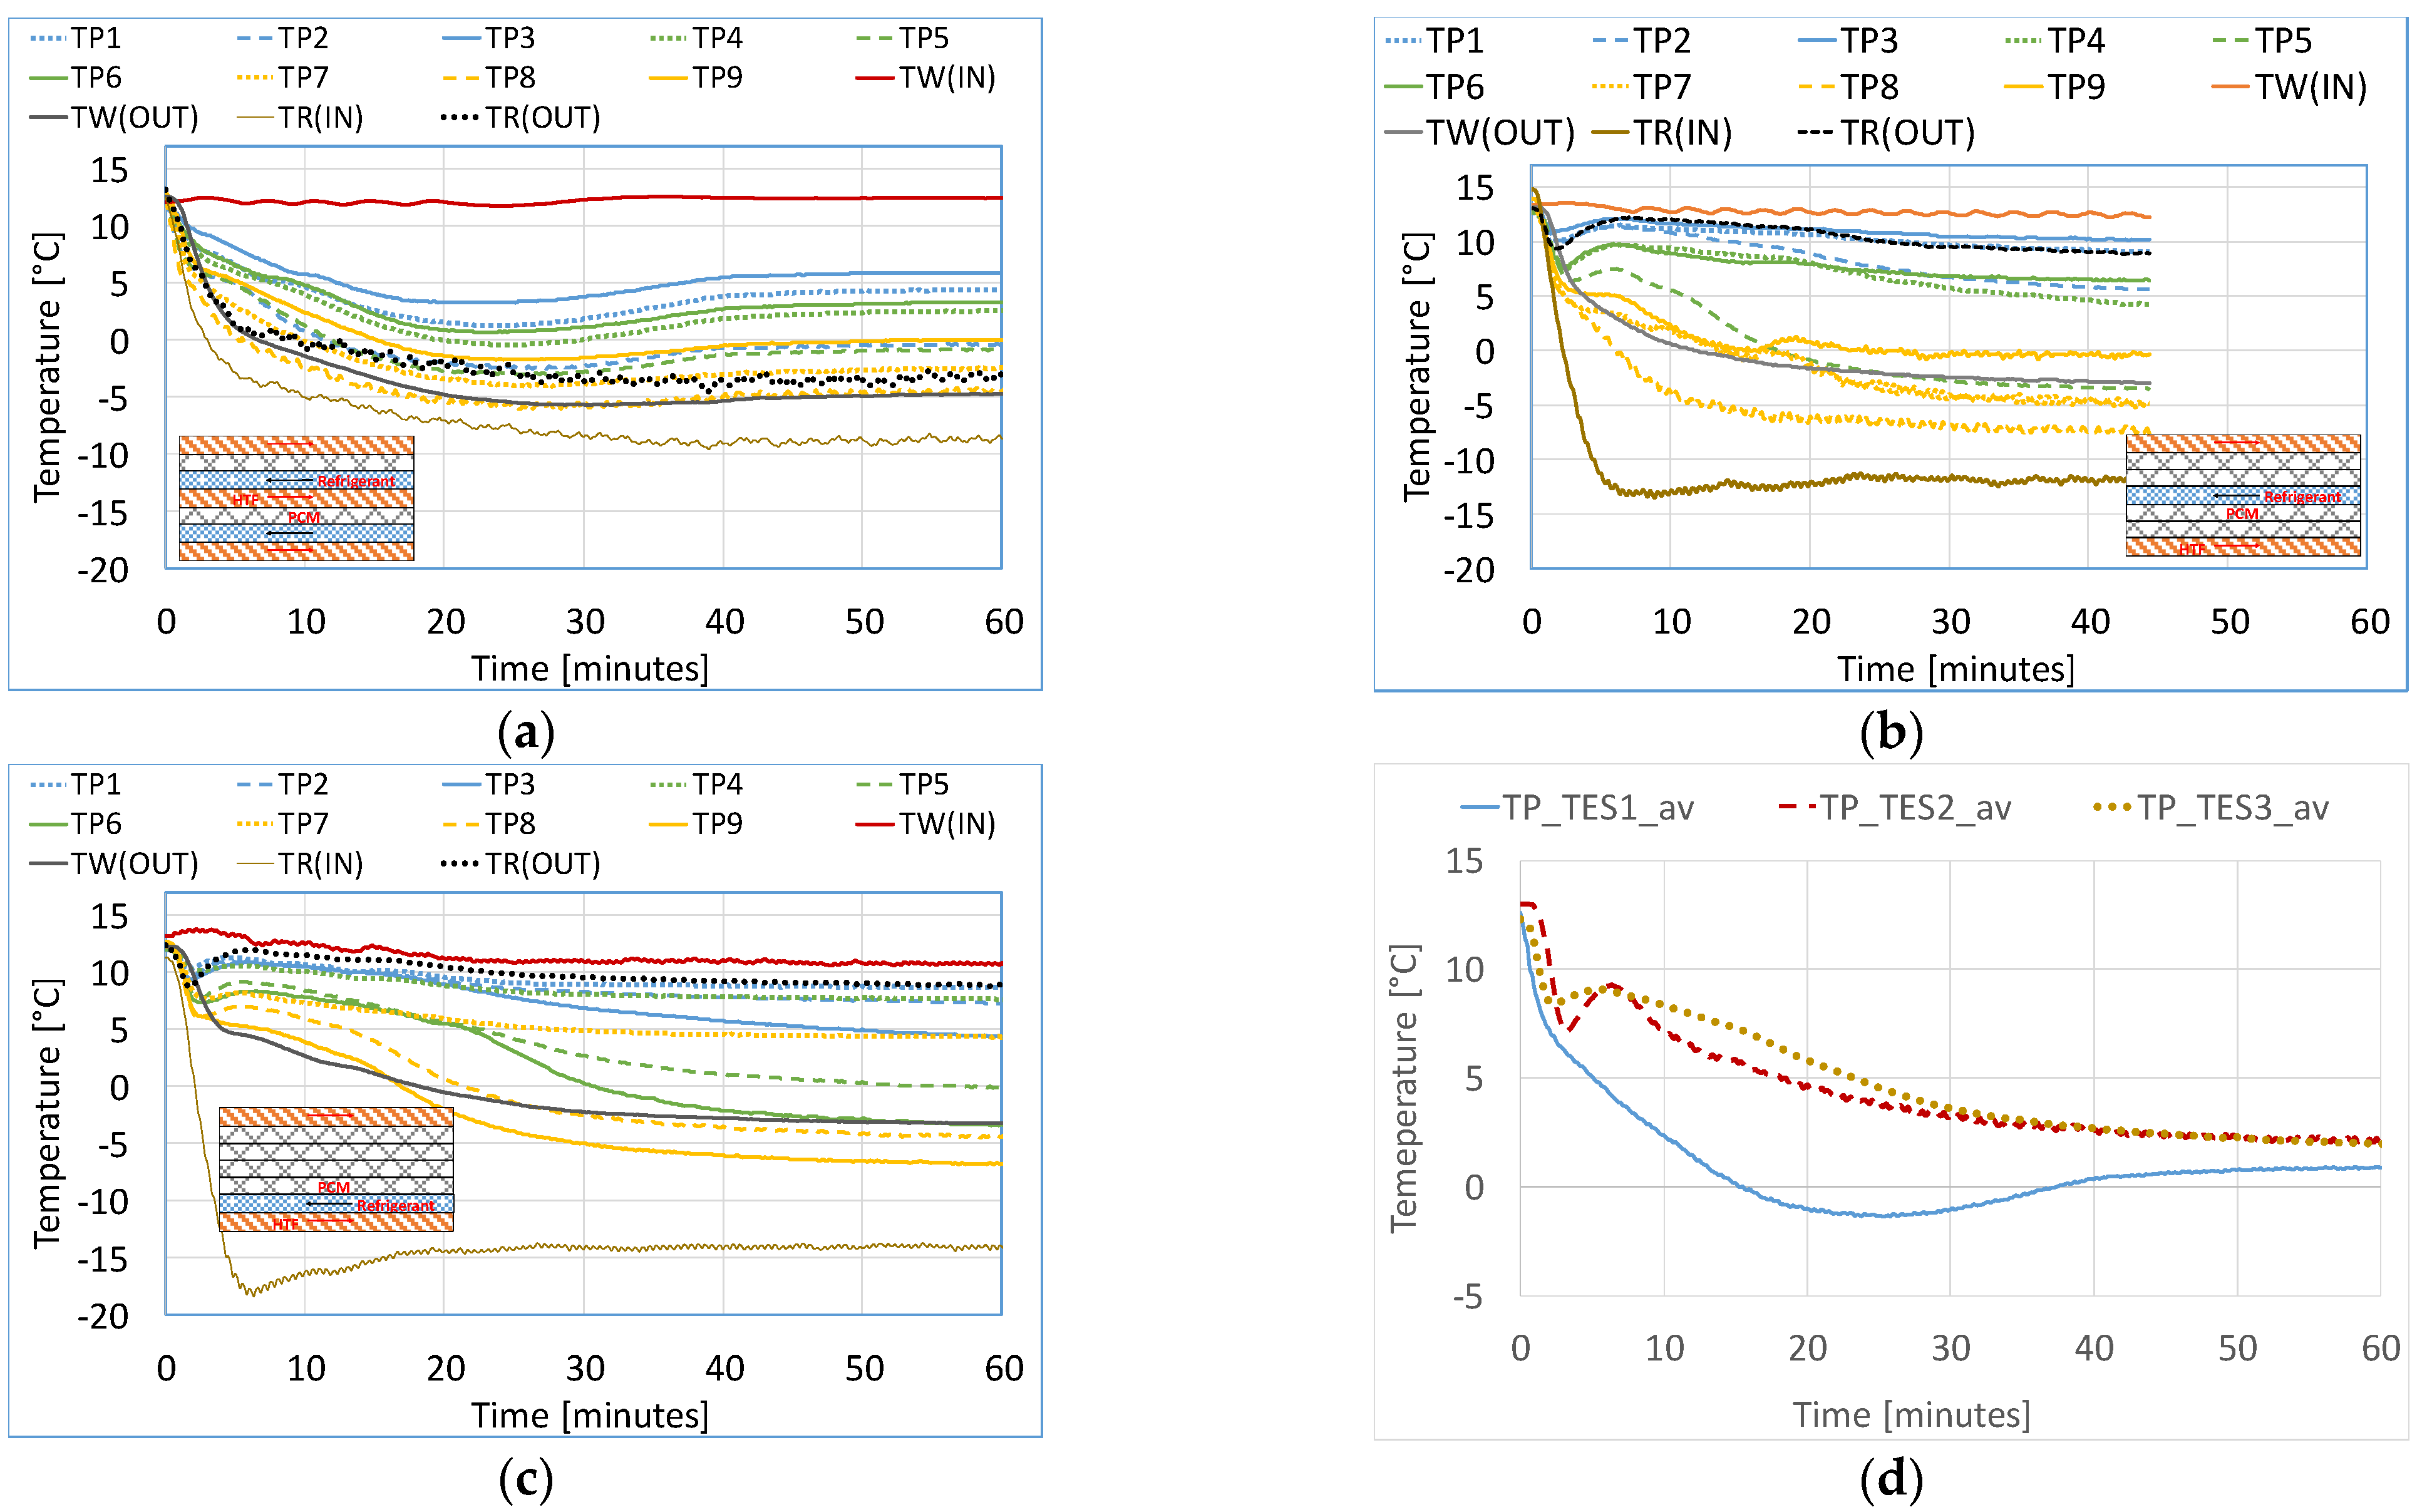
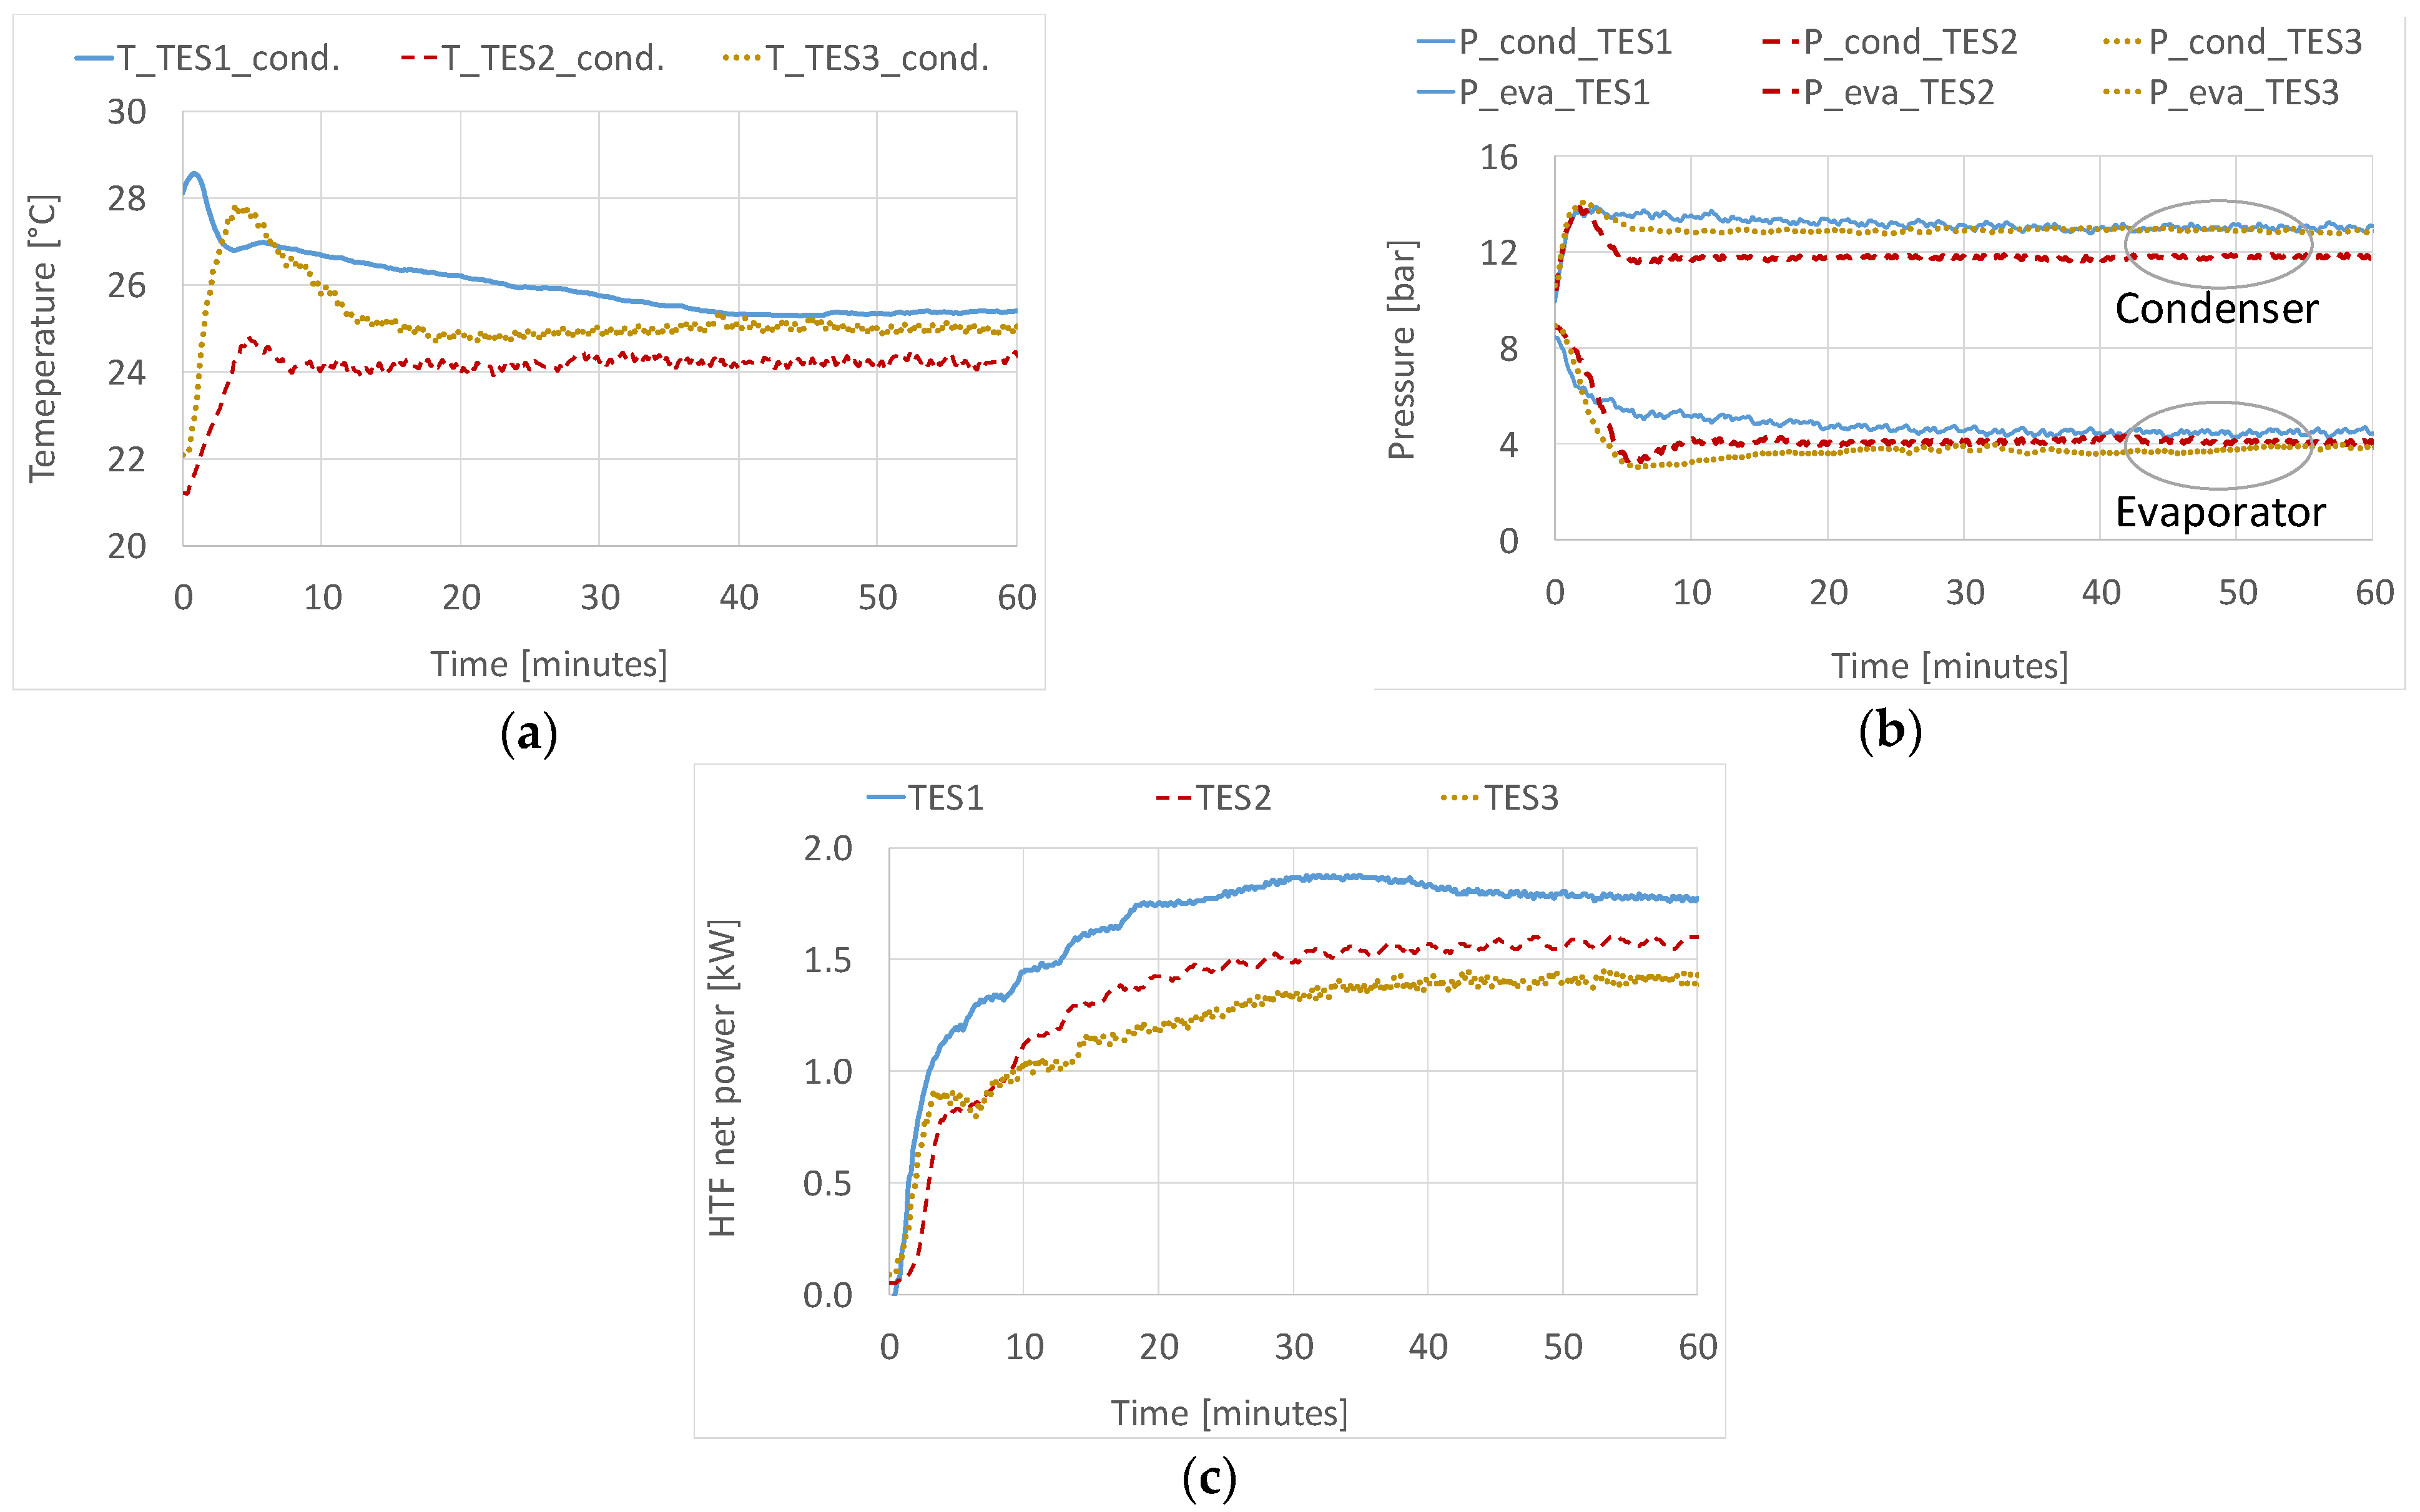
3.6. Temperature Evolution in Three-Fluids HEX Operating Mode

Figure 8 shows the temperature profiles in the three-fluids HEX operating mode. The cold energy from the refrigerant was delivered to both the HTF and the PCM, resulting in a partial charging of the module. The PCM charged from the initial temperature of 12 °C to lower temperature values until a thermal equilibrium was achieved. TES 2 and TES 3 achieved thermal equilibrium at a similar temperature value, whereas TES 1 achieved thermal equilibrium at a lower temperature than the other two modules (Figure 8d). The temperature difference between HTF inlet and outlet was 17 °C for TES 1 , 16 °C for TES 2 , and 14 °C for TES 3 , respectively.
Figure 9 presents the temperature at the condenser outlet, the pressure at the condenser and the evaporator, and the cooling load (net power to the HTF). It is evident from the figures that, for the given constant external conditions, each design registered a different value of temperature and pressure in the system. Although the values seem to be quite close, the difference is clearer when the cooling load is observed (Figure 9c).

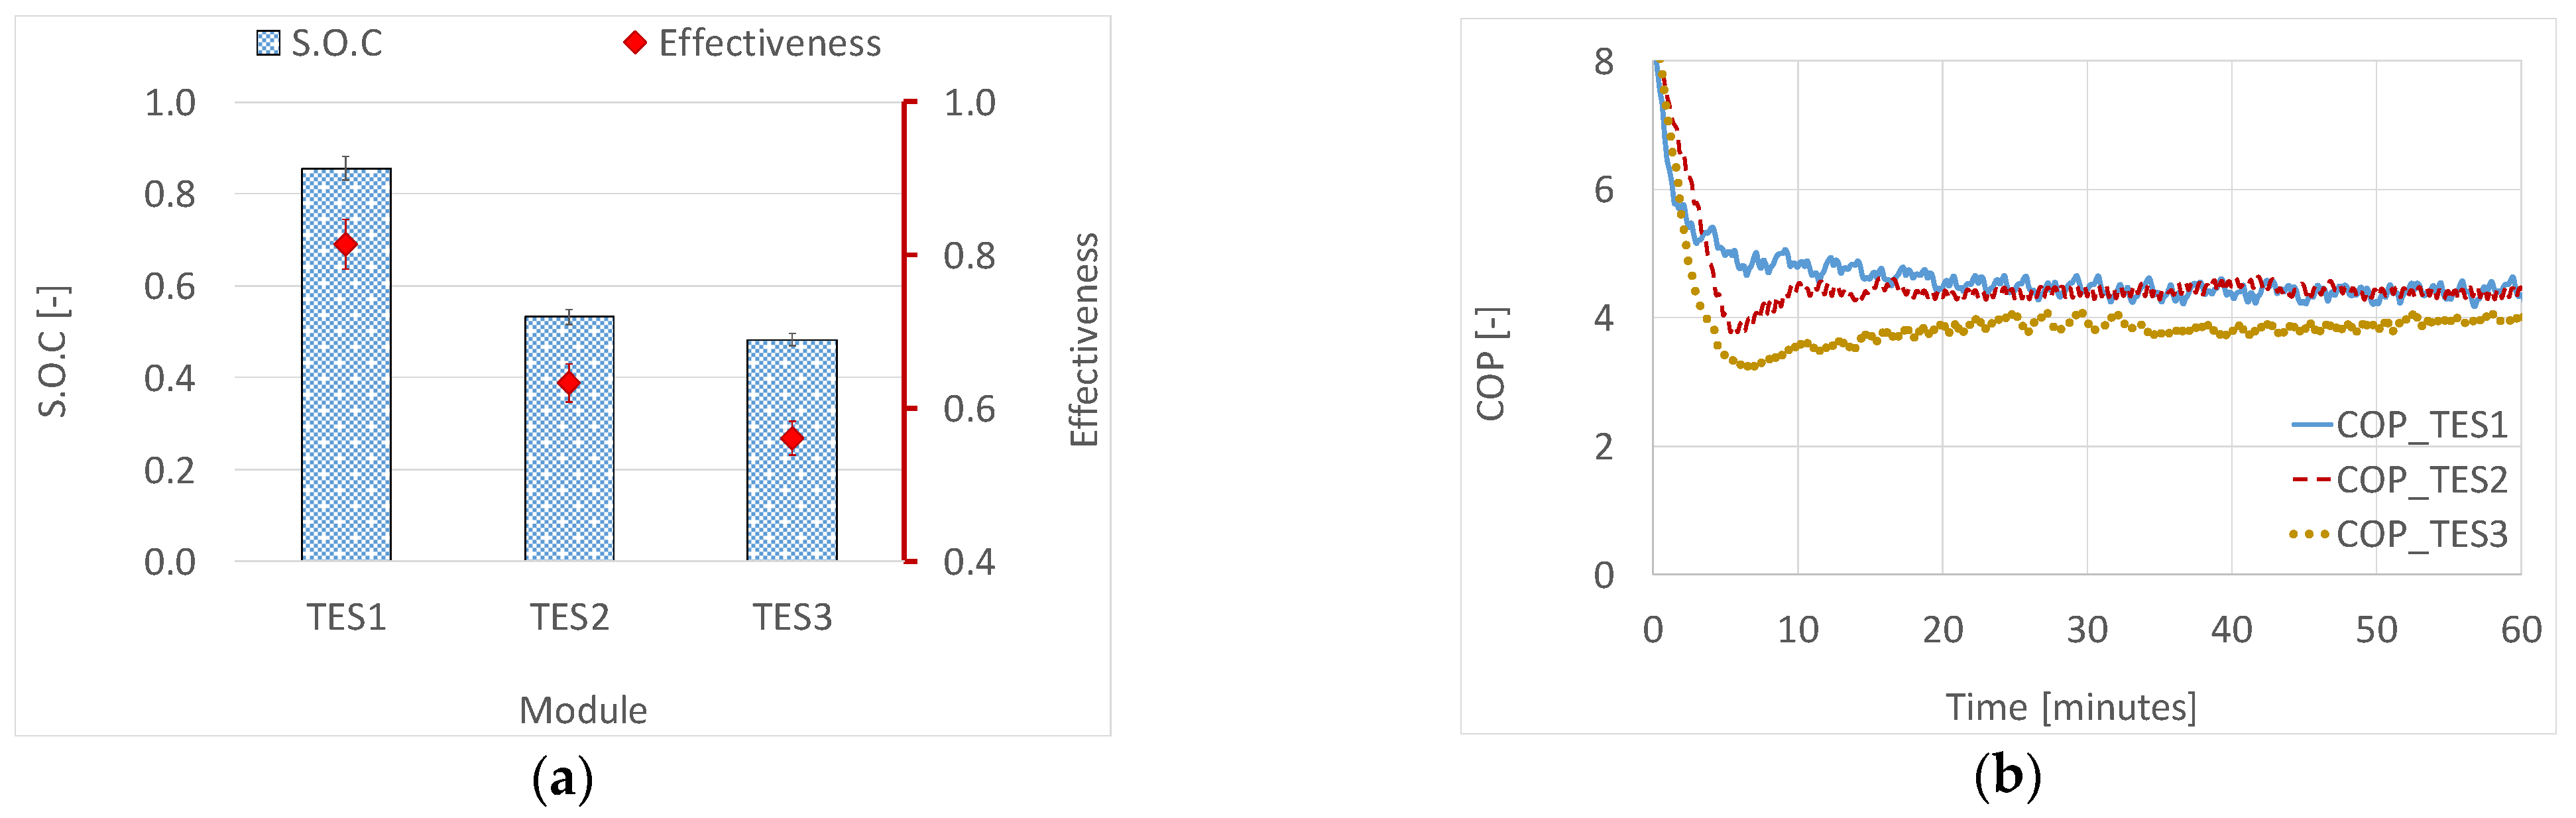
3.7. Effectiveness, SOC, and COP during the Three-Fluids HEX Operating Mode
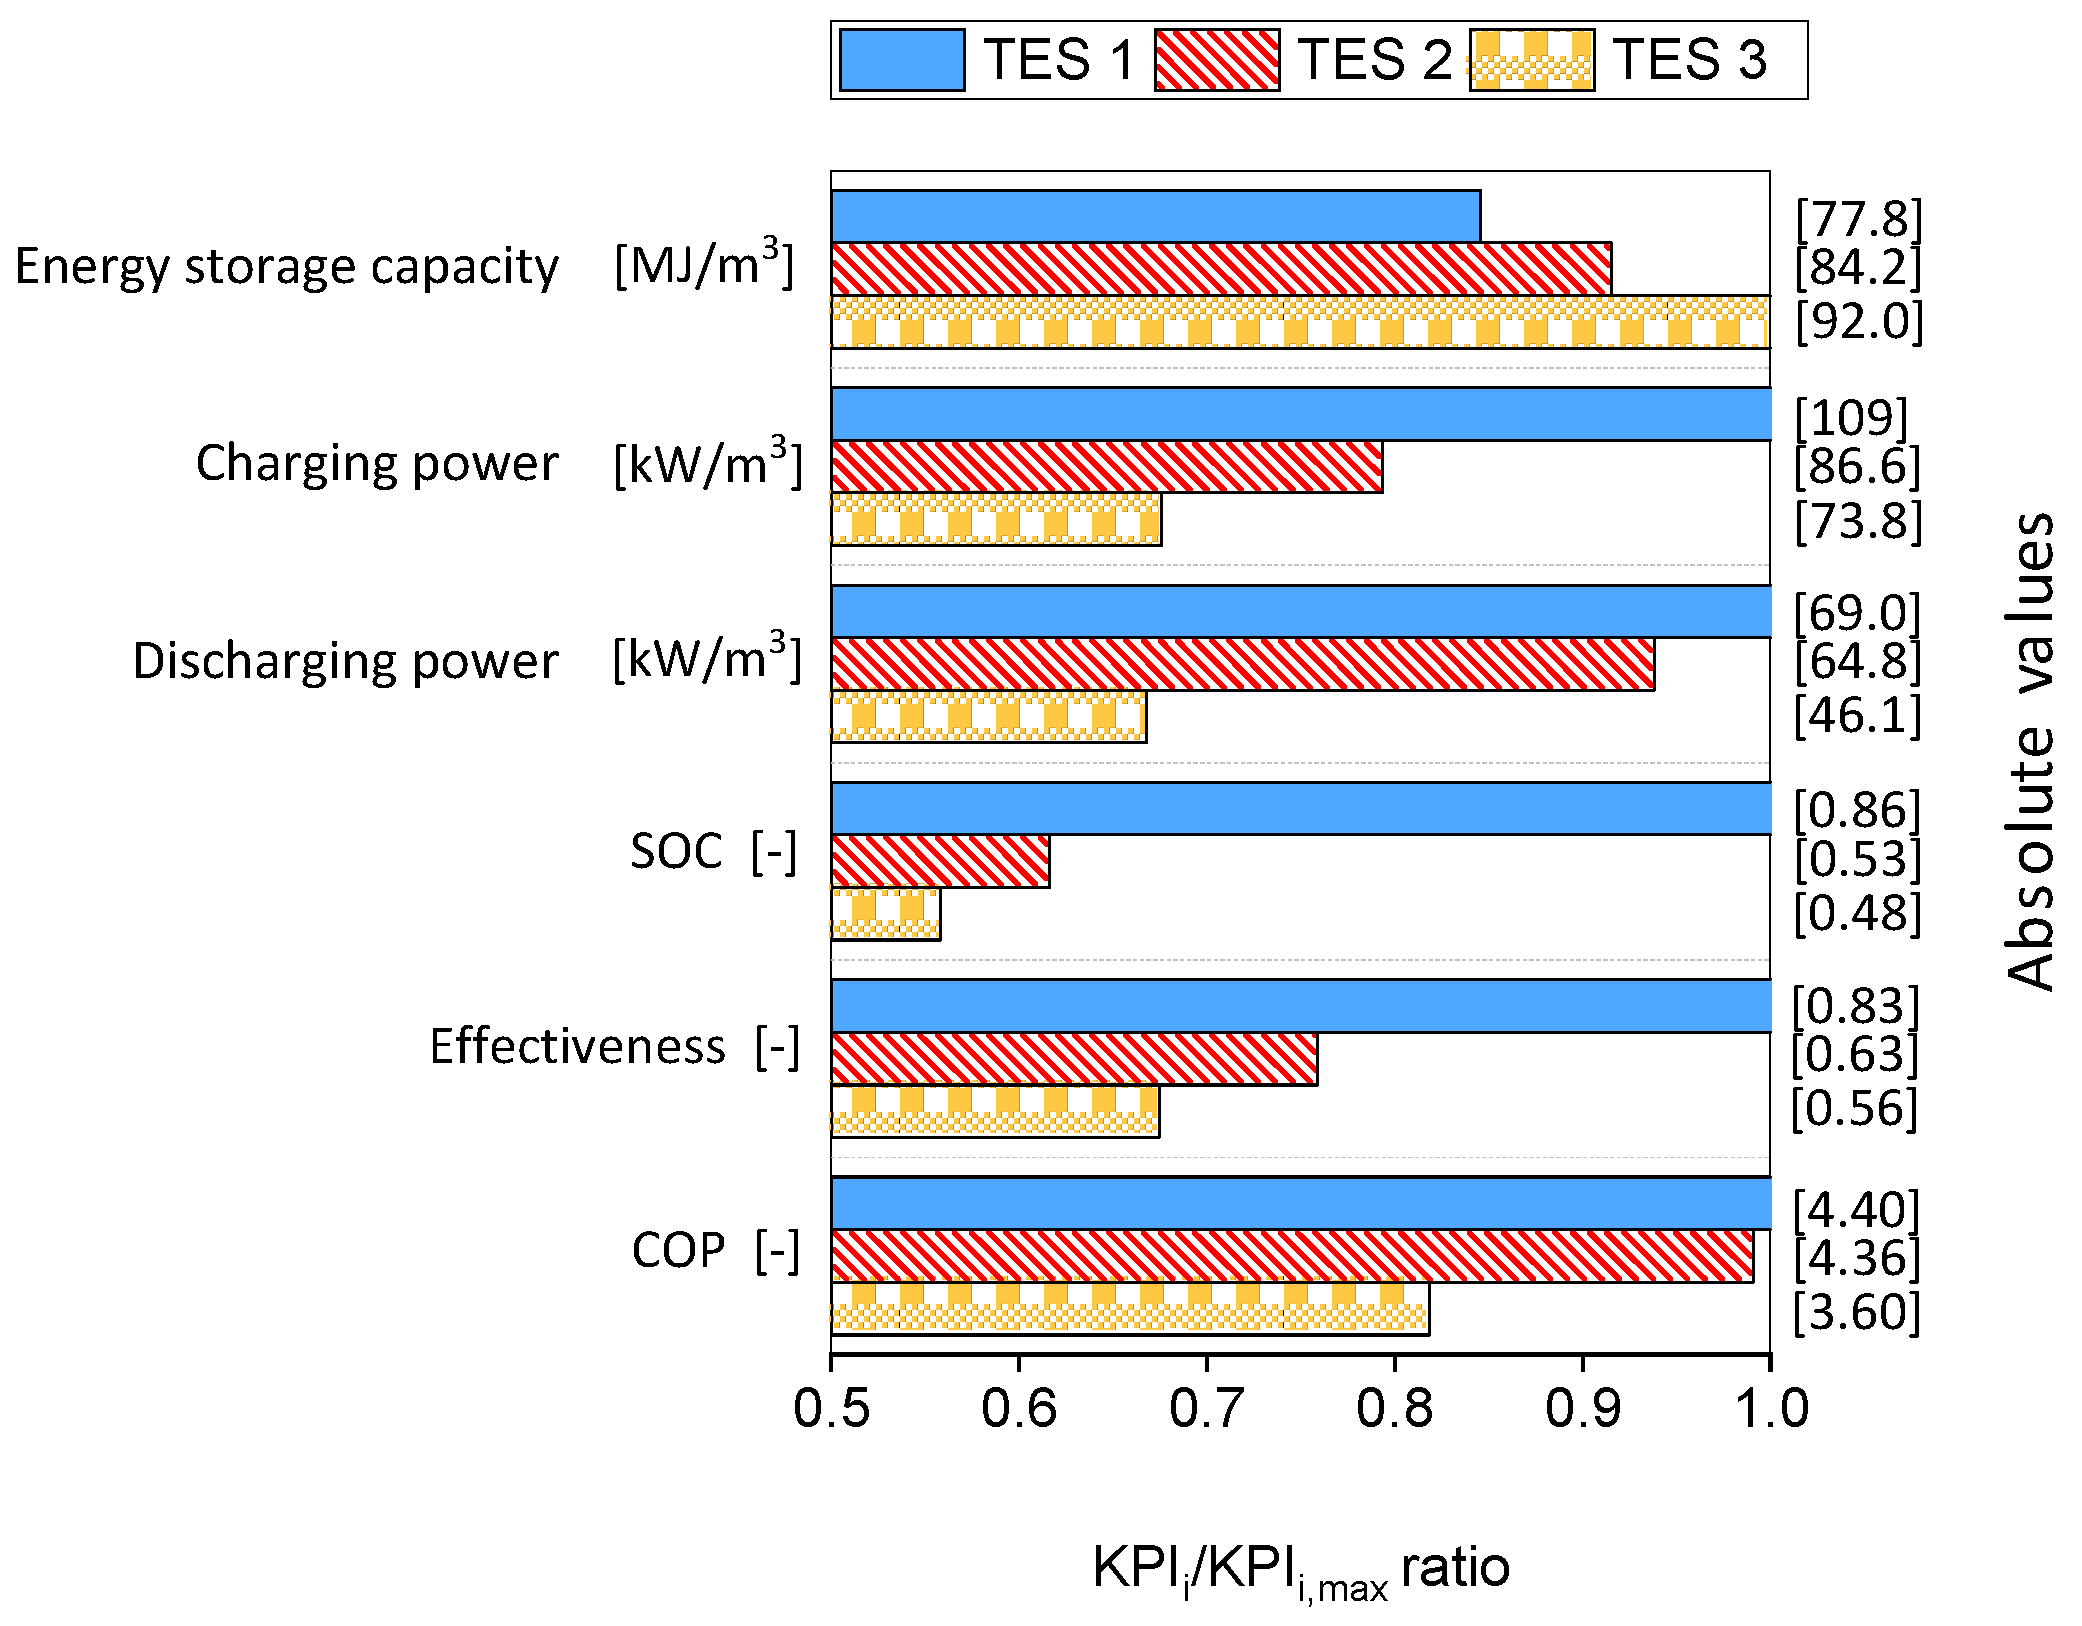
Figure 10 summarizes the results obtained in the three-fluids HEX operating mode based on the SOC (energy level in the module), the effectiveness of the modules, and COP of the system at thermal equilibrium. The energy level (SOC) is higher in TES 1 than in TES 2 and TES 3 . This is expected since thermal equilibrium was achieved at a lower temperature value in TES 1 . The HTF net power is the highest in TES 1 , followed by TES 2 , and finally TES 3 . All modules could achieve an effectiveness value higher than 0.5, and the highest effectiveness value of around 0.83 was obtained in TES 1 , followed by TES 2 around 0.63, and finally TES 3 with 0.56. A COP around 4 was achieved for all the modules, although TES 1 and TES 2 showed the highest COP of 4.4, whereas the COP of TES 3 was around 4.

4. Discussion

Figure 11 presents a summary of the KPIs used to compare the three modules when operated as heat exchangers (in three-fluids HEX mode), and as TES modules (in charging and discharging mode). The y-axis (in the left) presents the KPIs, which include the COP, the effectiveness, the energy level at thermal equilibrium (in three-fluids HEX mode), the discharging power, the charging power, and the energy storage capacity. The y-axis (in the right) presents the absolute value of each KPI as normalized by volume, whereas the x-axis presents the ratio of each KPI type (i), to the maximum value (KPIi,max) obtained from either of the three modules. The maximum KPI value among the three modules is registered as 100%, whereas the other values are reported as its ratio highlighting a broader aspect in the comparison of the modules and the KPIs.
In the first case, when operating the modules as TES modules, TES 1 registered the highest charging and discharging power, but with the lowest energy storage capacity (the experimental value of the energy recovered from the modules during the discharging process from −4 °C to 12 °C). TES 2 registered the second in all the KPI values. It registered a discharging power 6% lower than the maximum, and 21% lower charging power to the maximum (that of TES 1 ). The energy storage capacity was 8% lower than the maximum (that of TES 3 ). TES 3 registered the lowest charging and discharging power around 33% lower than the maximum value. However, the high energy storage capacity of TES 3 is expected because of its high PCM density in comparison with TES 1 , which has less PCM density since it contains more refrigerant and HTF channels. The high charging power obtained in TES 1 could be argued to result from its high heat transfer surface area, which is 2.3 times higher than that of TES 2 , and 2.8 times higher than that of TES 3 . Likewise, the high discharging power obtained in TES 1 is accounted by the high active surface area for heat exchange, which is 2.5 times higher than that of the other modules. However, despite the same surface area for heat transfer and amount of PCM, TES 2 presented 25% higher discharging power than that of TES 3 , meaning that the arrangement of the HTF channels allows the PCM to discharge faster in TES 2 than in TES 3 . Moreover, it was noted that to achieve a complete phase change, it was required to charge TES 2 and TES 3 to lower temperature values due to the nonhomogeneous charging of the modules. However, operating the refrigeration systems at extreme low-temperature values is not a desirable feature and one must take care to avoid raising issues such as defrosting and compromising the COP.
In the second case, when the modules were operated as heat exchangers, the KPIs discussed include the COP, the effectiveness, and the SOC (energy level in the module) at thermal equilibrium. TES 1 registered the highest value for the three KPIs. TES 2 registered the second highest values with COP relatively similar to TES 1 (less than 5% of the maximum, 4.4), effectiveness around 24% lower, and SOC at thermal equilibrium around 38% lower, whereas TES 3 registered the lowest values with COP around 19% lower, effectiveness around 33% lower, and SOC at thermal equilibrium around 44% lower. Among the three KPIs, the change in design is observed to affect less the COP when compared with the other KPIs.
To further interpret the results beyond the quantitative analysis, a qualitative analysis will provide more insights and recommended applications for the modules. Indeed, although a module could be suitable in one application due to its strength in a particular KPI, the same strength could be a drawback in another application. In that account, Table 3 summarizes the main qualities for the three modules based on the pros and cons of each of them. For a more comprehensive interpretation of the results, one would group the pros and cons of each module as high, medium, and low according to the strength of the KPIs. For simplicity, a threshold is required to group the results; in this case, values registering less than 10% difference from the maximum are considered as high, between 10% and 25% as medium, whereas more than 25% are considered low.
TES 1 is suitable for applications that require a fast response in the charging and discharging processes, and a high energy level at the module at thermal equilibrium. These characteristics are suitable for energy profiles such as HP systems, especially to reduce the compressor ON/OFF time without compromising the demand side. The module registers an acceptable energy storage density (medium) and operates with high effectiveness and COP. However, this module is not recommended for an application that requires high thermal inertia during the charging and/or discharging process.
TES 2 has a high energy storage density and it is suitable for applications that require a fast response in the discharging process and a medium response in the charging process. It could be recommended for energy profiles such as HP systems, to increase the compressor OFF time by providing energy to the demand side. The module operates with high COP and medium effectiveness. However, the module is not recommended for applications that require high thermal inertia in the discharging process and a high energy level of the module at thermal equilibrium (in the three-fluids HEX mode).
TES 3 has a high energy storage density and it is suitable for applications that require high thermal inertia in both charging and discharging processes. It operates with low effectiveness (about 33%) and an acceptable COP (about 16%) lower than the maximum. The module could be recommended to applications with low availability of electricity, e.g., freezers in vans thanks to their high energy storage density. However, the module is not recommended for an application that requires a high energy level at thermal equilibrium (in the three-fluids HEX mode).
Finally, one task that remains worth investigating is comparing the condition when PCM is utilized and a condition with no PCM. However, although one could be tempted to test these modules when filled with PCM and when empty, the results would not provide a meaningful information in a practical application. Therefore, a dedicated experimental design to further delve into the issue is foreseen to be developed in future studies.

5. Conclusions

This study experimentally investigated the influence of the design of a novel evaporator-TES module filled with PCM on its performance, both as a TES module and as a heat exchanger. The main key performance indicators were reported, such as the energy storage density, the charging and discharging power, the effectiveness, the SOC at thermal equilibrium, and the COP of the system. A discussion of the main results was included based on both quantitative and qualitative information.
The results indicate that the change of configuration/arrangement of the PCM, refrigerant, and HTF channels affects the performance of the modules both as a TES module and as a HEX. The energy storage density and the COP were the least affected, with a maximum difference of less than 16% among the three modules. The highest effect was depicted on the SOC at thermal equilibrium, where there was a difference of around 44% between the maximum and the minimum value. Indeed, the effect on the performance could shift the suitability of the modules from one application to another. TES 1 provided good results for most of the KPIs except for the energy storage density, which was about 15.4% lower than the maximum. TES 2 provided intermediate results for most of the KPIs and good results for the COP of the system.   TES 3 had the highest energy storage density while providing the worst results for the rest of the KPIs.

Author Contributions

Conceptualization, L.F.C., G.Z. and B.D.M.; methodology, L.F.C., G.Z., B.D.M. and D.V.; formal analysis, B.D.M. and G.Z.; investigation, B.D.M., G.Z. and D.V.; resources, B.N., A.S. and L.F.C.; writing—original draft preparation, B.D.M.; writing—review and editing, E.B., D.V., G.Z., B.N., A.S. and L.F.C.; visualization, B.D.M. and G.Z.; supervision, L.F.C.; project administration, L.F.C.; funding acquisition, L.F.C. and A.S. All authors have read and agreed to the published version of the manuscript.

Funding

This project has received funding from the European Union’s Horizon 2020 research and innovation programme under grant agreement No. 768824 (HYBUILD). This work was partially funded by the Ministerio de Ciencia, Innovación y Universidades de España (RTI2018-093849-B-C31—MCIU/AEI/FEDER, UE) and by the Ministerio de Ciencia, Innovación y Universidades—Agencia Estatal de Investigación (AEI) (RED2018-102431-T). This work is partially supported by ICREA under the ICREA Academia programme.

Institutional Review Board Statement

Not applicable.

Informed Consent Statement

Not applicable.

Data Availability Statement

Not applicable here.

Acknowledgments

The authors would like to thank the Catalan Government for the quality accreditation given to their research group (2017 SGR 1537). GREiA is certified agent TECNIO in the category of technology developers from the Government of Catalonia. Boniface Dominick Mselle would like to thank Programa Santander Predoc UdL for his research fellowship.

Conflicts of Interest

The authors declare no conflict of interest. The funders had no role in the design of the study; in the collection, analyses, or interpretation of data; in the writing of the manuscript, or in the decision to publish the results.

Nomenclature

AbbreviationDefinition
PCMPhase change material
TESThermal energy storage
SOCState of charge
HEXHeat exchanger
COPCoefficient of performance
HTFHeat transfer fluid
KPIKey performance indicator
HPHeat pump
DHWDomestic hot water
TES i Thermal energy storage module
C p Specific heat capacity
E Energy
E c h , @ T Energy stored until temperature T
AlAluminum
Refrefrigerant
T Temperature
E ˙ i Power
E ˙ ¯ i Average power
e q Thermal equilibrium
ε Effectiveness
u Uncertainty
Δ T Temperature difference
V ˙ Volumetric flow rate
P Pressure
ρ Density
e v a Evaporator
c o n d condenser
m a x maximum
c h Charged
d i s c discharged
a Ambient
a v Average
h Enthalpy
k Thermal conductivity
#Number of
T P PCM temperature
I N Inlet
O U T Outlet

References

  1. Brejon, P.; Marchio, D. Insertion of a cold latent heat storage unit into a storage system by heat pump. Rev. Gen. Therm. 1966, 22, 195–199. [Google Scholar]
  2. Mselle, B.D.; Zsembinszki, G.; Borri, E.; Vérez, D.; Cabeza, L.F. Trends and future perspectives on the integration of phase change materials in heat exchangers. J. Energy Storage 2021, 38, 102544. [Google Scholar] [CrossRef]
  3. IRENA. Global Renewables Outlook: Energy Transformation 2050; IRENA: Abu Dhabi, United Arab Emirates, 2020; ISBN 9789292602383. [Google Scholar]
  4. United Nations Framework Convention on Climate Change Paris Agreement; United Nations: Paris, France, 2015.
  5. International Energy Agency. Renewables Information 2019; International Energy Agency: Paris, France, 2019. [Google Scholar]
  6. Wang, F.; Maidment, G.; Missenden, J.; Tozer, R. The novel use of phase change materials in refrigeration plant. Part 1: Experimental investigation. Appl. Therm. Eng. 2007, 27, 2893–2901. [Google Scholar] [CrossRef]
  7. Ure, Z. Phase change material based passive cooling systems design principal ana global application examples. In Proceedings of the 2nd International Conference on Energy and Indoor Environment for Hot Climates—ASHRAE, Hot Climates 2017, Doha, Qatar, 26–27 February 2017; pp. 188–195. [Google Scholar]
  8. Axell, M.; Bakker, M.; Landolina, S. Strategic Research Priorities for Cross-Cutting Technology. Eur. Technol. Platf. Renew. Heat. Cool. 2012, 32, 28–44. [Google Scholar]
  9. long Cheng, W.; Ding, M.; dong Yuan, X.; Han, B.C. Analysis of energy saving performance for household refrigerator with thermal storage of condenser and evaporator. Energy Convers. Manag. 2017, 132, 180–188. [Google Scholar] [CrossRef]
  10. Cheng, W.L.; Mei, B.J.; Liu, Y.N.; Huang, Y.H.; Yuan, X.D. A novel household refrigerator with shape-stabilized PCM (Phase Change Material) heat storage condensers: An experimental investigation. Energy 2011, 36, 5797–5804. [Google Scholar] [CrossRef]
  11. Oró, E.; Miró, L.; Farid, M.M.; Cabeza, L.F. Improving thermal performance of freezers using phase change materials. Int. J. Refrig. 2012, 35, 984–991. [Google Scholar] [CrossRef]
  12. Visek, M.; Joppolo, C.M.; Molinaroli, L.; Olivani, A. Advanced sequential dual evaporator domestic refrigerator/freezer: System energy optimization. Int. J. Refrig. 2014, 43, 71–79. [Google Scholar] [CrossRef]
  13. Emhofer, A.I.T.J.; Marx, K.; Palomba, C.V.; Frazzica, A.; Aloisio, D.; Sergi, F. Innovative compact HYbrid electrical/thermal storage systems for low energy BUILDings. HYBUILD Deliv. D3.3 2020, 5128820, 1–42. [Google Scholar]
  14. Mselle, B.D.; Vérez, D.; Zsembinszki, G.; Borri, E.; Cabeza, L.F. Performance study of direct integration of phase change material into an innovative evaporator of a simple vapour compression system. Appl. Sci. 2020, 10, 4649. [Google Scholar] [CrossRef]
  15. Mselle, B.D.; Zsembinszki, G.; Vérez, D.; Borri, E.; Cabeza, L.F. A detailed energy analysis of a novel evaporator with latent thermal energy storage ability. Appl. Therm. Eng. 2021, 201, 117844. [Google Scholar] [CrossRef]
  16. Palomba, V.; Bonanno, A.; Brunaccini, G.; Aloisio, D.; Sergi, F.; Dino, G.E.; Varvaggiannis, E.; Karellas, S.; Nitsch, B.; Strehlow, A.; et al. Hybrid Cascade Heat Pump and Thermal-Electric Energy Storage System for Residential Buildings: Experimental Testing and Performance Analysis. Energies 2021, 14, 2580. [Google Scholar]
  17. Varvagiannis, E.; Charalampidis, A.; Zsembinszki, G.; Karellas, S.; Cabeza, L.F. Energy assessment based on semi-dynamic modelling of a photovoltaic driven vapour compression chiller using phase change materials for cold energy storage. Renew. Energy 2021, 163, 198–212. [Google Scholar] [CrossRef]
  18. Emhofer, J.; Marx, K.; Barz, T.; Hochwallner, F.; Cabeza, L.F.; Zsembinszki, G.; Strehlow, A.; Nitsch, B.; Wiesflecker, M.; Pink, W. Techno-Economic Analysis of a Heat Pump Cycle Including a Three-Media Refrigerant/Phase Change Material/Water Heat Exchanger in the Hot Superheated Section for Efficient Domestic Hot Water Generation. Appl. Sci. 2020, 10, 7873. [Google Scholar] [CrossRef]
  19. Emhofer, J.; Marx, K.; Sporr, A.; Barz, T.; Nitsch, B.; Wiesflecker, M.; Pink, W. Experimental demonstration of an air-source heat pump application using an integrated phase change material storage as a desuperheater for domestic hot water generation. Appl. Energy 2022, 305, 117890. [Google Scholar] [CrossRef]
  20. Marx, K.; Emhofer, J.; Barz, T.; Krämer, J.; Cabeza, L.F.; Zsembinszki, G.; Strehlow, A.; Nitsch, B.; Wiesflecker, M.; Zitzenbacher, R. Dynamic performance tests of a heat pump cycle integrated latent heat thermal energy storage for optimized DHW generation. In Proceedings of the 13th IEA Heat Pump Conference, Jeju, Korea, 26–29 April 2021; pp. 1–10. [Google Scholar]
  21. Emhofer, J.; Barz, T.; Marx, K.; Hochwallner, F.; Cabeza, L.F.; Zsembinszki, G.; Strehlow, A.; Nitsch, B.; Weiss, M. Integration of a compact two fluid PCM heat exchanger into the hot superheated section of an air source heat pump cycle for optimized DHW generation. Refrig. Sci. Technol. 2019, 2019, 4415–4423. [Google Scholar]
  22. AKG. AKG Group. Available online: https://www.akg-group.com/akg-group/about-akg-group/ (accessed on 21 June 2021).
  23. TEC Wired Mat MT 3.1 No Title. Available online: https://www.google.com/url?sa=t&rct=j&q=&esrc=s&source=web&cd=&ved=2ahUKEwiBiufQ1OvuAhWwct8KHc1EAcMQFjAAegQIAxAC&url=https%3A%2F%2Fwww.e-isover.cz%2Fdata%2Ffiles%2Fisover-tech-wired-mat-mt-3-1-tl-en-1239.pdf&usg=AOvVaw27iMXFTPfYuZtlz5UYgMO6 (accessed on 14 July 2021).
  24. Rubitherm RT-PCM. Available online: https://www.rubitherm.eu/en/index.php/productcategory/organische-pcm-rt (accessed on 2 October 2019).
  25. Zsembinszki, G.; Fernández, A.G.; Cabeza, L.F. Selection of the appropriate phase change material for two innovative compact energy storage systems in residential buildings. Appl. Sci. 2020, 10, 2116. [Google Scholar] [CrossRef] [Green Version]
  26. The Dow Chemical Company Dowtherm SR-1 n.d. Available online: https://corporate.dow.com (accessed on 25 June 2019).
  27. Carvill, J. Thermodynamics and heat transfer. In Mechanical Engineer’s Data Handbook; Elsevier: Amsterdam, The Netherlands, 1993; pp. 102–145. [Google Scholar]
  28. Ghalambaz, M.; Hashem Zadeh, S.M.; Mehryan, S.A.M.; Pop, I.; Wen, D. Analysis of melting behavior of PCMs in a cavity subject to a non-uniform magnetic field using a moving grid technique. Appl. Math. Model. 2020, 77, 1936–1953. [Google Scholar] [CrossRef]
  29. Cengel, Y.A.; Boles, M.A. Thermodynamics: An Engineering Approach, 7th ed.; McGraw-Hill: New York, NY, USA, 2010. [Google Scholar]
  30. Emerson Copeland Select Software. Available online: https://climate.emerson.com/en-gb/tools-resources/copeland-select-software (accessed on 25 May 2021).
  31. Maldonado, J.M.; Verez, D.; de Gracia, A.; Cabeza, L.F. Comparative study between heat pipe and shell-and-tube thermal energy storage. Appl. Therm. Eng. 2021, 192, 116974. [Google Scholar] [CrossRef]
  32. Gomez, J.C.; Glatzmaier, G.C.; Mehos, M. Heat Capacity Uncertainty Calculation for the Eutectic Mixture of Biphenyl/Diphenyl Ether Used as Heat Transfer Fluid. In Proceedings of the SolarPACES 2012, Marrakech, Morocco, 11–14 September 2012. [Google Scholar]
  33. Joint Committee for Guides in Metrology (JCGM). Guide to the Expression of Uncertainty in Measurement—Part 6: Developing and Using Measurement Models; JCGM GUM: Sèvres, France, 2020. [Google Scholar]
Figure 1. The configuration of the novel evaporator-TES modules: (a) TES 1 , (b) TES 2 , (c) TES 3 , and (d) external structure.
Applsci 12 01813 g001
Figure 2. Experimental facility: (a) photo of the test-rig and (b) schematic diagram.
Applsci 12 01813 g002
Figure 3. Repeatability and robustness of the results for the (a) charging process, (b) discharging process, and (c) three-fluids HEX mode.
Applsci 12 01813 g003
Figure 4. Temperature profiles of the charging process for (a) TES 1 , (b) TES 2 , (c) TES 3 , and (d) position of temperature sensors.
Applsci 12 01813 g004
Figure 5. Results of the charging process: (a) energy stored against average temperature, (b) total energy stored and average charging power from 12 °C to −4 °C, (c) total energy stored and average charging power from 12 °C to −10 °C, and (d) COP of the refrigeration system against average temperature.
Applsci 12 01813 g005aApplsci 12 01813 g005b
Figure 6. The temperature profiles of the discharging process for (a) TES 1 , (b) TES 2 , (c) TES 3 , and (d) position of the temperature sensors.
Applsci 12 01813 g006
Figure 7. Energy and power during the discharging process: (a) energy discharged against average temperature and (b) energy discharged and average discharging power during the whole process.
Applsci 12 01813 g007
Figure 8. Temperature profiles of three-fluids HEX mode for (a) TES 1 , (b) TES 2 , (c) TES 3 , and (d) average temperature in the PCM.
Applsci 12 01813 g008
Figure 9. A summary of the results three-fluids HEX mode (a) temperature at the condenser, (b) pressure at the condenser and evaporator, and (c) cooling load at the evaporator.
Applsci 12 01813 g009
Figure 10. Results of three-fluids HEX mode: (a) energy level at thermal equilibrium and effectiveness and (b) COP of the refrigeration system against time.
Applsci 12 01813 g010
Figure 11. Summary of the key performance indicators of the modules.
Applsci 12 01813 g011
Table 1. Characteristics of the evaporator-TES modules.
Characteristic T E S 1 T E S 2 T E S 3
#Refrigerant channels [-]1465
#PCM channels [-]152424
#HTF channels1677
Weight of the empty module, i.e., only Al [kg]18.020.220.4
Volume of the module [m3]0.0120.0140.014
Amount of PCM filled [kg]3.23.73.7
HTF in the module [L]3.13.13.1
Heat transfer surface area (in 3-fluids HEX mode) [m2]0.790.340.28
Table 2. Properties of the PCM and the HTF.
PropertiesRT4 PCM [23]HTF [25]
Phase change range [°C]2–4−18/127
Specific heat capacity [kJ·kg−1·K−1]23.602
Density [kg·L−1]0.88 (solid)1.05045
0.77 (liquid)
Thermal conductivity [W·m−1·K−1]0.20.418
Table 3. Qualitative analysis of the three modules.
ModuleProsCons
TES1High COP
High effectiveness
High amount of energy stored (SOC) at thermal equilibrium
High charging power (fast response to energy source)
High discharging power (fast response to energy demand)
Low energy density
TES2High COP
High discharging power (fast response to energy demand)
High energy storage density
Low amount of energy stored (SOC) at thermal equilibrium
TES3High energy storage densityLow effectiveness
Low charging and discharging power (slow response to both energy source and demand)
Low amount of energy stored (SOC) at thermal equilibrium
Publisher’s Note: MDPI stays neutral with regard to jurisdictional claims in published maps and institutional affiliations.

