
Evaluating Attraction and Passage Efficiencies of Pool-Weir Type Fishways Based on Hydraulic Analysis


1
Department of Civil and Environmental Engineering, Hankyong National University, 327 Chungang-ro, Anseong-si 17579, Gyeonggi-do, Korea
2
Department of Environmental Engineering, Inje University, 197 Inje-ro, Gimhae 50834, Gyengnam-do, Korea
3
Water Quality Assessment Research Division, National Institute of Environmental Research, Incheon 22689, Gyeonggi-do, Korea
4
Department of Civil and Environmental Engineering, Myongji University, 116 Myongji-ro, Yongin-si 17058, Gyeonggi-do, Korea
*
Author to whom correspondence should be addressed.
Appl. Sci. 2022, 12(4), 1880; https://doi.org/10.3390/app12041880
Submission received: 14 January 2022
/
Revised: 7 February 2022
/
Accepted: 8 February 2022
/
Published: 11 February 2022
(This article belongs to the Topic Sustainable Environmental Technologies)
Abstract
:In this study, a hydraulic analysis technique is presented for evaluating the efficiency of a pool-weir type fishway. The River-2D model with the fish physical habitat module was used for the analysis of the attraction efficiency, and the weighted usable area proposed as an index of the efficiency. For the analysis of passage efficiency, the three-dimensional model, FLOW-3D, was used as an evaluating tool to describe the fluid behavior on a hydraulic structure with a free surface. The ice-harbor type fishway at Dalseong weir in the Nakdong River of Korea was selected as a test-site, and the efficiency was estimated using the hydraulic analysis. The results of River-2D analysis showed that the location of the fishway near the right bank now was not appropriate for attracting the target fish to the fishway due to the deep water depth. The 3D analysis results presented that the flow velocity field inside the fishway showed a similar plunging flow in each pool, but various flow patterns appeared locally.
1. Introduction
Various types of devices have been used to facilitate the movement of fish past obstacles in waterways. This type of fish facility is commonly known as a fishway, fish ladder, or fish pass [1]. They are essentially water passages around or through obstacles designed to dissipate the energy of the water in a way that allows fish to ascend without undue stress [2]. Fishways must be designed and positioned based on the hydrodynamic characteristics and behavioral patterns of migrating species. When properly designed and placed, fish moving upstream through fishing structures can bypass river barriers and reach portions of the river suitable for growth and reproduction [2,3].
The efficiency of a fishway must be evaluated separately for attraction and passage efficiencies. The purpose of attraction is to lure fish to the fishway entrance, whilst the passage allows the fish that entered the fishway to pass [4]. Specifically, attraction efficiency can be defined as the ratio of the number of fishes that have been attracted to the fishway entrance among the ascending fish. Passage efficiency can be defined as the ratio of the number of fishes that have entirely escaped the fishway exit among the fish that have entered the fishway entrance. The reason for the separate evaluations of fishways between attraction and passage efficiencies is that these two efficiencies show different values according to the fishway types, as shown in Figure 1. This figure shows the statistical classification of fishway efficiency data that have been collected broadly in papers and reports by Bunt et al. [5]. As shown in Figure 1a, the pool-weir type fishway is relatively advantageous for fish attraction, whereas the nature-like fishway has relatively low attraction efficiency. However, the nature-like fishway shows the highest passage efficiency, and the pool-weir type fishway shows the lowest passage efficiency (see Figure 1b). The nature-like fishway refers to a by-pass fishway that bypasses the river barriers. It is not easy to find the fishway entrance for this type of fishway since it is connected to a riverbank. Furthermore, the attraction efficiency is reduced due to the mild slope of the fishway and the low flow rate at the fishway entrance. By contrast, if there is a low velocity inside a fishway, the passage efficiency becomes high because fishes that have entered the fishway can pass regardless of their swimming capacity. The pool-weir type fishways (including ice-harbor type) have a steeper slope than that of the nature-like fishways, and a strong flow occurs inside them. However, they are more advantageous over the nature-like fishway for attracting fish because a relatively strong flow is formed at the entrance.
Most fishways installed in small and medium sized rivers in South Korea are pool-weir type. Therefore, the evaluation of fishways should focus on passage efficiency [6]. However, due to hydrological conditions with frequent rainfalls, the riverbed change is considerably higher than that of other countries [7]. This necessitates continuous inspections about the degradation of attraction efficiency. Special care should be taken for maintenance of the vertical slot type with large deviations for both attraction and passage efficiencies. Further, the Denil type shows higher than average attraction and passage efficiencies as compared to other types, as shown in Figure 1.
By evaluating these two efficiencies, the fishway installation and management plans must be established to improve each efficiency. The overall efficiency of existing fishways can be evaluated more directly through fish monitoring. However, when planning for fishways, or when fish monitoring is difficult due to the specific situation, the fishway efficiency can be evaluated indirectly through hydraulic analysis. For attraction efficiency, it is necessary to identify the hydraulic characteristics around the fishway macroscopically. It is essential to analyze the hydraulic characteristics inside the fishway in more detail for passage efficiency. Therefore, two-dimensional (2D) analysis is sufficient for attraction efficiency, whereas the passage efficiency requires three-dimensional (3D) analysis.
Hydraulics in fish passage structures have been investigated for more than 30 years. Most numerical simulations have focused on the flow field inside a fishway according to its type. However, it is surprising to find that there is lesser published research on numerical simulation of flow fields around fishways than those inside [1]. Hereby, the following is a brief look at the previous studies that analyzed the flow velocity structure inside the fishways in three dimensions. Heimerl et al. [8] conducted a three-dimensional numerical simulation on a small-scale fishway (1.13 m in width) installed in the laboratory to identify the flow field in the vertical slot, and drew results that were relatively consistent with the observed flow field. Alvarez-Vazquez et al. [9] used the three-dimensional flow simulation result in the design of appropriate spacing between the slot and the weir of the vertical slot type fishway. Marriner et al. [10] represented the flow pattern in a fishway with a turning pool using a three-dimensional numerical model. If the obstacle’s height to be overcome is high, the length of the fishway becomes longer. In the case where the fishway is rotated in the form of a 180-degree curve is called a tunning pool. Studies on this have continued until recently, and Maniecki [11] analyzed the characteristics of the flow field by 3D simulation while changing even the positions of orifices and notch in a fishway with a tunning pool.
In this study, we propose a hydraulic analysis method that can evaluate attraction and passage efficiencies separately. For attraction efficiency analysis, the River-2D model with a fish physical habitat module was used, and the weighted usable area is suggested as an indicator of efficiency. For passage efficiency analysis, the FLOW-3D model, which has a free surface and can analyze the fluid behaviors in hydraulic structures, was used. For the target fishway for evaluation, we selected the ice-harbor type fishway at Dalseong weir in the Nakdong River of Korea.
2. Efficiency Evaluation Tools
2.1. Attraction Efficiency Evaluation Tool: River 2D
One of the most critical factors in attraction efficiency is the fishway installation location in the weir. In particular, fishways installed in small and medium sized weirs with small steps are more sensitive to location. The optimal method is to install two or more fishways in one barrier because even if one or two fishways do not work well, the other fishways can be used for fish ascending. However, if only one fishway must be installed in one barrier due to limited costs, the following four criteria should be considered [1].
- ①
- Close to upstream side: If the weir is not installed perpendicular to the flow direction, the ascending fish try to move upstream along a weir. Thus, the fishway should be installed in riverside close to the upstream sided, so that fish can find the fishway entrance [12].
- ②
- Near the thalweg line: During the low water and dry seasons, the flow occurs mainly along the line of maximum depth due to the low water flow. Thus, the fishway should be installed near the deepest line to secure flow in the fishway.
- ③
- Near the line of maximum flow velocity: According to the swimming characteristics of fish, it is known that fish ascend along the line of maximum flow velocity. Therefore, the fishway should be installed near the line of maximum flow velocity [2].
- ④
- The location where scouring and deposition are less inactive: If the area around the fishway entrance is scoured, the structure is separated from the riverbed and prevents the fish from ascending. If deposition occurs in the fishway exit, the fishway loses its function because water does not flow into the fishway.
Therefore, the fishway should be installed in a location where scouring and deposition are less active (Figure 2).
Additionally, Cowx and Welcomme [12], Clay [2], and Lundqvist et al. [13] have proposed various criteria for selecting the location of fishways. The problem is planning and installing fishways in actual weirs in rivers. It is often difficult to follow the criteria due to the complex situation of the river. Moreover, the hydraulic situation that is advantageous for attraction can be different depending on the characteristics of the target fish species. Consequently, it is necessary to develop indicators that can numerically evaluate the attraction efficiency for the target fish species instead of these criteria that state general principles. In this study, we propose the weighted usable area (WUA) as an indicator of attraction efficiency according to the results of Baek et al. [14].
The WUA (Weighted Usable Area) is a primary indicator of the PHABSIM (Physical Habitat Simulation), which is a one-dimensional physical habitat model and based on the Habitat Suitability Index (HSI). The HSI quantitatively represents the relationship between the physical properties of habitat such as flow velocity, water depth, and channel bed. In general, the HSI of fish is indicated as a relative ratio of the number of fish species that appeared in a specific survey location or section to the maximum number of species set as value of 1.0 as shown in Figure 3 [15].
In this figure, the horizontal axis indicates the water depth and flow velocity, namely, physical conditions. The vertical axis indicates the HSI. A value closer to 1.0 means that the water depth and flow velocity are more appropriate for the habitat conditions of the target species. The PHABSIM calculates the Combined Suitability Index (CSI) by calculating the evaluation components, namely flow velocity, water depth, and channel indices. The methods for calculating the CSI include standard computation, geometric mean, lowest limiting factor, and weighting. In this study, we selected the most widely used standard computation method.
The PHABSIM model has two modules: hydraulic simulation and habitat simulation. The primary hydraulic quantities are obtained through hydraulic simulation of the study area. Hence, the average water depth and flow velocity conditions of the channel can be used, or partial simulation can be performed by dividing the channel section into rectangular cells with small areas that can represent a more precise habitat distribution. The habitat simulation calculates the spatial area of the physical habitats of the target fish species by using the water depth, flow velocity, and channel indices obtained from the. hydraulic module. The output is WUA and is calculated by the following equation:
where is the area obtained by multiplying the distance and width of i cell separated from the channel section. is the CSI of the i cell separated from the channel section as illustrated in Figure 4 [16].
One problem is that it is challenging to select the fishway location where requires two-dimensional consideration since the PHABSIM is a one-dimensional model. Therefore, we used River-2D, which includes PHABSIM as one module. River-2D model was validated through several comparisons with experimental and field results by previous studies [17,18]. River-2D simulates the two-dimensional flow field through the following depth-averaged continuity equation and momentum equation:
where ; ; H is the average depth of the flow; U and V are the depth-averaged velocities of x and y directions, respectively; g is the gravity acceleration; is the water density; and are the riverbed slopes of the x and y directions, respectively; and are the friction slopes of the x and y directions, respectively; and ,, and denote the horizontal stress factors [19]. The parameters of River 2D model are the Manning’s roughness coefficient. This is a finite element model that can simulate the various flow conditions of a natural river, such as subcritical and supercritical flow.
2.2. Passage Efficiency Evaluation Tool: Flow-3D
The most important factor that should be considered concerning passage efficiency is the flow inside the fishway. The flow velocity inside a fishway is not easy to predict because it is highly dependent on external variables such as flow rate and slope. Furthermore, the flow patterns are diverse according to the shape, size, and intervals of structures (e.g., notch, orifice, and weir) installed inside the fishway. Nevertheless, the river design standard [20] in Korea only provides the average flow velocity range (0.5–1.0 m/s) inside the fishway as a design criterion.
The flow structure inside the pool-weir type fishway is generally known to be divided into the streaming flow and the plunging flow [21]. This is briefly illustrated in Figure 5.
As shown, reverse rotational flow occurs along with streaming flow near the fishway bottom; thus, fish swimming near the bottom are highly likely to lose the upstream direction and fail to ascend. However, fish can easily ascend with plunging flow because of the appropriate flow characteristics. In contrast, if the fish are swimming near the surface, the streaming flow is advantageous for ascending. Therefore, the specific internal flow structure (streaming flow/plunging flow) of the fishway will be an indicator of passage efficiency. A three-dimensional hydraulic analysis is required to discriminate this. Among the various 3D hydraulic models, we used the FLOW-3D model which can quickly analyze the fluid behaviors of hydraulic structures using the free surface. The FLOW-3D model applies the VOF (volume of fluid) theory and is employed in the field of hydraulics where the free surface motion is important. In addition, the FAVOR technique for complex shape expression is added to the FVM (finite volume method) using a rectangular grid for three-dimensional grid division, so that accurate shapes can be expressed quickly [22].
The FLOW-3D model uses the Reynolds equation. The equation has time-averaged the Navier–Stokes equation and the continuity equation as governing equations. Moreover, it provides various options including the k-ε and LES models as the turbulence model.
where is the volume in contact with the fluid; is the density of the fluid; is the turbulence diffusion term; are the flow velocities in the directions; are the contact areas of the fluid in the directions of the cell, respectively [23].
where are body accelerations; is the mass production term; are viscous accelerations; and are the loss generated during passage through the structure.
3. Applying Tools to the Fishway and Evaluating Efficiency
The Dalseong Weir, selected as the study site, is located on the Nakdong River in South Korea. As seen in Figure 6, it has two fishways, namely an ice-harbor fishway and a by-pass fishway on the right and left banks, respectively. The Dalseong Weir has a hybrid structure comprising a fixed weir (277 m) and a movable weir (120 m) with a total length of 377 m. Analyze will both the attraction and passage efficiency for the ice-harbor fishway. The ice-harbor fishway is of a set-back type, 104 m long, and 7 m wide. The fishway slope is 1:20. The by-pass fishway is out of scope in this study.
3.1. Evaluation of Attraction Efficiency
To evaluate the attraction efficiency of the ice-harbor type fishway at Dalseong weir, a research area of approximately 1.5 km upstream and downstream of the target fishway was chosen. Furthermore, a finite element mesh was constructed based on the observed river topography data as shown in Figure 7. Fine meshes were constructed for detailed simulation of the fixed weir and fishway. The total number of nodes of the finite element mesh was 4245 and the total number of elements was 8405.
The low water season was selected because the spawning season of most fish inhabiting Korean rivers is spring (April to June); the usage rate of the fishway increases in this season as the upstream and downstream movements of fish increase and this period usually corresponds to the low water season. For upstream boundary conditions for model simulation, we used the Dalseong weir inflow, which is provided in real-time by Korea Water Resources Corporation. The inflow data for April to June (spawning season) were acquired each year between 2013 and 2017. The total number of inflow data were 455. Due to the large differences between maximum and minimum values of daily inflow, using the mode value among the 455 data, resulting in an inflow of 56 m³/s. Furthermore, the management level at the downstream end of the Dalseong weir was found to be always maintained at approximately 13.5 m assigned as the downstream boundary condition. Manning’s roughness coefficient was set as 0.020 by referring to the Nakdong River Basic Planning Report [24] (Table 1). Furthermore, the simulation was performed without operating the movable weir as the weir was not operated when the inflow rate was 56 m³/s. Consequently, the water depth and flow velocity field in the low water season were obtained through the hydraulic module of River-2D, as shown in Figure 8a,b.
The HSI information for the target fish species is required to calculate the WUA in the River-2D model. First, the dominant and subdominant fish species were acquired based on the fish monitoring data [25,26,27,28,29] at a point downstream of the Dalseong weir. Goby minnow was selected as the target species because it was the dominant species in general after the installation of the Dalseong weir and subdominant species from 2013 to 2017 (Table 2). Goby minnow is a fish sensitive to water quality, and it is necessary to improve the habitat in the same environment as the fishway [18]. In this study, the research result of Kang et al. [15] was referenced for the HSI of the flow velocity and water depth for Goby minnow, as shown in Figure 2. The simulation result of the WUA for the target species based on the HSI using River-2D is shown in Figure 8c.
As shown in Figure 3, the preferred flow velocity for target fish (Goby minnow) is 0.05–0.25 m/s. In Figure 8b, the flow velocity was 0.30–0.35 m/s inside the fishway and 0.10–0.28 m/s near the fishway entrance. Thus, the preferred flow velocity was generated. Nevertheless, the WUA value, which is an indicator of attraction efficiency, was not large in the fishway entrance (Figure 8c) because of the effect of the water depth. While the preferred water depth of the target fish is 0.3–0.6 m (Figure 3), the water depth of the fishway entrance is more than 6 m (Figure 8a). Consequently, the ice-harbor fishway installed at the Dalseong weir is not effective for attracting the target species. To improve this problem, the location of the fishway entrance can be moved to a location with lower water depth. However, as shown in Figure 8a, the right bank in the downstream of the Dalseong weir at which the fishway is located has a large water depth than the left bank in general. Therefore, a possible method to improve the attraction efficiency of the fishway is to move the fishway from the right bank to the left bank.
3.2. Evaluation of Passage Efficiency
The passage efficiency was evaluated based on previous research results [30]. As mentioned earlier, passage efficiency can vary depending on the combination of weir shape, size, spacing, etc. These findings can be found in previous studies [8,31,32]. This study employed the FLOW-3D among commercial CFD models. By applying the RNG turbulent module to the FLOW-3D model, the flow characteristics inside the fishway were analyzed. There are four options for turbulence modules such as LES (Large Eddy Simulation), RNG (Re-Normalization Group), k-ε, and k-ω in FLOW-3D. The flow characteristics are quite sensitive to the turbulence model, so it is necessary to choose an appropriate model in specific situations. In this study, simulation results according to four turbulence models are compared with a measured velocity data acquired from a small-sized fishway which located at the small-sized stream named Gyong-an Cheon. This fishway is same type as the target fishway at Dalseong Weir, but its width and length are short. The inside structure of the small-sized fishway was surveyed as having three rows and 11 columns, whereas the target fishway has seven rows and 37 columns in total. The reason we measured velocity at the small-sized fishway instead of the target fishway is that we could not approach and observe inside of the target fishway due to safety issues. Cross-sectional velocity distribution was measured at the exit-section of the fishway using ADCP (Acoustic Doppler Current Profiler) as shown in Figure 9a. Based on the measured data, the flow rate inflow into the fishway was calculated according to the turbulence model. The flow rates are compared in Table 3. In this table, the inflow flow-rate calculated by the RNG model is the best match with the measured data. In addition, the velocity distribution at the exit-section of measurement by ADCP and that of calculation by the RNG turbulent model are quite similar, as shown in Figure 9. Thus, it can be concluded that the use of the RNG model is reasonable to describe the flow structure inside of ice-harbor type fishways.
The dimensions of the target fishway at Dalsung Weir were approximately 83 m in length and 8 m in width, with a 5% slope. The structure was surveyed as having seven rows and 37 columns in total, with three rows of non-overflow parts and four rows of overflow parts [30]. A movable gate was installed at the fishway exit, which enables flow control in the fishway during the dry season or emergency. The installed fishway is a set-back type, which is different from the existing set-forward type. The set-forward fishway has a protruding entrance in the main body of the weir. Thus, it suffered the disadvantage that fish tend to remain just downstream of the weir, making it difficult for fishes to reach the fishway entrance. The fishway type that has resolved this problem is the set-back type fishway, whose exit is located upstream of the weir and the fishway entrance is located in the main body of the weir [33]. Flowrate into the target fishway was assigned as 0.8 m3/s. The Manning’s roughness coefficient was applied as 0.014, which is a commonly used in the concrete structures. Figure 10 shows the snapshot of 3D simulation processes of the target fishway and the number of weirs. The weirs of the fishway were numbered as first from the entrance. There are 35 pools in addition to the movable gate for controlling the flow rate.
Figure 11a shows the results of the second, third, and fourth pools. In general, a plunging flow was formed. There is a rising pattern around the weir, causing complex flow patterns. Figure 11b shows the simulation results side-by-side on the 15th, 16th, and 17th pools, at the mid-point of the fishway. These results showed that the flow pattern is suitable for jumping on fish swimming near the bottom of the pool, such as Pseudogobio esocinus (target fish). Figure 11c shows the results for the 32nd, 33rd, and 34th pools. The results are similar to those seen in Figure 11a. A plunging flow is formed in general, but there is a rising flow pattern near the weir, showing complex patterns. The average and maximum flow velocities of the overflow part were 1.10 m/s and 1.24 m/s, respectively, while the average and maximum flow velocities of the undermining were 0.59 m/s and 1.74 m/s, respectively.
In conclusion, the flow velocity field inside the fishway shows that the plunging flow was formed in the fishway middle section, which is advantageous for the ascending of Pseudogobio esocinus, the target species. The plunging flow was generally formed at the entrance and exit, but it showed a complex structure as other cells appeared toward the water surface. However, considering that Pseudogobio esocinus mainly swim near the flow, the flow velocity field of the surface will not have a significant effect on the passage efficiency.
4. Conclusions
A hydraulic analysis method that can indirectly evaluate the attraction efficiency and passage efficiency of fishways was proposed in this study. For attraction efficiency analysis, a River-2D model with a fish physical habitat module was used, and the weighted usable area was suggested as an indicator of efficiency. For passage efficiency analysis, a 3D model with a free surface that can analyze the fluid behaviors of hydraulic structures was used. Moreover, the fishway efficiency was estimated with an ice-harbor fishway installed at Dalseong weir in the Nakdong River. In conclusion, although it was difficult to quantitatively replace the hydraulic analysis results with fishway efficiency, the efficiency was useful for identifying the overall tendency.
The 3D analysis results showed that the flow velocity field inside the fishway showed a similar plunging flow in each pool, but various flow patterns appeared locally. To evaluate and improve the fishway passage efficiency, the average hydraulic values (e.g., average flow velocity, water depth) as well as the results of elaborate modeling should be used. The results of River-2D analysis showed that the fishway located near the right bank was now not appropriate for attracting the target fish to the fishway due to the depth. A possible method to improve the attraction efficiency of the fishway is to move it to the left bank that has a lower depth. The attraction and passage efficiencies certainly require verification through direct fish monitoring in the fishway. However, when planning for a fishway or in difficult fish monitoring circumstances, hydraulic analysis, such as the method used in this study, has the advantage of indirectly evaluating the fishway efficiency.
Although it is possible to roughly confirm the efficiency of fishway through hydraulic analysis, it is difficult to ascertain variations of the fishway efficiency caused by riverbed change. There is a limit to knowing how the riverbed will change. In future work, design and management plans for fishway reflecting riverbed change are needed.
Author Contributions
Conceptualizatiation, K.-O.B. and J.-M.L.; methodology, J.-M.L. and E.-J.H.; software, J.-M.L. and E.-J.H.; Validation, J.-M.L. and E.-J.H.; formal analysis, K.-O.B. and Y.-D.K.; investigation, K.-O.B. and J.-M.L. and E.-J.H.; writing-original draft preparation, K.-O.B. and J.-M.L. and E.-J.H.; writing-review and editing, K.-O.B. and Y.-D.K.; visualization, J.-M.L. and E.-J.H.; supervision, K.-O.B. and Y.-D.K.; project administration, K.-O.B. and Y.-D.K. All authors have read and agreed to the published version of the manuscript.
Funding
This research was funded by [National Research Foundation of Korea] grant number [NRF-2020R1F1A1076887].
Institutional Review Board Statement
Not applicable.
Informed Consent Statement
Not applicable.
Acknowledgments
This study was carried out with a research grant from the National Research Foundation of Korea (NRF-2020R1F1A1076887).
Conflicts of Interest
The authors declare no conflict of interest.
References
- Baek, K.O.; Kim, Y.D. A case study for optimal position of fishway at low-head obstructions in tributaries of Han River in Korea. Ecol. Eng. 2014, 64, 222–230. [Google Scholar] [CrossRef]
- Clay, C. Design of Fishways and Other Fish Facilities; Lewis Publishers: Boca Raton, FL, USA, 1995. [Google Scholar]
- Jungwirth, M.; Schmutz, S.; Weiss, S. Fish Migration and Fish Bypasses; Fishing News book: Oxford, UK, 1998. [Google Scholar]
- Lucas, M.C.; Baras, E. Migration of Freshwater Fishes; Blackwell Science Ltd.: Oxford, UK, 2019. [Google Scholar] [CrossRef]
- Bunt, C.M.; Castro-Santos, T.; Haro, A. Performance of fish passage structures at upstream barriers to migration. River Res. Appl. 2012, 28, 457–478. [Google Scholar] [CrossRef]
- Kim, J.; Park, J.C.; Seong, J.; Park, J.H. Classification and Assessment of Fishway in the Tributary of Nakdong River. Korean J. Ecol. Environ. 2013, 46, 185–191. [Google Scholar] [CrossRef]
- Ahn, J.K.; Lee, J.M.; Kim, Y.D.; Kang, B.S. Effect of Climate Change on Long-Term Riverbed Change using GSTARS Model in Nakdong River, Korea. KSCE J. Civ. Eng. 2019, 23, 1849–1859. [Google Scholar] [CrossRef]
- Heimerl, S.; Hangmeyer, M.; Echteler, C. Numerical flow simulation of pool-type fishways: New ways with well-known tools. Hydrobiologia 2008, 609, 189–196. [Google Scholar] [CrossRef]
- Alvarez-Vazquez, L.J.; Martinez, A.; Vazquez-Mendez, M.E.; Vilar, M.A. The importance of design in river fishways. Procedia Environ. Sci. 2011, 9, 6–10. [Google Scholar] [CrossRef] [Green Version]
- Marriner, B.A.; Baki, A.B.M.; Zhu, D.Z.; Thiem, J.D.; Cooke, S.J.; Katopodis, C. Field and numerical assessment of tunning pool hydraulics in a vertical slot fishway. Ecol. Eng. 2014, 63, 88–101. [Google Scholar] [CrossRef]
- Maniecki, L. Numerical modelling of fish passage with turning pools. Arch. Hydro-Eng. Environ. Mech. 2018, 65, 41–66. [Google Scholar] [CrossRef] [Green Version]
- Cowx, I.; Welcomme, R. Rehabilitation of Rivers for Fish. Food and Agriculture Organization of the United Nations, Fishing News Books, Australia, 1998. Available online: https://www.ecrr.org/portals/27/Rehabilitation_of_Rivers_for_fish.pdf (accessed on 13 January 2022).
- Lundqvist, H.; Rivinoja, P.; Leonardsson, K.; McKinnell, S. Upstream passage problems for wild Atlantic salmon(Salmo salar L.) in a regulated river and its effect on the population. Hydrobiologia 2008, 602, 111–127. [Google Scholar] [CrossRef] [Green Version]
- Baek, K.O.; Ku, Y.H.; Kim, Y.D. Attraction efficiency in natural-like fishways according to weir operation and bed change in Nakdong river, Korea. Ecol. Eng. 2015, 84, 569–578. [Google Scholar] [CrossRef]
- Kang, H.; Im, D.; Hur, H.J.; Kim, K.H. Estimation of Habitat Suitablility Index of Fish Species in the Geum river Watershed. KSCE J. Civ. Eng. Korean Lit. 2011, 31, 193–203. [Google Scholar] [CrossRef]
- US Geological Survey (USGS). PHABSIM for Windows: User’s Manual and Exercises; Open File Report; Fort Collins Science Center: Fort Collins, CO, USA, 2001; Volume 1, p. 340. [Google Scholar] [CrossRef]
- Ghanem, A.; Steffler, P.; Hicks, F. Two-Dimensional hydraulic simulation of physical habitat conditions in flowing 355 streams. Regul. Rivers Res. Manag. 1996, 12, 185–200. [Google Scholar] [CrossRef]
- Baek, K.O.; Lee, J.M.; Ku, T.G.; Kim, Y.D. Evaluation of By-Pass Fishway Operation for Attraction Efficiency Based on GPS Drifter Field Experiments. Water 2021, 13, 2302. [Google Scholar] [CrossRef]
- Lee, S.H.; Oh, K.R.; Cheong, T.S.; Jeong, S.M. An assessment of fish habitat of natural fishway by hydraulic model experiments and numerical analysis. J. Korea Water Resour. Assoc. KWRA Korean Lit. 2012, 45, 317–329. [Google Scholar] [CrossRef] [Green Version]
- Korean Water Resources Association(KWRA). River Design Standard; Korean Literature; KWRA: Seoul, Korea, 2009; p. 624. [Google Scholar]
- Rajaratnam, N.; Katopodis, C. Plunging and streaming flows in pool and weir fishways. J. Hydraul. Eng. 1988, 114, 939–944. [Google Scholar] [CrossRef]
- Ahn, S.S.; Lee, S.I.; Lee, Z.S. Analysis of Hydraulic Characteristics in Ice-Harbor Fishway. Korean J. Environ. Sci. Int. 2012, 21, 1395–1406. [Google Scholar] [CrossRef]
- Lim, S.Y. An analysis of Hydraulic Characteristics and Fish Swimming Performance Associated with Distance between Baffles in the Ice-Harbor Fishway. Master’s Thesis, Myungji University, Yongin-si, Korea, 2010. Korean Literature. [Google Scholar]
- Ministry of Land, Infrastructure and Transport (MOLIT). Nakdong River Basic Plan Report; Korean Literature; MOLIT: Sejong-si, Korea, 2009; p. 1371. [Google Scholar]
- Nakdong River Watershed Management Committee (NRWMC). Aquatic Ecosystem Monitoring in Weir of the Nakdong River(Ⅰ); Nakdong River Environment Research Center: Sejong-si, Korea, 2013; p. 351. [Google Scholar]
- Nakdong River Watershed Management Committee (NRWMC). Aquatic Ecosystem Monitoring in Weir of the Nakdong River(Ⅱ); Nakdong River Environment Research Center: Sejong-si, Korea, 2014; p. 369. [Google Scholar]
- Nakdong River Watershed Management Committee (NRWMC). Aquatic Ecosystem Monitoring in Weir of the Nakdong River(Ⅲ); Nakdong River Environment Research Center: Sejong-si, Korea, 2015; p. 410. [Google Scholar]
- Nakdong River Watershed Management Committee (NRWMC). Aquatic Ecosystem Monitoring in Weir of the Nakdong River(Ⅳ); Nakdong River Environment Research Center: Sejong-si, Korea, 2016; p. 371. [Google Scholar]
- Nakdong River Watershed Management Committee (NRWMC). Aquatic Ecosystem Monitoring in Weir of the Nakdong River(Ⅴ); Nakdong River Environment Research Center: Sejong-si, Korea, 2017; p. 399. [Google Scholar]
- Jo, J.A.; Han, E.J.; Kim, Y.D.; Baek, K.O. Analysis of Hydraulic Passage Efficiency of Ice-Harbor Type Fishway for Flowrate Change. J. Korean Soc. Civ. Eng. Korean Lit. 2013, 33, 1841–1850. [Google Scholar] [CrossRef] [Green Version]
- Barton, A.; Keller, R. 3D Free Surface Model for a Vertical Slot Fishway. 2003. Available online: https://researchgate.net/publication/253645478_3D_Free_Surcface_Model_of_a_Vertical_Slot_Fishway (accessed on 13 January 2022).
- Kim, S.; Yu, K.; Yoon, B.; Lim, Y. A numerical study on hydraulic characteristics in the ice harbor-type fishway. J. Korean Soc. Civ. Eng. KSCE Korean Lit. 2012, 16, 265–272. [Google Scholar] [CrossRef] [Green Version]
- Choi, Y.H. Optimal Fishway Design for Seungchon Small Dam. Master’s Thesis, Konkuk University, Seoul, Korea, 2012. Korean Literature. p. 61. [Google Scholar]
Figure 1.
Attraction (a) and passage efficiency (b) according to fishway type [5].
Figure 1.
Attraction (a) and passage efficiency (b) according to fishway type [5].

Figure 2.
Schematic diagram of criteria for installation of fishway on low-head weir [1].
Figure 2.
Schematic diagram of criteria for installation of fishway on low-head weir [1].

Figure 3.
Pseudogobio esocinus (Goby minnow) HSI of target fishes in streams [15].
Figure 3.
Pseudogobio esocinus (Goby minnow) HSI of target fishes in streams [15].

Figure 4.
Simulation process of WUA [16].
Figure 4.
Simulation process of WUA [16].

Figure 5.
Flow pattern in pool/weir fishway [21].
Figure 5.
Flow pattern in pool/weir fishway [21].

Figure 6.
Location of ice-harbor type fishway at Dalseong Multifunctional weir.
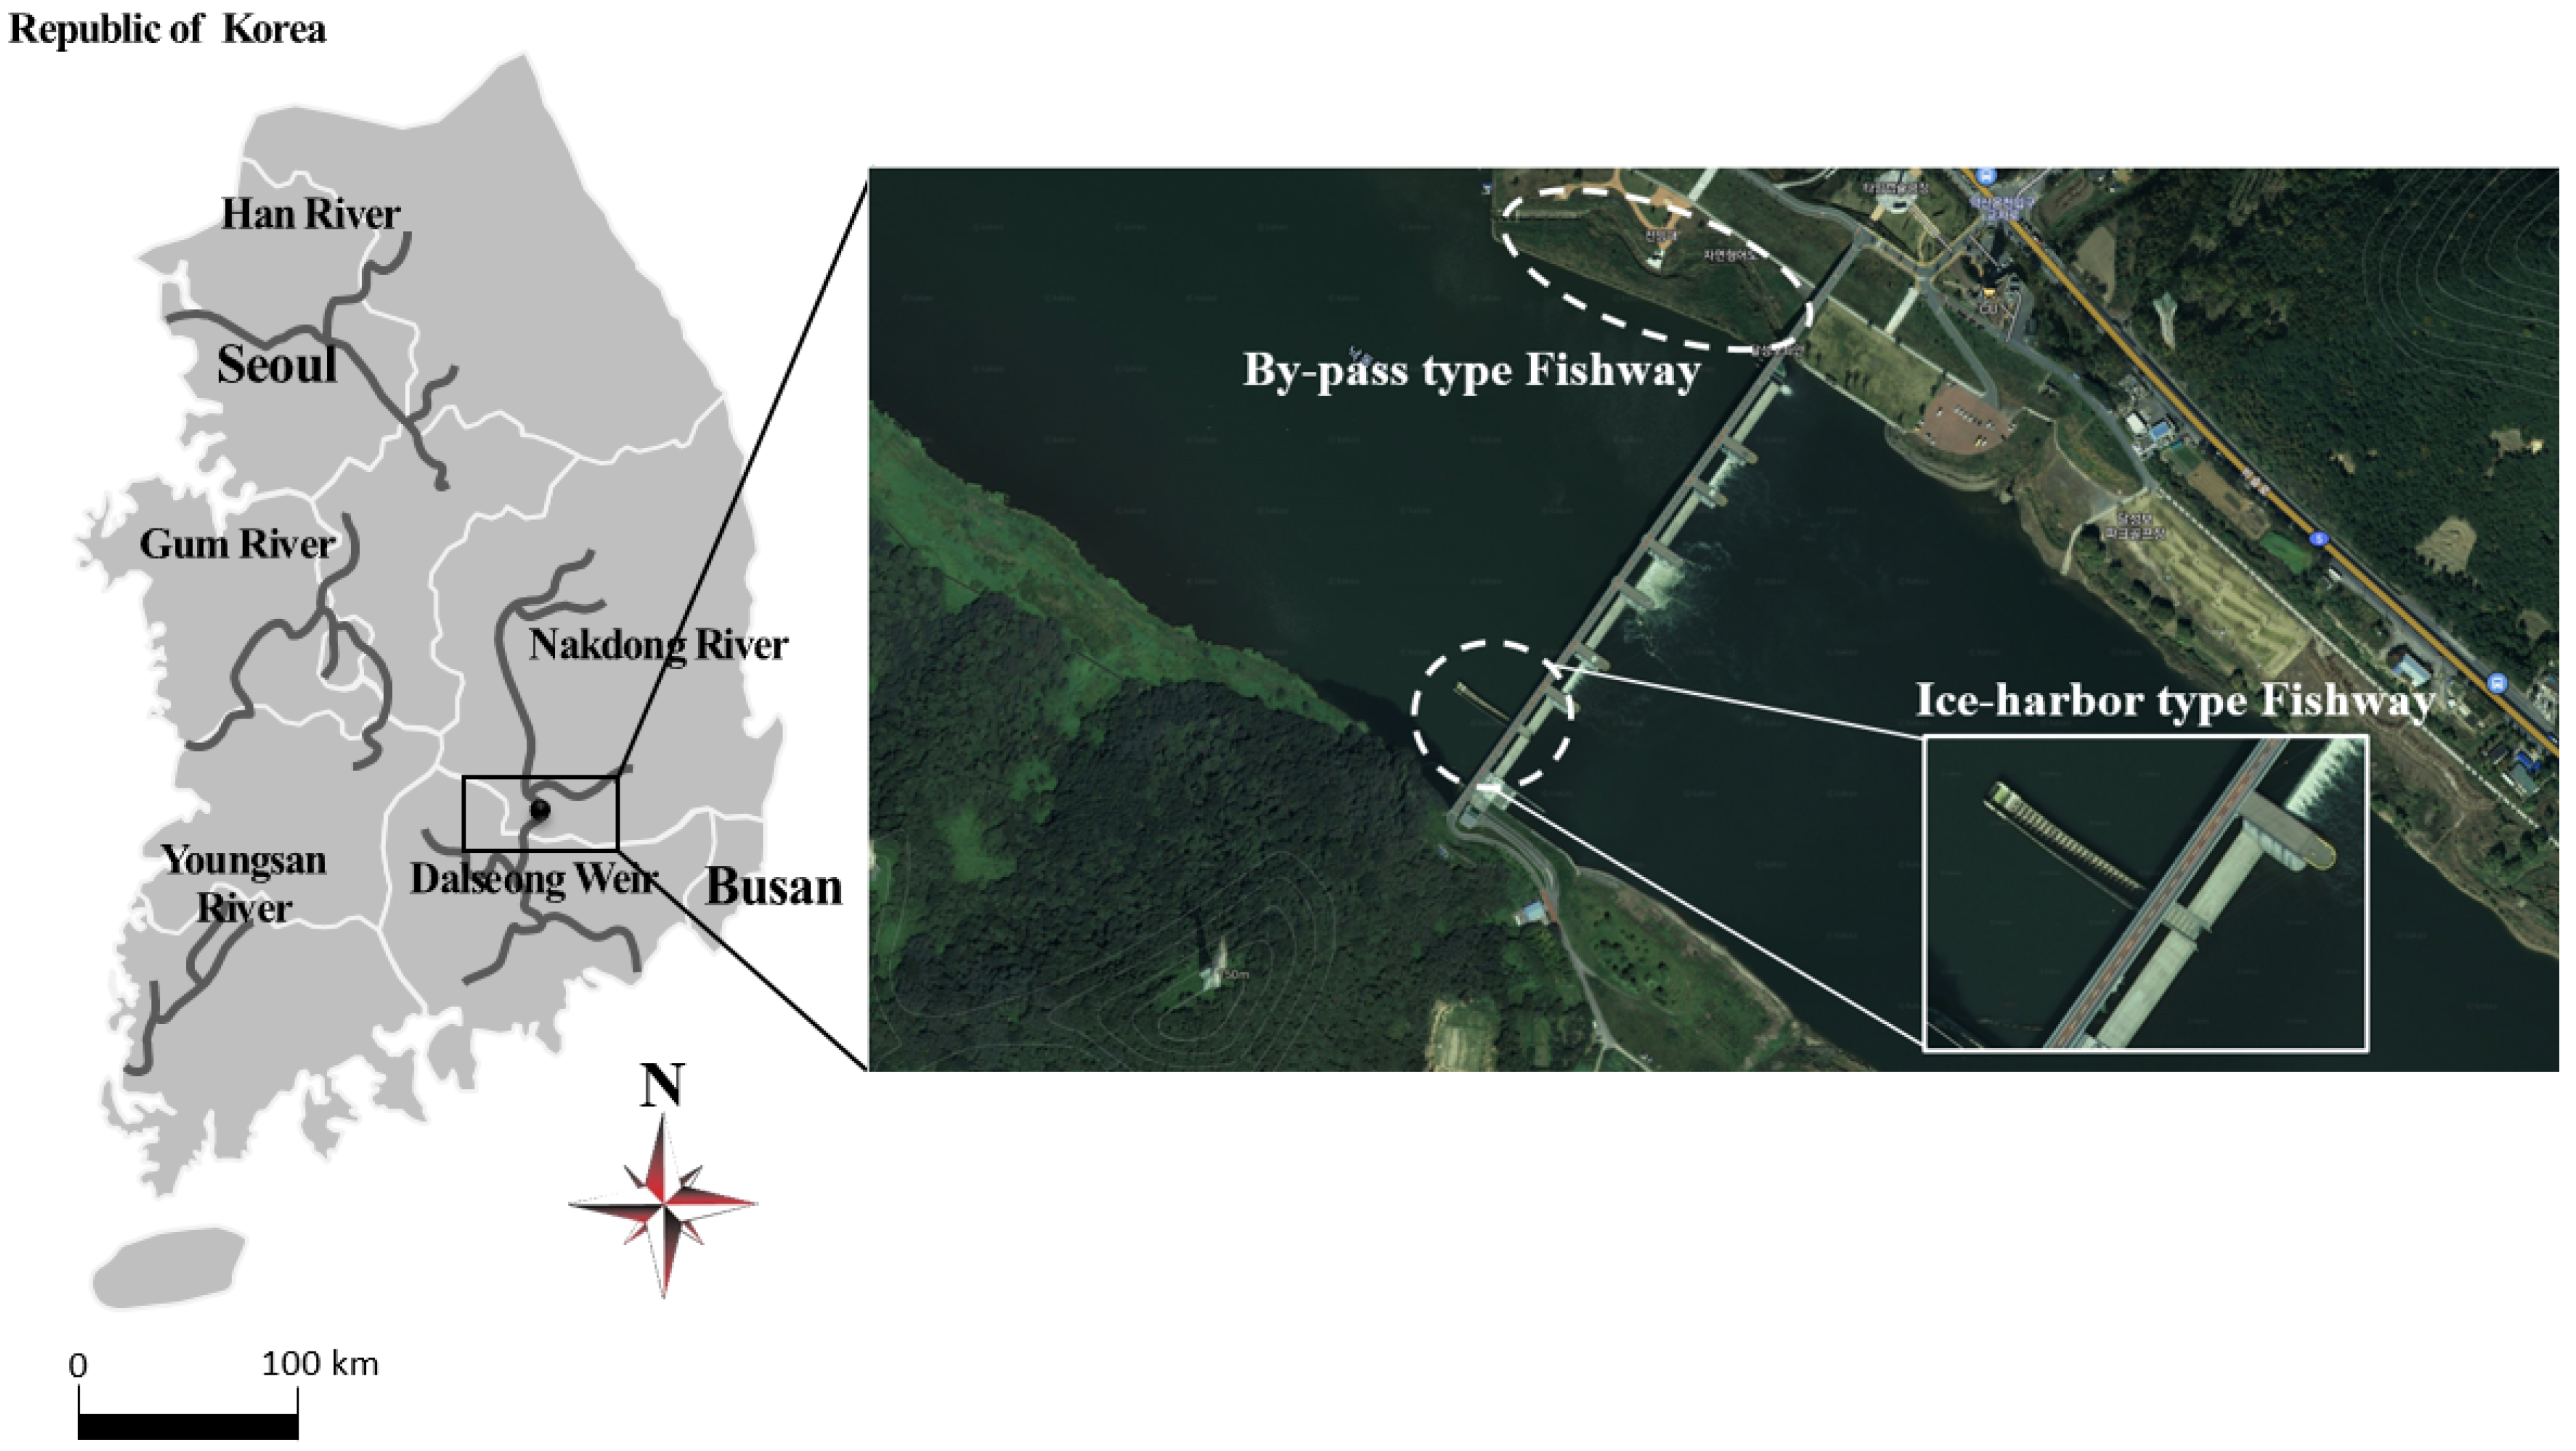
Figure 7.
Bed contour and finite element mesh at Dalseong weirs.

Figure 8.
Distribution of bed elevation, depth, velocity and WUA around Dalseong weir. (a) Depth distribution; (b) Velocity distribution; (c) Weighted Usable Area of Pseudogobio escocinus.
Figure 8.
Distribution of bed elevation, depth, velocity and WUA around Dalseong weir. (a) Depth distribution; (b) Velocity distribution; (c) Weighted Usable Area of Pseudogobio escocinus.
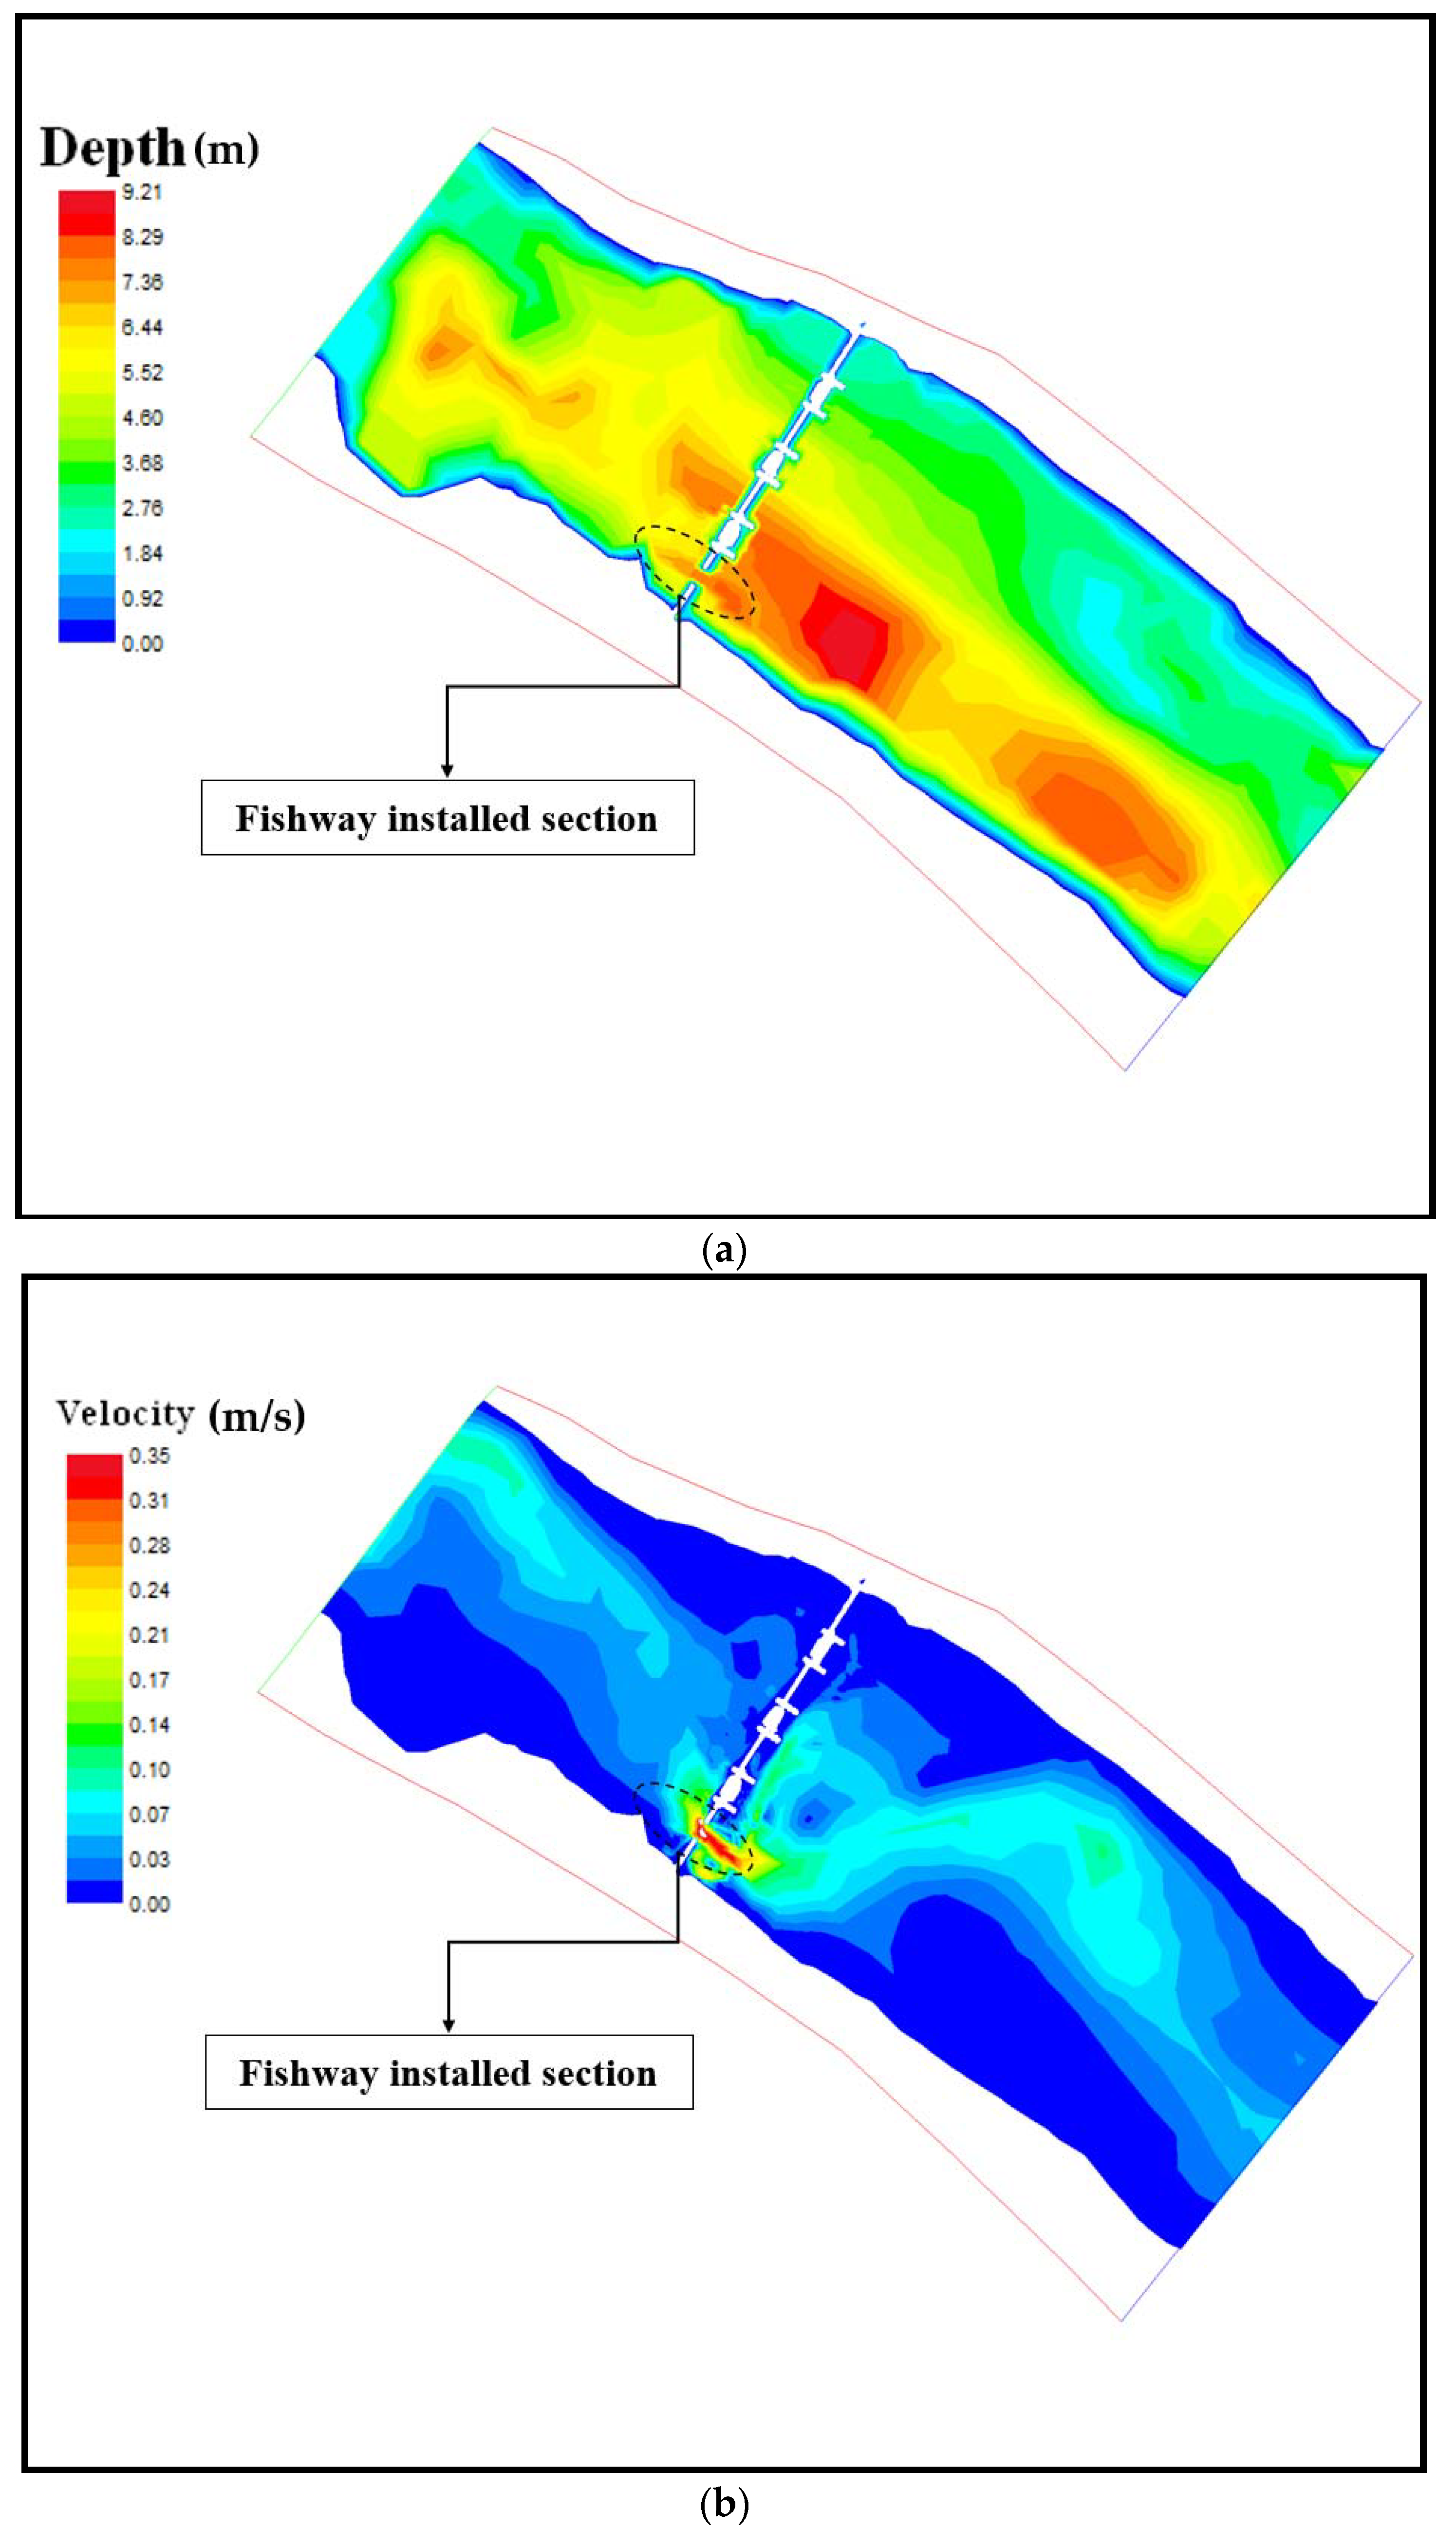

Figure 9.
Measuring velocity distribution at small-sized fishway and comparing results by ADCP. (a) Velocity measurement by ADCP at exit-section of fishway, (b) Velocity distribution at the exit-section of measurement by ADCP, (c) Velocity distribution at the exit-section of calculation by the RNG turbulent model.

Figure 10.
Aerial view (snapshot) of flow in the fishway.

Figure 11.
Results of ice-harbor type fishway at Dalseong weir: (a) Side view of flow structure in pools (2rd, 3th, 4th); (b) Side view of flow structure in pools (15th, 16th,17th); (c) Side view of flow structure in pools (32th, 33th, 17th).
Figure 11.
Results of ice-harbor type fishway at Dalseong weir: (a) Side view of flow structure in pools (2rd, 3th, 4th); (b) Side view of flow structure in pools (15th, 16th,17th); (c) Side view of flow structure in pools (32th, 33th, 17th).


Table 1.
Simulation condition of River2D model.
| Section | Upstream Boundary Conditions: Discharge (m3/s) | Downstream Boundary Conditions: Water Surface Elevation (m) | Parameter: Roughness Coefficient |
|---|---|---|---|
| Dalseong weir | 56 | 13.5 | 0.020 |
| Year | Dominant Species | Subdominant Species 1 | Subdominant Species 2 |
|---|---|---|---|
| 2013 | Goby minnow(115) (Pseudogobio esocinus) | Korean piscivorous chub (61) (Opsariichthys uncirostris) | Korean gudgeon (33) (Squalidus chankaensis tsuchigae) |
| 2014 | Goby minnow (25) (Pseudogobio esocinus) | Skygager (17) (Erythroculter erythropterus) | Light bullhead (14) (Leiocassis nitidus) |
| 2015 | Korean sharpbelly (88) (Hemiculter eigenmanni) | Bluegill (21) (Lepomis macrochirus) | Nile tilapia (15) (Oreochromis niloticus) |
| 2016 | Korean gudgeon (39) (Squalidus chankaensis tsuchigae) | Bluegill (35) (Lepomis macrochirus) | Goby minnow (30) (Pseudogobio esocinus) |
| 2017 | Korean sharpbelly (373) (Hemiculter eigenmanni) | Korean gudgeon (175) (Squalidus chankaensis tsuchigae) | Goby minnow (3) (Pseudogobio esocinus) |
Table 3.
Comparison of measuring and calculating flowrate of inflow into the small-sized fishway.
| Flowrate (m³/s) | ||
|---|---|---|
| Measurement by ADCP | 0.69 | |
| Calculation by | RNG | 0.65 |
| LES | 0.96 | |
| k-ε | 0.88 | |
Publisher’s Note: MDPI stays neutral with regard to jurisdictional claims in published maps and institutional affiliations. |
© 2022 by the authors. Licensee MDPI, Basel, Switzerland. This article is an open access article distributed under the terms and conditions of the Creative Commons Attribution (CC BY) license (https://creativecommons.org/licenses/by/4.0/).
Share and Cite
MDPI and ACS Style
Baek, K.-O.; Lee, J.-M.; Han, E.-J.; Kim, Y.-D. Evaluating Attraction and Passage Efficiencies of Pool-Weir Type Fishways Based on Hydraulic Analysis. Appl. Sci. 2022, 12, 1880. https://doi.org/10.3390/app12041880
AMA Style
Baek K-O, Lee J-M, Han E-J, Kim Y-D. Evaluating Attraction and Passage Efficiencies of Pool-Weir Type Fishways Based on Hydraulic Analysis. Applied Sciences. 2022; 12(4):1880. https://doi.org/10.3390/app12041880
Chicago/Turabian StyleBaek, Kyong-Oh, Jeong-Min Lee, Eun-Jin Han, and Young-Do Kim. 2022. "Evaluating Attraction and Passage Efficiencies of Pool-Weir Type Fishways Based on Hydraulic Analysis" Applied Sciences 12, no. 4: 1880. https://doi.org/10.3390/app12041880
Note that from the first issue of 2016, this journal uses article numbers instead of page numbers. See further details here.