
Optimization of Screw Mixer to Improve Drying Performance of Livestock Manure Dryer Using CFD Analysis

1
School of Mechanical Engineering, Pusan National University, Pusan 46241, Korea
2
Mechanical Convergence Technology, Pusan National University, Pusan 46241, Korea
3
Department of Mechanical Engineering, Dong Eui University, Pusan 47340, Korea
*
Author to whom correspondence should be addressed.
Appl. Sci. 2022, 12(6), 2872; https://doi.org/10.3390/app12062872
Submission received: 11 February 2022
/
Revised: 8 March 2022
/
Accepted: 8 March 2022
/
Published: 10 March 2022
Abstract
:Scarcity of fossil fuels and their emissions of fossil fuel pollutants, such as carbon dioxide, into the atmosphere, and the resulting consequences, have led energy policymakers to look for alternative renewable and clean energy sources. The use of animal wastes is one of the very promising renewable energy alternatives paving the way for a more sustainable energy network. Animal manure produced by livestock farms has a moisture content of about 80%, and such livestock manure is dehydrated to a moisture content of 20–25% and solidified to be used as biomass and fuel for thermal power plants. Previous studies on manure dryers have been concentrated on convection-type dryers, but this type of dryer has the disadvantage of inadequate processing capacity per hour because it cannot agitate manure. In this study, to deal with the drawbacks of conventional livestock manure drying methods, a screw-type dryer was proposed. CFD analysis of the dryer was performed by selecting the viscosity of livestock manure and design parameters of the screw using Ansys Workbench. Through the response surface method, optimal design of the screw shape for the improvement of drying efficiency and smooth discharge of residual manure was carried out.
1. Introduction
Scarcity of fossil fuels and their emissions of fossil fuel pollutants, such as carbon dioxide, into the atmosphere, and the resulting consequences, have led energy policymakers to look for alternative renewable and clean energy sources. In line with this target, biomass, which is a renewable energy generated from biomass, is a promising alternative source for the generation of clean energy and the development of a sustainable society [1]. World trends toward the modern dairy intensification on large production units cause massive animal manure production and accumulation, which can be a source of contamination of land, water, and air. In this sense, there are many efforts to transform these wastes into clean and renewable energy, such as the use of anaerobic digestion to produce biogas. The use of animal wastes is one of the very promising renewable energy alternatives paving the way for a more sustainable energy network. Animal manure is considered very attractive for the production of renewable energy since it is a natural resource that can additionally replace industrial fertilizers and improve soil fertility [2,3,4].
Animal wastes as biomass sources do not endanger food security and mitigate environmental impacts and may, therefore, considerably contribute to an appropriate waste management. As a result, converting animal wastes to energy is an important issue that has attracted the attention of academic and industrial researchers [5]. However, the environmental impacts of livestock production are attracting increasing attention, especially the emission of greenhouse gases (GHGs), and improper handling of manure produced by industrial farm operation greatly deteriorates the major environmental media including air, water, and soil [6,7,8]. Manure management is becoming an increasing burden for large dairy farms across the world due to land application limitations for nutrients and hauling costs. One solution is to install advanced manure management systems, which remove large portions of water from the manure and treat it to a level sufficient for surface water discharge, livestock consumption, or irrigation [9,10].
In general, animal manure produced by livestock farms has a moisture content of about 80%, and such livestock manure is dehydrated to a moisture content of 20–25% and solidified to be used as biomass and fuel for thermal power plants. In the treatment process of livestock manure, the manure drying system is the core equipment for agitation, drying, and odor removal. So far, direct dehydration methods using hot air, ultrasonic waves, and microwaves have been most widely used, but such methods cause machine vibration and incur additional facility costs such as decompression devices, and do not ensure smooth agitation of manure, resulting in problems such as drying non-uniformity and delays. In addition, the oil-drying method, which is the method of rapidly evaporating moisture by using oils with a smaller specific heat capacity than water, needs continuous consumption of waste oil during the drying process. If these conventional drying methods for livestock manure are used, manure is not sufficiently dried due to low drying performance, which causes odor, deteriorating the working conditions of workers and causing great inconvenience and annoyance to local residents.
Bao developed an innovative design of livestock and poultry manure dryer to improve the transportation efficiency, drying uniformity, and efficiency. The equipment consists of a sloping spiral feeding device to improve the efficiency of material transportation and seepage to preliminarily filter out and separate the moisture in manure [11]. Li set up a purpose-designed experimental drying apparatus to simulate the commercial manure drying system. Drying experiments were carried out to assess the impacts of hot air temperature, air velocity, and manure layer thickness on the fan’s energy consumption, dehydration rate, and nitrogen loss rate using the response surface analysis method. The optimal parameters for drying laying-hen manure were obtained [12]. Aboltins conducted the experimental and theoretical investigations of moisture content reduction from poultry manure by forced convection. The laboratory equipment was used for testing of the forced convective drying of manure due to vertical air streams going from the bottom through supporting trays with holes. Changed opened area of the trays with different density was used for definition of the main parameters [13,14]. Kic conducted the experimental and theoretical investigations of moisture content reduction from poultry manure by drying. Using the experimental data with different convective air speeds, the drying coefficient was calculated depending on the drying time and air speed at a constant temperature [15]. Amin-Nayyeri investigated the drying behavior of dairy cattle manure slabs in a convective tray-type dryer. Drying experiments were conducted on dairy cattle manure by varying thickness, drying air temperature, and velocity. A diffusion model was used to describe the moisture transfer, and then the effective diffusivity was determined for each temperature [16].
As described above, most previous studies on manure dryers have been concentrated on convection-type dryers, but this type of dryer has the disadvantage of inadequate processing capacity per hour because it cannot agitate manure. Recently, a disc-type dryer that performs agitation and drying of manure through the rotation of the disc was developed, as shown in Figure 1 [17]. However, as manure is dried by heat in the bottom part of the cavity, water vapor generated thereby is mixed with manure and moves downward again, reducing the drying efficiency of the dryer, and such dryers incur maintenance costs more than double the costs of that required by livestock farms (10,000 won or less/1 ton 1 h). Another problem is that manure is not completely discharged through the outlet by the disc and thus residual manure remains in the cavity, so livestock farms are reluctant to adopt a disc-type dryer. Moreover, conventional drying methods potentially cause water and soil pollution due to illegal dumping of manure, giving rise to a social problem.
Therefore, to deal with the drawbacks of the conventional livestock manure drying methods, this study proposed a screw-type dryer shown in Figure 2. By selecting the viscosity value of livestock manure and design parameters of the screw, CFD analysis of the screw-type dryer was performed using Ansys Workbench. Through the design of the experiment, optimal design of the screw shape for the improvement of drying efficiency and smooth discharge of residual manure was carried out, as shown Figure 3.
2. Configuration of the Screw-Type Dryer
The livestock manure dryer is equipment for drying, agitation, and odor removal of manure for biomass energy production. Figure 4 shows the process of converting animal manure into biomass energy using a livestock manure dryer. If animal wastes are put into the livestock manure dryer, they are solidified through agitation and drying, and energy is produced by using the solidified manure as fuel for thermal power plants.
The internal temperature of the animal manure dryer is maintained at 150 °C as heat is supplied from the external and transferred to the body and screw. If manure is put into the inlet, it is slowly transported to the outlet by the rotating screw, and manure is agitated and dried during the conveyance to the outlet.
3. Finite Element Analysis of the Dryer Screw
3.1. Finite Element Model
Three-dimensional modeling of the dryer was performed using Ansys Design Modeler by referring to the 2D model provided in the field in Figure 5. The CFD analysis model consists of the screw (immersed solid body) and the manure fluid domain composed of the housing and the outer diameter of the shaft. The screw blade has a thickness of 8mm, a pitch of 330 mm, a helical angle of 90°, a shaft diameter of 300 mm, and a total length of 6000 mm. Since the same pattern was repeated, a 1/6 partial model in the length direction (with length of 1000 mm) was created, as shown in Figure 6.
For the screw, face sizing of 6 mm was applied, and element of 199,801 EA and node of 241,920 EA were generated for the basic model, as shown in Figure 7a. For the fluid domain, to consider the viscosity of the housing and the shaft wall, the inflation mesh was applied by setting 9 layers and a growth ratio of 1.15. Face sizing of 0.31 mm and the sweep method were applied, and element of 521,612 EA and node of 545,008 EA were generated, as shown in Figure 7b. Average skewness for mesh quality is 0.22, which shows ‘excellent’ in ranges (0–0.25) according to skewness mesh metrics spectrum.
3.2. Theoretical Background
3.2.1. Reynolds-Averaged Navier–Stokes Equations
The properties of Reynolds operators are useful in the derivation of the RANS (Reynolds Averaged Numerical Simulation) equations. Using these properties, the Navier–Stokes equations of motion, expressed in the mean velocity and pressure fields of incompressible turbulent flow, are shown in Equation (1) for an incompressible Newtonian fluid. Momentum equation for analysis of three-dimensional incompressible and unsteady flow is shown in Equation (2).
3.2.2. Turbulence Model
The SST turbulence model is a two-equation eddy-viscosity model that is used for many aerodynamic applications. It is a hybrid model combining the Wilcox and the models. A blending function, , activates the Wilcox model near the wall and the model in the free stream. This ensures that the appropriate model is utilized throughout the flow field: The model is well suited for simulating flow in the viscous sub-layer. The model is ideal for predicting flow behavior in regions away from the wall. The turbulence kinetic energy (k) and its dissipation rate () are shown in Equations (3) and (4), where and P are the viscosity and pressure term containing the turbulence production due to the stresses in the flow, respectively. The constants are computed by a blend from the corresponding constants via the following formula [18,19].
Constants for k–ω closure
Constants for k–e closure
Constants for SST closure
3.3. Analysis Conditions
Transient analysis was performed by applying the SST model. For the fluid domain in this study, both corners of the upper part do not include curved wall and complex geometry, so the k–ε model is suitable. However, the only use of the k–ε model will show poor performance near the screw with large strains. In the optimization, when applying k–ε model to a screw shape with bad agitating ability, the k–ε model will overpredict shear stress and suppresses separation, so this leads to deteriorating reliability of optimization.
Thus, the k–ω model, which well describes flows with separation and recirculation, is suitable to the near screw with curved wall and boundary layers. For these reasons, to improve reliability of the CFD analysis result of near and far from the screw, this study adopted the SST k–ω model combining k–ε and k–ω model.
Since overall manure is sufficiently agitated when the screw is rotated at least 4 revolutions, analysis time and time step was set as 14.47 s and 0.36175. The space from the top of the fluid domain to 80 mm below the center of the shaft axis of rotation is filled with air, and the other area is filled with water. The screw is set immerged body and its rotation speed is 19 rpm, as shown Figure 8, and these are listed in Table 1. The temperatures of air and manure were set at 150 °C, which is the operating temperature in the field. In order to simulate sufficient agitation of the fluid domain, it was assumed that the fluid domain is an enclosed space without openings for entry and exit, and the outer wall was set as a no-slip wall. In fluid dynamics, as the Reynolds number increases, heat flux and turbulence kinetic energy increase while collision and separation of flows occur, and the turbulence intensity rises, thereby causing an increase in heat transfer. Therefore, for shape optimization of the screw to increase the turbulence kinetic energy, maximum turbulent kinetic energy was set as an output parameter [20,21].
3.4. Analysis Parameters
Because of diversification of the types and breeds of pigs and breeding conditions, it is practically difficult to identify the exact physical properties and chemical composition of manure. To analyze effects of the change in viscosity on turbulent kinetic energy, analysis results of turbulent kinetic energy according to the change in fluid viscosity from 0 to 10 in the interval of 2 are shown in Table 2. To judge solution convergence, the residual error values of mass, momentum, and turbulence model were plotted, as shown in Figure 9. Residual criteria of all equations were set to . After the simulation ran for 98 iterations, convergence for each time step was achieved. Figure 10 shows the manure behavior obtained through CFD analysis.
Since the turbulent kinetic energy increases with the increase of viscosity, it was found that viscosity is a very important property in describing the behavior of fluids, and it is necessary to select the property of viscosity that is most similar to pig manure. Human excrement has an average moisture content of 74.5% (63–86%) [22], which is very similar to the average moisture content (76.3%) of pig manure with a standard body weight (70 kg) [23]. Since the viscosity of human excrement is 3.5–5.5 Pa·s, in this study, the average viscosity value of human excrement, 4.5 Pa·s, was applied, and its CFD result is 0.299 J/kg, as shown Table 3.
3.5. Measurement for Moisture Content of the Livestock Manure
For performance analysis of the manure dryer, its moisture content should be measured. After the internal temperature of the screw-type dryer exceeds 100 C, the screw was rotated to prepare to dry the livestock manure obtained in the field, and when the temperature was 150 C, the amount of 1000 kg of the livestock manure was input per hour. Figure 11 shows the result of the moisture content of the livestock manure dried by the screw-type dryer, which is 41.8% and is required to reduce moisture content in order to increase the efficiency of biofuels.
3.6. Optimal Design of the Dryer Screw Using the Response Surface Method
Optimal Design of the Screw Gap Shape
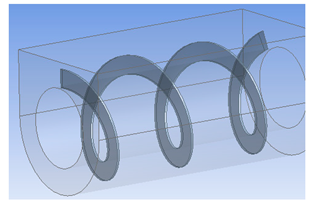
For smooth discharge of livestock manure, blade gaps were created on the screw as shown in Figure 12, and shape optimization for them was carried out. Since drying efficiency may be reduced due to a decrease in the area of the screw blade resulting from the creation of blade gaps, double blades with the same dimensions were placed to compensate for the decrease in drying efficiency, as shown in Figure 13.
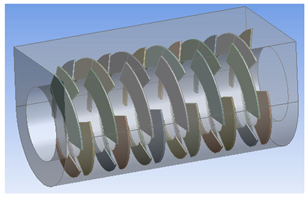
As shown in Figure 14, gaps were created at 120° intervals so that gaps and the shaft center would form a fan shape, and to maximize agitation and discharge, gaps of the left blade and those of the right blade were arranged in an alternate fashion so that each gap of the left blade was placed 60° apart from a gap of the right blade. Considering the blade strength and ease of processing, the number of gaps was fixed at 3 per blade, and the created 1/6 scale model is shown in Figure 15.
Regarding the shape of the blade gap, as shown in Figure 16, the distance between the left and right blades (L), the angle of the gap (α), and pitch (P), height (H), helix angle (), and thickness (t) were selected as design parameters by the trial and error method. As shown in Figure 17, the ranges of each design parameter were set considering blade strength and processability as follows: L: 10–50 mm, α: 5–40°, P: 150–400 mm, H: 30–80 mm, : 90–130, t: 3–10 mm.
In order to generate the response surface for selected design parameters above, the OSF (optimal space filling) technique was used, and input parameters (t, H, L, , α, P) and output parameters (maximum turbulence kinetic energy) were set. Thus, a total of 45 samples of analytical modeling were generated, and response surface was generated by the genetic aggregation method. To optimize the screw, maximum turbulence kinetic energy selected as the objective function and its optimization carried out using the MOGA optimization technique, as shown in Table 4. To evaluate its validation, CFD analysis about candidate point (L: 49.6 mm, α: 5°, P: 151 mm, H: 80 mm, : 90°, and t: 10 mm) was conducted. The result is 0.26 J/kg, as shown in Figure 18, and the error between candidate value and the verification value of turbulence kinetic energy was 48.8%.
In order to improve the accuracy of optimal value calculated by the response surface, it is necessary to increase the quality of the response surface, and narrowing in the range of sampling generation can be a solution. Table 5 shows the dimensions of the model with the highest turbulence kinetic energy value among the 45 samples for generating the response surface; the samples of analysis were regenerated as shown Figure 19.
Based on the above 45 cases analysis, the response surface created using the genetic aggregation for optimal design and goodness of fit was analyzed to verify quality of the response surface, as shown Figure 20. The Predicted and Observed chart shows the values predicted from the response surface versus the values observed from the design points. The closer the points are to the diagonal line, the better the response surface fits the points. It was found that the identity line matched well with the design point compared to before the ranges change.
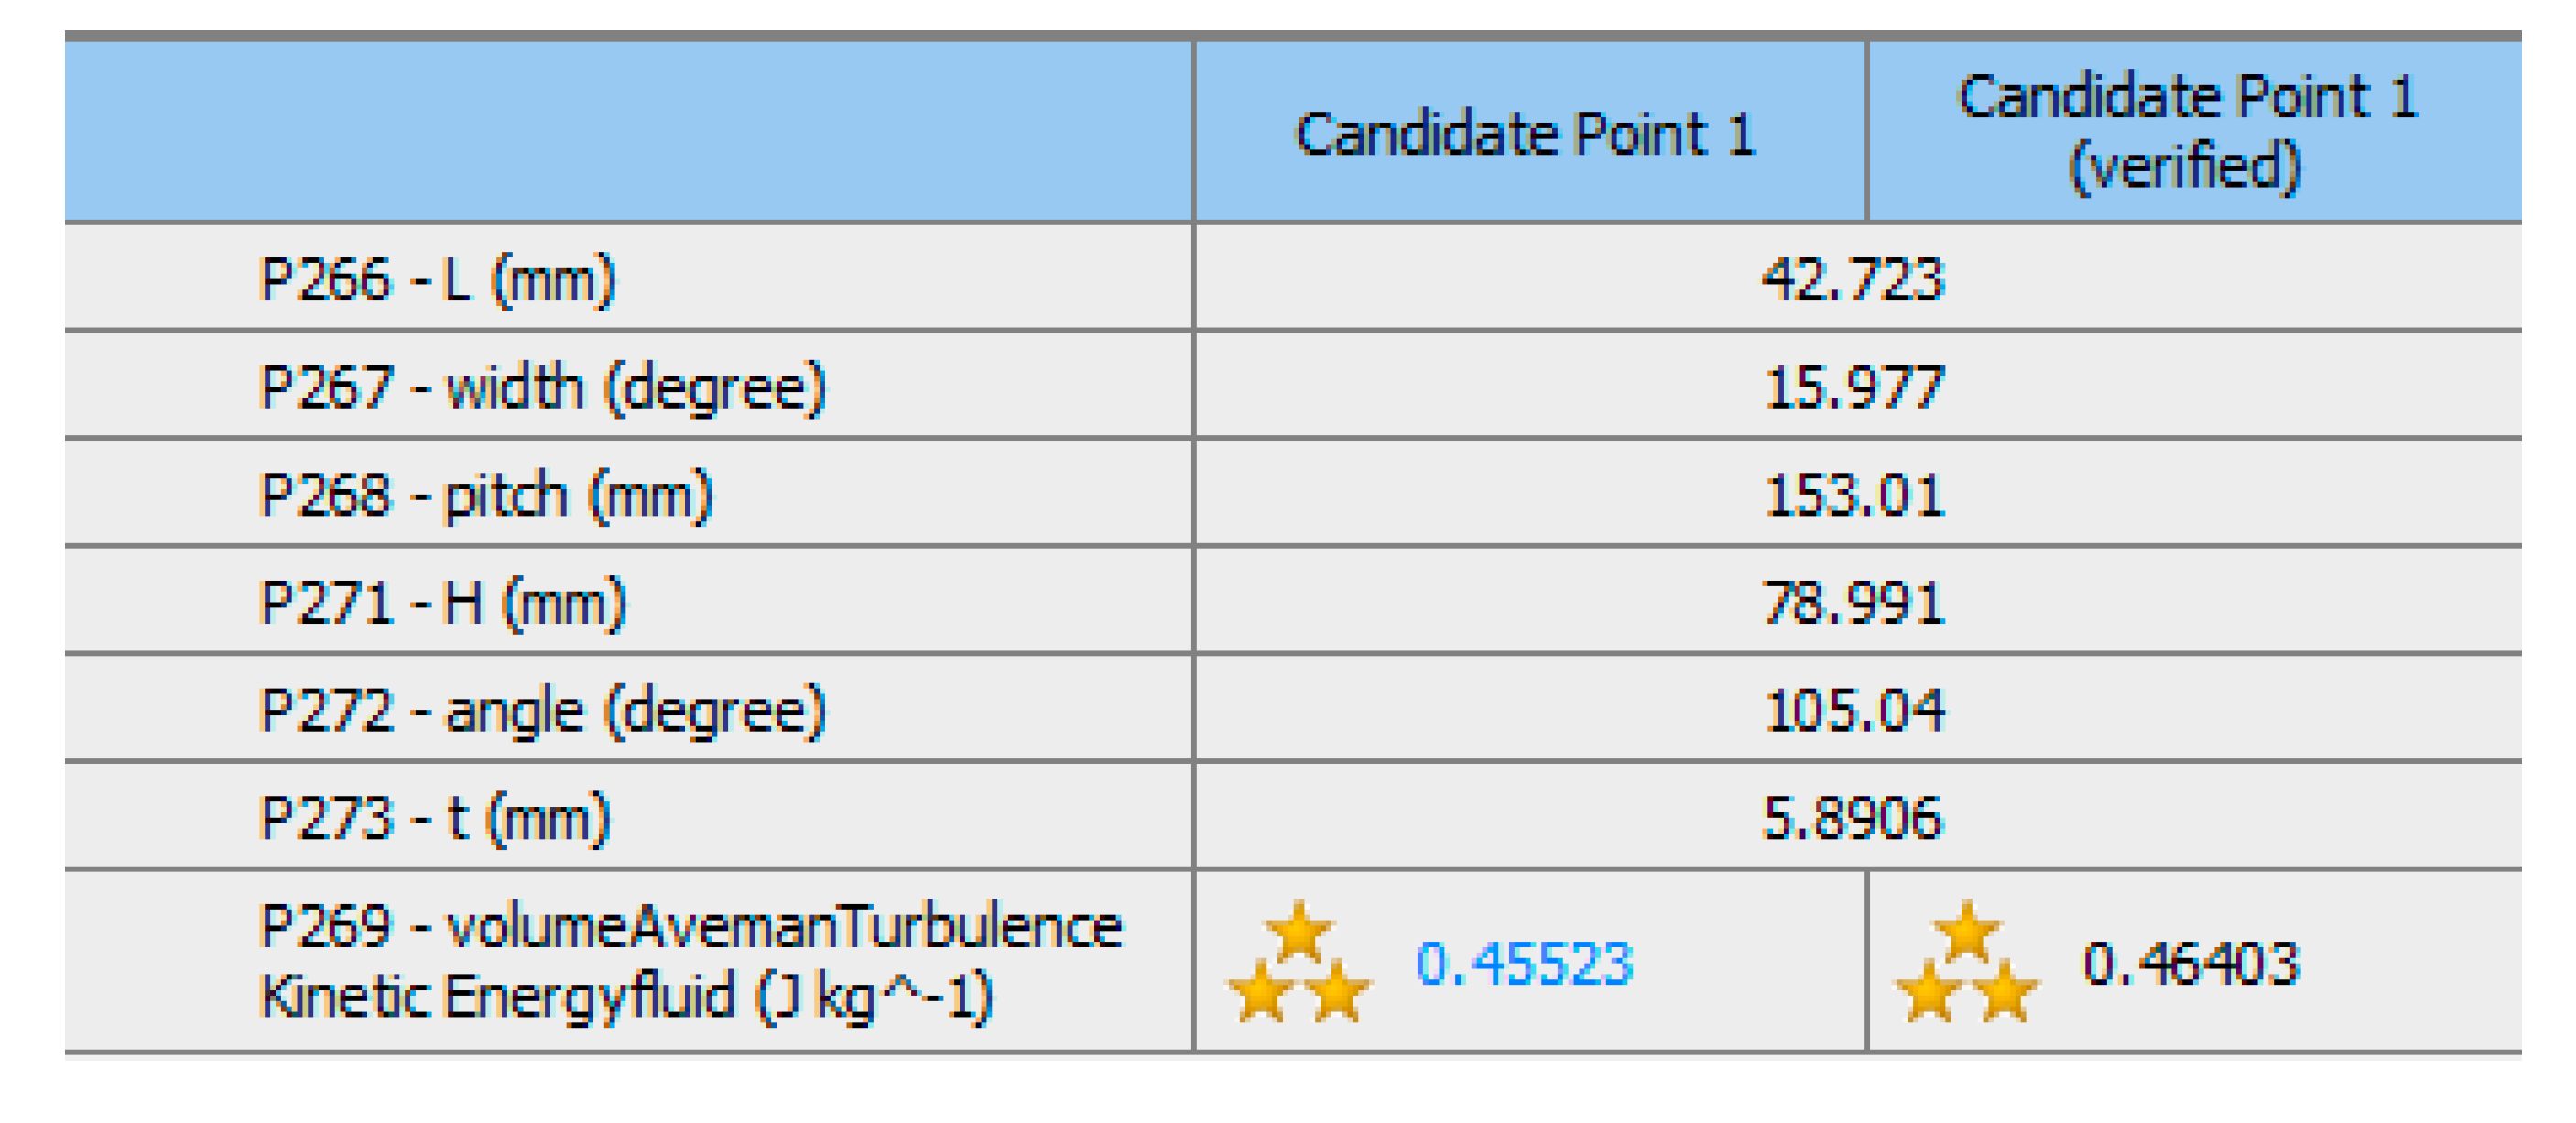
In the same way as above, optimization for maximum turbulence kinetic energy was carried out, and candidate point (L: 42.7 mm, α: 16°, P: 153 mm, H: 79 mm, : 105°, and t: 5.9 mm) with 0.45 J/kg was recommended, as shown Figure 21. To verify the recommended value through the response surface, CFD analysis was performed; its result is 0.46 J/kg, as shown in Figure 21, and the error between candidate value and the verification value of turbulence kinetic energy was 2.2%, as shown Table 6. Finally, L: 42.7 mm, : 16°, P: 153 mm, H: 79 mm, : 105, and t: 5.9 mm, which has maximum turbulent flow stress, was selected as the optimal model.
Table 7 shows the comparison of analysis results of the existing model and the final improved model. Compared to the existing model, and the maximum turbulent kinetic energy was increased by 40%, leading to a significant improvement of drying efficiency.
4. Conclusions
This study proposed a screw-type dryer. By selecting the viscosity value of livestock manure and design parameters of the screw, CFD analysis of the screw-type dryer was performed using Ansys Workbench. Through the design of the experiment, optimal design of the screw shape for the improvement of drying efficiency and smooth discharge of residual manure was carried out.
- Based on the field experience, the screw-type dryer was manufactured, and the following results were obtained:
- -
- Human excrement has an average moisture content of 74.5%, and its viscosity is 3.5–5.5 Pas. Thus, the viscosity of livestock manure (moisture content: 76.3%) was determined to be 4.5 Pas (average viscosity of human excrement).
- -
- As a result of applying the screw-type dryer to finite element analysis, the turbulence kinetic energy (0.299 J/kg) was obtained and moisture content of the livestock manure reduced from 76.3% to 41.8%.
- The design parameters for the double blade screw are determined by the trial and error method, and their order to influence the turbulence energy is as follows:
- -
- Pitch (P) → thickness (t) → height (H) → helix angle (θ) → distance between the left and right blades (L) → angle of the gap (α).
- Based on the screw-type dryer manufactured in the field, the optimal design of the dryer screw was obtained from the response surface method, increasing the turbulence kinetic energy by 35% (0.299 → 0.46 J/kg), which reduced moisture content of the livestock manure from 41.8% to 24.7%.
Author Contributions
Conceptualization, G.P.; methodology, G.P. and T.E.; validation, G.P. and T.E.; formal analysis, G.P.; investigation, G.P. and H.K.; writing—review and editing, G.P. and C.K.; supervision, C.K. All authors have read and agreed to the published version of the manuscript.
Funding
This work was supported by the Starting growth Technological R&D Program (S2760074) funded by the Small and Medium Business Administration (SMBA, Korea).
Institutional Review Board Statement
Not applicable.
Informed Consent Statement
Not applicable.
Data Availability Statement
Not applicable.
Conflicts of Interest
The authors declare no conflict of interest.
References
- Baetge, S.; Kaltschmitt, M. Rice straw and rice husks as energy sources-comparison of direct combustion and biogas production. Biomass Convers. Biorefin. 2018, 8, 719–737. [Google Scholar] [CrossRef]
- Orlando, M.Q.; Borja, V.M. Energies, Preteatment of animal manure biomass to improve biogas production: A review. Control. Eng. Pract. 2005, 13, 789–803. [Google Scholar]
- Nasir, I.M.; Ghazi, T.M.; Omar, R. Production of biogas from solid organic wastes through anaerobic digestion: A review. Appl. Microbiol. Biotechnol. 2012, 95, 321–329. [Google Scholar] [CrossRef] [PubMed]
- Tallou, A.; Haouas, A.; Jamali, M.Y.; Atif, K.; Amir, S.; Aziz, F. Review on cow manure as renewable energy. In Smart Village Technology; Springer: Cham, Switzerland, 2020; Volume 17, pp. 341–352. [Google Scholar]
- Bijarchiyan, M.; Sahebi, H.; Mirzamohammadi, S. A sustainable biomass network design model for bioenergy production by anaerobic digestion technology: Using agricultural residues and livestock manure. Energy Sustain. Soc. 2020, 10, 19. [Google Scholar] [CrossRef] [Green Version]
- Philippe, F.X.; Nicks, B. Agriculture, Review on greenhouse gas emissions from pig houses: Production of carbon dioxide, methane and nitrous oxide by animals and manure. Ecosyst. Environ. 2015, 199, 10–25. [Google Scholar] [CrossRef] [Green Version]
- Rehman, K.; Cai, M.; Xiao, X.; Zheng, L.; Wang, H.; Soomro, A.A.; Zhou, Y.; Li, W.; Yu, Z.; Zhang, J. Cellulose decomposition and larval biomass production from the co-digestion of dairy manure and chicken manure by mini-livestock (Hermetia illucens L.). J. Environ. Manag. 2017, 196, 458–465. [Google Scholar] [CrossRef] [PubMed]
- Prapaspongsa, T.; Poulsen, T.G.; Hansen, J.A.; Christensen, P. Energy production, nutrient recovery and greenhouse gas emission potentials from integrated pig manure management systems. J. Sustain. Circ. Econ. 2010, 28, 411–422. [Google Scholar] [CrossRef] [PubMed]
- Holzem, M.M.; Katers, J.F. Life-cycle analysis of advanced manure management systems for a wisconsin confined animal feeding operation (CAFO). Appl. Eng. Agric. 2019, 35, 51–59. [Google Scholar] [CrossRef]
- Dennehy, C.; Lawlor, P.G.; Jiang, Y.; Gardiner, G.E.; Xie, S.; Nghiem, L.D.; Zhan, X. Greenhouse gas emissions from different pig manure management techniques: A critical analysis. Front. Environ. Sci. Eng. 2017, 11, 11. [Google Scholar] [CrossRef]
- Bao, Z.; Wang, P.; Qin, Z.; Jia, J.; Zhao, X. Innovative design of dryer in utilization and desposal of livestock and poultry manure. J. Phys. 2020, 1578, 012173. [Google Scholar]
- Li, X.; Zheng, W.; Li, B.; Tong, Q. Optimization of low-temperature drying of laying-hen manure using response surface methodology. J. Air Waste Manag. Assoc. 2020, 70, 206–218. [Google Scholar] [CrossRef] [PubMed]
- Aboltins, A.; Kic, P. Comparison of two methods of poultry manure drying. Eng. Rural Dev. 2014, 5, 143–149. [Google Scholar]
- Aboltins, A.; Kic, P. Forced convection in drying of poultry manure. Agron. Res. 2015, 13, 215–222. [Google Scholar]
- Kic, P.; Aboltins, A. Convective drying of poultry manure by different air speeds. In Proceedings of the 12th Internatioanl Scientific Conference: Engineering for Rural Development, Jelgava, Latvia, 23–24 May 2013; pp. 121–125. [Google Scholar]
- Nayyeri, M.A.; Kianmehr, M.H.; Arabhosseini, A.; Hassan, S.R.; Aghbashlo, M. Drying behavior and mathematical modeling of dairy cattle manure in a convective dryer. Appl. Eng. Agric. 2010, 26, 689–697. [Google Scholar] [CrossRef]
- Raouzeos, G. The ins and outs of indirect drying: Consistent with the diversity of chemical-process-industries materials that undergo drying, a wide variety of contact dryers have been brought to the marketplace. However, there is a common set of principles for their process design, and for specifying them. Chem. Eng. 2003, 110, 30–38. [Google Scholar]
- Meter, F.R. Zonal Two Equation k–ω Turbulence Models for Aerodynamic Flows. In Proceedings of the 23rd Fluid Dynamics, Plasmadynamics, and Lasers Conference, Orlando, FL, USA, 6–9 July 1993; pp. 93–2906. [Google Scholar]
- Meter, F.R. Two-equation eddy-viscosity turbulence models for engineering applications. AIAA J. 1994, 32, 1598–1605. [Google Scholar] [CrossRef] [Green Version]
- Gherasim, I.; Taws, M.; Galanis, N.; Nguyen, C.T. Heat transfer and fluid flow in a plate heat exchanger part I. Experimental investigation. Int. J. Therm. Sci. 2011, 50, 1492–1498. [Google Scholar] [CrossRef]
- Gherasim, I.; Taws, M.; Galanis, N.; Nguyen, C.T. Heat transfer and fluid flow in a plate heat exchanger part II: Assessment of laminar and two-equation turbulent modes. Int. J. Therm. Sci. 2011, 50, 1499–1511. [Google Scholar] [CrossRef]
- Rose, C.; Parker, A.; Jefferson, B.; Cartmell, E. The Characterization of feces and Urine: A Review of the Literature to inform Advanced Treatment Technology. Environ. Sci. Technol. 2015, 45, 1827–1879. [Google Scholar] [CrossRef] [PubMed] [Green Version]
- Hwangbo, J.; Hong, E.H.; Park, H.D.; Kim, D.W.; Cho, S. The study on the amount and major compositions of excreta from swine. J. Anim. Sci. Technol. 2010, 52, 319–328. [Google Scholar] [CrossRef] [Green Version]
Figure 1.
The conventional livestock manure dryer with disc-type.

Figure 2.
The livestock manure dryer with screw-type manufactured in the field.
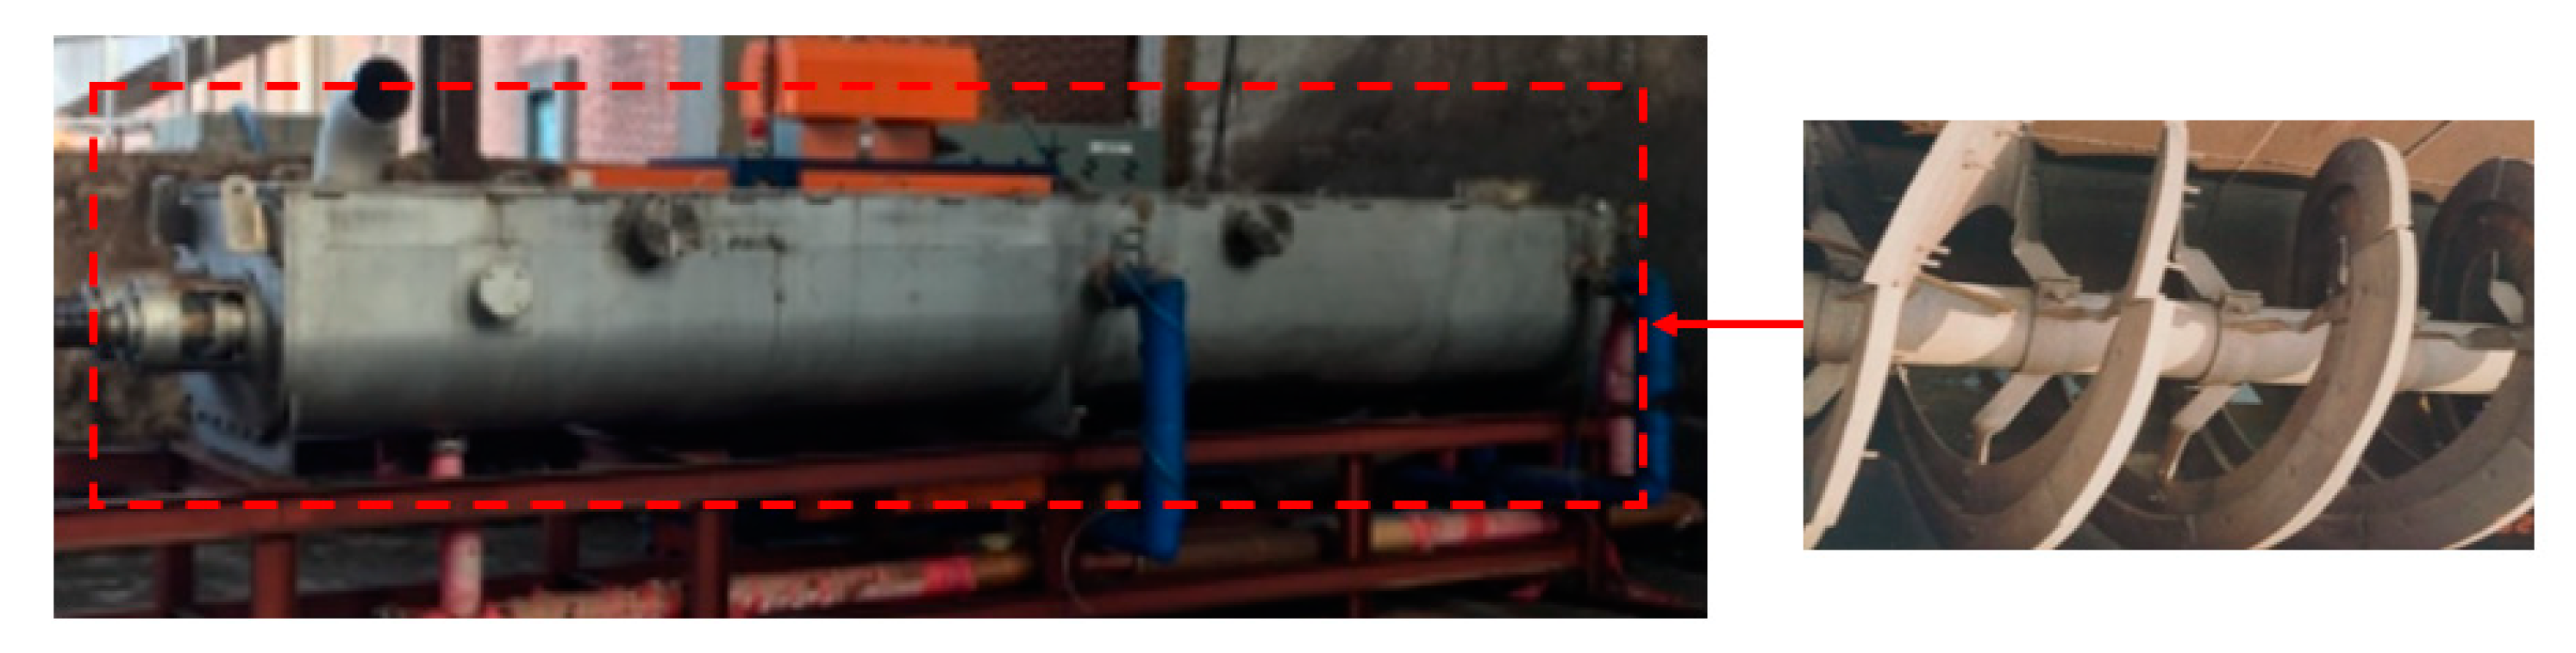
Figure 3.
Design process of dryer screw for drying of livestock manure.

Figure 4.
Structure of screw-type dryer.

Figure 5.
2D model of screw-type dryer.
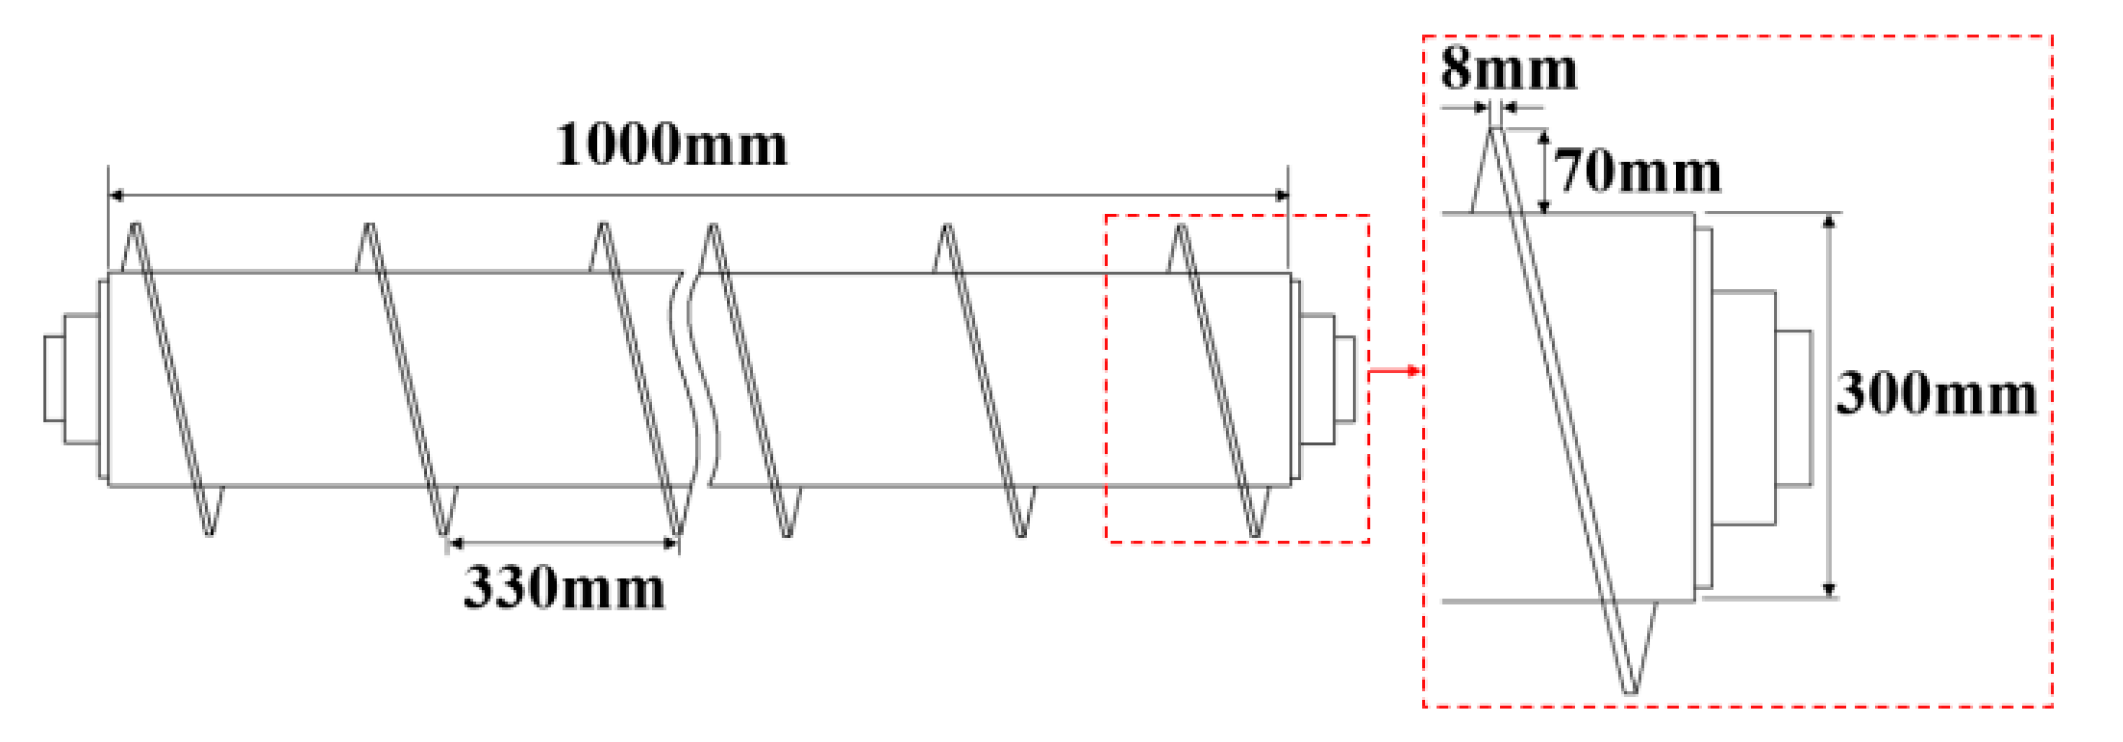
Figure 6.
1/6 partial model of screw-type dryer.
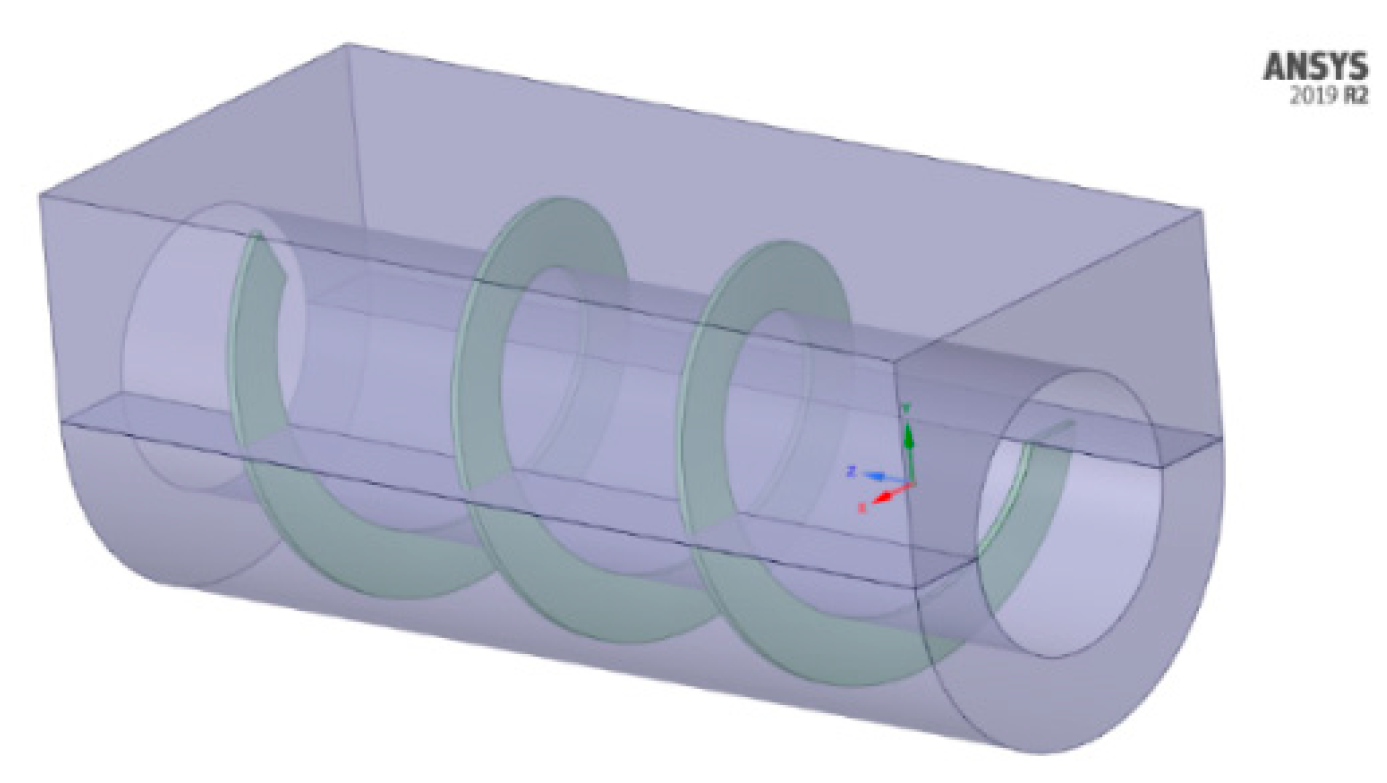
Figure 7.
Generation of mesh.
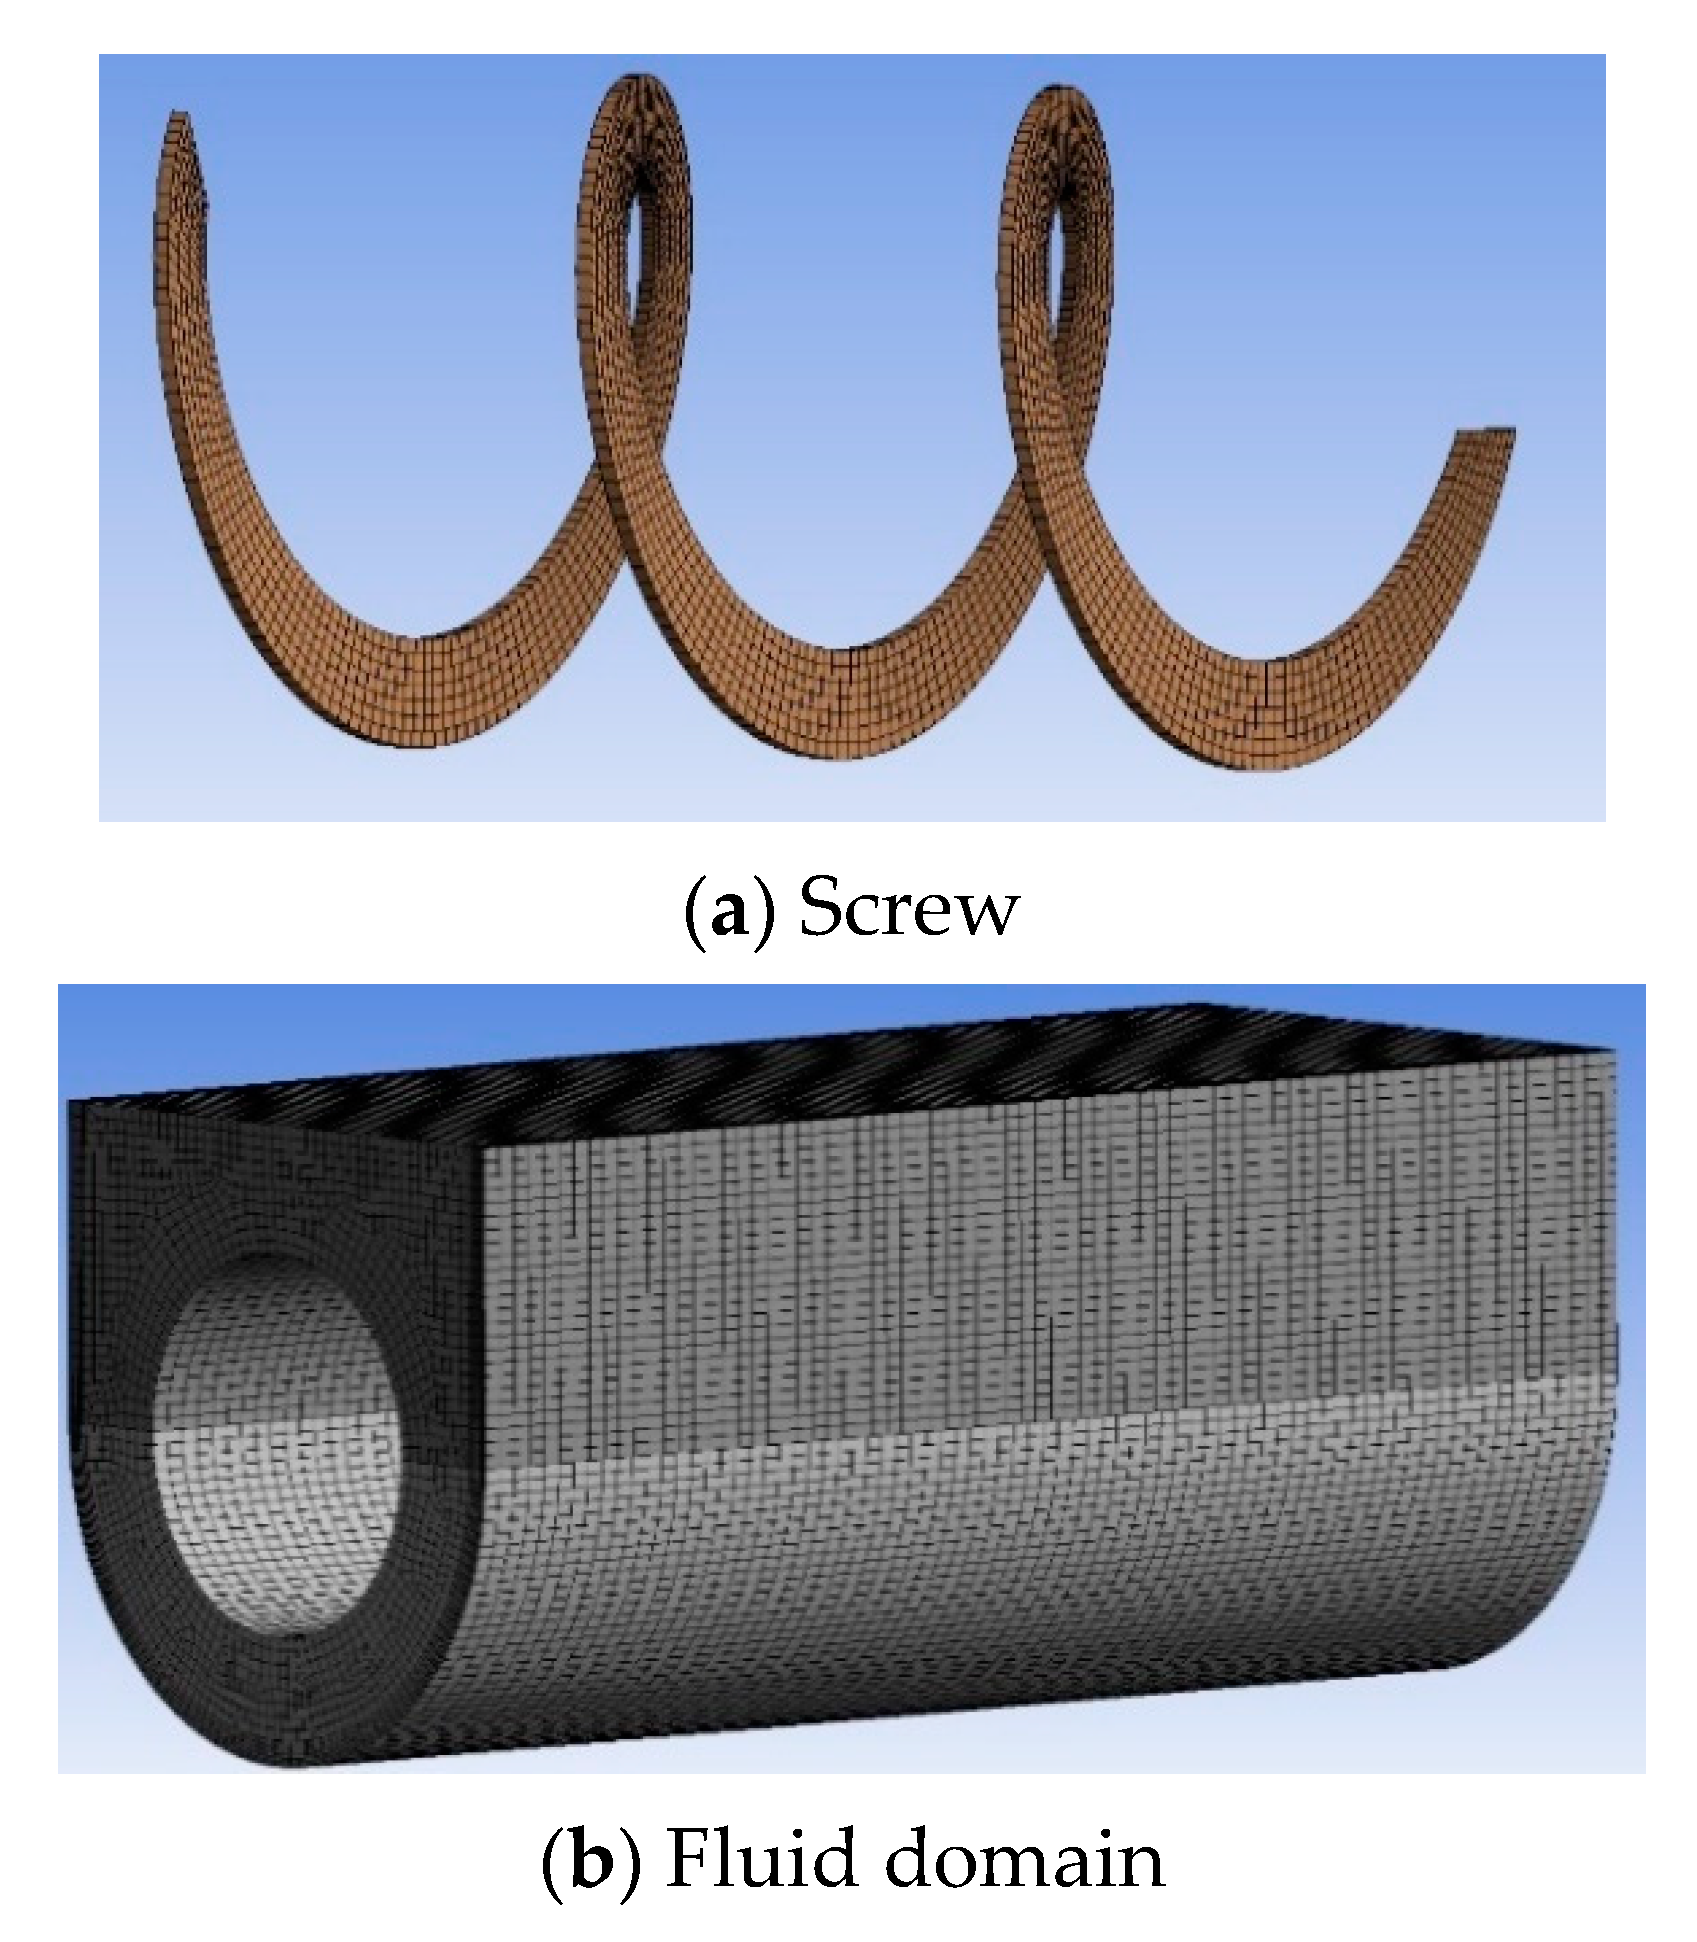
Figure 8.
Boundary condition.
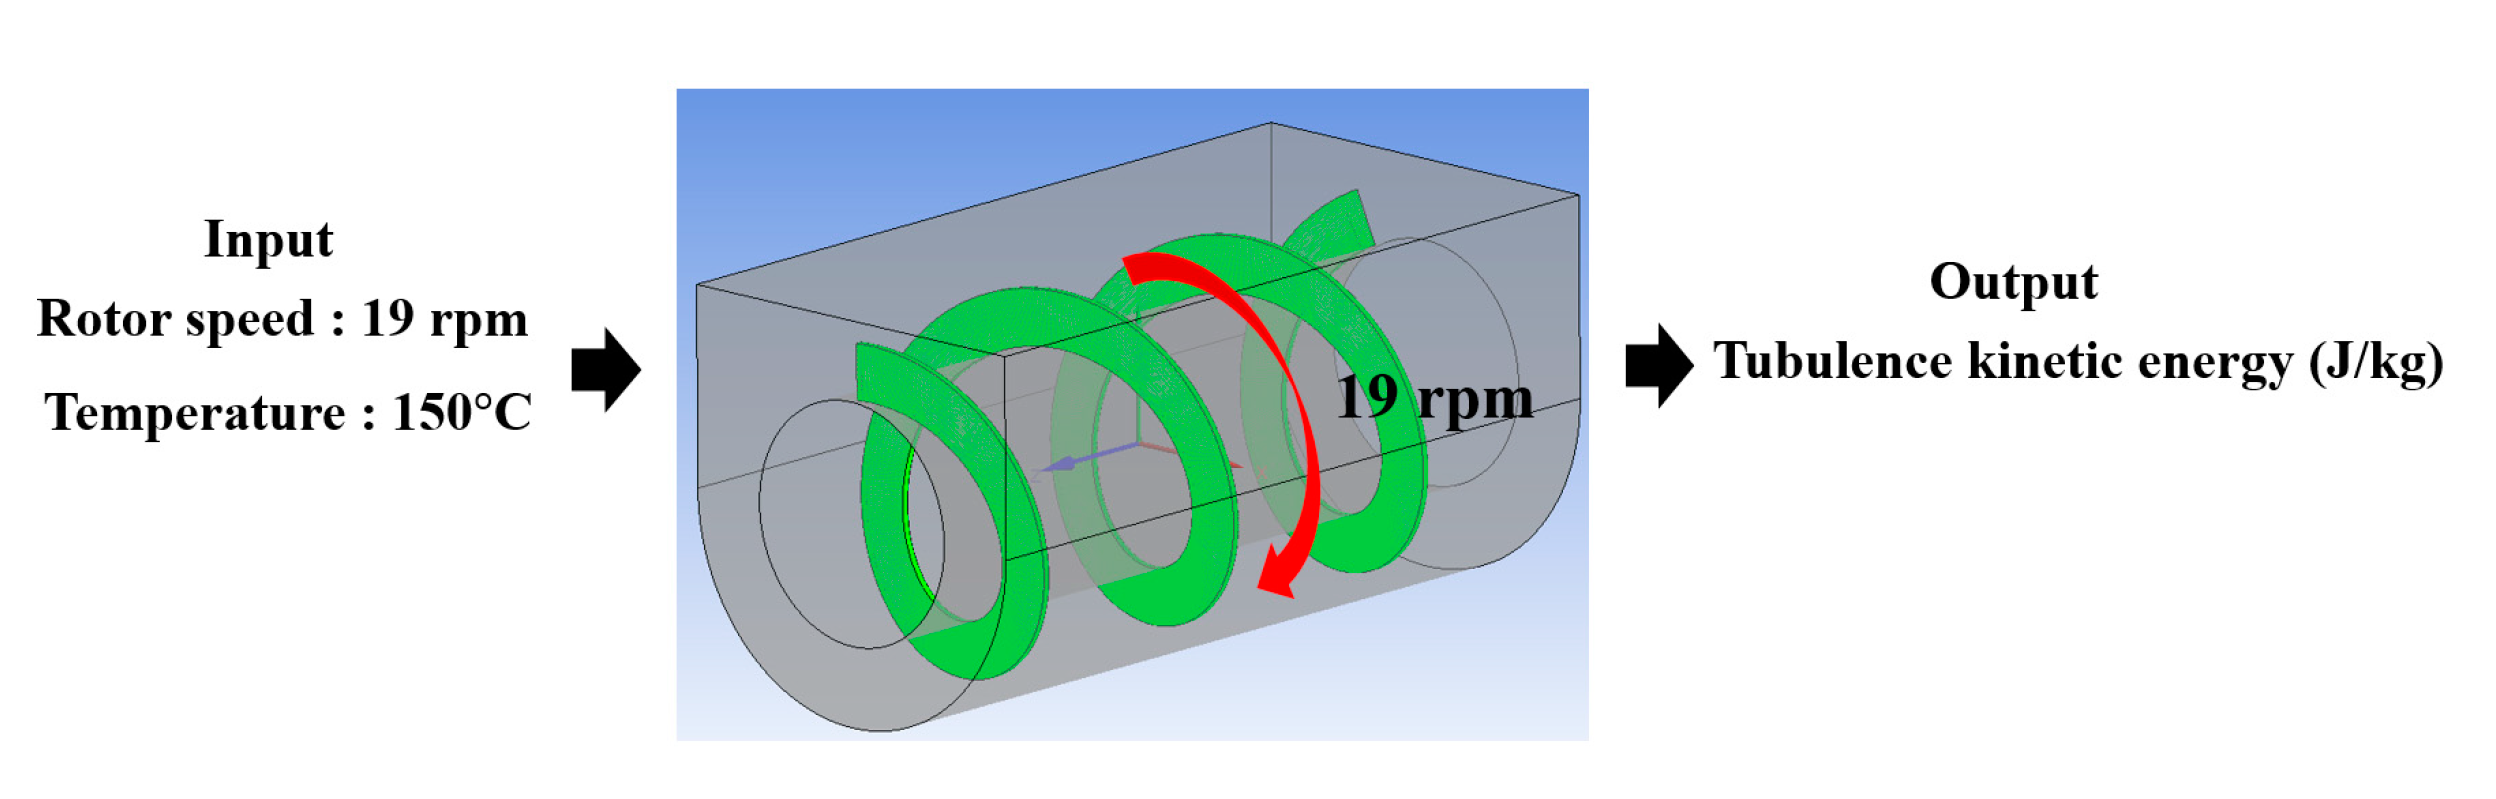
Figure 9.
Convergence test.
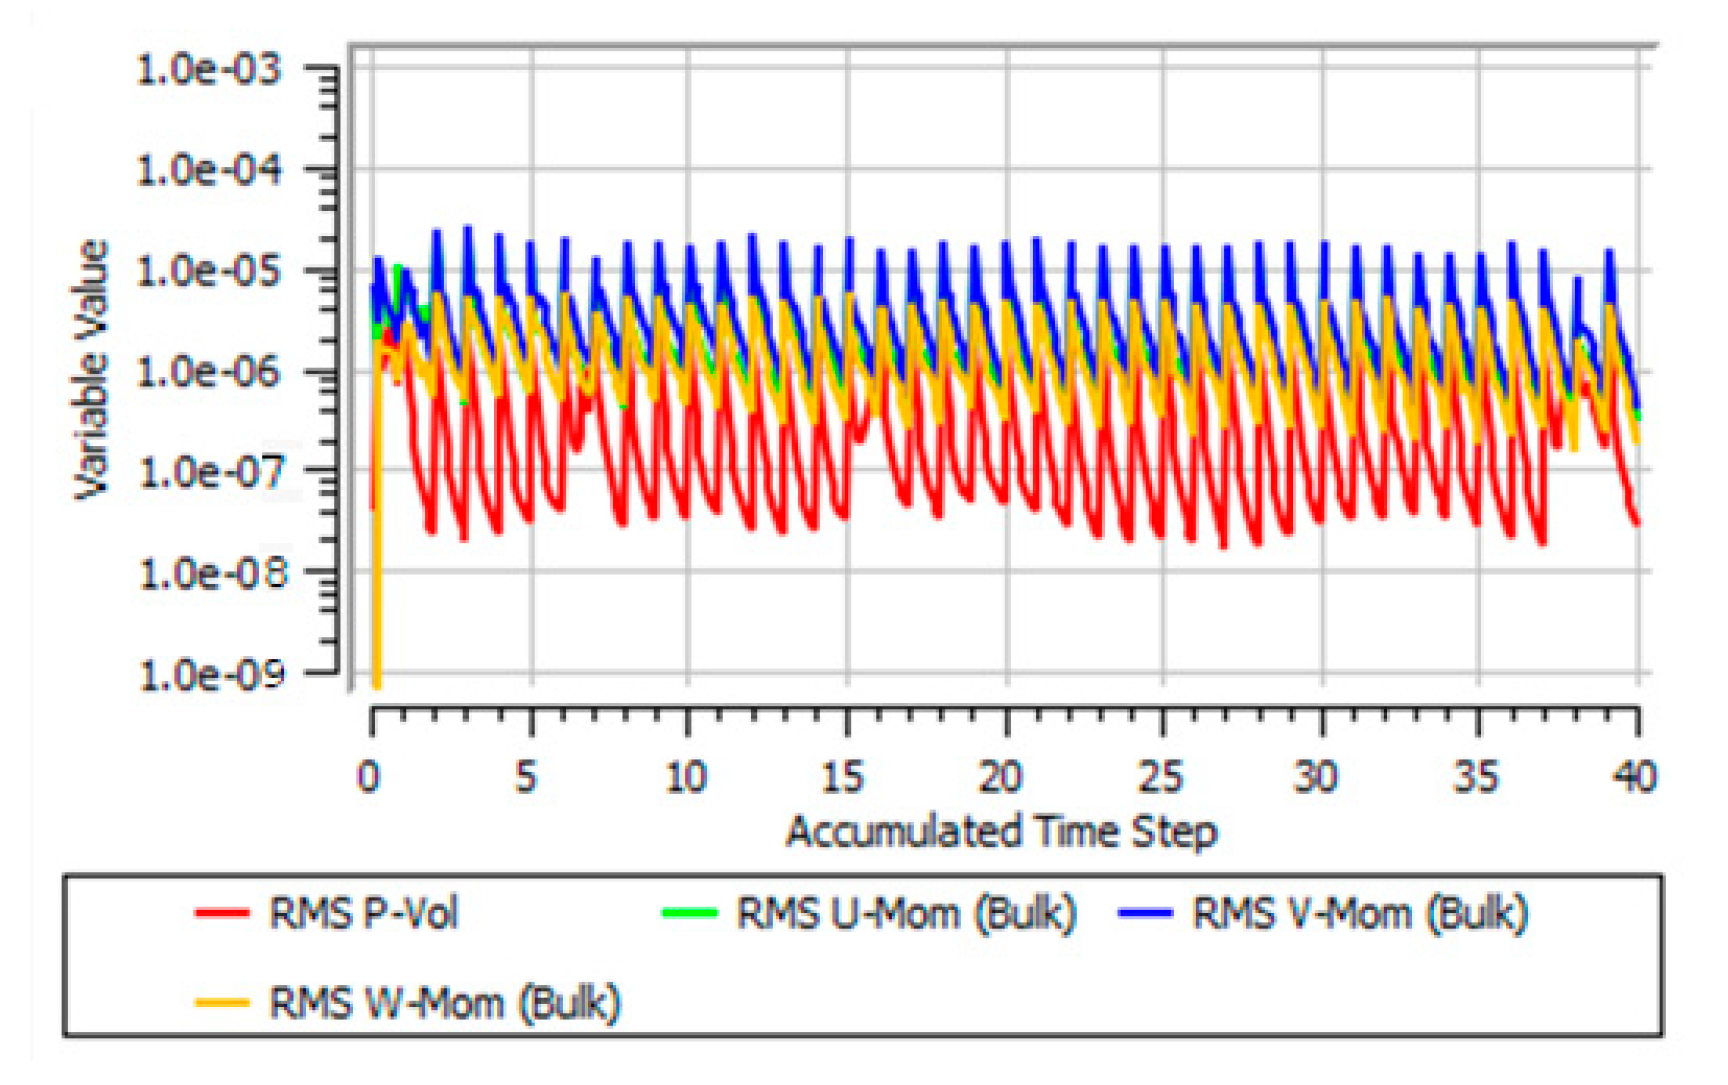
Figure 10.
1/6 partial model of dryer.

Figure 11.
Moisture content of the livestock manure dried by the screw-type dryer.

Figure 12.
Blade gaps.
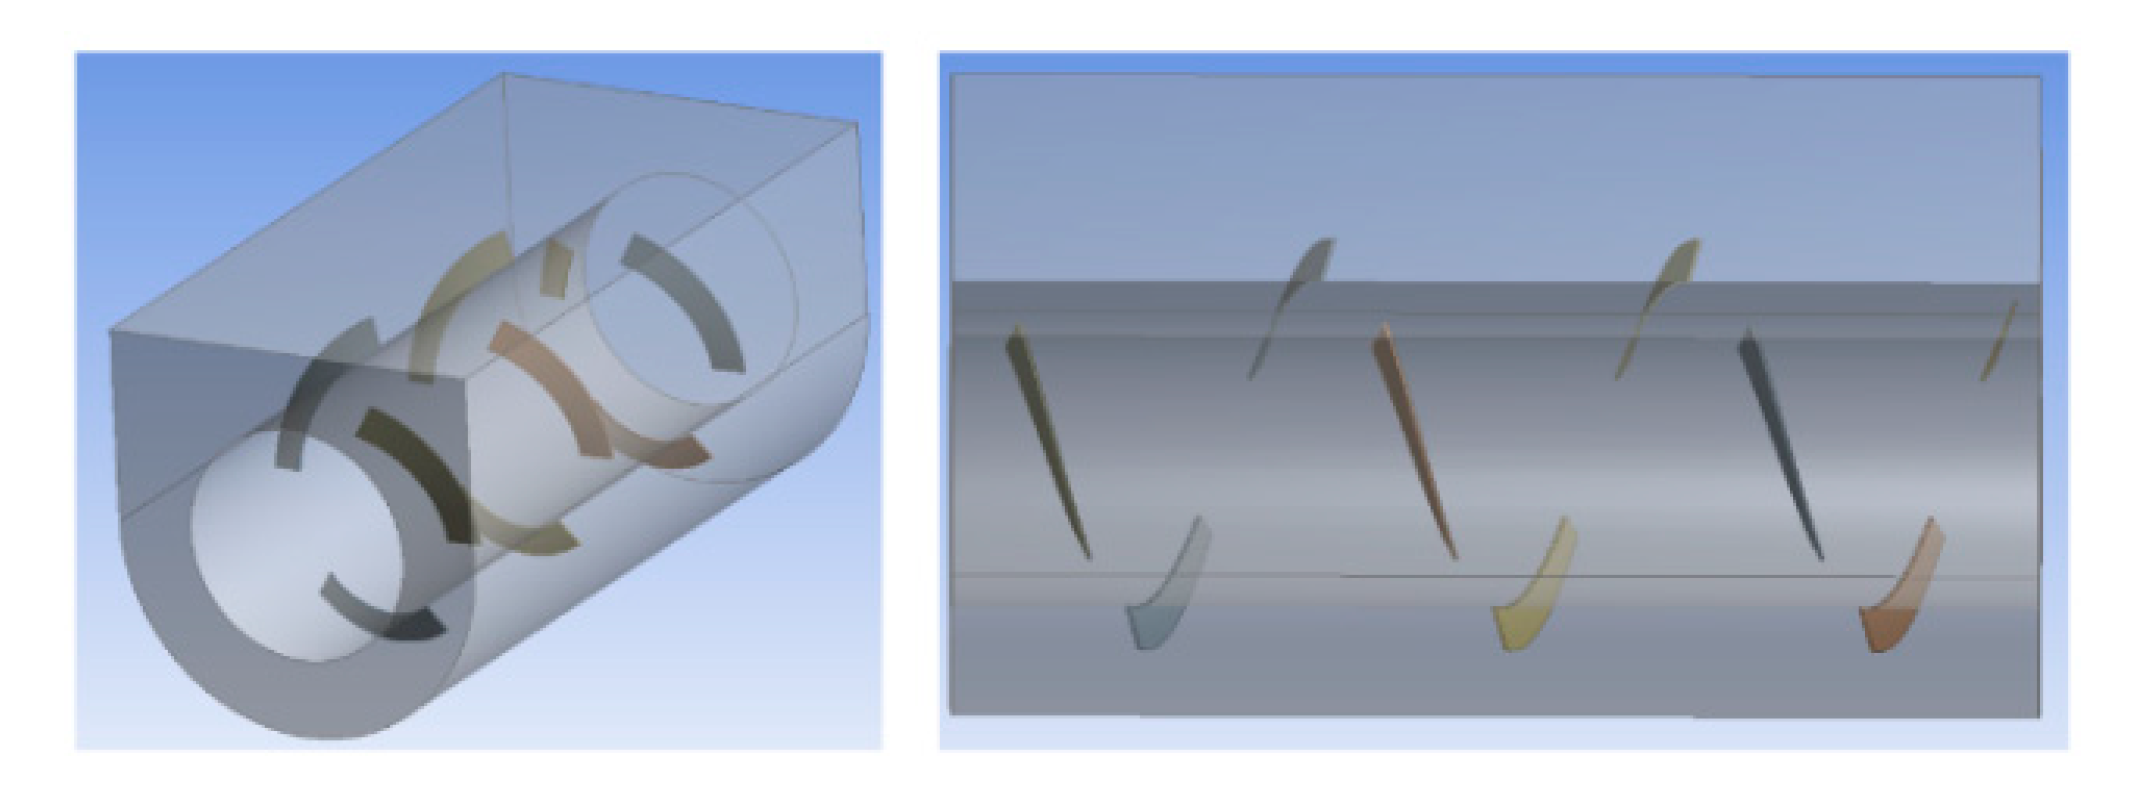
Figure 13.
Double blades.
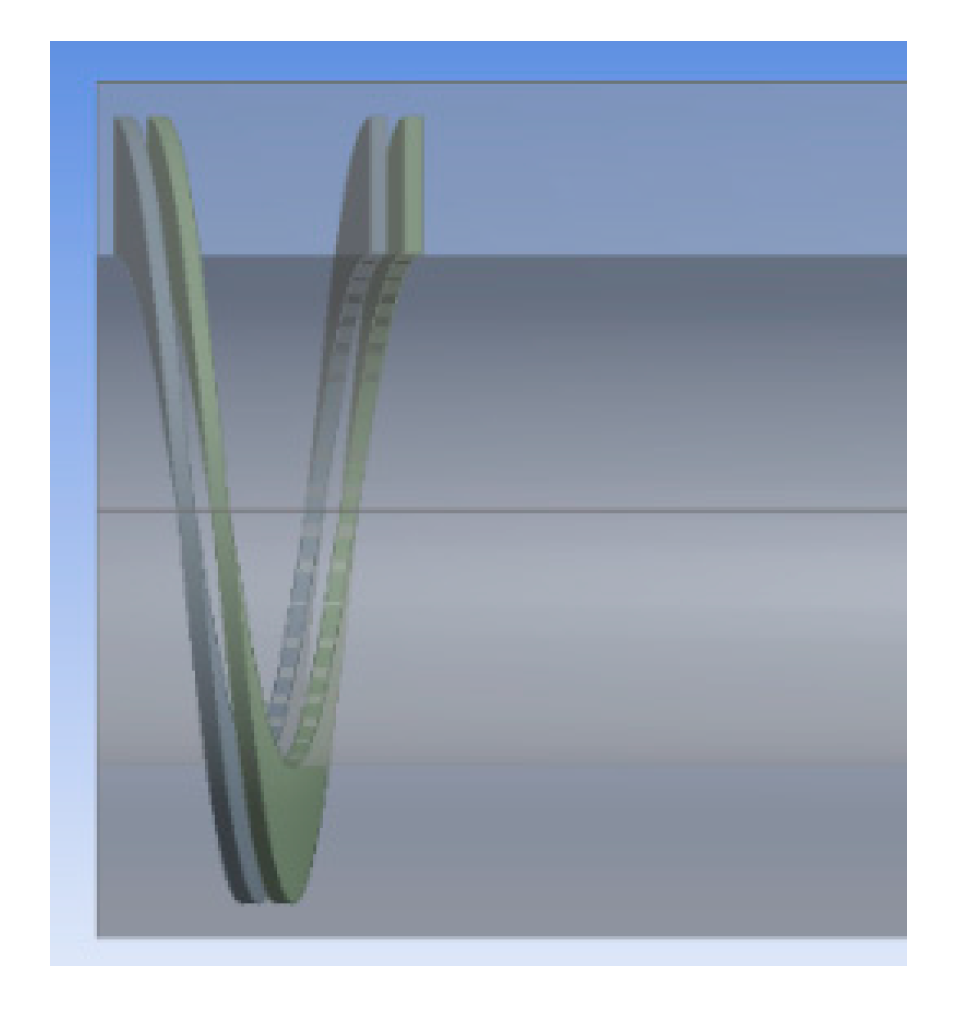
Figure 14.
Arrangement in gas of left and right blades.
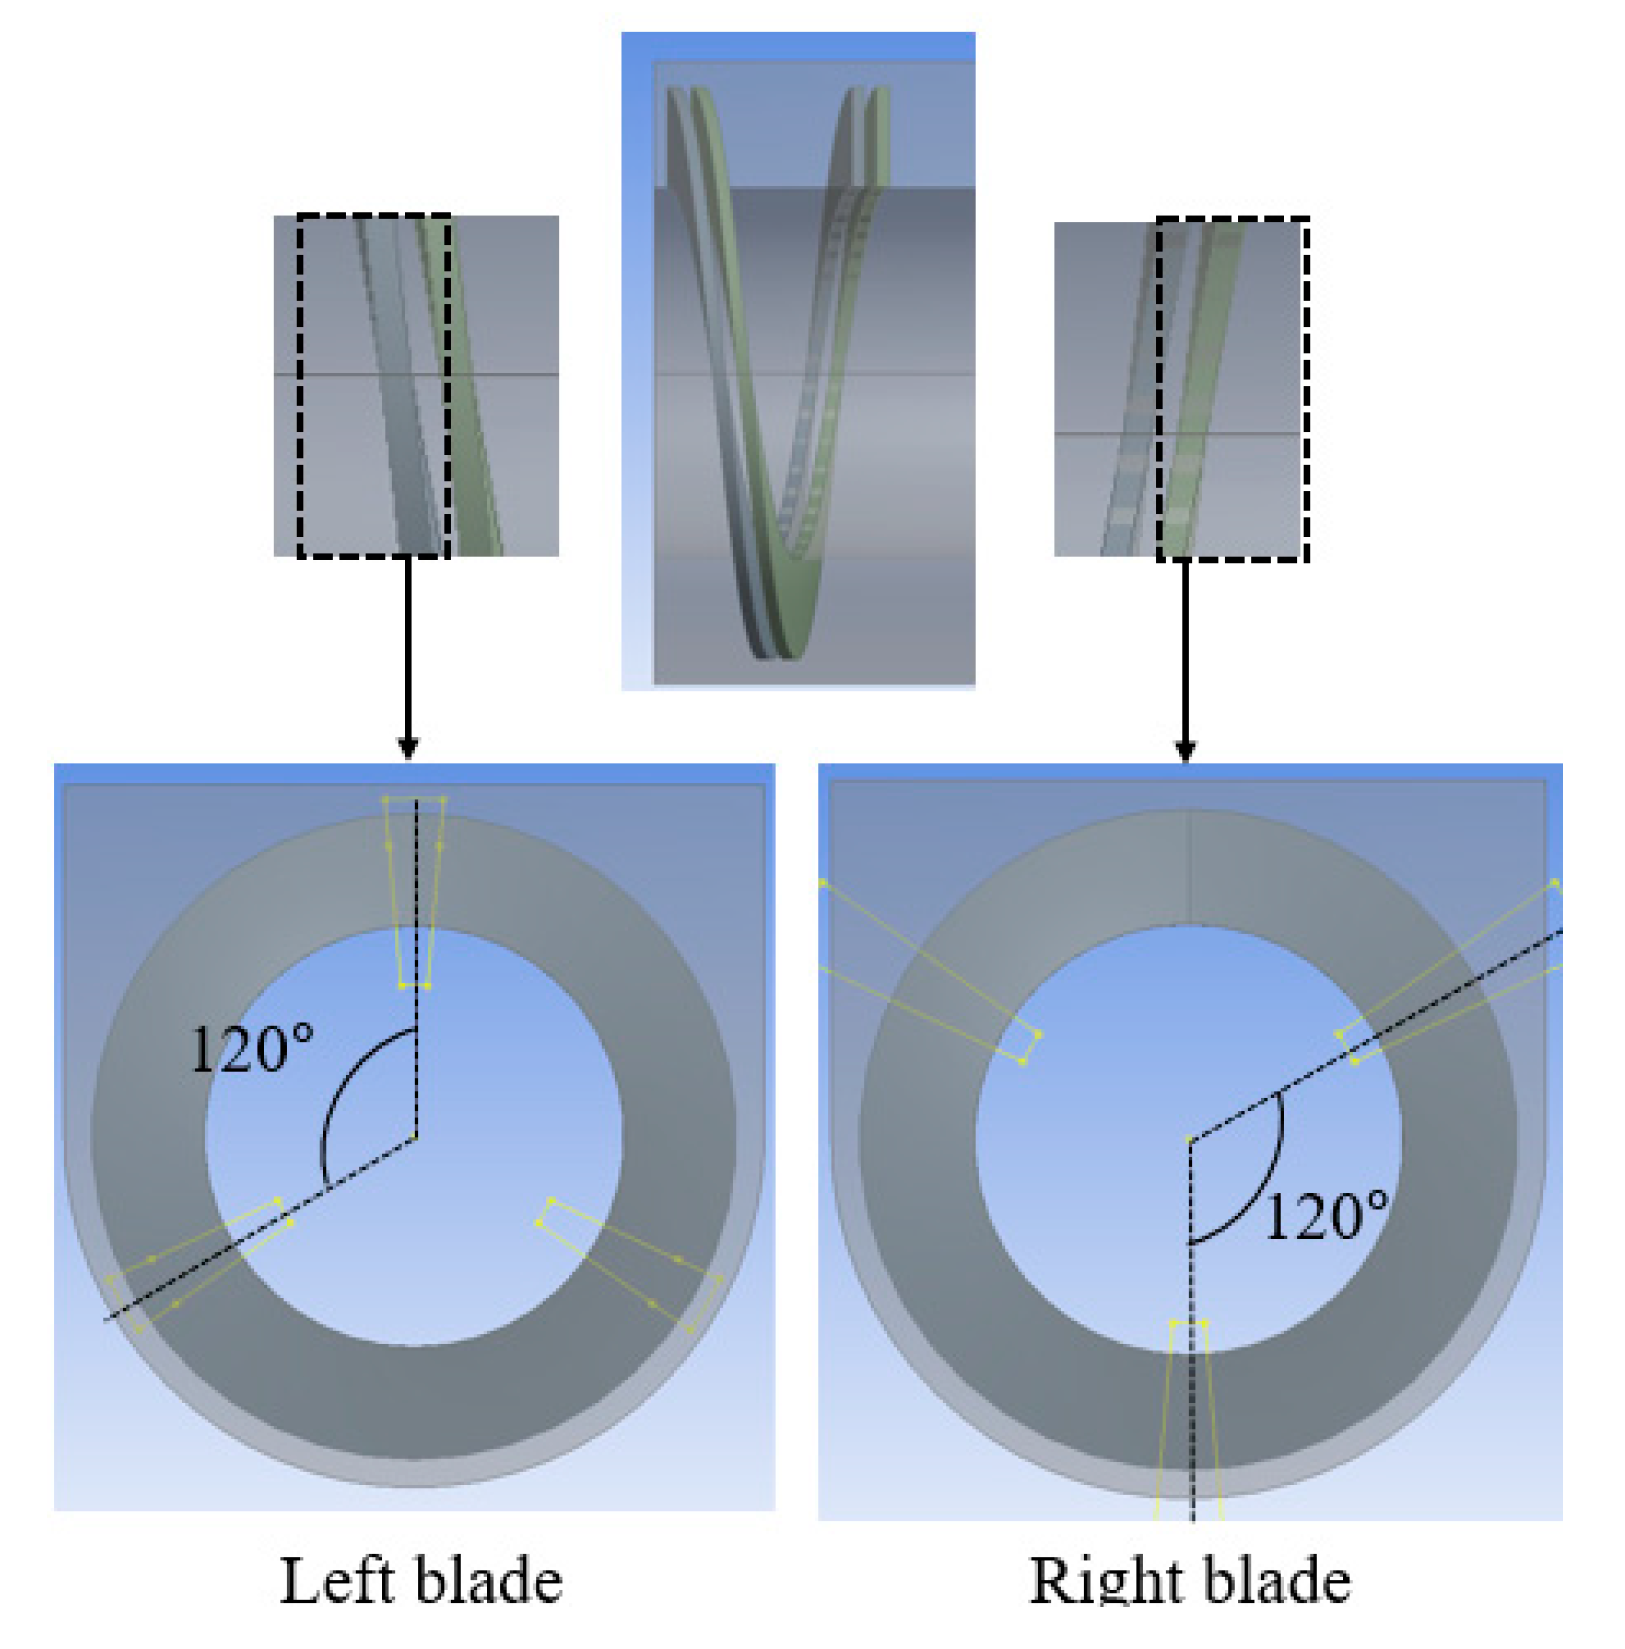
Figure 15.
3D model of double blade with gaps.

Figure 16.
Design parameters relating to blade gap.

Figure 17.
Ranges of design parameters relating to blade gap.
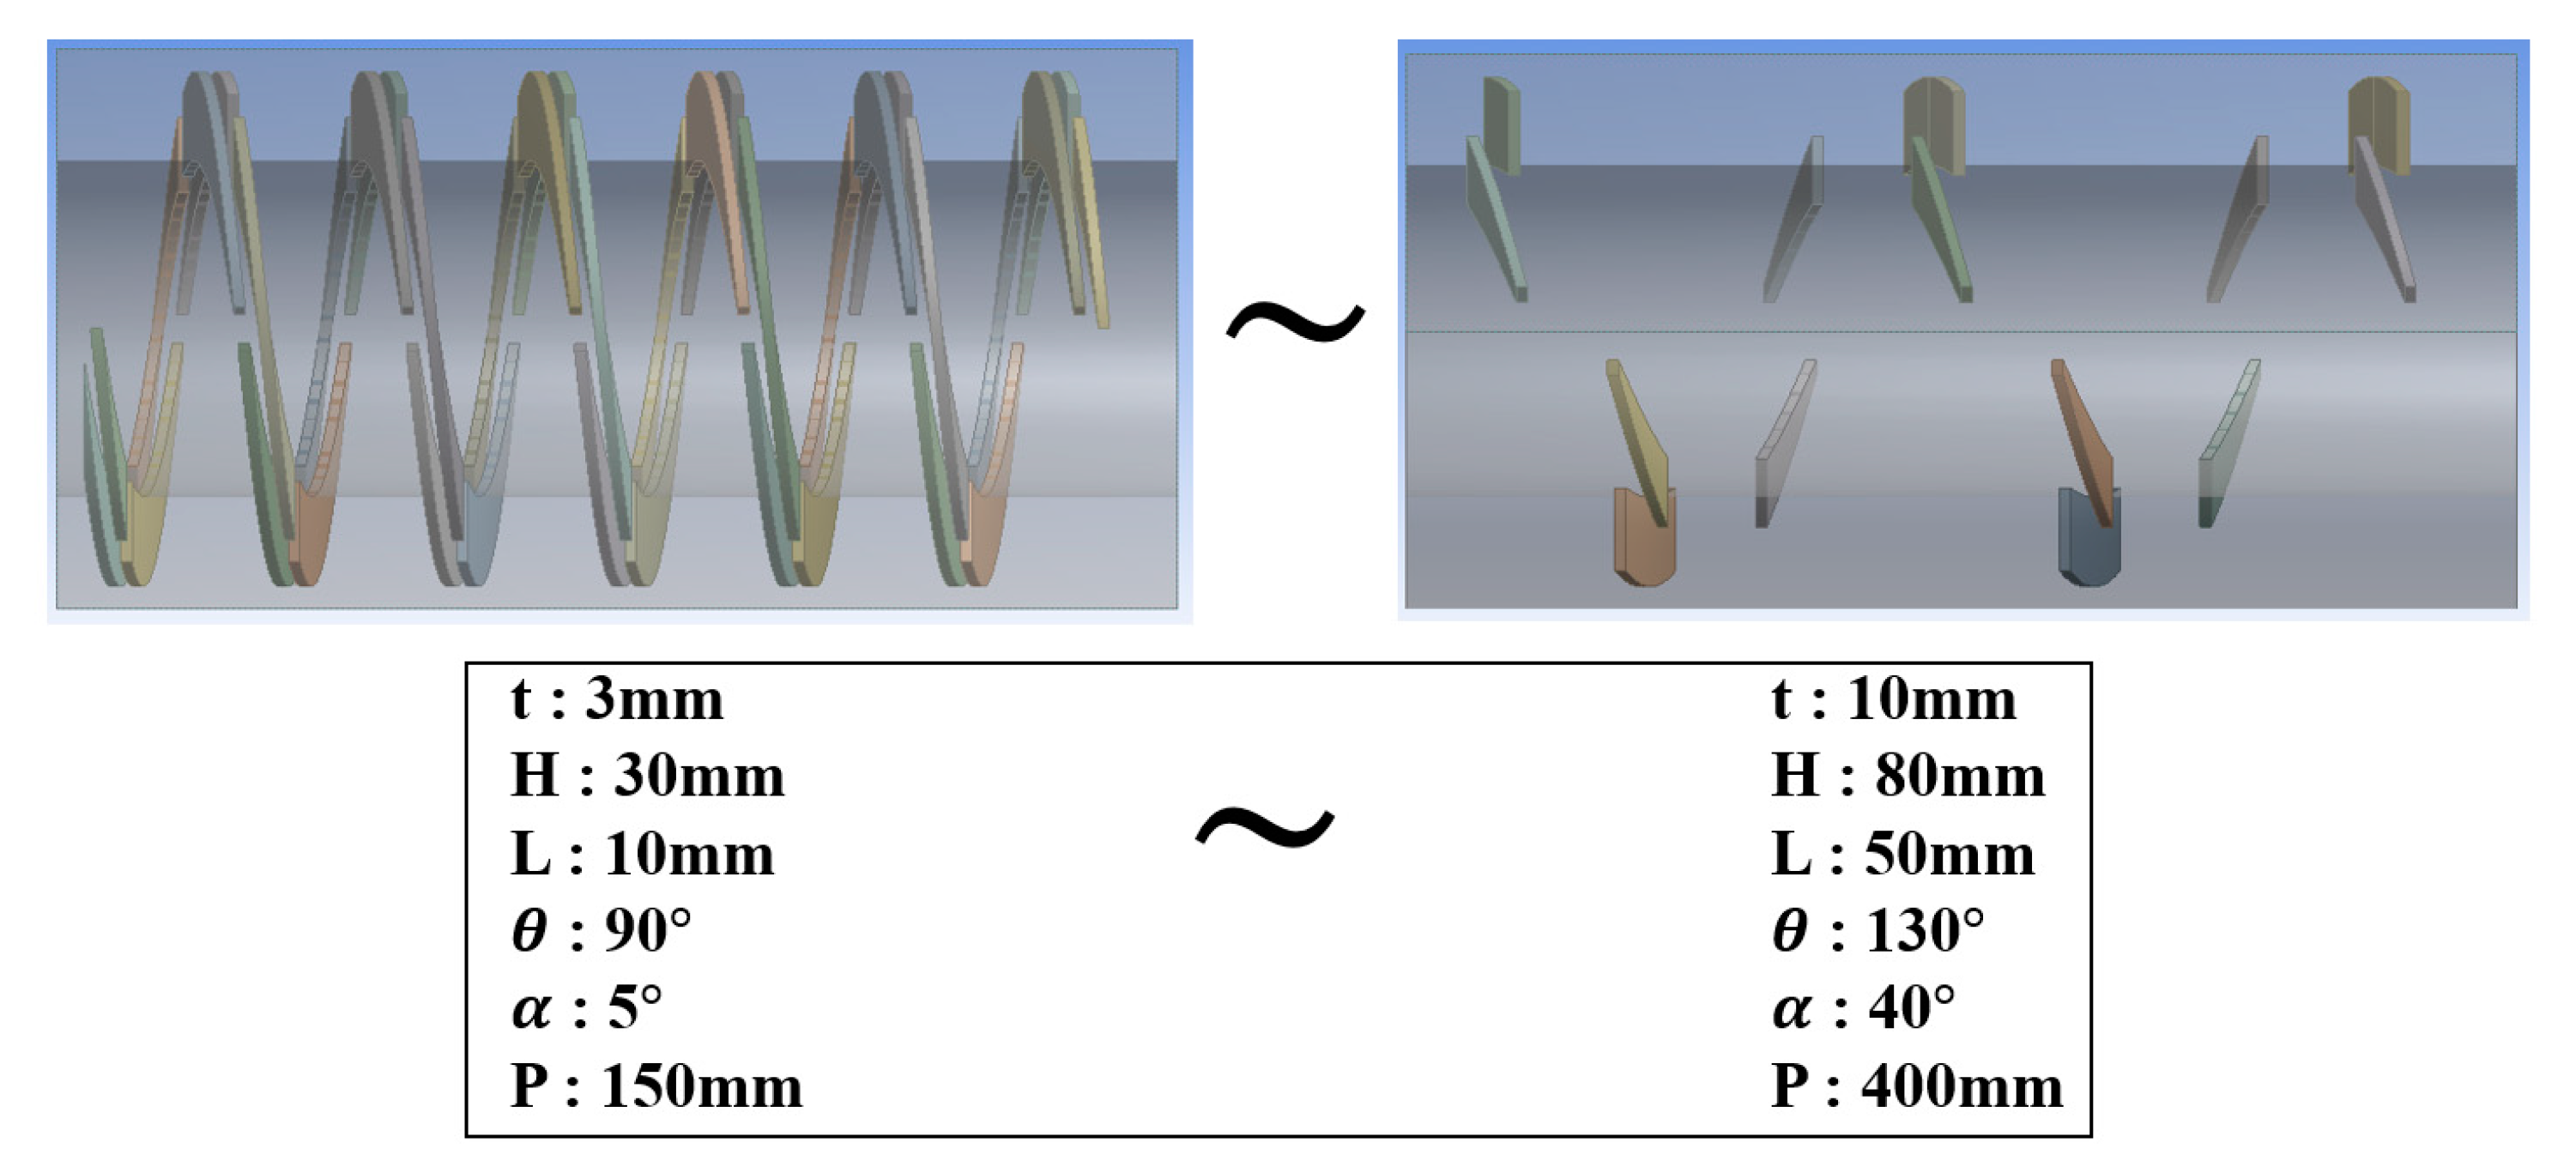
Figure 18.
Verification of candidate point recommended from response surface.
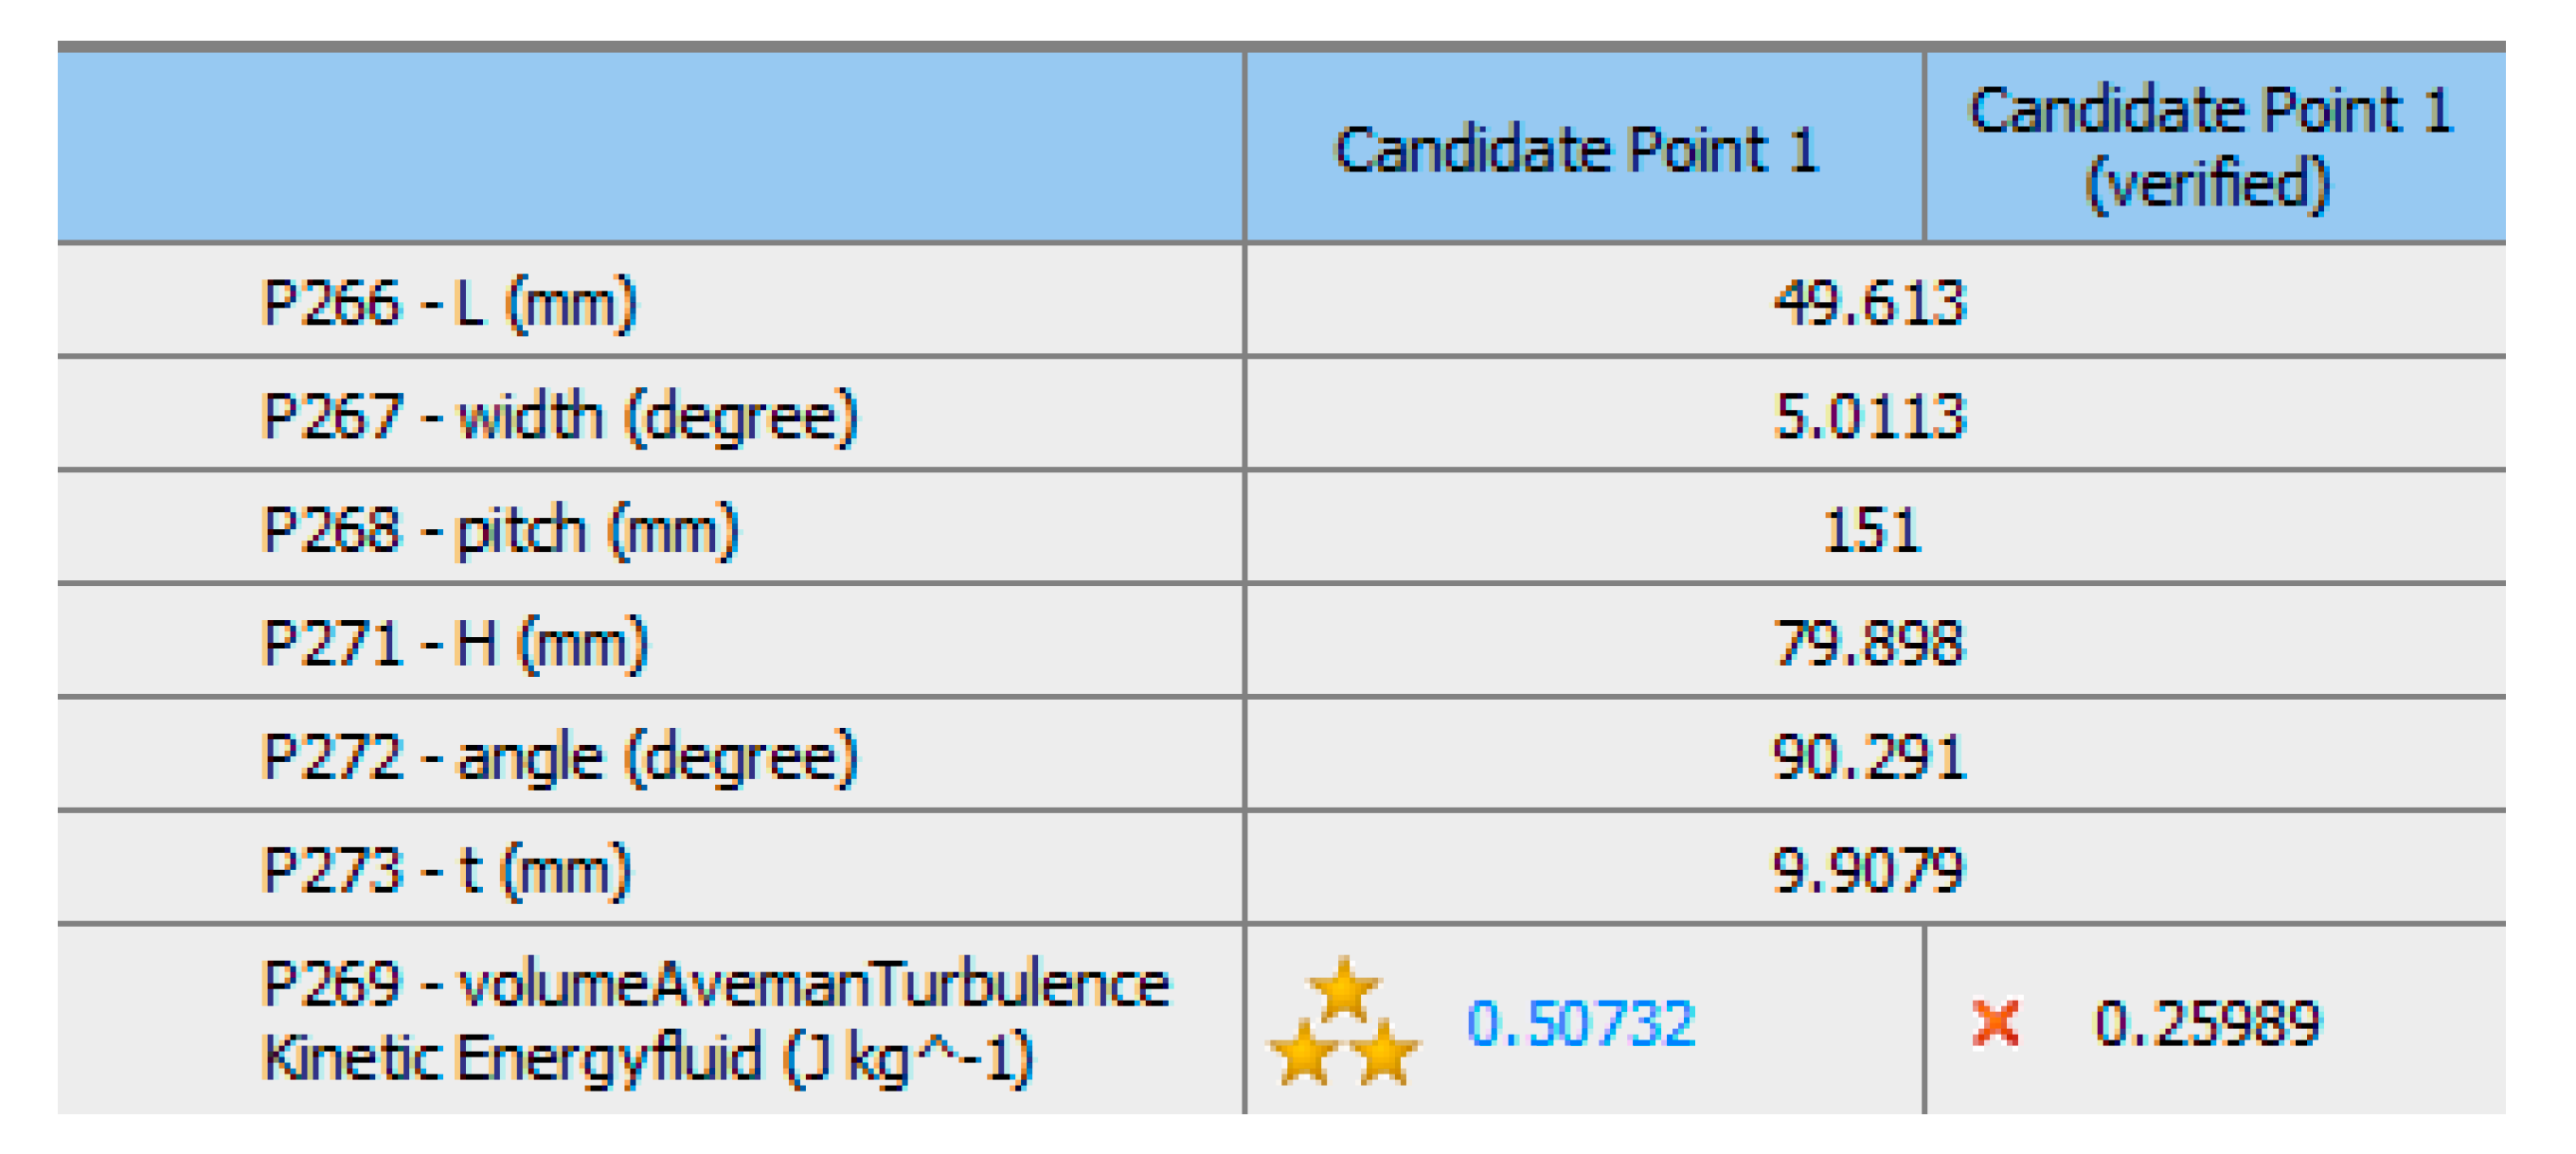
Figure 19.
Resetting for ranges of design parameters relating to blade gap.
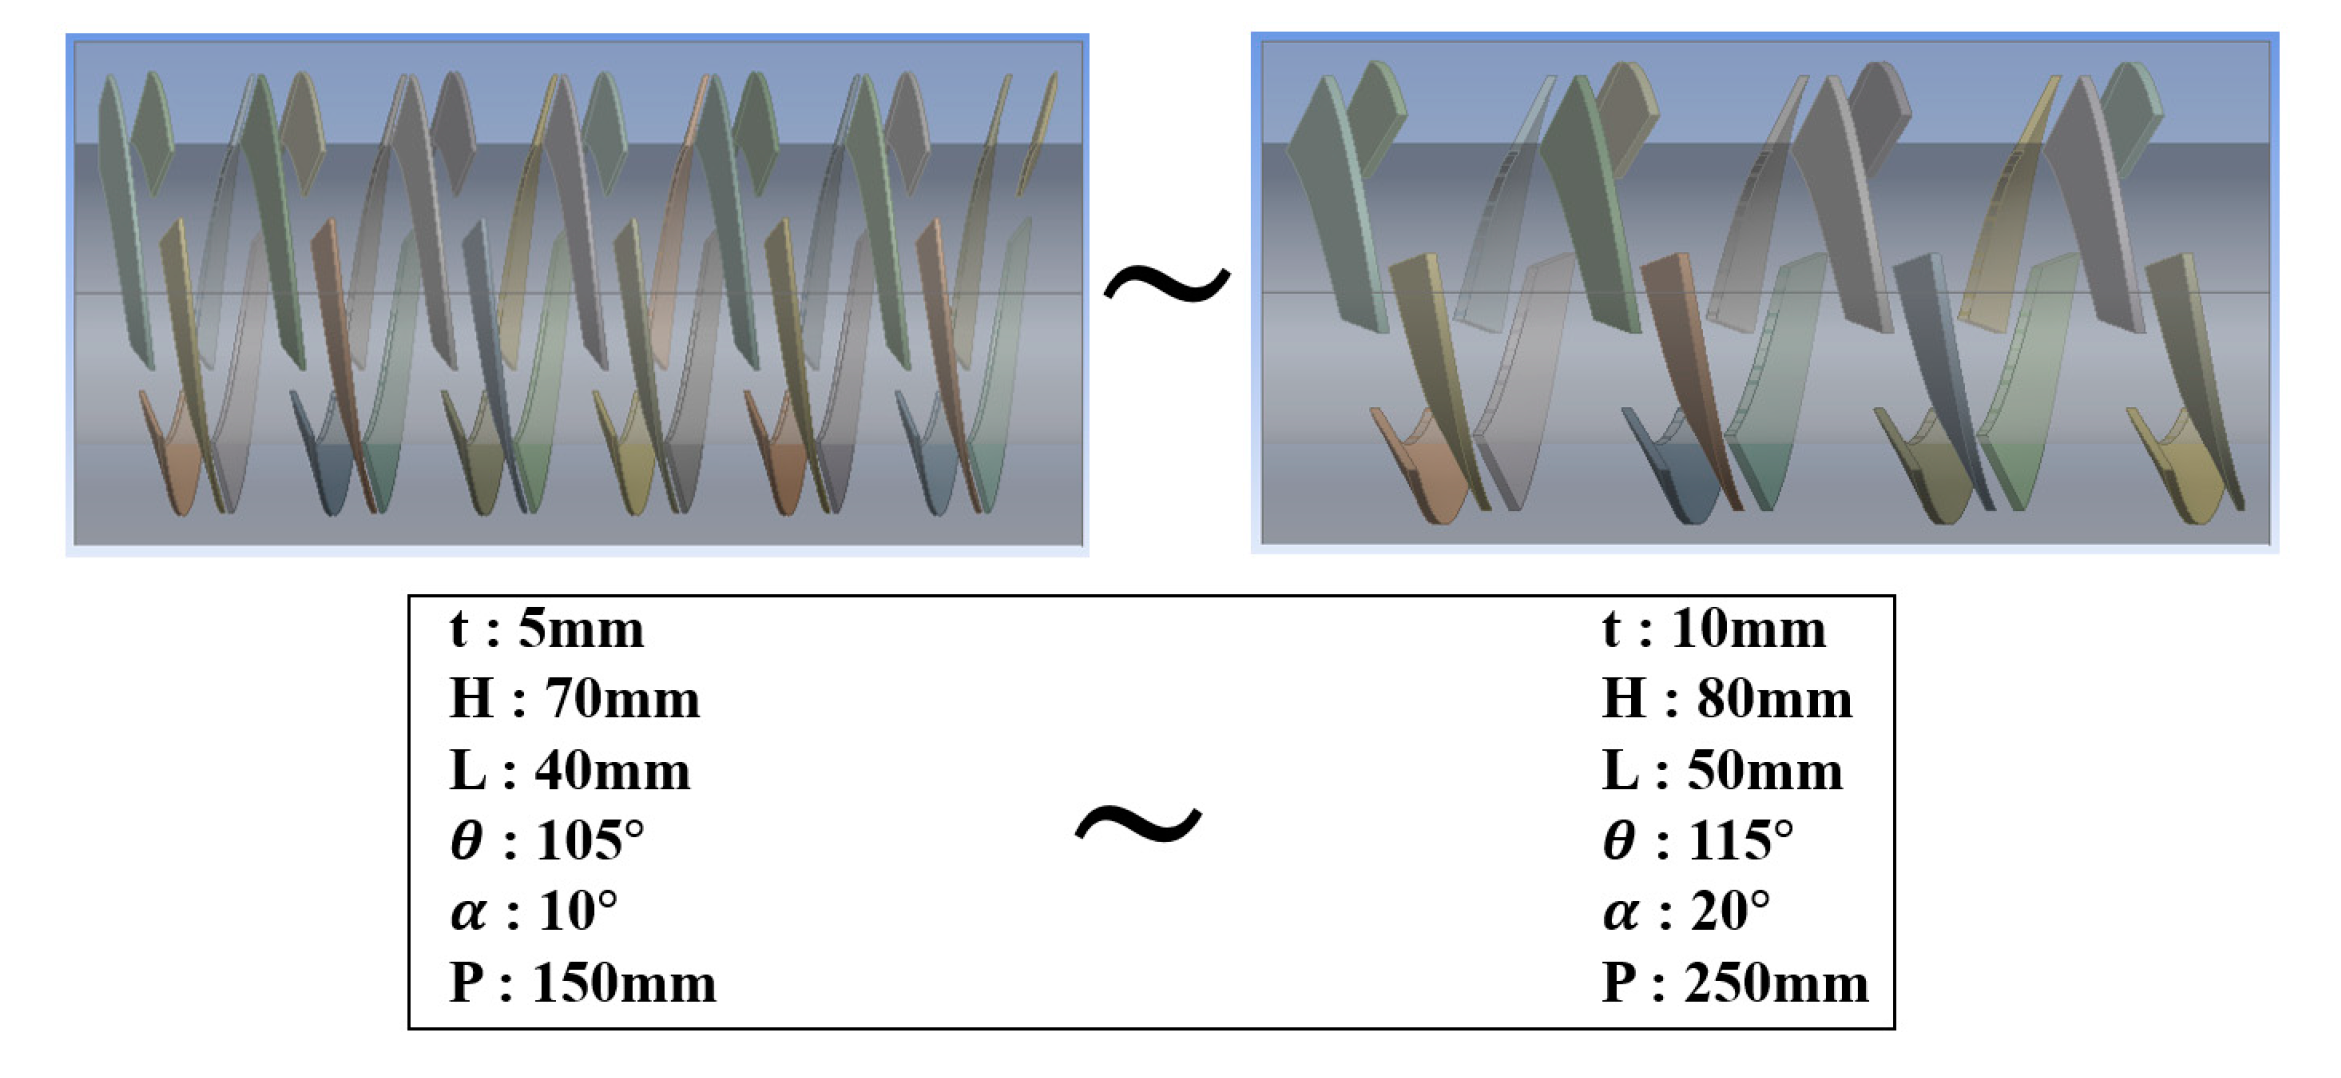
Figure 20.
Verification of response surface using goodness of fit. (a) Before range revision of design parameters. (b) After range revision of design parameters.
Figure 20.
Verification of response surface using goodness of fit. (a) Before range revision of design parameters. (b) After range revision of design parameters.
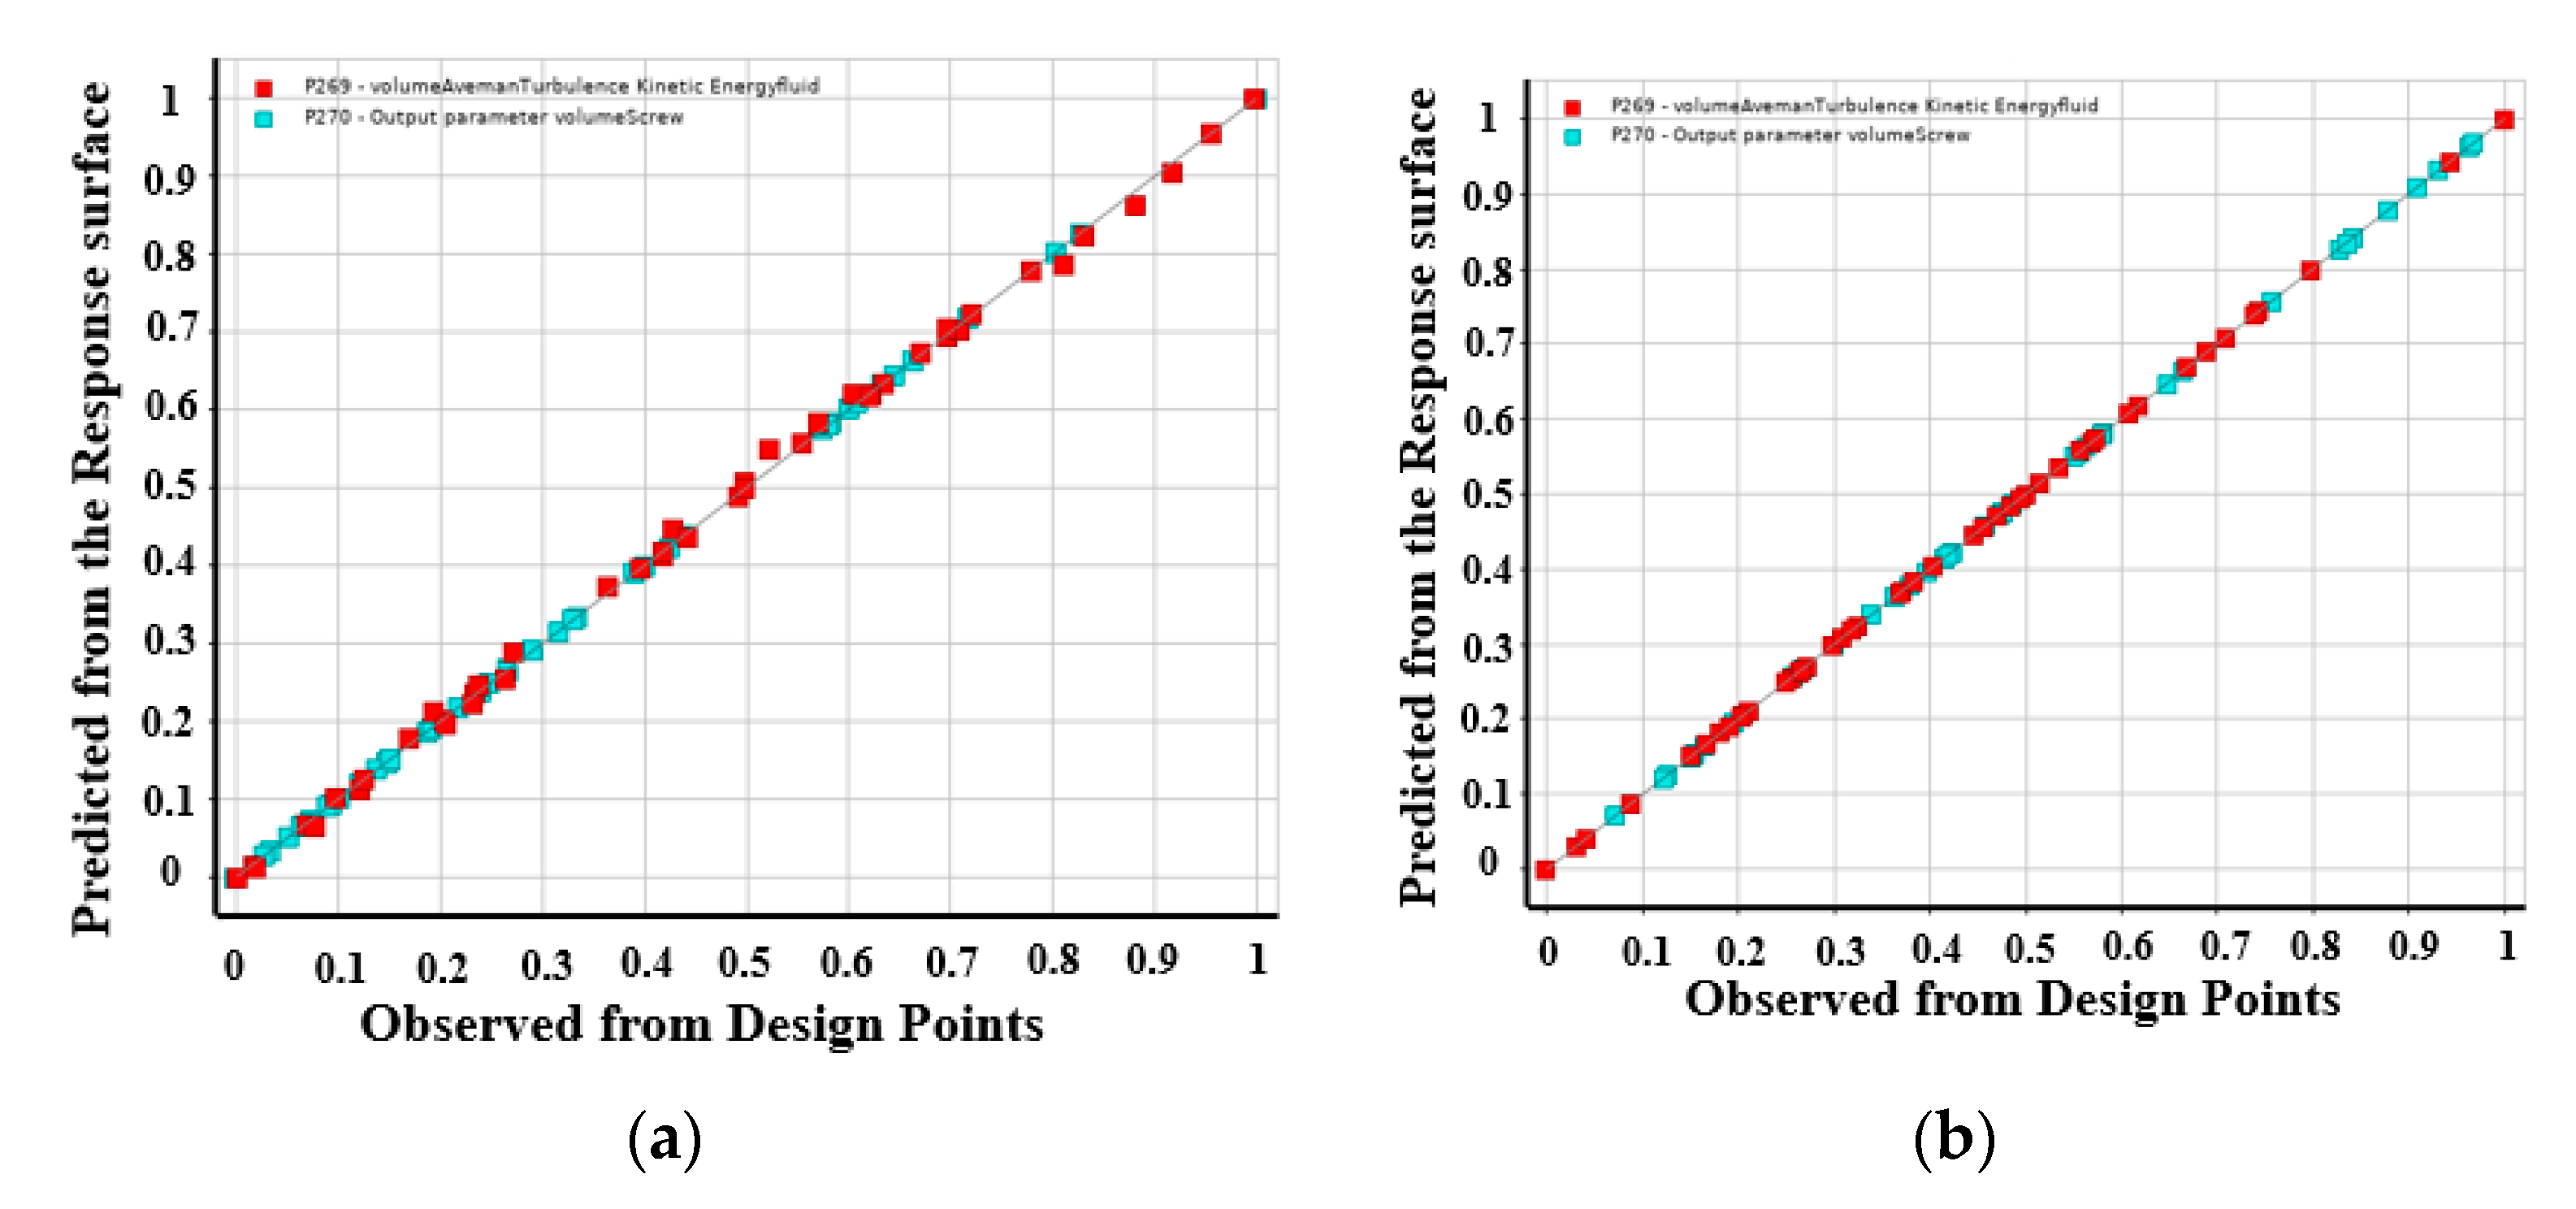
Figure 21.
Verification of candidate point recommended from response surface after resetting for range of design parameters.
Figure 21.
Verification of candidate point recommended from response surface after resetting for range of design parameters.

Table 1.
Analysis conditions.
| Rotor Speed (rpm) | 19 |
|---|---|
| Temperature (C) | 150 |
| Solver type | Transient |
| Analysis type (s) | 14.47 |
| Turbulence model | SST k– |
Table 2.
Results of turbulence kinetic energy (J/kg).
| Viscosity (Pa·s) | 0 | 2 | 4 | 6 | 8 | 10 |
|---|---|---|---|---|---|---|
| Turbulencekinetic energy (J/kg) | 0.018 | 0.15 | 0.27 | 0.38 | 0.47 | 0.56 |
Table 3.
Result of turbulence kinetic energy when viscosity is 4.5 Pa·s.
| Viscosity (Pa·s) | Turbulence Kinetic Energy (J/kg) |
|---|---|
| 4.5 | 0.299 |
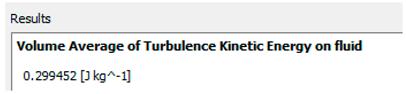 | |
Table 4.
The result obtained from response surface.
| Candidate Point Predicted from Response Surface | |||||
|---|---|---|---|---|---|
| L | P | H | t | ||
| 49.6 mm | 5 | 151 mm | 80 mm | 90 | 10 mm |
| Candidate value of turbulence kinetic energy: 0.51 J/kg Verification value of turbulence kinetic energy: 0.26 J/kg Error: 48.8% | |||||
Table 5.
The result obtained from response surface.
| Candidate Point Predicted from Response Surface | |||||
|---|---|---|---|---|---|
| L | P | H | t | ||
| 44 mm | 16.3 | 214 mm | 78 mm | 112 | 7.9 mm |
| turbulence kinetic energy: 0.39 J/kg | |||||
Table 6.
The result obtained from response surface.
| Candidate Point Predicted from Response Surface | |||||
|---|---|---|---|---|---|
| L | P | H | t | ||
| 42.7 mm | 16 | 153 mm | 79 mm | 105 | 5.9 mm |
| Candidate value of turbulence kinetic energy: 0.45 J/kg Verification value of turbulence kinetic energy: 0.46 J/kg Error: 2.2% | |||||
Table 7.
The result obtained from response surface.
| Existing Model | New Model |
|---|---|
 |  |
| 0.299 J/kg | 0.46 J/kg |
Publisher’s Note: MDPI stays neutral with regard to jurisdictional claims in published maps and institutional affiliations. |
© 2022 by the authors. Licensee MDPI, Basel, Switzerland. This article is an open access article distributed under the terms and conditions of the Creative Commons Attribution (CC BY) license (https://creativecommons.org/licenses/by/4.0/).
Share and Cite
MDPI and ACS Style
Park, G.; Eom, T.; Kwak, H.; Kim, C. Optimization of Screw Mixer to Improve Drying Performance of Livestock Manure Dryer Using CFD Analysis. Appl. Sci. 2022, 12, 2872. https://doi.org/10.3390/app12062872
AMA Style
Park G, Eom T, Kwak H, Kim C. Optimization of Screw Mixer to Improve Drying Performance of Livestock Manure Dryer Using CFD Analysis. Applied Sciences. 2022; 12(6):2872. https://doi.org/10.3390/app12062872
Chicago/Turabian StylePark, Gunyoung, Taejin Eom, Hyoseo Kwak, and Chul Kim. 2022. "Optimization of Screw Mixer to Improve Drying Performance of Livestock Manure Dryer Using CFD Analysis" Applied Sciences 12, no. 6: 2872. https://doi.org/10.3390/app12062872
Note that from the first issue of 2016, this journal uses article numbers instead of page numbers. See further details here.