
Thermophilic Dark Fermentation of Olive Mill Wastewater in Batch Reactors: Effect of pH and Organic Loading


1
Department of Chemical Engineering, University of Patras, 1 Karatheodori Str., University Campus, 26504 Patras, Greece
2
Department of Management, Economics and Industrial Engineering, Politecnico di Milano, Via Lambruschini 4/b, 20156 Milan, Italy
*
Author to whom correspondence should be addressed.
Appl. Sci. 2022, 12(6), 2881; https://doi.org/10.3390/app12062881
Submission received: 20 January 2022
/
Revised: 28 February 2022
/
Accepted: 4 March 2022
/
Published: 11 March 2022
(This article belongs to the Special Issue Innovative Technologies for Energy/Resource Recovery from Biomass Wastes)
Abstract
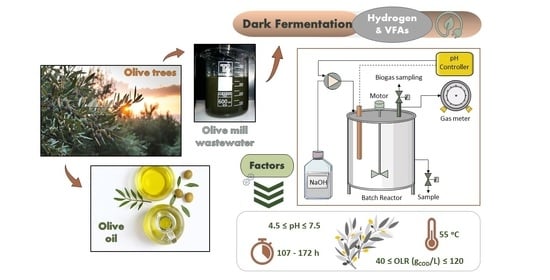
:In recent decades, olive oil consumption has almost tripled worldwide. Olive oil production is linked with the production of enormous amounts of olive mill wastewater, the main by-product derived from three-phase olive mills. Due to the environmental risks of olive mill wastewater disposal, the management and valorization of the specific waste stream is of great importance. This work focuses on the thermophilic dark fermentation of olive mill wastewater in batch reactors, targeting pH optimization and the organic loading effect. A series of experiments were performed, during which the organic load of the substrate remained at 40 g/L after dilution with tap water, and the pH was tested in the range of 4.5 to 7.5. The maximum yield in terms of produced hydrogen was obtained at pH 6.0, and the yields were 0.7 mol H2/mol glucose or 0.5 L H2/Lreactor. At the same conditions, a reduction of 62% of the waste’s phenols was achieved. However, concerning the effect of organic loading at the optimized pH value (6.0), a further increase in the organic load minimized the hydrogen production, and the overall process was strongly inhibited.
1. Introduction
According to the International Olive Council and official data, global olive oil production ranged between 3.13 and 3.28 million metric tons from 2017/2018 to 2020/2021, and it is known that, in the last 60 years, olive oil production has tripled worldwide. Indicatively, 95% of global olive oil is produced in the Mediterranean, mainly by Spain, Italy, Greece, and Portugal, and other countries such as Tunisia, Turkey, Morocco, and Algeria have also stood out [1,2].
Greece ranks third in olive oil production, cultivating olive oil trees on almost 60% of the country’s arable land [3] (mostly on the areas of Peloponnese, Crete, Aegean, and Ionian Islands). Additionally, Greece holds first place in black olive production, and the largest variety of oils (compared to any other country) is cultivated in Greece. An average rate of 12% of European olive oil is produced by Greece [4], 80% of which is extra virgin [5]. According to Aravani et al. [6], almost 46% of the total agro-industrial residues in the country come from olive processing, and more specifically, from the olive mills as solid (two-phase olive oil decanters) or liquid (three-phase olive oil decanters) waste due to olive oil extraction. As Greece’s main extraction system is still the one with the three-phase decanter, at an average rate of 82%, huge amounts of liquid wastes or olive mill wastewater (OMW) are generated annually, during the period of October to February [7].
Among the hazardous industrial effluents, OMW has been indicated as one of them, mostly due to its high chemical and biological oxygen demand (COD, BOD) [7]. Such values could range from 40 to 220 g COD/L and from 35 to 110 g BOD/L, respectively, as mentioned by Koutsos et al. [8]. Additionally, a high concentration of phenolic compounds such as oleuropein, tyrosol, hydroxytyrosol, syringic acid, p-coumaric acid, and 4-hydroxybenzoic acid (usually up to 7.5 g/L) is involved, and the pH value ranges from 3 to 6 [9,10]. Due to their physicochemical characteristics and seasonal production, OMW can cause various environmental issues, such as surface, groundwater, and soil pollution due to the high amounts of organic compounds (including phenolics and lipids) and inorganic constituents such as potassium [11]. Consequently, all olive oil producing countries are confronting the aforementioned environmental issues due to the lack of effective, practical, and affordable solutions for OMW management, as the main option is still at their disposal (usually in big lagoons or storage ponds) [10,11].
From a valorization/treatment point of view, several methods, including biological, physicochemical, and advanced oxidation solutions, have been widely proposed, as can be seen also in Table 1. Among these, biological processes mainly target anaerobic digestion under both mesophilic and thermophilic conditions, aerobic processes, and compost production. According to the literature, some pretreatment methods are usually implemented prior to the biological processes’ applications in order to enhance efficiency and thus the yields. Such pretreatment methods include ultrasound [12], chemical oxidation with ozone, adsorption, UV irradiation [13], membrane filtration, dilution [14], drying [15], and electrocoagulation [16], among others. The aforementioned strategies may significantly affect the total cost but do so by solubilization, color removal, phenolic compounds separation, and organic load or moisture reduction. Taking into consideration some recent research findings, phenolics were first removed or dilution was required in order to achieve higher degradation yields during anaerobic digestion [7,17,18,19]. On the other hand, aerobic processes have been proved inefficient for OMW treatment due to their high organic compounds content and the increased need for dilution [14]. The composting process was also evaluated by various researchers’ groups. According to Galliou et al. [15], OMW solar drying and composting led to a final product of 3.5% N, 1% P, 6.5% K, and 0.29% phenolic compounds, which proved similar to commercial NPK fertilizers for pepper plants’ cultivation. However, the case of dark fermentation (DF) has not yet been widely exploited, according to the literature, as only a few papers can currently been found [20,21,22].
DF is a biological approach for hydrogen (H2) production in the absence of light, through the decomposition and transformation of the organic material, not only to H2, but also to other metabolites such as volatile fatty acids (VFAs), lactate, and ethanol. The aforementioned metabolites are associated with metabolic pathways that are followed by microflora in the used inoculum and their possible synergistic (or antagonistic) interactions [23,24]. Additionally, various factors could affect the H2 and other metabolites’ efficiency, such as the pH, the temperature, the organic loading, the inhibitor’s concentration, the nitrogen or phosphorus concentration, or the amounts of metals [25]. For instance, pH plays a significant role in the various strains’ activation of the inoculum, leading to several metabolic pathways. On the other hand, temperature strongly affects bacteria growth and the substrate conversion efficiency to H2, and organic loading provides optimum conditions for acid-forming bacteria; however, organic acid production increases to an OLR range and then decreases gradually. Furthermore, compounds such as phenolics, metals, or sulfides may inhibit the overall process and thus influence the H2 yield. Concerning the macronutrients nitrogen and phosphorus, both are able to significantly affect the process, and for this reason, the optimum wide ranges of C/N (5–200) and C/P (up to 1000) have been proposed in the literature [25,26,27]. DF can be considered a waste valorization method, as except the clean energy generation through H2 production, there is an option for further exploitation of the other metabolites for methane, bio-plastics, or biodiesel production [24,28]. DF has been widely used for the exploitation and valorization of several waste and wastewater streams such as sugarcane, wheat, rice, corn, and other crop residues, the organic fraction of municipal wastes (usually kitchen and food wastes), wastes of animal origin, and industrial residues such as cheese whey, brewery, and citric acid wastewaters [27,29].
The current work focuses on OMW valorization through the DF process under thermophilic conditions, as the latter have been proven more efficient [30,31] in terms of H2 production. A series of batch experiments were carried out in order to optimize the pH value of the process in the range of 4.5 to 7.5, and a second set of experiments were performed, testing the organic loading effect of the substrate on the optimum pH value of the previous experiment set.
2. Materials and Methods
2.1. Experimental Set-Up and Procedure Descrpition
The experimental set-up comprised (a) a batch reactor, (b) a water bath, (c) a pH controller (HACH, SC200), (d) a NaOH solution inflow unit, and e) a biogas measuring unit. More specifically, the reactor was constructed by stainless steel (INOX 316) and was characterized by a total and a working volume of 1000 mL and 750 mL, respectively. Hot water, which came from the thermophilic water bath (55 ± 0.5 °C), was recirculated through the double wall of the reactor in order to ensure thermophilic conditions. Additionally, a pH electrode was placed into the reactor and was connected to the pH controller for constant pH values monitoring. The pH controller had been adjusted to add certain amounts of NaOH solution (0.5 N) into the reactor through a peristaltic pump during the whole experimentation period, in case pH values fell below the tested limits. Continuous agitation was applied, and there were specific points for gas and liquid (reactor’s content) sampling, respectively. The anaerobic conditions were ensured after sparging with N2–CO2 (80–20% v/v) for 5 min. Concerning the experimental set-up, more details can be seen in Figure 1, and regarding the biogas measuring unit, a detailed description can be found in Ref. [24].
The main tested pH range was 6.0 ± 1.0, as this range has been widely reported for efficient H2 yields during the DF process [27], and the extreme values of 4.5 and 7.5 were also evaluated, as the authors had observed significant H2 yields for both pH values in their previous works [24,28]. Concerning the various tested runs, a detailed list of the pH values and the organic loading tests (on the optimum pH value) is presented in Table 2. Regarding especially the organic loading, a value for successful DF was selected between the optimum tested range of 20–50 g/L [25] and was achieved through substrate dilution. Subsequently, the increase in organic loading was further evaluated (by reducing the dilution). The experiments lasted from 107 to 172 h, until stable metabolites concentration in the fermented substrate. Each test was conducted in duplicate.
2.2. Inoculum and Substrate
The inoculum used in the current study originated from an anaerobic thermophilic upflow packed bed reactor, able to sufficiently treat OMW under short hydraulic retention time [7]. Prior to DF experiments, the inoculum was thermally pretreated at 100 °C for 20 min and subsequently added into the batch reactor in a ratio of 15% v/v. Such inoculum pretreatment was chosen for the enrichment of the H2-producing bacteria through the methanogens and H2-consumers deactivation, and a ratio of 15% v/v was chosen according to previous research studies [24,28]. The characteristics of the inoculum are presented in Table 3.
The OMW, which was used for the batch tests, originated from a three-phase olive mill, located in Patras (Achaia, Greece). The substrate was promptly stored under −18 °C in the freezer in order to avoid any significant change on its physicochemical characteristics. For runs A–E (Table 2), the OMW was diluted with tap water in a ratio of 1:2 (one part OMW and two parts tap water); for run G, the respective ratio was 1:0.6 (organic loading doubling); and for run F, no dilution was needed. The physicochemical characteristics of the substrate without any prior dilution is presented in Table 4. The amount of the substrate was set in each run as the 85% (v/v) of the reactor’s working volume.
2.3. Analytical Techniques
For the physicochemical characterization of OMW, three samples (n = 3) were measured, and for DF monitoring, biogas and liquid samples were taken every 3–6 h from the reactor, depending on the evolution of the experiment.
The pH values measurement for the OMW physicochemical characterization was conducted off-line by an electrode (Thermo Scientific, Waltham, MA, USA, Orion ROSS Ultra Refillable pH/ATC Triode). Total solids, volatile solids, total suspended solids, volatile suspended solids, total COD, dissolved COD, total Kjeldahl nitrogen (TKN), ammonium nitrogen, alkalinity, and total and dissolved phosphorus were determined according to standard methods [38], and the methods are presented in detail by Tsigkou and Kornaros [7]. The determination of total and dissolved carbohydrates as well as of phenolic compounds was accomplished according to Refs. [39,40] with a Cary 50 UV-VIS spectrophotometer. In the case of carbohydrates, the reagents H2SO4 and tryptophan, as well as glucose as a standard compound, were used, and the reagents of Folin–Ciocalteu, Na2CO3, and syringic acid (as standard compound) were utilized, respectively, for total phenolics determination. Fats and oils were measured after hexane extraction of a known OMW amount by Soxhlet extractor (Velp Scientifica, Usmate Velate, Italy, SER 148).
The volatile metabolites of DF (acetate, propionate, butyrate, isobutyrate, valerate, isovalerate, caproate, and ethanol) were analyzed on a gas chromatograph (Agilent Technologies, Santa Clara, CA, USA, 7890A) with a flame ionization detector (FID) [41]. Additionally, lactic acid was determined by a DIONEX IC300 ion chromatography system, equipped with a thermostated (30 °C) Dionex IonPac analytical column (AS19 length 4 × 250 mm and 7.5 mm I.D), a guard column (4 × 50 mm length and 12 mm I.D), and an electron conductivity detector (Dionex, Sunnyvale, CA, USA). Finally, biogas composition analysis was performed by gas chromatography and a thermal conductivity detector (TCD), as described by [24]. The produced biogas was converted to standard conditions (i.e., STP = 0 °C and 1 atm).
2.4. Figures Design
3. Results and Discussion
3.1. Effect of pH on OMW Thermophilic DF
During the optimization of OMW thermophilic DF in terms of H2 and/or metabolites production, a series of batch experiments was initially performed for the pH values 4.5, 5.0, 6.0, 7.0, and 7.5 under the organic loading of 40 g COD/L. As shown in Figure 2a, only three experiments of the total five demonstrated the pH effect, and these exhibited remarkable H2 yields; this was the case for the pH values of 6.0, 7.0, and 7.5, whereas the tests for the pH values of 4.5 and 5.0 indicated an insignificant production of H2. The latter could be attributed to the fact that at pH values lower than 6, the enzyme hydrogenase, which is contained in H2-producing bacteria, is not able to function properly, leading to decreased or completely ceased H2 production [23]. Maximum biogas (H2 and CO2) production was observed for the run C (pH 6.0) at 823 mL, 45.7% of which was H2. Runs D and E followed (pH 7.0 and 7.5), with H2 production volumes of 205 mL and 37 mL, respectively. Convert the aforementioned values in mL H2/Lreactor, the equivalent yields for pH 6.0, 7.0, and 7.5 are 501, 273, and 50 mL H2/Lreactor. In terms of mol H2/mol glucose, the yields followed the same pattern, with the maximum calculation of 0.70 mol H2/mol glucose for pH 6.0.
Additionally, several main-end products such as VFAs and ethanol were measured, as described in Figure 2b. In case of runs A and B (pH 4.5 and 5.0, respectively), where significant H2 production was not detected, the respective metabolites were determined in very low concentrations (less than 400 mg/L). However, for runs C, D, and E (pH 6.0, 7.0, and 7.5, respectively), the metabolites exhibited a completely different effect. Acetate was the main metabolite of the experiments, reaching a maximum concentration of 2360 mg/L at pH 7.5. For both pH values of 6.0 and 7.0, the approximate acetate concentration was 1550 mg/L. As for butyrate, its production was strongly favored at pH 6.0, reaching 942 mg/L, and then decreased in values less than 300 mg/L for pH 7.0 and 7.5. On the other hand, as pH increased (pH 7.5), the metabolites of ethanol and propionate were favored, indicating both the maximum concentrations of 955 and 802 mg/L, respectively. In the work of Ghimire et al. [42], acetate was also the main metabolite of OMW after the DF process. However, it was followed by propionate, isovalerate, and butyrate, which could be attributed to the fact that the pH was not set to an optimum range but was left neutral (6.8–7.4), whereas the inoculum was pretreated with sodium 2-bromoethanesulfonic acid instead of heat shock. However, heat shock is still considered an efficient method for inoculum pretreatment, especially for thermophilic conditions tests [43]. Concerning the butyrate pattern versus the several tested pH values, the same trend was noticed in case of fruit and vegetable waste DF at a similar organic loading [24], indicating and ensuring that butyrate production metabolic pathway is favored in a pH range of 5.5–6.5 [44,45].
3.2. Hydrogen and Metabolites Evolution at pH 6.0 and 7.5
Due to the fact that maximum H2 production was reported at pH 6.0 and maximum VFAs production at pH 7.5, both runs are further discussed in this section. Concerning the experiment of run C, it lasted 6 days and was performed at pH 6.0 with an organic loading of 40 g COD/L. During the second day (after 40 h) of the experimentation period, a constant increase in H2 production was observed until t = 99 h, reaching a total H2 volume of 376 mL. According to other published works [21,42], the maximum H2 production observed under mesophilic biohydrogen potential tests or batch DF was 46 ± 15 mL H2/g vs. and 33.8 mL H2/g vs., respectively, whereas in our work, the corresponding yield was calculated to be significantly lower (18.6 mL H2/g VS). The decreased hydrogen yield could be attributed to the OMW phenols presence. According to the literature, during the DF of glucose, the presence of phenolics decreased the H2 production at an average of 15% [46]. However, such inhibitors are partially degraded during the process. The removal of the phenolic compounds at the end of the experiment in our work was calculated at 62%, a rate quite higher than 45%, as described by Lin et al. [46]. An equally high yield was observed by Tsigkou and Kornaros [7] during the high-rate thermophilic anaerobic digestion of OMW. Nevertheless, it should be always considered that such yields are strongly dependent on the individual phenolic components, which are included in the various tested OMW baches.
Concerning the other metabolites’ evolution, a simultaneous increase in acetate, ethanol, and butyrate was also presented during the second day. Due to the specific three produced metabolites, all the fermentation types that followed are characterized as H2-producing (acetate, ethanol and butyrate metabolic pathways) [47]. In Mugnai et al. [21], during the third day of their experimentation period, where H2 was detected, a completely different metabolites profile was observed. Even if acetate was still the dominant fermentation metabolite, lactate and formate were also produced, and butyrate was totally absent and appeared after the fifth day of their experiment. Despite the fact that lactate formation was significant in their work, this metabolite can be characterized as an intermediate product due to the fact that, during the eighth day of their experiment, lactate was totally converted to butyrate. In our study, lactate was also formed as an intermediate product (at a maximum concentration of 100 mg/L), as it was totally consumed during the 40th hour of the test.
For both total and soluble carbohydrates significant degradation was achieved, 66% for the former and 67% for the latter, respectively. Various substrates have exhibited optimal yields in terms of H2 production through batch DF, at pH 6.0 either under mesophilic or under thermophilic conditions. The most recent results according to other researchers are presented in Table 5.
The final run during pH optimization was that of pH 7.5. Even if some metabolites appeared after the 20th hour of the experimentation period, H2 production started after the 50th hour. This was due to the metabolites type, as initially, not only ethanol but also lactate was produced. As ethanol is categorized as an H2-producing metabolite, and lactate as an H2-consuming one [44,47], it was anticipated that we would observe no H2 until significant amounts of both acetate and ethanol were measured, indicating acetic and ethanol type fermentations [24,44]. However, even if the concentration of such metabolites was very high (higher than the case of pH 6.0, as shown in Figure 3d), the measurements exhibited only 37 mL of accumulated H2, undoubtedly due to the propionate pathway (H2-consuming type [47,54]) that was followed after the 50th hour of the experiment, and according to the literature, it is usually favored at pH values equal or higher than 7 [24,27]. Moreover, the notable amounts of VFAs and ethanol that were produced justified the higher carbohydrates consumption level compared to run C, as 72% and 80% of total and dissolved carbohydrates consumption was achieved. On the other hand, and regarding the phenolics consumption, a quite decreased rate was observed compared to the case of pH value 6.0. More specifically, the phenolic compounds were degraded by 56%, a yield that is still characterized higher than in the case of Lin et al. [46].
3.3. Organic Loading Effect
According to Section 3.1 and Section 3.2, the experiment that was carried out at pH 6.0 was the optimal in terms of H2 production, whereas acetate and ethanol were produced as main end products. Two additional tests (runs F and G) were performed at pH 6.0, under different organic loading values. More specifically, run F tested the substrate without any prior dilution (125 g COD/L), whereas the following one was performed after dilution until the organic loading of 80 g COD/L. As shown in Figure 4, both experiments of runs F and G exhibited similar behavior. No biogas was detected, and the production of the other metabolites remained at low levels, about 400 mg/L, indicating unfavored conditions for the efficient growth of microorganisms and biomass decomposition. For the same reason, insignificant changes in phenolic compounds content were also detected. Such experiments underline the importance of organic loading not only as a DF parameter, but also as a major inhibitor. Indeed, the results in Figure 4 indicate the significance of operating the DF reactors at an initial substrate concentration lower or equal to 50 g COD/L [25]. According to Rangel et al. [55], low organic loading increased the H2 yield but decreased VFA production for a mixture of pig manure, cocoa mucilage, and coffee mucilage. However, their best results were achieved for an organic load 10 g VS/L, whereas our experiments operated successfully for an average of 30 g VS/L (run C- dilution for 40 g COD/L). These findings are not in line with our study, where both VFAs and H2 were significantly decreased with the increase in organic loading, but such behavior could be attributed to the combination of organic loading and the presence of inhibitory compounds (phenols).
The organic loading barrier could be managed not only by dilution, but also by the implementation of pretreatment methods for organic load reduction and inhibitors’ elimination or removal, such as several advanced oxidation processes [56], membrane filtration, extraction [57], or coagulation [58]. Such pretreatment strategies could be applied to the OMW, prior to DF, in order to further evaluate the coupled process for operational yield improvement and efficiency enhancement.
4. Conclusions
The thermophilic DF of OMW exhibited maximum efficiency in terms of H2 production and phenolics removal at the pH value of 6.0, with an organic loading of 40 g COD/L. Even if the achieved H2 yield occurred could not be characterized as too high, the removal of phenolic compounds reached 62% and could be considered as one of the highest DF rates, as reported in the literature. Additionally, a further increase in organic loading minimized not only H2 production, but also the production of organic acids and ethanol, indicating that the process is favored at relatively low organic loading values. However, further research could be conducted in order to investigate the process yields after the implementation of pretreatment strategies instead of dilution.
Author Contributions
Conceptualization, K.T. and M.K.; methodology, K.T; software, K.T and N.S.; validation, K.T. and N.S.; formal analysis, K.T.; investigation, K.T.; resources, M.K.; data curation, K.T. and N.S.; writing—original draft preparation, K.T. and N.S.; writing—review and editing, K.T. and M.K.; visualization, K.T.; supervision, M.K.; project administration, M.K.; funding acquisition, M.K. All authors have read and agreed to the published version of the manuscript.
Funding
This research was funded by the European Union and Greek national funds through the Regional Operational Program “Western Greece 2014–2020”, under the Call “Regional Research and Innovation Strategies for Smart Specialization (RIS3) in Agro-Food” (project: DER6-0021057 entitled “Integrated Energy and Environmental Exploitation of Olive Oil Production by-products, OLIVENERGY”).
Institutional Review Board Statement
Not applicable.
Informed Consent Statement
Not applicable.
Data Availability Statement
Not applicable.
Conflicts of Interest
The authors declare no conflict of interest.
References
- Shahbandeh, M. Production Volume of Olive Oil Worldwide from 2012/13 to 2021/22. Available online: https://www.statista.com/statistics/613466/olive-oil-production-volume-worldwide/#statisticContainer (accessed on 7 January 2022).
- World’s Olive Oil Production Has Tripled. Available online: https://www.internationaloliveoil.org/worlds-olive-oil-production-has-tripled/ (accessed on 7 January 2022).
- Papanastasis, V.P.; Mantzanas, K.; Dini-Papanastasi, O.; Ispikoudis, I. Traditional agroforestry systems and their evolution in Greece. In Agroforestry in Europe; Springer: Berlin/Heidelberg, Germany, 2009; pp. 89–109. [Google Scholar]
- European, C. Market Situation in the Olive Oil and Table Olives Sectors. Available online: https://ec.europa.eu/info/sites/default/files/food-farming-fisheries/plants_and_plant_products/documents/market-situation-olive-oil-table-olives_en.pdf (accessed on 8 January 2022).
- Klonaris, S.; Agiangkatzoglou, A. Competitiveness of Greek virgin olive oil in the main destination markets. Br. Food J. 2018, 120, 80–95. [Google Scholar] [CrossRef]
- Aravani, V.P.; Sun, H.; Yang, Z.; Liu, G.; Wang, W.; Anagnostopoulos, G.; Syriopoulos, G.; Charisiou, N.D.; Goula, M.A.; Kornaros, M. Agricultural and livestock sector’s residues in Greece & China: Comparative qualitative and quantitative characterization for assessing their potential for biogas production. Renew. Sustain. Energy Rev. 2022, 154, 111821. [Google Scholar]
- Tsigkou, K.; Kornaros, M. Development of a high-rate anaerobic thermophilic upflow packed bed reactor for efficient bioconversion of diluted three-phase olive mill wastewater into methane. Fuel 2022, 310, 122263. [Google Scholar] [CrossRef]
- Koutsos, T.M.; Chatzistathis, T.; Balampekou, E.I. A new framework proposal, towards a common EU agricultural policy, with the best sustainable practices for the re-use of olive mill wastewater. Sci. Total Environ. 2018, 622–623, 942–953. [Google Scholar] [CrossRef] [PubMed]
- Azzam, M.O.J.; Hazaimeh, S.A. Olive mill wastewater treatment and valorization by extraction/concentration of hydroxytyrosol and other natural phenols. Process Saf. Environ. Prot. 2021, 148, 495–523. [Google Scholar] [CrossRef]
- Tsigkou, K.; Terpou, A.; Treu, L.; Kougias, P.G.; Kornaros, M. Thermophilic anaerobic digestion of olive mill wastewater in an upflow packed bed reactor: Evaluation of 16S rRNA amplicon sequencing for microbial analysis. J. Environ. Manag. 2022, 301, 113853. [Google Scholar] [CrossRef]
- Albalasmeh, A.A.; Alajlouni, M.A.; Ghariabeh, M.A.; Rusan, M.J. Short-Term Effects of Olive Mill Wastewater Land Spreading on Soil Physical and Hydraulic Properties. Water Air Soil Pollut. 2019, 230, 208. [Google Scholar] [CrossRef]
- Oz, N.A.; Uzun, A.C. Ultrasound pretreatment for enhanced biogas production from olive mill wastewater. Ultrason. Sonochem. 2015, 22, 565–572. [Google Scholar] [CrossRef] [PubMed]
- Eroğlu, E.; Eroğlu, İ.; Gündüz, U.; Yücel, M. Treatment of olive mill wastewater by different physicochemical methods and utilization of their liquid effluents for biological hydrogen production. Biomass Bioenergy 2009, 33, 701–705. [Google Scholar] [CrossRef]
- Lee, Z.S.; Chin, S.Y.; Lim, J.W.; Witoon, T.; Cheng, C.K. Treatment technologies of palm oil mill effluent (POME) and olive mill wastewater (OMW): A brief review. Environ. Technol. Innov. 2019, 15, 100377. [Google Scholar] [CrossRef]
- Galliou, F.; Markakis, N.; Fountoulakis, M.S.; Nikolaidis, N.; Manios, T. Production of organic fertilizer from olive mill wastewater by combining solar greenhouse drying and composting. Waste Manag. 2018, 75, 305–311. [Google Scholar] [CrossRef]
- Ntaikou, I.; Antonopoulou, G.; Vayenas, D.; Lyberatos, G. Assessment of electrocoagulation as a pretreatment method of olive mill wastewater towards alternative processes for biofuels production. Renew. Energy 2020, 154, 1252–1262. [Google Scholar] [CrossRef]
- Zakoura, M.; Kopsahelis, A.; Tsigkou, K.; Ntougias, S.; Ali, S.S.; Kornaros, M. Performance evaluation of three mesophilic upflow anaerobic sludge blanket bioreactors treating olive mill wastewater: Flocculent and granular inocula tests, organic loading rate effect and anaerobic consortia structure. Fuel 2022, 313, 122951. [Google Scholar] [CrossRef]
- Tsigkou, K.; Sakarika, M.; Kornaros, M. Inoculum origin and waste solid content influence the biochemical methane potential of olive mill wastewater under mesophilic and thermophilic conditions. Biochem. Eng. J. 2019, 151, 107301. [Google Scholar] [CrossRef]
- Khoufi, S.; Aloui, F.; Sayadi, S. Extraction of antioxidants from olive mill wastewater and electro-coagulation of exhausted fraction to reduce its toxicity on anaerobic digestion. J. Hazard. Mater. 2008, 151, 531–539. [Google Scholar] [CrossRef]
- Eroğlu, E.; Eroğlu, İ.; Gündüz, U.; Türker, L.; Yücel, M. Biological hydrogen production from olive mill wastewater with two-stage processes. Int. J. Hydrogen Energy 2006, 31, 1527–1535. [Google Scholar] [CrossRef]
- Mugnai, G.; Borruso, L.; Mimmo, T.; Cesco, S.; Luongo, V.; Frunzo, L.; Fabbricino, M.; Pirozzi, F.; Cappitelli, F.; Villa, F. Dynamics of bacterial communities and substrate conversion during olive-mill waste dark fermentation: Prediction of the metabolic routes for hydrogen production. Bioresour. Technol. 2021, 319, 124157. [Google Scholar] [CrossRef] [PubMed]
- Ghimire, A.; Frunzo, L.; Pirozzi, F.; Trably, E.; Escudie, R.; Lens, P.N.L.; Esposito, G. A review on dark fermentative biohydrogen production from organic biomass: Process parameters and use of by-products. Appl. Energy 2015, 144, 73–95. [Google Scholar] [CrossRef]
- Wong, Y.M.; Wu, T.Y.; Juan, J.C. A review of sustainable hydrogen production using seed sludge via dark fermentation. Renew. Sustain. Energy Rev. 2014, 34, 471–482. [Google Scholar] [CrossRef]
- Tsigkou, K.; Tsafrakidou, P.; Athanasopoulou, S.; Zafiri, C.; Kornaros, M. Effect of pH on the Anaerobic Fermentation of Fruit/Vegetables and Disposable Nappies Hydrolysate for Bio-hydrogen Production. Waste Biomass Valorization 2020, 11, 539–551. [Google Scholar] [CrossRef]
- Elbeshbishy, E.; Dhar, B.R.; Nakhla, G.; Lee, H.S. A critical review on inhibition of dark biohydrogen fermentation. Renew. Sustain. Energy Rev. 2017, 79, 656–668. [Google Scholar] [CrossRef]
- Pandey, A.K.; Pilli, S.; Bhunia, P.; Tyagi, R.D.; Surampalli, R.Y.; Zhang, T.C.; Kim, S.-H.; Pandey, A. Dark fermentation: Production and utilization of volatile fatty acid from different wastes—A review. Chemosphere 2022, 288, 132444. [Google Scholar] [CrossRef] [PubMed]
- Łukajtis, R.; Hołowacz, I.; Kucharska, K.; Glinka, M.; Rybarczyk, P.; Przyjazny, A.; Kamiński, M. Hydrogen production from biomass using dark fermentation. Renew. Sustain. Energy Rev. 2018, 91, 665–694. [Google Scholar] [CrossRef]
- Zagklis, D.; Papadionysiou, M.; Tsigkou, K.; Tsafrakidou, P.; Zafiri, C.; Kornaros, M. Effect of pH on the Economic Potential of Dark Fermentation Products from Used Disposable Nappies and Expired Food Products. Appl. Sci. 2021, 11, 4099. [Google Scholar] [CrossRef]
- Bundhoo, Z.M.A. Potential of bio-hydrogen production from dark fermentation of crop residues: A review. Int. J. Hydrogen Energy 2019, 44, 17346–17362. [Google Scholar] [CrossRef]
- Cahyari, K.; Hidayat, M.; Syamsiah, S. Optimization of hydrogen production from fruit waste through mesophilic and thermophilic dark fermentation: Effect of substrate-to-inoculum ratio. Malaysian J. Anal. Sci. 2019, 23, 116–123. [Google Scholar]
- Cakır, A.; Ozmihci, S.; Kargi, F. Comparison of bio-hydrogen production from hydrolyzed wheat starch by mesophilic and thermophilic dark fermentation. Int. J. Hydrogen Energy 2010, 35, 13214–13218. [Google Scholar] [CrossRef]
- Al-Bsoul, A.; Al-Shannag, M.; Tawalbeh, M.; Al-Taani, A.A.; Lafi, W.K.; Al-Othman, A.; Alsheyab, M. Optimal conditions for olive mill wastewater treatment using ultrasound and advanced oxidation processes. Sci. Total Environ. 2020, 700, 134576. [Google Scholar] [CrossRef]
- Aboutaleb, E.; Kamel, G.; Hellal, M. Investigation of effective treatment techniques for olive mill wastewater. Egypt. J. Chem. 2018, 61, 415–422. [Google Scholar]
- Rocha, C.; Soria, M.A.; Madeira, L.M. Screening of commercial catalysts for steam reforming of olive mill wastewater. Renew. Energy 2021, 169, 765–779. [Google Scholar] [CrossRef]
- Azzaz, A.A.; Matei Ghimbeu, C.; Jellai, S.; El-Bassi, L.; Jeguirim, M. Olive Mill by-Products Thermochemical Conversion via Hydrothermal Carbonization and Slow Pyrolysis: Detailed Comparison between the Generated Hydrochars and Biochars Characteristics. Processes 2022, 10, 231. [Google Scholar] [CrossRef]
- Haddad, K.; Jeguirim, M.; Jellali, S.; Thevenin, N.; Ruidavets, L.; Limousy, L. Biochar production from Cypress sawdust and olive mill wastewater: Agronomic approach. Sci. Total Environ. 2021, 752, 141713. [Google Scholar] [CrossRef]
- Jaouad, Y.; Villain-Gambier, M.; Mandi, L.; Marrot, B.; Ouazzani, N. Comparison of aerobic processes for olive mill wastewater treatment. Water Sci. Technol. 2020, 81, 1914–1926. [Google Scholar] [CrossRef]
- Eaton, A.D.; Clesceri, L.S.; Greenberg, A.E.; Franson, M.A.H. Standard Methods for the Examination of Water and Wastewater, 22nd ed.; APHA: Washington, DC, USA, 2012. [Google Scholar]
- Waterman, P.G.; Mole, S. Analysis of Phenolic Plant Metabolites; Blackwell Scientific: Oxford, UK; Boston, MA, USA, 1994; 238p. [Google Scholar]
- Joseffson, B. Rapid spectrophotometric determination of total carbohydrates. In Methods Seawater Analysis; Grasshoff, K., Ehrhardt, M., Kremling, K., Eds.; Verlag Chemie GmbH: Deerfield Beach, FL, USA; Weinheim, Germany; Basel, Switzerland, 1983; pp. 340–342. [Google Scholar]
- Dareioti, M.A.; Vavouraki, A.I.; Tsigkou, K.; Zafiri, C.; Kornaros, M. Dark Fermentation of Sweet Sorghum Stalks, Cheese Whey and Cow Manure Mixture: Effect of pH, Pretreatment and Organic Load. Processes 2021, 9, 1017. [Google Scholar] [CrossRef]
- Ghimire, A.; Frunzo, L.; Pontoni, L.; d’Antonio, G.; Lens, P.N.L.; Esposito, G.; Pirozzi, F. Dark fermentation of complex waste biomass for biohydrogen production by pretreated thermophilic anaerobic digestate. J. Environ. Manag. 2015, 152, 43–48. [Google Scholar] [CrossRef]
- Ghimire, A.; Sposito, F.; Frunzo, L.; Trably, E.; Escudié, R.; Pirozzi, F.; Lens, P.N.L.; Esposito, G. Effects of operational parameters on dark fermentative hydrogen production from biodegradable complex waste biomass. Waste Manag. 2016, 50, 55–64. [Google Scholar] [CrossRef] [PubMed]
- Ren, N.; Wang, B.; Huang, J.C. Ethanol-type fermentation from carbohydrate in high rate acidogenic reactor. Biotechnol. Bioeng. 1997, 54, 428–433. [Google Scholar] [CrossRef]
- Stavropoulos, K.P.; Kopsahelis, A.; Zafiri, C.; Kornaros, M. Effect of pH on Continuous Biohydrogen Production from End-of-Life Dairy Products (EoL-DPs) via Dark Fermentation. Waste Biomass Valorization 2016, 7, 753–764. [Google Scholar] [CrossRef]
- Lin, R.; Cheng, J.; Ding, L.; Song, W.; Zhou, J.; Cen, K. Inhibitory effects of furan derivatives and phenolic compounds on dark hydrogen fermentation. Bioresour. Technol. 2015, 196, 250–255. [Google Scholar] [CrossRef]
- Luo, L.; Kaur, G.; Wong, J.W.C. A mini-review on the metabolic pathways of food waste two-phase anaerobic digestion system. Waste Manag. Res. 2019, 37, 333–346. [Google Scholar] [CrossRef]
- Asunis, F.; De Gioannis, G.; Isipato, M.; Muntoni, A.; Polettini, A.; Pomi, R.; Rossi, A.; Spiga, D. Control of fermentation duration and pH to orient biochemicals and biofuels production from cheese whey. Bioresour. Technol. 2019, 289, 121722. [Google Scholar] [CrossRef] [PubMed]
- Li, X.; Guo, L.; Liu, Y.; Wang, Y.; She, Z.; Gao, M.; Zhao, Y. Effect of salinity and pH on dark fermentation with thermophilic bacteria pretreated swine wastewater. J. Environ. Manag. 2020, 271, 111023. [Google Scholar] [CrossRef] [PubMed]
- Magrini, F.E.; de Almeida, G.M.; da Maia Soares, D.; Fuentes, L.; Ecthebehere, C.; Beal, L.L.; da Silveira, M.M.; Paesi, S. Effect of different heat treatments of inoculum on the production of hydrogen and volatile fatty acids by dark fermentation of sugarcane vinasse. Biomass Convers. Biorefinery 2021, 11, 2443–2456. [Google Scholar] [CrossRef]
- Mechery, J.; Thomas, D.M.; Kumar, C.S.; Joseph, L.; Sylas, V.P. Biohydrogen production from acidic and alkaline hydrolysates of paddy straw using locally isolated facultative bacteria through dark fermentation. Biomass Convers. Biorefinery 2021, 11, 1263–1272. [Google Scholar] [CrossRef]
- Dareioti, M.A.; Vavouraki, A.I.; Kornaros, M. Effect of pH on the anaerobic acidogenesis of agroindustrial wastewaters for maximization of bio-hydrogen production: A lab-scale evaluation using batch tests. Bioresour. Technol. 2014, 162, 218–227. [Google Scholar] [CrossRef] [PubMed]
- Jia, X.; Wang, Y.; Ren, L.; Li, M.; Tang, R.; Jiang, Y.; Hou, J. Early warning indicators and microbial community dynamics during unstable stages of continuous hydrogen production from food wastes by thermophilic dark fermentation. Int. J. Hydrogen Energy 2019, 44, 30000–30013. [Google Scholar] [CrossRef]
- Sivagurunathan, P.; Sen, B.; Lin, C.Y. Overcoming propionic acid inhibition of hydrogen fermentation by temperature shift strategy. Int. J. Hydrogen Energy 2014, 39, 19232–19241. [Google Scholar] [CrossRef]
- Rangela, C.; Sastoqueb, J.; Calderonb, J.; Mosquerab, J.; Velasquezd, P.; Cabezabc, I.; Acevedobd, P. Hydrogen Production by Dark Fermentation Process: Effect of Initial Organic Load. Chem. Eng. 2020, 79, 133–138. [Google Scholar]
- Hodaifa, G.; Gallardo, P.A.R.; García, C.A.; Kowalska, M.; Seyedsalehi, M. Chemical oxidation methods for treatment of real industrial olive oil mill wastewater. J. Taiwan Inst. Chem. Eng. 2019, 97, 247–254. [Google Scholar] [CrossRef]
- Bhatia, S.K.; Jagtap, S.S.; Bedekar, A.A.; Bhatia, R.K.; Patel, A.K.; Pant, D.; Banu, J.R.; Rao, C.V.; Kim, Y.-G.; Yang, Y.-H. Recent developments in pretreatment technologies on lignocellulosic biomass: Effect of key parameters, technological improvements, and challenges. Bioresour. Technol. 2020, 300, 122724. [Google Scholar] [CrossRef]
- Lin, C.-Y.; Chiang, C.-C.; Nguyen, M.-L.T.; Lay, C.-H. Enhancement of fermentative biohydrogen production from textile desizing wastewater via coagulation-pretreatment. Int. J. Hydrogen Energy 2017, 42, 12153–12158. [Google Scholar] [CrossRef]
Figure 1.
Influent and experimental conditions, and reactor configuration for the thermophilic DF of OMW.
Figure 1.
Influent and experimental conditions, and reactor configuration for the thermophilic DF of OMW.
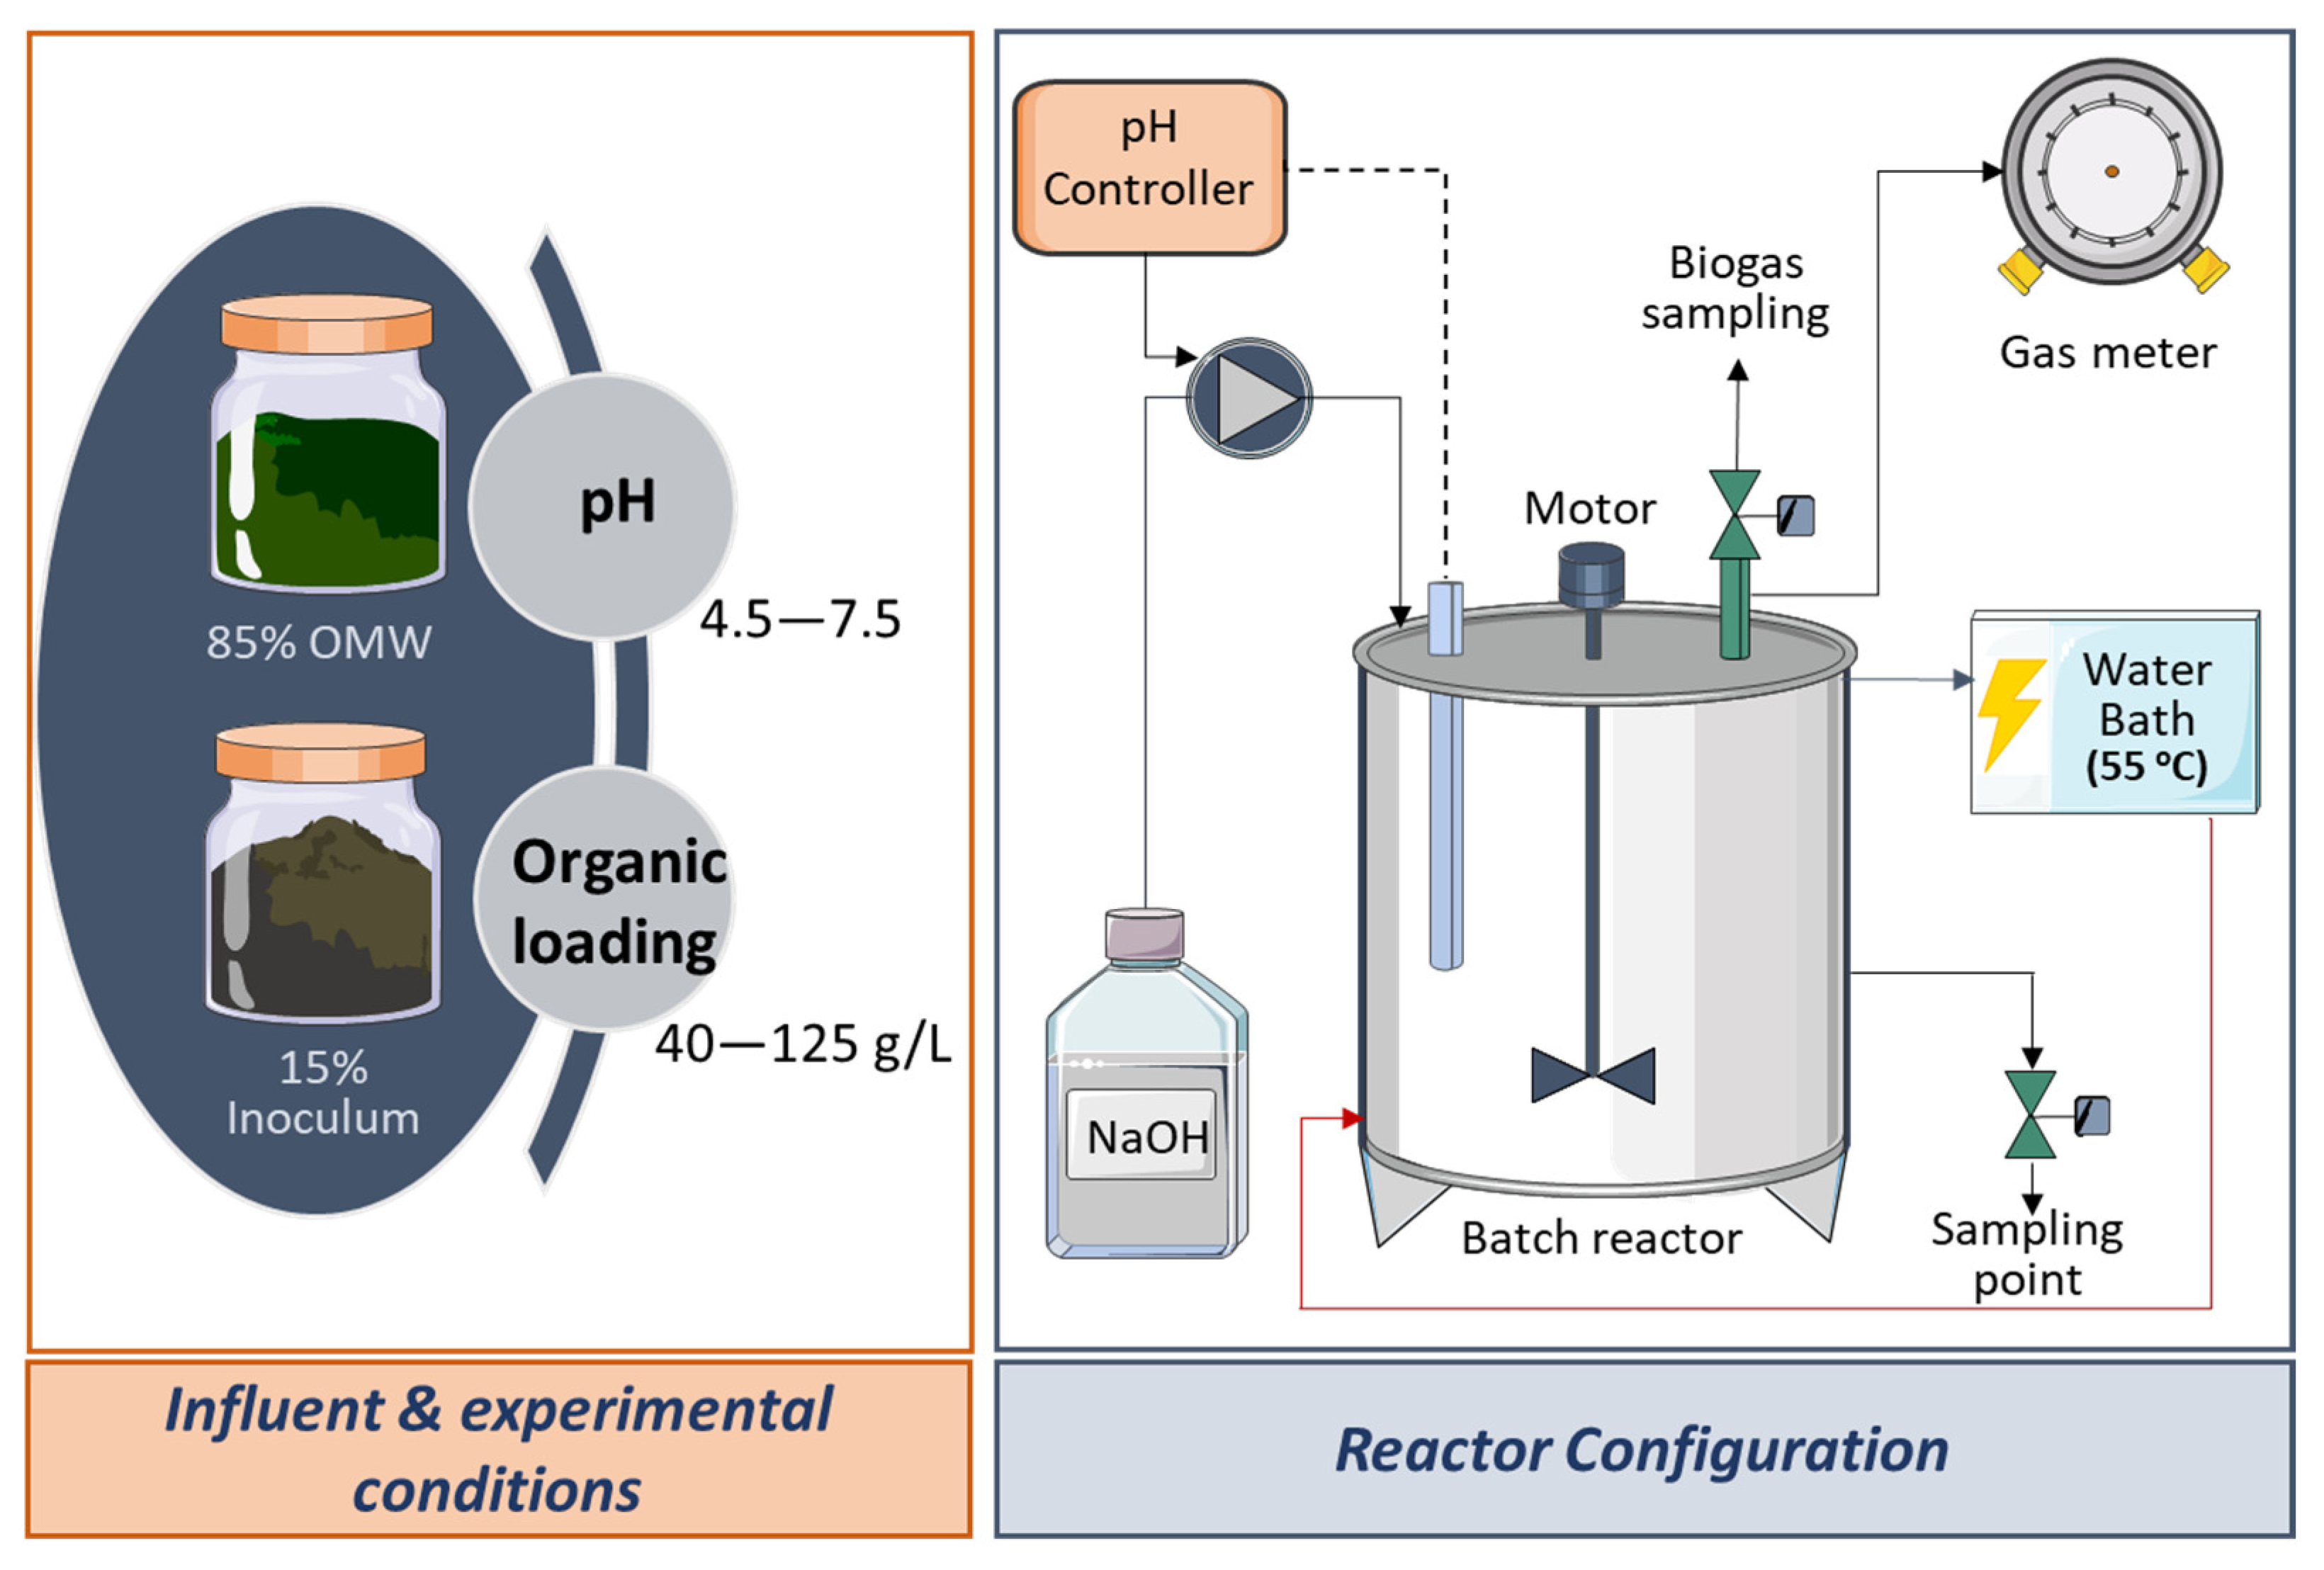
Figure 2.
Effect of pH on thermophilic OMW DF. (a) Biogas and hydrogen yields presentation. (b) Main end products presentation.
Figure 2.
Effect of pH on thermophilic OMW DF. (a) Biogas and hydrogen yields presentation. (b) Main end products presentation.
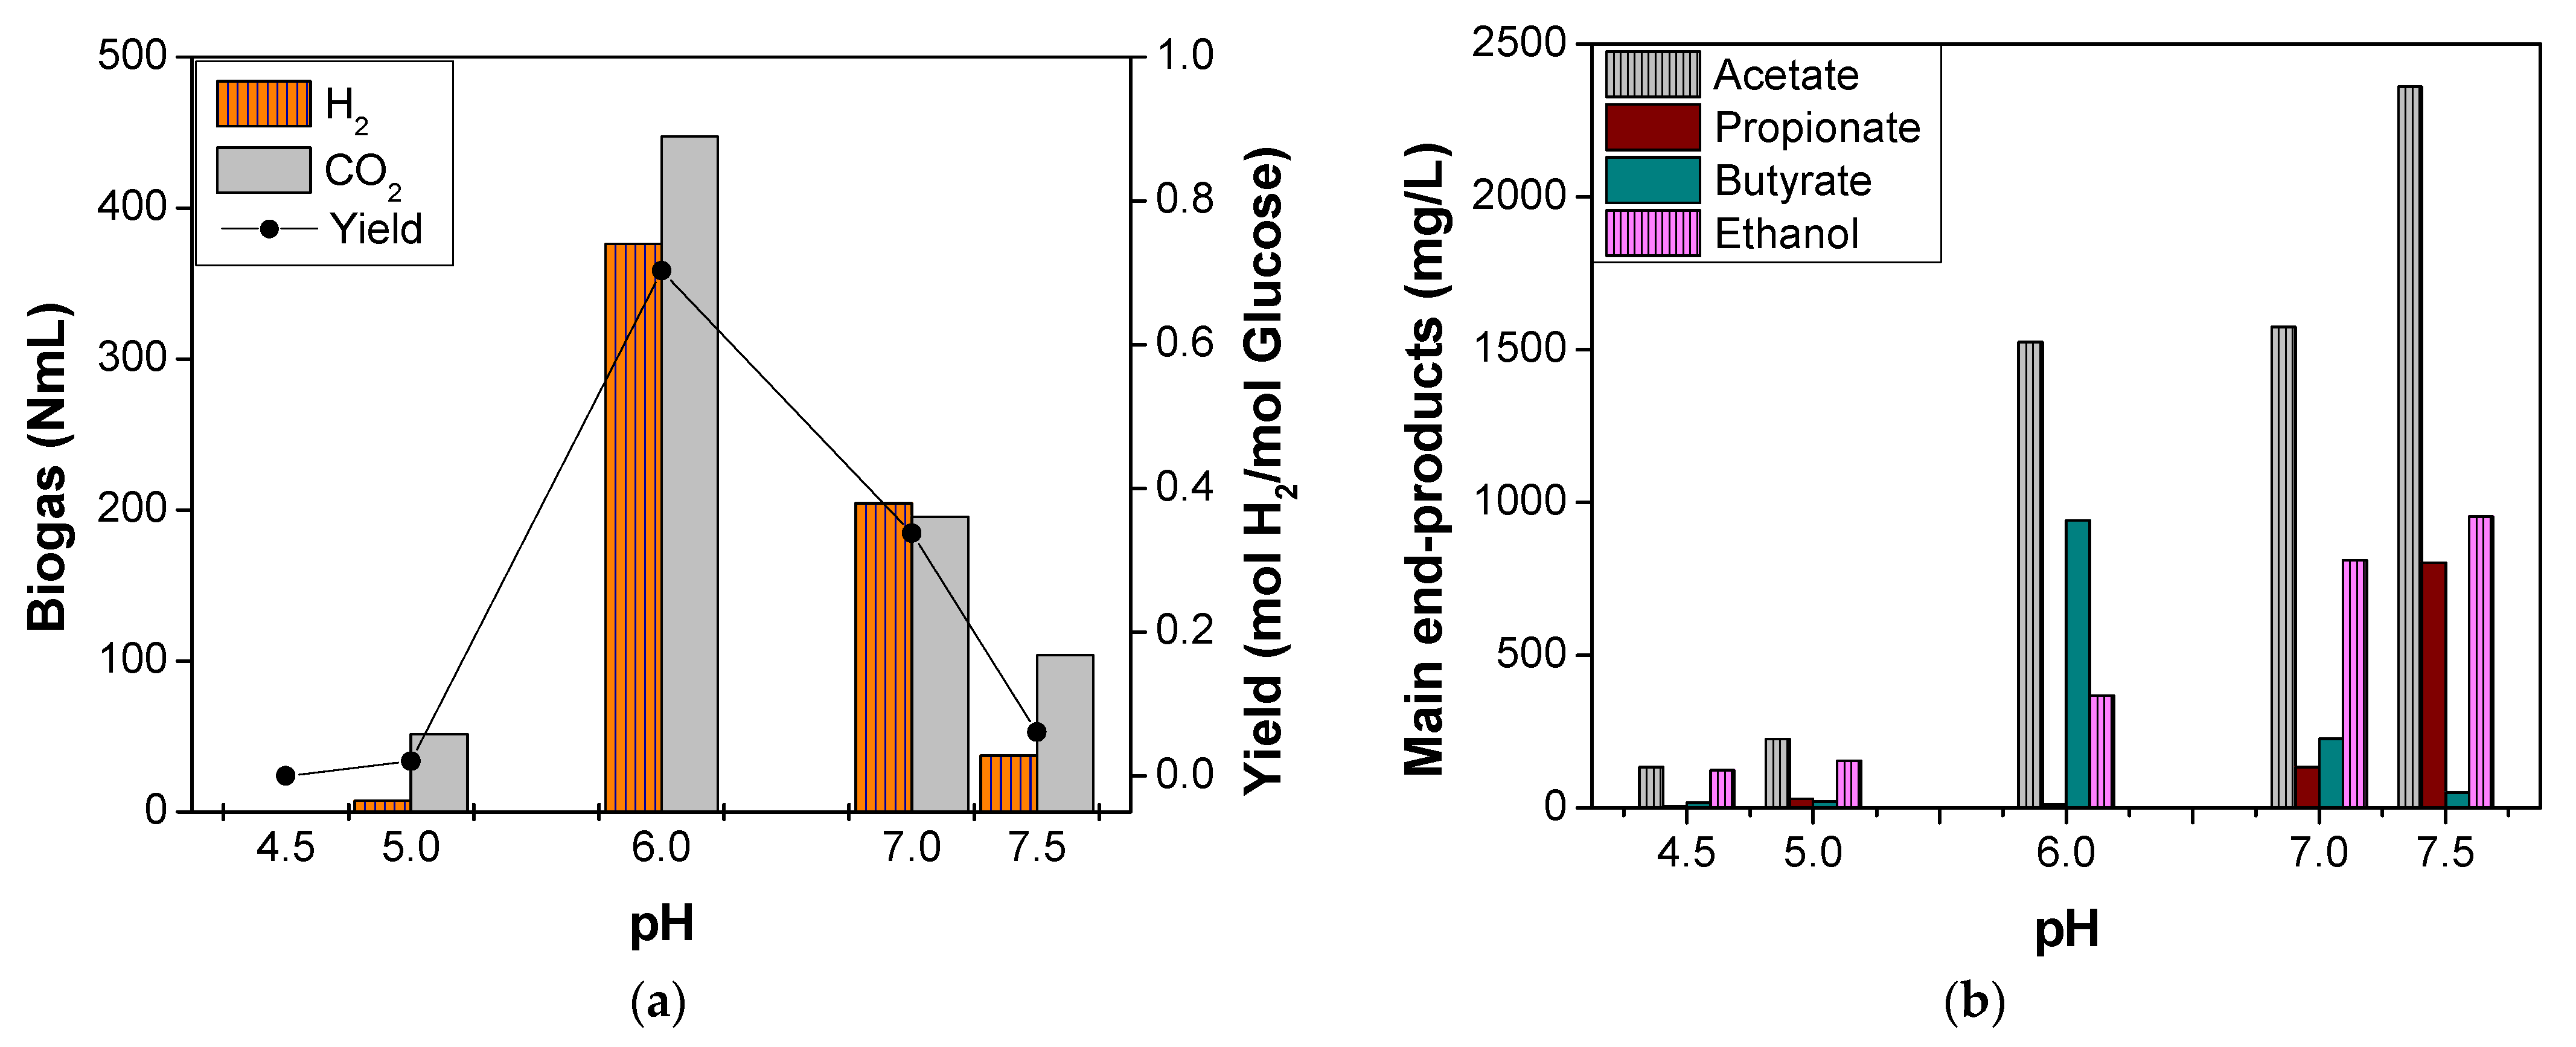
Figure 3.
(a) Biogas accumulation during the test of pH 6.0; (b) metabolites evolution during the test of pH 6.0; (c) biogas accumulation during the test of pH 7.5; and (d) metabolites evolution during the test of pH 7.5.
Figure 3.
(a) Biogas accumulation during the test of pH 6.0; (b) metabolites evolution during the test of pH 6.0; (c) biogas accumulation during the test of pH 7.5; and (d) metabolites evolution during the test of pH 7.5.
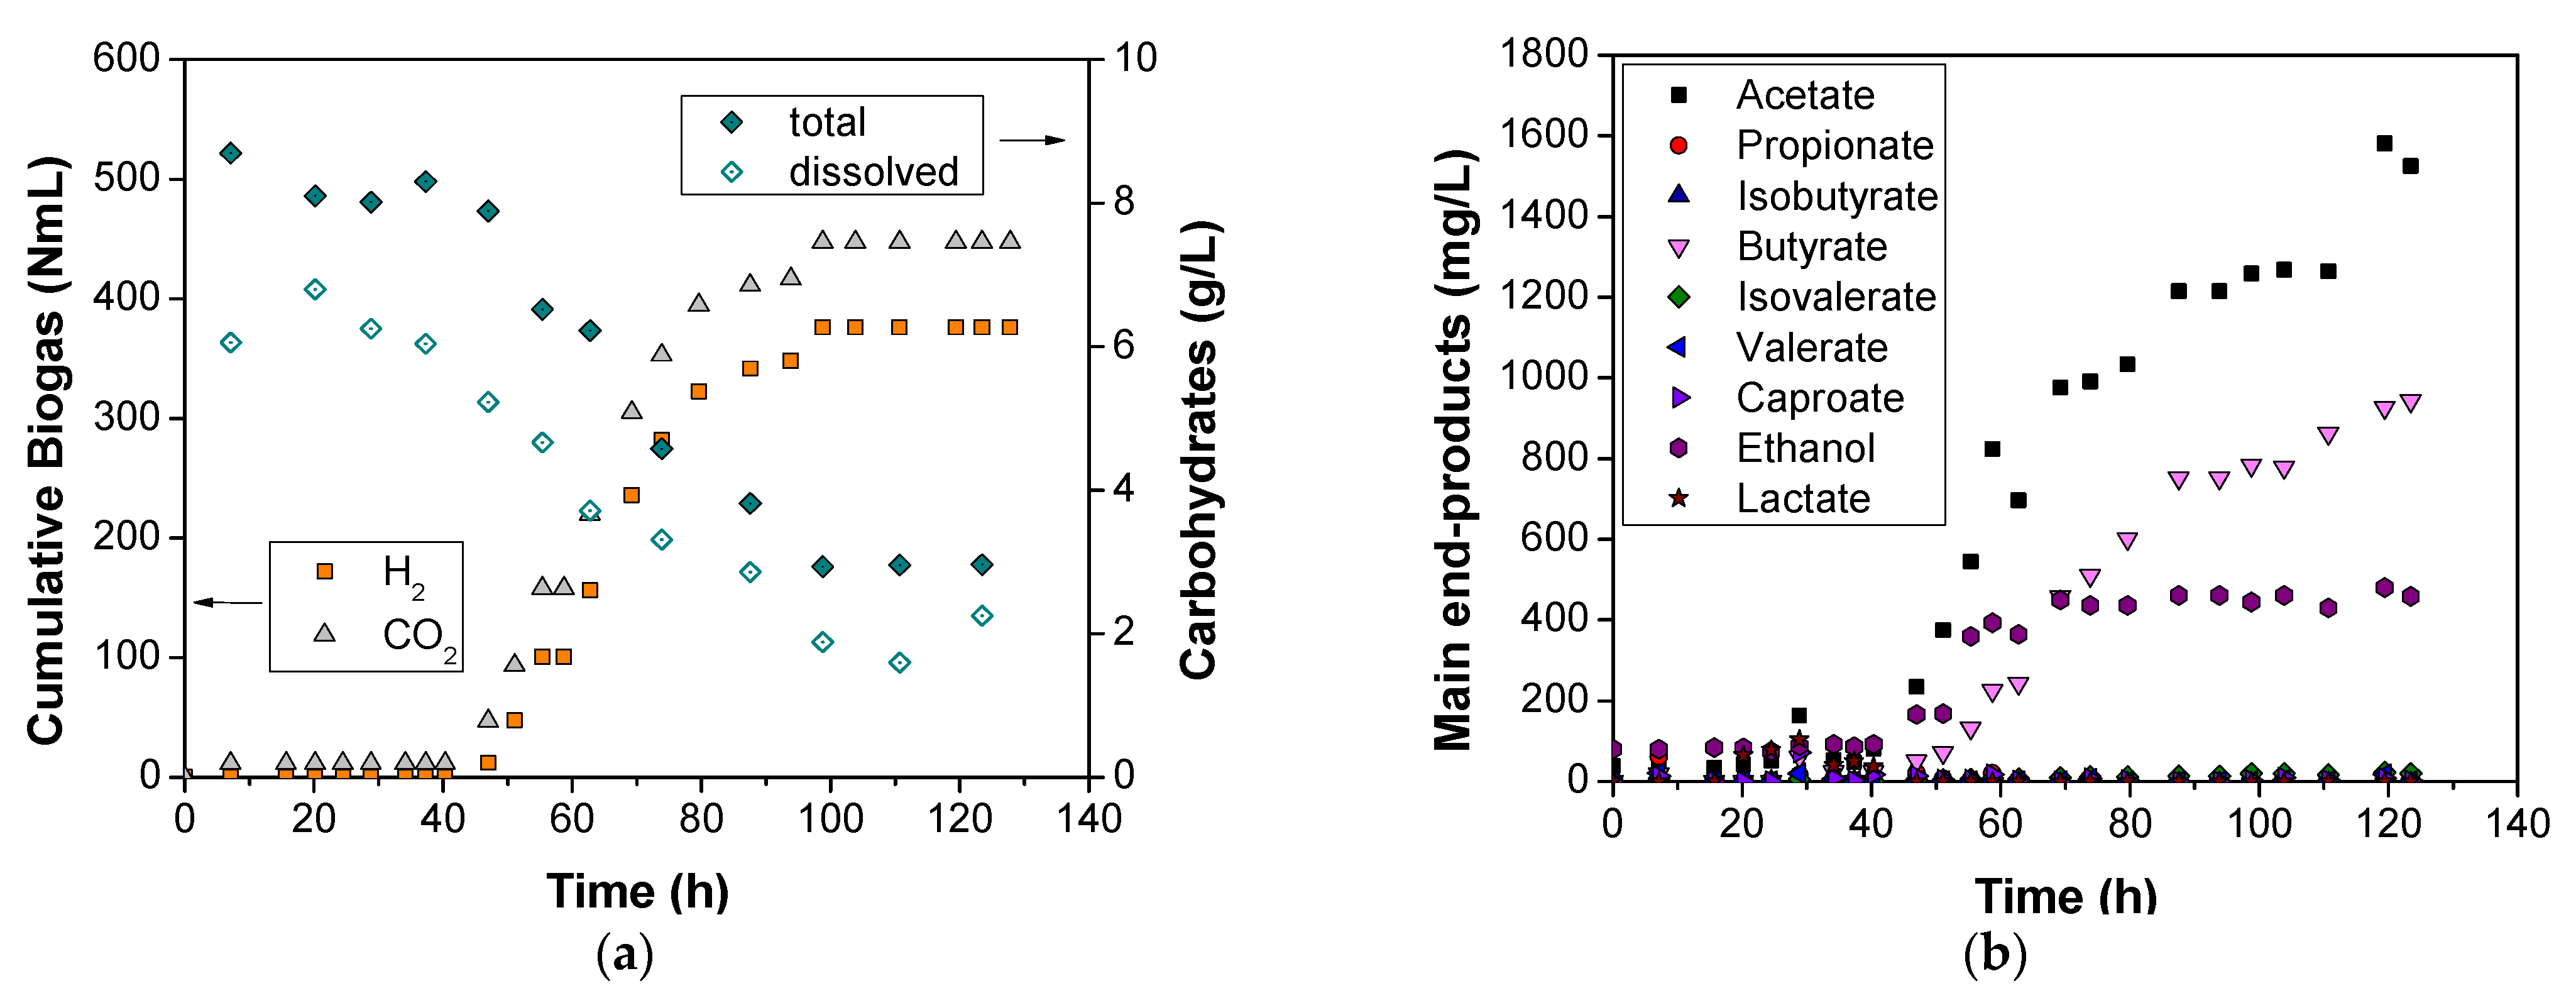
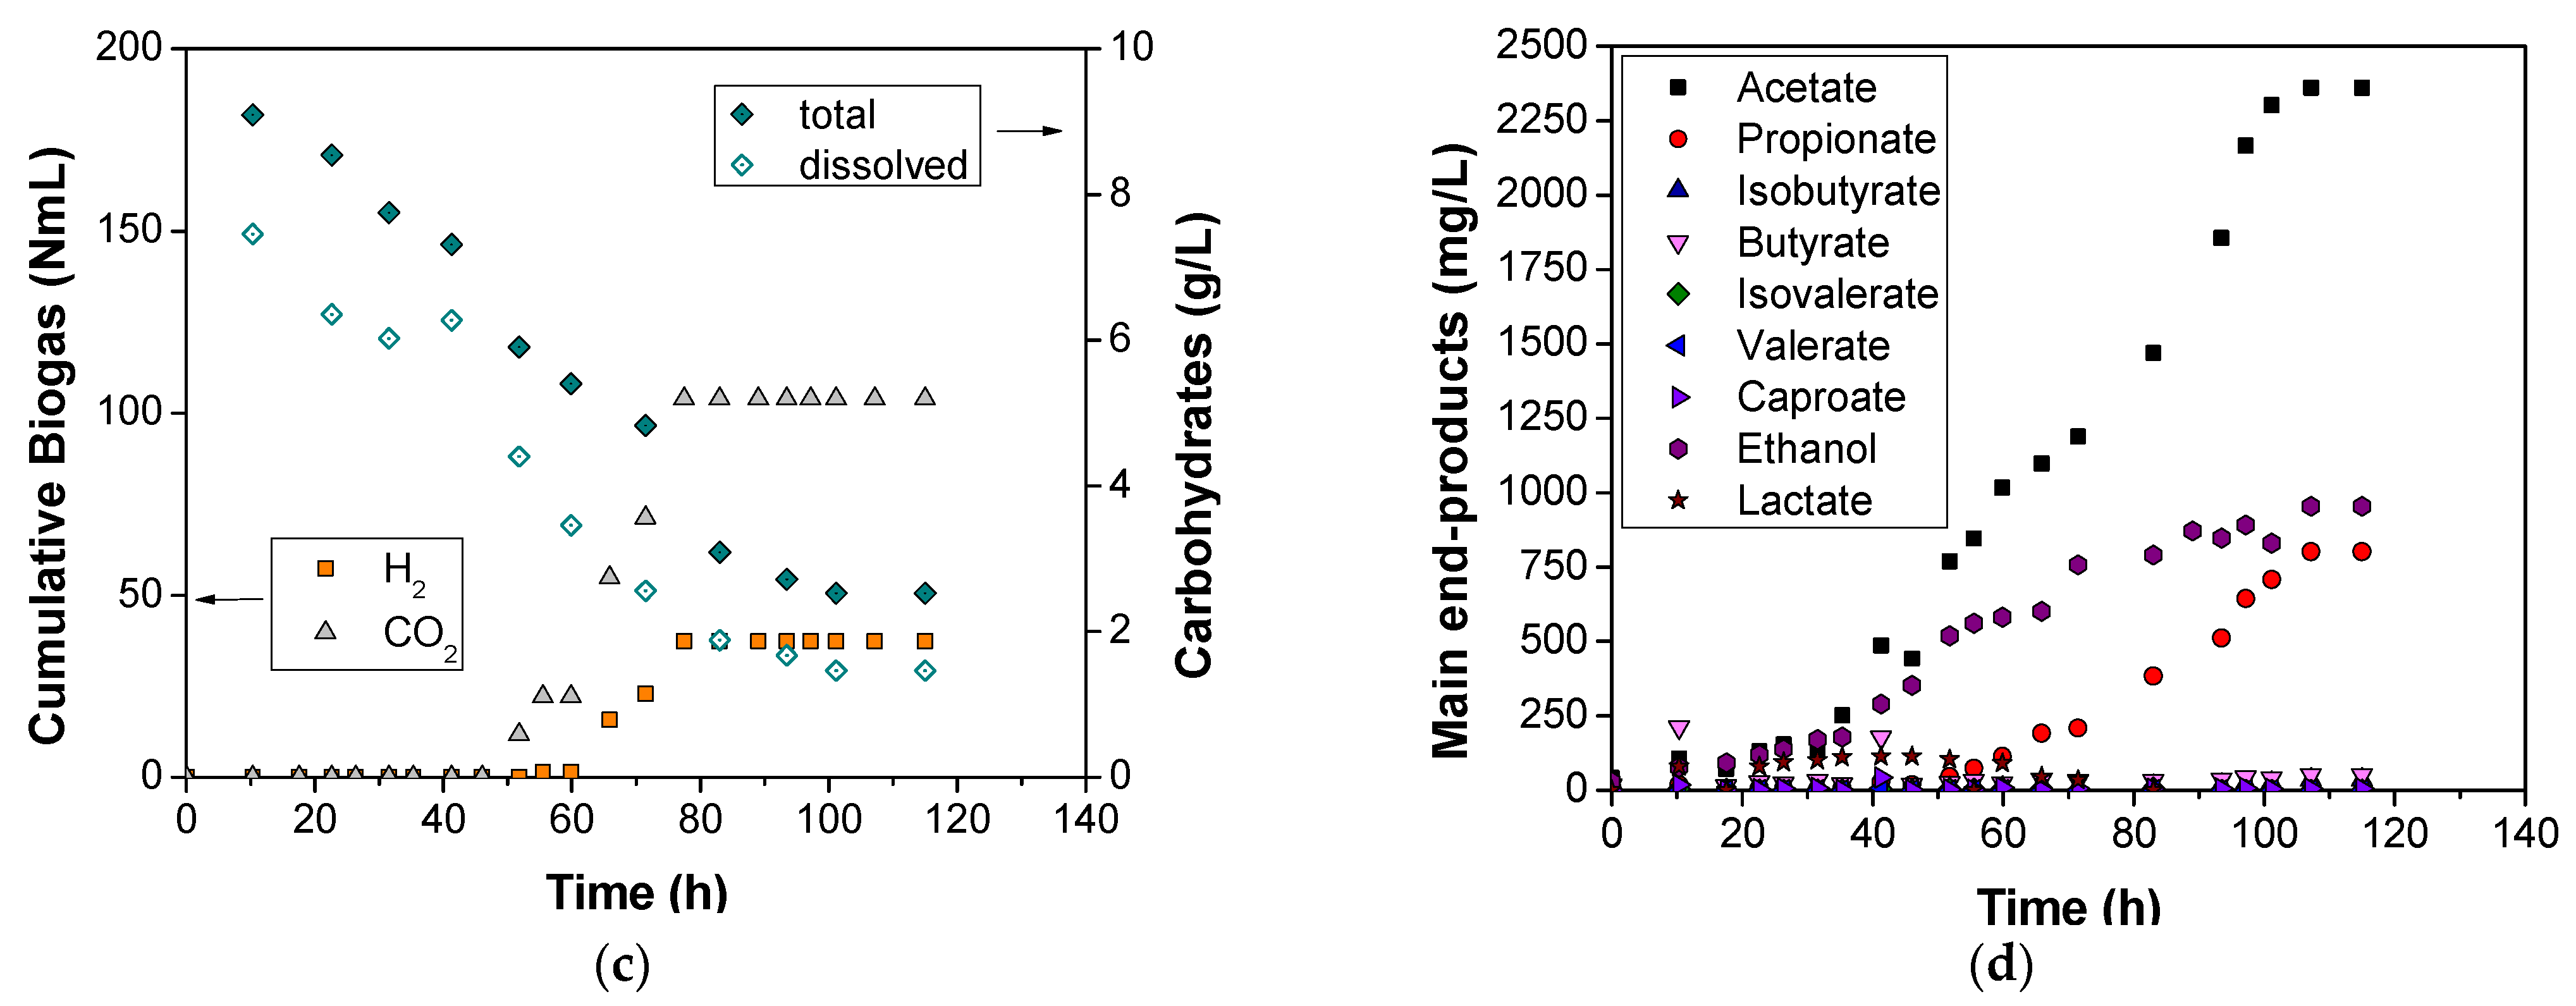
Figure 4.
Effect of organic loading on thermophilic OMW DF under pH 6.0.


Table 1.
Presentation of several methods for OMW valorization/treatment according to the most recent literature and their characteristics.
Table 1.
Presentation of several methods for OMW valorization/treatment according to the most recent literature and their characteristics.
| Method | Characteristics | Ref. |
|---|---|---|
| Membrane ultrafiltration | Purification of the substrate; however, some boundaries are presented usually due to fouling problems. | [14] |
| Combination of ultrasound and advanced oxidation processes | Reduction in organic content; however, the residual stream needs further treatment. | [32] |
| Electro-coagulation | High organic content removal; however, the residual stream needs further treatment. | [33] |
| Steam reforming | High total organic carbon conversion and H2 yields; however the performance is strongly depended on the catalyst. | [34] |
| Hydrothermal carbonization | Production of hydrochars for agricultural applications. | [35] |
| Slow pyrolysis | Biochar production, which can be applied as an organic fertilizer with promising results (e.g., K bioavailability). | [36] |
| Anaerobic digestion | Biofuel (methane) production; however the inoculum is usually stressed by the phenolics presence. | [7] |
| Dark fermentation | Production of H2 and conversion of the substrate mainly to VFAs (and/or ethanol). | [21] |
| Aerobic process | Good performance on organic compounds treatment and polyphenols degradation, however the organic load should be relatively low. | [37] |
| Compost production | Production of a nutrient-rich fertilizer; however, reduction in moisture is mandatory. | [15] |
Table 2.
Presentation of the tested runs under several pH and organic loading values.
| Run | A | B | C | D | E | F | G |
|---|---|---|---|---|---|---|---|
| pH | 4.5 | 5.0 | 6.0 | 7.0 | 7.5 | 6.0 | 6.0 |
| Average organic loading (g COD/L) | 40 | 40 | 40 | 40 | 40 | 125 | 80 |
Table 3.
Main physicochemical characteristics of the inoculum.
| Parameter | Unit | Average Value ± SD |
|---|---|---|
| pH | - | 8.89 ± 0.36 |
| Total solids | g/L | 39.05 ± 5.07 |
| Volatile solids | g/L | 33.26 ± 3.79 |
| Total suspended solids | g/L | 30.95 ± 4.70 |
| Volatile suspended solids | g/L | 27.13 ± 3.15 |
Table 4.
Physicochemical characterization of the OMW.
| Parameter | Unit | Average Value ± SD |
|---|---|---|
| pH | - | 5.41 ± 0.12 |
| Total COD | gO2/L | 125.63 ± 15.70 |
| Dissolved COD | gO2/L | 40.21 ± 0.04 |
| Total solids | g/L | 110.45 ± 1.20 |
| Volatile solids | g/L | 95.28 ± 1.22 |
| Total suspended solids | g/L | 22.67 ± 0.20 |
| Volatile suspended solids | g/L | 22.43 ± 0.24 |
| Total carbohydrates | gglucose/L | 15.36 ± 0.93 |
| Dissolved carbohydrates | gglucose/L | 11.40 ± 0.12 |
| Phenolic compounds | gsyringic acid/L | 1.28 ± 0.05 |
| TKN | g/L | 0.03 ± 0.003 |
| Ammonium nitrogen | g/L | 0.59 ± 0.05 |
| Fats and Oils | g/L | 2.23 ± 0.45 |
| Total phosphorus | g/L | 0.48 ± 0.01 |
| Dissolved phosphorus | g/L | 0.38 ± 0.01 |
| Alkalinity | gCaCO3/L | 0.98 ± 0.19 |
Table 5.
Optimal yields of various substrates under DF experiments, at pH value of 6.0.
| Substrate | Reactor Type | Temperature | H2 Yield | Other Metabolites | Reference |
|---|---|---|---|---|---|
| Cheese whey | batch | 39 ± 1 °C | 162 L/kg TOC | Max lactate yield (23 mmol/g TOC) | [48] |
| Swine wastewater pretreated with thermophilic bacteria | batch | 36 °C | 7.0 mL H2/g VSS | Acetate > Propionate > Butyrate > Valerate | [49] |
| Sugarcane vinasse (Pretreated 90 °C for 10 min) | batch | 37 °C | 4.75 mmol H2/g CODinfluent | Butyrate > Propionate > Acetate | [50] |
| Expired food products and used disposable nappies hydrolysate | batch | 37 ± 0.2 °C | 1.33 mol H2/mol glucose | Mainly Acetate and butyrate | [28] |
| Paddy straw after acid pretreatment | batch | mesophilic | 1.03 mol H2/mol glucose | Final VFAs of 3.45 g/L | [51] |
| OMW–Cheese whey–liquid cow manure (55:40:5 v/v/v) | batch | 37 °C | 0.642 mol H2/mol glucose | Butyrate >> Propionate > Acetate | [52] |
| Hydrothermal pretreated food wastes | CSTR | 55 ± 1 °C | 10.38 mL g−1 vs. h−1 Gas production rate (47% H2) | Butyrate > Acetate | [53] |
| Fruit/vegetable wastes and disposable nappies hydrolysate | CSTR | 37 ± 0.5 °C | 1.93 ± 0.17 L H2/Lfeed | 11.7 ± 3.4 g VFAs/L | [24] |
| OMW | batch | 55 ± 0.5 °C | 0.7 mol H2/mol glucose | Acetate > Butyrate > Ethanol | this study |
Where CSTR is continuous stirred tank reactor.
Publisher’s Note: MDPI stays neutral with regard to jurisdictional claims in published maps and institutional affiliations. |
© 2022 by the authors. Licensee MDPI, Basel, Switzerland. This article is an open access article distributed under the terms and conditions of the Creative Commons Attribution (CC BY) license (https://creativecommons.org/licenses/by/4.0/).
Share and Cite
MDPI and ACS Style
Tsigkou, K.; Sivolapenko, N.; Kornaros, M. Thermophilic Dark Fermentation of Olive Mill Wastewater in Batch Reactors: Effect of pH and Organic Loading. Appl. Sci. 2022, 12, 2881. https://doi.org/10.3390/app12062881
AMA Style
Tsigkou K, Sivolapenko N, Kornaros M. Thermophilic Dark Fermentation of Olive Mill Wastewater in Batch Reactors: Effect of pH and Organic Loading. Applied Sciences. 2022; 12(6):2881. https://doi.org/10.3390/app12062881
Chicago/Turabian StyleTsigkou, Konstantina, Natalia Sivolapenko, and Michael Kornaros. 2022. "Thermophilic Dark Fermentation of Olive Mill Wastewater in Batch Reactors: Effect of pH and Organic Loading" Applied Sciences 12, no. 6: 2881. https://doi.org/10.3390/app12062881
Note that from the first issue of 2016, this journal uses article numbers instead of page numbers. See further details here.