Article

Critical Materials Determination as a Complement to the Product Recycling Desirability Model for Sustainability in Malaysia

by
Al Amin Mohamed Sultan
1,*,
Yoong Qi Hang
2,
Wan Hasrulnizzam Wan Mahmood
3,
Mohd Shamsuri Md Saad
4 and
Paul Tarisai Mativenga
5
1
Fakulti Kejuruteraan Pembuatan, Universiti Teknikal Malaysia Melaka (UTeM), Hang Tuah Jaya, Melaka 76100, Malaysia
2
Infineon Technologies Sdn Bhd, Free Trade Zone Batu Berendam, Melaka 75350, Malaysia
3
Fakulti Teknologi Kejuruteraan Mekanikal dan Pembuatan, Universiti Teknikal Malaysia Melaka (UTeM), Hang Tuah Jaya, Melaka 76100, Malaysia
4
Institut Pengurusan Teknologi dan Keusahawanan, Universiti Teknikal Malaysia Melaka (UTeM), Hang Tuah Jaya, Melaka 76100, Malaysia
5
School of Mechanical, Aerospace and Civil Engineering, The University of Manchester, Manchester M13 9PL, UK
*
Author to whom correspondence should be addressed.
Appl. Sci. 2022, 12(7), 3456; https://doi.org/10.3390/app12073456
Submission received: 21 February 2022 / Revised: 22 March 2022 / Accepted: 24 March 2022 / Published: 29 March 2022
(This article belongs to the Special Issue Manufacturing Sustainability in a Circular Economy)

Abstract

:
End-of-life waste disposal is a major issue in Malaysia, where the country’s economy has suffered due to waste recovery issues. Many countries have successfully identified critical materials and products for increasing recycling rates, but not in Malaysia. Thus, the Malaysian government and businesses have had difficulty prioritising products for recycling. The absence of critical materials data has meant that a recovery strategy could not be planned wisely. In addition, the Product Recycling Desirability Model that was utilised by many countries to improve their recycling strategy could not be applied to Malaysia, as it requires critical materials data as input. To start with, Malaysia’s important materials have been identified. Next, two risk dimensions are defined: supply risk and material risk. The indicators are then weighted according to Malaysia’s scenarios. The scores are analyzed and applied to the Product Desirability Model to find desirable products for recycling. As a result, 89 materials were classified as critical to Malaysia’s economy, with palladium, rhodium, gold, platinum, and tellurium ranking first through to fifth. Critical materials scoring was used for the first time in Malaysia to comprehend the Product Recycling Desirability Model, a tool for prioritizing products for recycling. Additional analysis reveals that car batteries, tyres, PET bottles, mobile phones, and DVD-R are the top five most important recyclable products in Malaysia. With the material security database readily available and the novel evaluation system being employed to prioritize critical material supply, using risk supply and material security for Malaysia, the government, or private sector, can strategically start to implement recycling policies and initiatives to strengthen recycling efforts, which help to increase recycling rates.

1. Introduction

End-of-life products pose a significant issue as they are often disposed of in landfills. Recycling to recover usable materials has become a critical strategy for addressing these end-of-life waste issues because it avoids the extraction and refining of virgin raw materials [1,2,3]. It is not uncommon to recover materials such as steel, aluminum, cast iron, and rubber from end-of-life vehicles (ELVs). They may be recovered and repurposed to produce new materials for the manufacture of new vehicles or other products. Rubber tyres, for instance, can be recycled and reprocessed to produce a variety of secondary products [4]. In addition to this, the recycling process is also capable of extracting various valuable materials, including precious metals (i.e., palladium, platinum, gold, and silver) and rare earth elements (REEs).
Recent decades have seen an increase in the demand for REEs as mobile and electronic technology have advanced, with China currently dominating the market. REEs are commonly found in electronic devices and can be recovered from e-waste [5]. For instance, lithium-ion battery recycling could result in the recovery of steel, copper, iron, graphite, and cobalt [6]. By reclaiming materials, manufacturers can reduce costs and landfill usage [7], save up to 13 percent on batteries [8], decrease mining and extraction, and reap a variety of other benefits. However, only a small percentage of these end-of-life wastes are converted into useful products. For example, one percent of REEs and less than three percent of lithium batteries are recycled.
While countries like China and Australia are abundant in REE resources and are dominant exporters, a low recovery rate for REEs poses a threat to consumer countries, such as the United States and countries in the European Union, unless there is enough supply for industrialization. Supply and material restrictions are a problem that can happen in any country of the world, and they have a negative impact on the country’s economy. The challenge of overcoming this type of constraint has been addressed in numerous ways, including reducing a country’s reliance on critical resources. As a result of the urgency of this issue, numerous countries, including the U.S.A., countries in the EU, Japan, and Australia have begun implementing strategies to reduce the risk of breaches of critical infrastructure. Table 1 displays some examples of initiatives and strategies for mitigating critical material supplies.
A strong industrial base and a wide range of products and applications are critical to economies around the world, especially in modernised societies. The concept of material security has gained momentum globally as a way to assist regions in securing their raw material supplies, as a means of dealing with future challenges of material supply restrictions.

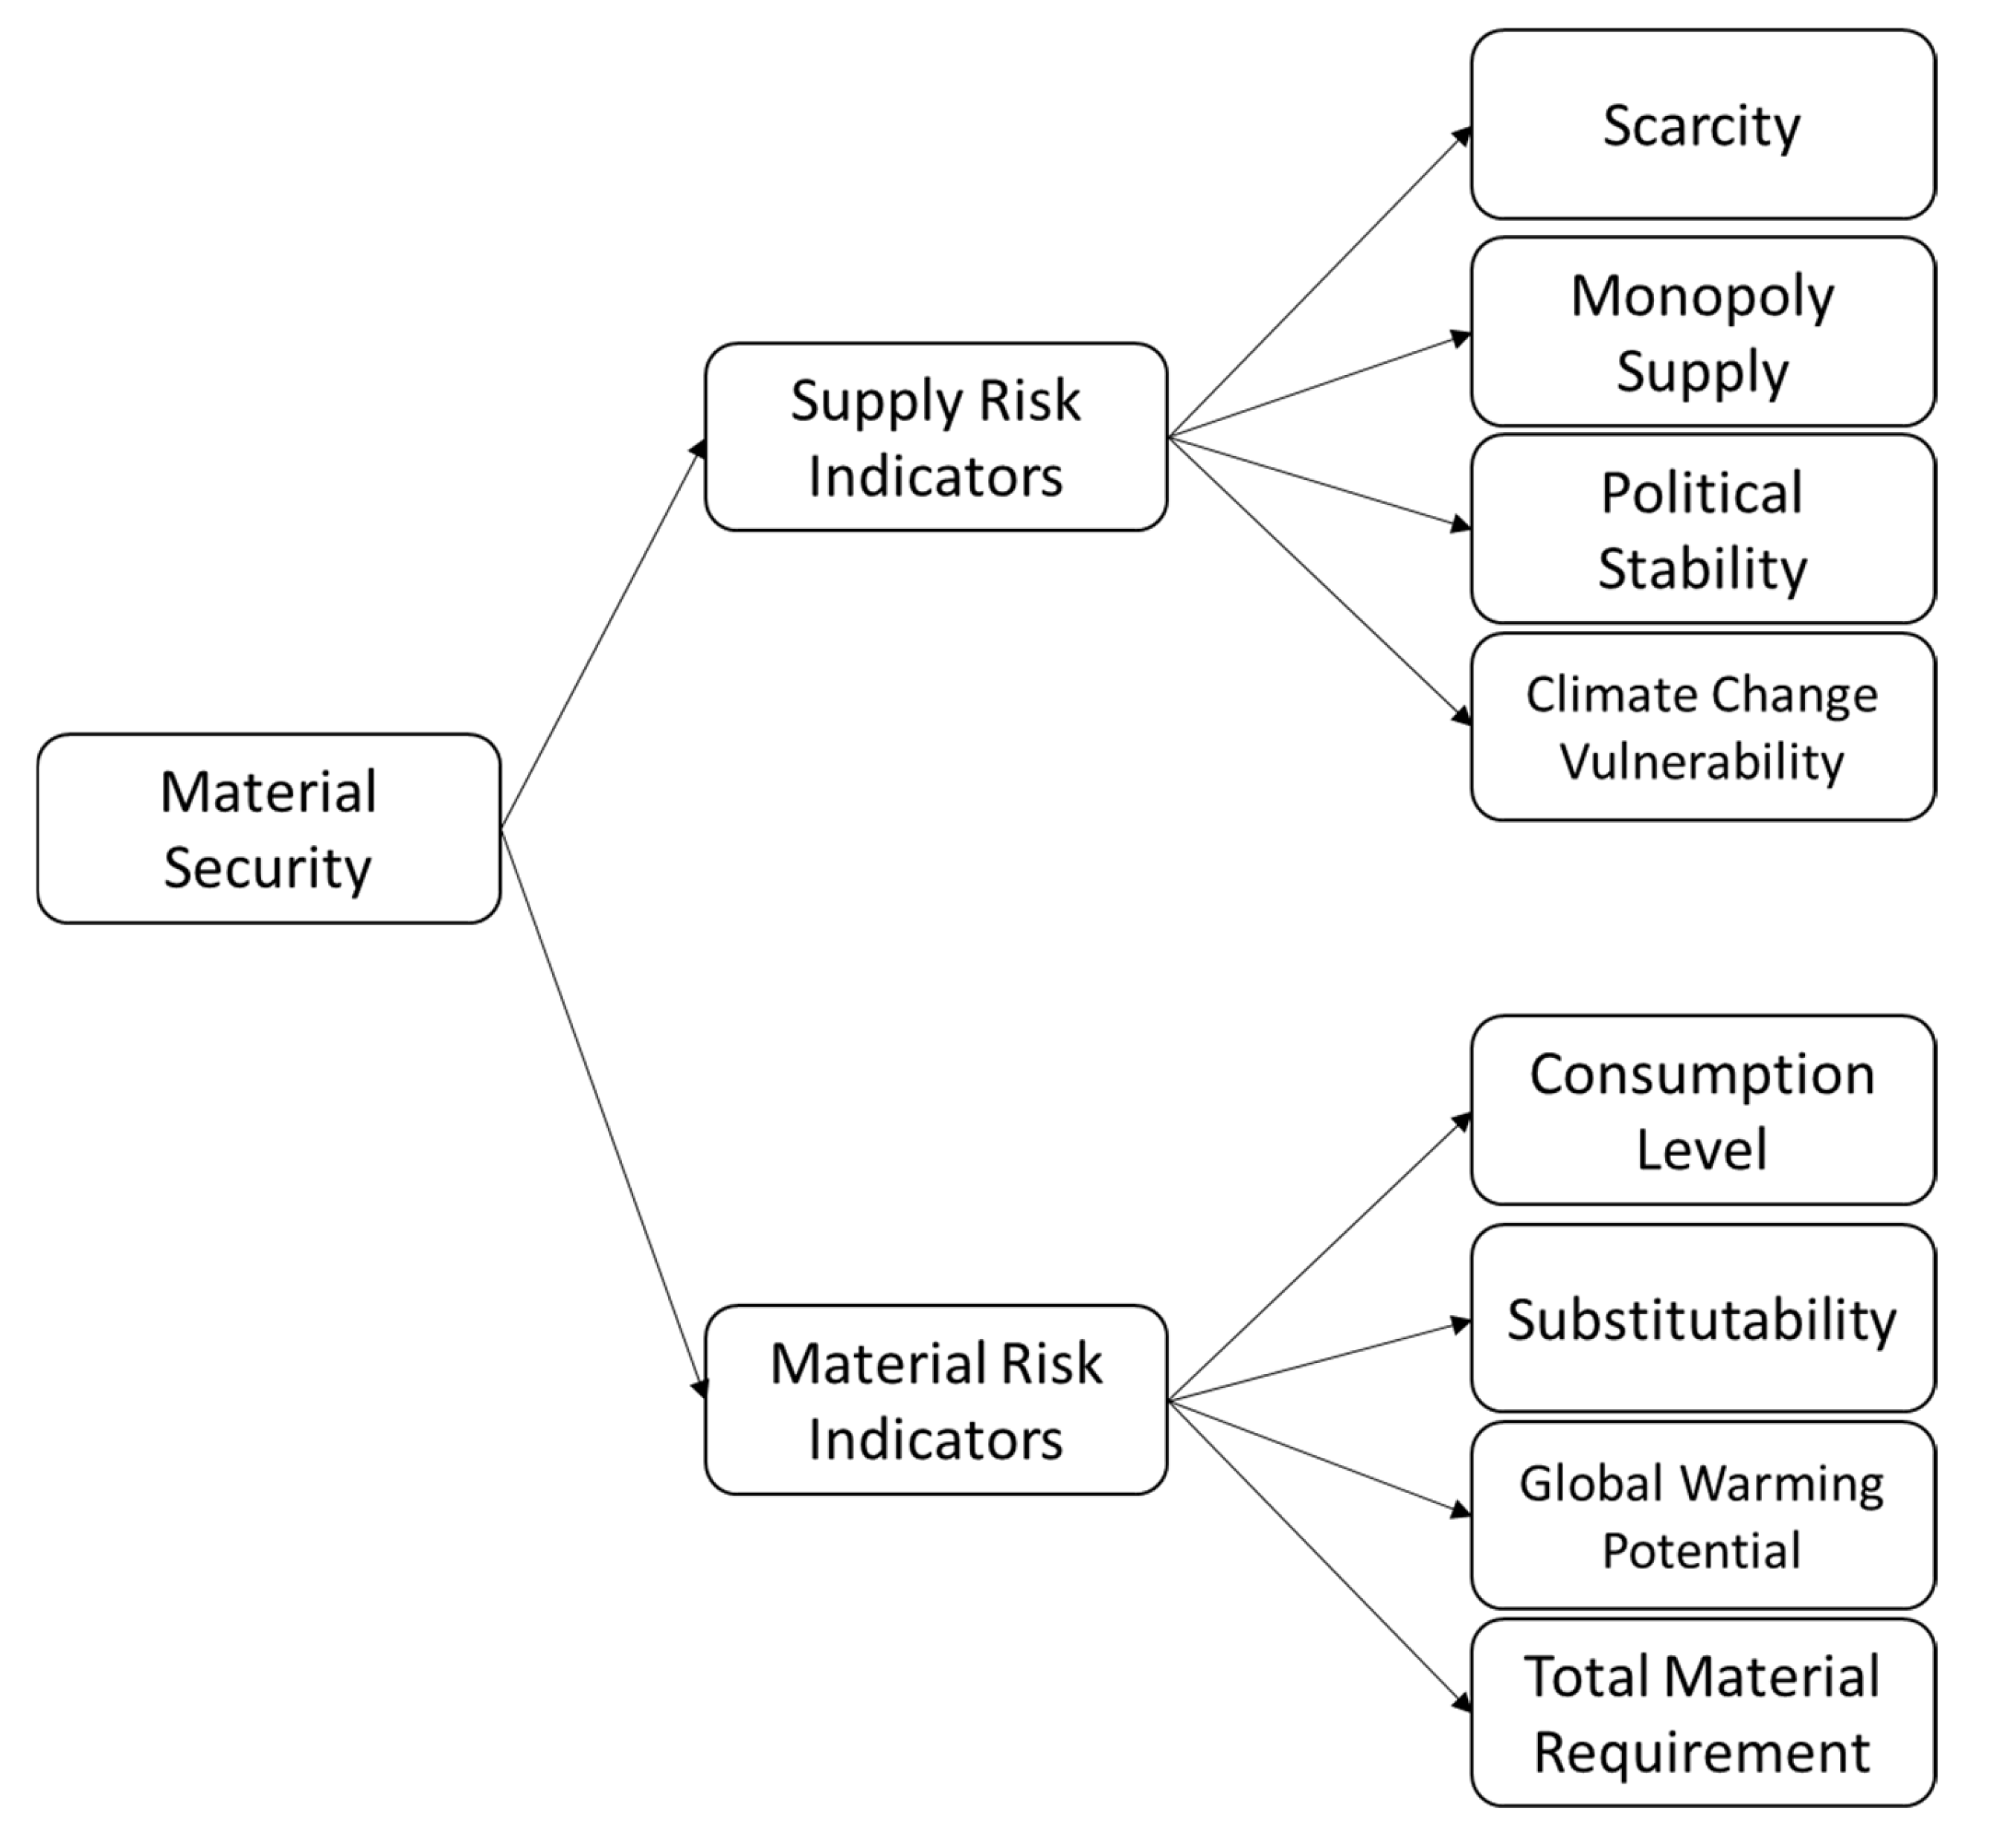
1.1. Material Security

Material security is a global economic concern, as it enables the identification of critical materials for a nation’s economy. It is critical in the selection of materials, product design, recycling of materials, and investment decision-making. Material security has been used interchangeably with material criticality, critical mineral security, and mineral resource security in some studies [10,11,12,13]. This has been explored by many researchers in several countries due to increasing demand for raw materials and rising supply risks globally [14,15,16,17].
Countries and businesses employ criticality assessments to identify and prioritize material resources in need of attention, as well as supply chain risk mitigation techniques [17,18]. This encompasses growing and new demand for materials from developing economies; increased need for a larger range of material inputs as a result of new technologies; concentrations of production; supply monopolies; and recognition of mining’s social and environmental effects. Material security is capable of sustaining economies, addressing environmental concerns, lowering industrial costs, and averting future material shortages [19]. This is because assessing material security enables the monitoring of a mineral’s use pattern across industrial sectors and the material’s contribution to the overall economy [11].
There are two main dimensions that are used to determine critical material: material risk and supply risk [17,20]. Material risk criteria include global consumption level, lack of substitutability, global warming potential, and total material requirement. Supply risk criteria include scarcity, monopoly supply, political instability, and vulnerability to effects of climate change [21]. The material security dimension, with classification of all the indicators under this framework by [22], is shown in Figure 1. There are several determinants that are necessary to assess supply risk, with five main determinants listed in many reports: geological, technical, political, environmental and social, and economic [23]. The geological, technological, and economic elements are comprised of two equally weighted indicators. One examines relative abundance of the metal, and the other percentage of the metal mined [10]. For the environmental and social indicators, these two indicators can influence and inhibit primary production.
Environmental factors are more likely to restrict material supply than physical scarcity. For example, international and national laws curbing greenhouse gas emissions may come to restrict the more carbon-intensive extraction processes required for a range of minerals. In the study by [21], two proxies for environmental impacts were used, which were global warming potential and total material requirement.
The assessment determining critical materials can be affected by future demand as well. Future demand is the key determinant of future availability. There are two factors that are used in criticality assessment, which are future demand projections and substitutability [19]. Normally, a material that is listed in a critical material list has a low mining rate and a low recycling rate, so it should improve its resource efficiency to prevent restriction of the material. The supply risk dimension goes beyond output concentration and takes into account other considerations, such as substitutability and recyclability. If a material has high functional substitutability, then this can lower its supply risk [11]. A summary explanation of critical material indicators is tabulated in Table 2.
Several countries have started to conduct studies considering material security as a vital factor, such as the countries in the European Union (EU) [24], the United Kingdom (UK) [21], the United States (US [25], India [11], Japan [13,26], Australia, South Korea and Russia [27]. In the EU, criticality of materials is used to strengthen industrial competitiveness by implementing EU industrial policy to increase the overall competitiveness of the EU economies. With critical materials for the EU identified, they can be used to prioritize needs and actions. Furthermore, it can help to promote the European production of critical raw materials and encourage the launch of new mining and recycling activities. In India, material security is established to deal with two main problems; a lack of suitable technology adoption and an inefficient policy mechanism to drive mining and exploration. Table 3 shows the critical materials for the UK [21], the EU [24], India [11], Australia [27] and Japan [13].
A mineral’s, or material’s, availability will be restricted when there are sudden supply shocks in the supply chain [28]. It can be more serious when there are no substitutes available for specific applications. The study on material criticality has the advantage of providing policymakers with a detailed analysis on the determinants of criticality associated with minerals, as well as the economic importance of minerals [11]. In the UK, a material security database classified 60 critical materials to ensure resource availability for the British economy [21]. The identified critical materials would assist the relevant stakeholders in making recommendations and suggestions for mitigating actions, including the need for investigation, and policies to reduce future supply restrictions [15,23]. This is possible by further working with the identified critical materials together with other relevant models or approaches, such as the Product Recycling Desirability Model [29].

1.2. Product Recycling Desirability Model

Although numerous approaches to increase recycling rates have been investigated in the literature, the Product Recycling Desirability Model (PRDM) was coined as a competent model for prioritizing product selection for recycling due to its successful application in several international cases, including those of the United States, the United Kingdom, the European Union, China, and India [29]. The model’s critical parameters were: (i) the ease with which the product’s components could be disassembled for recycling, (ii) the readiness of the recycling technology in place to carry out the recycling operation; and (iii) the criticality of the materials contained in end-of-life products, which make them prime candidates for recycling. Equation (1) shows the product desirability calculation by [29]. D D e s i r a b i l i t y is the desirability recycling index for the selected product and is calculated considering the index of ease to disassemble the end-of-life product, the product’s material security, and the recycling technology readiness index.
D D e s i r a b i l i t y = ( D S i m p l i c i t y + D M S I + D T R L )
Equation (2) illustrates the ease of material separation, D S i m p l i c i t y , considering mass fraction and distributed materials for parts. Where H is the inverted complexity measure which is known as the simplicity index.
D S i m p l i c i t y = 1 ( H H t o p )
It assesses the ease with which materials in a product can be disassembled quantitatively, as proposed by [30], using a complexity theory. A parameter H (bits) based on binary separation steps is used to quantify this. This is the collection of individual separations that are gradually required to separate a product’s materials. A product with fewer separation steps would have low material mixing, whereas a product with more separation steps would have higher material mixing.
Material security is the availability and access to the material resources upon which economies rely, as well as the capacity to withstand volatility, increasing scarcity, and rising price [29,31]. The presumption is that there will be no adverse effect on the country’s economy as a result of a shortage or restricted access to the specified substance. Material security is a negative indicator, implying a lack of scarcity in order to achieve the lowest acceptable limit, rather than a positive requirement for abundance. The material security index for recycling, D M S I is shown in Equation (3). Where n is the maximum number of a material type in the product, M i and M T are the mass of material, or part in a product and total product mass respectively. S i is the material security index of recycling a particular material that is part of a product assembly and S t o p is the top scale for the material security index.
D M S I = i = 1 n ( M i S i M T S t o p )
Technology Readiness (TRL) is a method for determining technological maturity. TRL looks at program conceptions, technological needs, and proven technological capabilities. The TRL of the United States National Aeronautics and Space Administration (NASA) inspired this notion [32]. TRL refers to a classification of recycling methods for various materials in this model, with the assumption that it can be done for a certain country and geographic region, taking into consideration locally accessible technologies [29].
The recycling technology readiness desirability is represented by parameter D T R L in Equation (4), which takes into account the maturity of recycling technology. Where n is the maximum number of a particular recycling technology used in a product, M i and M T are the mass of the discrete material in a product or component and the total product mass, respectively.
D T R L = i = 1 n ( M i R i M T R t o p )
Once the product recycling desirability index is determined, the various product distributions can be mapped through the ‘What Should be Recycled Model’ to better illustrate their importance for recycling, by considering monetary implication [29]. For instance, car batteries, mobile phones, plastic bottles, and computers are the preferred end-of-life products for recycling in the UK.
The Product Recycling Desirability Model was regarded as ideal for developing countries such as Malaysia in order to re-orient their recycling initiatives. However, the absence of a material security database has precluded this approach from being properly applied to the Malaysian scenario. Thus, this paper determined the critical materials data and elaborated on the novel evaluation system to prioritize critical material supply using risk supply and material security for Malaysia. The finding could be used as data input for assessing end-of-life product selection for product recovery planning. This can be further extended to evaluate the Product Recycling Desirability Model based on its economic importance in Malaysia. By doing so, the majority of the end-of-life products that are currently sent to landfills could be recovered by initiating strategic action; starting with the products that possess the highest priority environmentally and economically.

2. Methodology

In order to assess critical materials, there are four phases to be executed, which are: (i) selecting the critical material for the economy; (ii) selecting the relevant dimensions and indicators; (iii) scoring of the indicators in relation to the identified scenarios of the country; and (iv) data analysis. The entirety of the phases used to determine critical materials are explained as below:
Phase 1: Material Security Selection.
In Phase 1, the materials are selected, mainly based on the Malaysia Mineral Yearbook, published by the Minerals and Geoscience Department Malaysia [33] and Malaysia Mineral Yearbook advance release [34], which provides information on materials in Malaysia, such as operating mines in Malaysia, material annual production in global and local markets, material prices, and the amount of material imported and exported. The information and data in the mineral yearbook are sufficient for the scoring process in Phase 3. Secondly, famous materials in the global material list were identified through the databases of several countries’ lists as benchmarks for comparison, such as the databases from the UK, the US, India, Japan, the EU, and Australia. A Two-Dimensional Material Security Matrix was deployed for the evaluation and assessment of material security by [22,25,35].
Phase 2: Selecting Dimensions and Indicators
The established dimensions of supply risk and material risk are referred to [22]. The indicators are scarcity (SC), monopoly of supply (MS), political stability (PS), vulnerability to climate change (VCC), consumption level (CL), substitutability (SUB), global warming potential (GWP), and total material requirement (TMR).
Phase 3: Scoring
The scoring matrix used to determine the material’s score is shown in Table 4. The higher the scoring matrix, the higher the material security and criticality, as referred to by [10,24,25].
Phase 4: Data Analysis.
The determined scores for each case in relation to the identified materials from Phase 3 will be further extended by integrating those scores to get one unified overall score. The top value of this overall score would be 24, as each indicator is valued at a score of 3 for maximum value, and the lowest score would be 8, reflecting the lowest score for each indicator were set at one. Once all the phases are completed, additional analytical inclusion of several applications of the data to the Product Recycling Desirability Model were presented.

3. Data of the Critical Materials for Malaysia

After the completion of the entire four phases, a set of 89 materials were classified as important to the Malaysian economy, with different levels of criticality. Each parameter was analyzed and referred to the genuineness of the score based on the specific justifications for each. The top five materials that dominated the critical list are palladium, rhodium, gold, platinum, and tellurium, with scores of 19 and 18, while the top value for the score is 24. It is not surprising that the entire platinum group of metals and the rare earth elements were on the list. Table 5 shows the top 28 critical materials data for the Malaysian economy, concerning the four supply risk elements and four material risk factors for each material. The full data is available in Table A1.

4. Discussions

4.1. Supply Risk and Material Risk and Grouping of the Materials

Table 6 shows the pattern of the material security matrix by comparing the scores of supply risk and material risk. Both of these impacted the final score of material criticality. The materials distributed in the right upper corner have higher scores for both factors, whereas the materials listed in the opposite direction have lower score values. As an example, materials such as palladium, rhodium, platinum, gold, and tellurium were positioned towards the top right corner of the table, and the scores for both elements ranged from eight to nine and nine to eleven for supply risk and material risk, respectively. The five materials in the very left bottom corner are labelled as the least critical materials, which are iron, zirconium, copper, feldspar, and titanium.
Table 7 shows the entire 89 material positions in the criticality classification for the Malaysian economy. Based on the developed score, the materials could be grouped into seven main material security levels. There are two materials with the highest score of 19, three with a score of 18, and eleven materials in a group with a score of 17, 32 materials with a score of 16, 26 materials with a score of 15, and 12 materials with a score of 14. The bottom groups, with a score of 11 and 13, have two materials respectively. The most critical materials are palladium and rhodium, while the least critical are steel and iron. Apart from the materials in the list, the rest of the materials are considered not critical or yet to be explored for the Malaysian economy.

4.2. International Comparison on Material Security

The international comparison of top 20 critical materials for various countries is shown in Section 1.1. Malaysia was omitted since the data were not available in the literature but were discovered during the analysis of critical materials. Table 8 compared Malaysia’s ten key materials to those in the UK [21], the EU [24], India [11], Australia [27] and Japan [13]. It can be seen that REEs dominate the list, with different ranks for different countries. This is due to the specific reason that the materials are deemed important to the relevant country’s economy, especially in relation to supply risk and material risk.
For Malaysia, the top five materials that are most important to the economy, and possess the highest potential for material recovery, are palladium, rhodium, gold, platinum, and tellurium. While for the UK, the top five materials for recycling selection are gold, rhodium, mercury, platinum, and strontium, and for the European Union, dysprosium, magnesium, samarium, gadolinium, and rhodium. Although the materials are varied, there is one material that is considered critical for all of these countries, rhodium. For India, the five top materials for recycling selection are strontium, phosphate, potash, vanadium, and boron, while for Australia they are gallium, indium, tungsten, cobalt, and niobium, and for Japan, neodymium, dysprosium, indium, niobium, and tin.

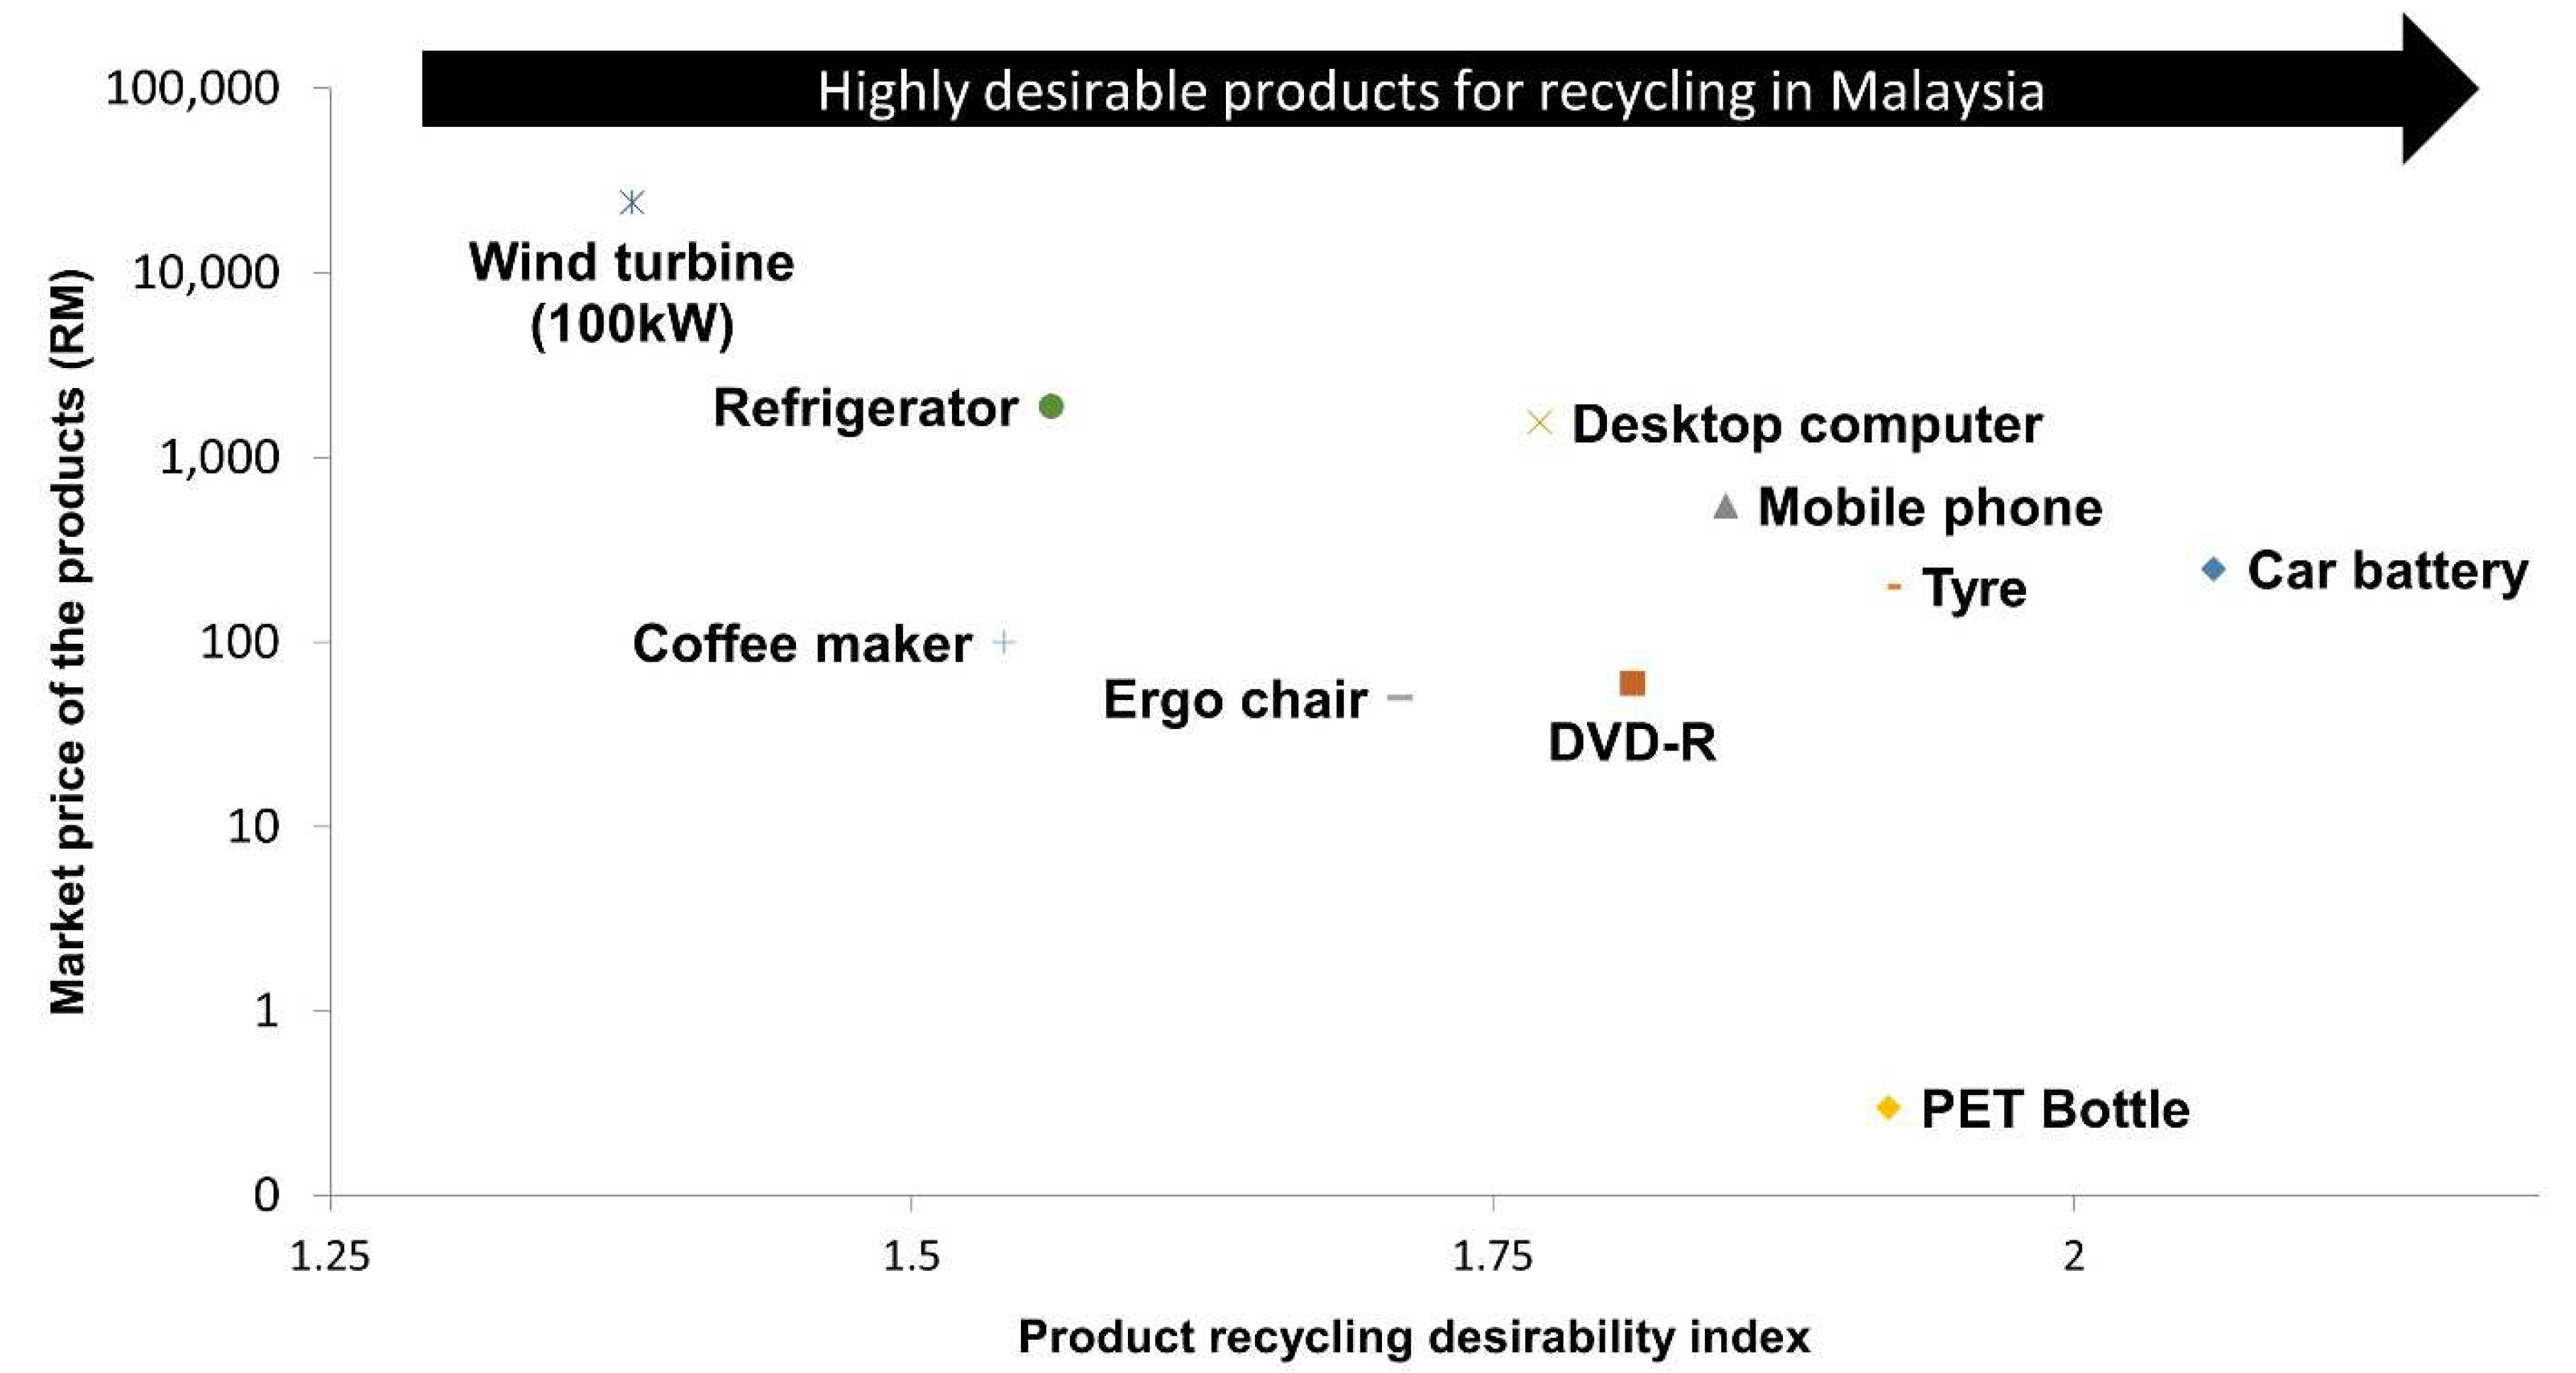
4.3. The Application of Malaysia’s Critical Material on Product Recycling Desirability

Product recycling desirability is exploited after Phase 4 is completed, since that output becomes the vital input parameters. Equation (1) is used to calculate the product recycling desirability index, D D e s i r a b i l i t y . The desirability recycling index for the selected product considers the index of ease to disassemble the end-of-life product, and the product’s material security and recycling technologies readiness index. For the Malaysian scenario, product recycling desirability is utilised for the first time after the material security score has been developed. Equations (1)–(4) on product desirability are consistent with [30] and were used to calculate D D e s i r a b i l i t y . For comparative purposes, a similar range of products as those analysed by [30] were used in this paper. Table 9 tabulated the results obtained for product recycling desirability based on importance for Malaysia’s economy. The individual indices, in terms of the simplicity index, material security index, and recycling technology readiness index, were shown for all of the products, together with the final score of the recycling desirability index.
The entire distribution of products based on recycling desirability for Malaysia is shown in Figure 2. The x-axis represents the recycling desirability index, and the y-axis represents the price of the product on the market. Noteworthy is the fact that the products distributed towards the right side of the x-axis of the chart are considered to have increasing desirability and, as a result, should be given priority to be the best candidates for recycling.
For example, the car battery is the most desirable product for recycling consideration, and the wind turbine would be the least preferred for recycling. There could be an occasion where market price could be used as a second indicator for decisions. For example, both tyres and PET bottles obtained 1.92 to be the next candidates for recycling preferences, and it could be difficult to choose which one. Market price could be a second indicator at this time. As PET bottles have a lower market price, tyres would be the choice. However, this is not the only way, as other criteria could be included as well; such as the number of recycling units collected for recycling or current demand for reclaimed recyclates.

4.4. International Comparison of the Product Recycling Desirability Index

The product recycling desirability index for Malaysia is compared with other countries. The product recycling desirability index indices for the UK, the EU, the USA, and India were taken from earlier research [29]. Table 10 shows the comparative indices of the products between those countries and Malaysia.
It is clear that car batteries and PET bottles are the most desirable products for recycling consideration in all countries, and this is consistent for Malaysia too. It is not surprising that car batteries are the most popular candidate for recycling, due to their lead and arsenic contents and the readily available technology for recycling operations. The take-back scheme, that offers monetary gain for returning car batteries for recycling, further boosts the choice. While for PET bottles, desirability for recycling is due to the non-complex product composition and mature recycling facilities. The third product on the list is the car tyre, which is significant because natural rubber is critical for Malaysia, as it is for the EU, but not for the UK or India. The wind turbine is considered the last product for recycling in all the countries, but, among them, Malaysia obtained a particularly low score (1.38) compared to others, ranging from 1.68 to 1.71. This is due to the fact that relevant recycling technology is still at the laboratory stage. It is worth mentioning that a wind turbine was included in the analysis only for comparative purposes. It is not a common product in use in Malaysia.

5. Conclusions

This paper has successfully identified 89 materials for critical materials data relevant to Malaysia, by considering material risk and supply risk for Malaysia. The indicators used to assess material security are material scarcity, monopoly supply, political stability, vulnerability to climate change, consumption level, substitutability, global warming potential, and total material requirements. Based on the analysis, the top five insecure materials for Malaysia are palladium, rhodium, gold, platinum, and tellurium. The Product Recycling Desirability Model that was previously incompetent for Malaysia has now been successfully utilised and it has revealed that car batteries, PET bottles, tyres, mobile phones, and DVD-R are the most desirable end-of-life products for recycling in Malaysia. These findings could be used as one of the strategic decision tools in prioritising products for recycling in Malaysia, while the determination of critical materials could be used by local authorities, companies, or relevant stakeholders as one of the important considerations to boost recycling initiatives towards sustainable product consumption. The critical materials data established in this paper has opened up a new research exploration perspective, in which material security-related research can be pursued further, including, but not limited to, chemistry, geology, and other material-related scientific disciplines. Although the data are exhaustive, they are date-stamped to demonstrate that the materials’ criticality values may vary in the future. In that situation, the criticality scores could be recalculated. The Product Recycling Desirability Model was used to determine the most effective product for recycling. Although this model has worked well for many countries, it is not the only way to use this data. The criticality data could be used for different recycling prioritization models, which can be customised depending on the data input that is needed.

Author Contributions

Investigation, A.A.M.S. and Y.Q.H.; Methodology, A.A.M.S.; Software, Y.Q.H.; Supervision, A.A.M.S.; Validation, P.T.M.; Visualization, M.S.M.S.; Writing—original draft, A.A.M.S. and Y.Q.H.; Writing—review & editing, A.A.M.S., W.H.W.M., M.S.M.S. and P.T.M. All authors have read and agreed to the published version of the manuscript.

Funding

This research was funded by Universiti Teknikal Malaysia Melaka (UTeM) and the Ministry of Education Malaysia grant number RACER/1/2019/TK03/UTEM//4 (RACER/2019/FKP-COSSID/F00411).

Institutional Review Board Statement

Not applicable.

Informed Consent Statement

Not applicable.

Data Availability Statement

Not applicable.

Acknowledgments

The authors are grateful to Universiti Teknikal Malaysia Melaka (UTeM) and the Ministry of Education Malaysia for the financial support through RACER/1/2019/TK03/UTEM//4 (RACER/2019/FKP-COSSID/F00411).

Conflicts of Interest

The authors declare no conflict of interest.

Appendix A

Table A1. The full list of 89 critical materials for Malaysia.
MaterialSymbolSupply RiskTotalMaterial RiskTotalCriticality Score
SCMSPSSCCSRCLSubGWPTMRMR
PalladiumPd3 222922331019
RhodiumRh2222823331119
GoldAu3122831331018
PlatinumPt322292133918
TelluriumTe2222823231018
AmmoniaNH3222282322917
BromineBr222282322917
IndiumIn322292132817
MolybdenumMo222282322917
NiobiumNb233191322817
OsmiumOs222282223917
Phosphate rock-222282322917
RutheniumRu222282322917
StrontiumSr222282322917
ThalliumTl222282322917
YttriumY222282322917
Andalusite-222282222816
BariumBa222282222816
BaryteBaSO4222281322816
BorateBO3222282222816
CeriumCe222282222816
DysprosiumDy222282222816
ErbiumEr222282222816
EuropiumEu222282222816
Fluorspar-222282312816
GadoliniumGd222282222816
GalliumGa222282132816
HafniumHf222282222816
HeliumHe222282222816
HolmiumHo222282222816
IodineI222282222816
IridiumIr222282222816
LanthanumLa222282222816
LutetiumLu222282222816
Mercury-222282132816
Natural rubber-222282222816
NeodymiumNd222282222816
NickelNi322292122716
PraseodymiumPr222282222816
PromethiumPm222282222816
SamariumSm222282222816
Silicon metal-222282222816
TantalumTa2121633221016
TerbiumTb222282222816
ThuliumTm222282222816
TinSn322292122716
UraniumU222282222816
YtterbiumYb222282222816
AluminiumAl222282122715
AntimonySb322292121615
Asbestos-222282122715
Bentonite-222282212715
BerylliumBe222282122715
BismuthBi222282122715
CadmiumCd222282122715
ChromiumCr122272321815
CobaltCo222282122715
Diamonds (unit in carat)-222282122715
Diatomite-222282122715
GermaniumGe222282122715
GraphiteC222282212715
Kyanite-222282122715
LeadPb322292112615
Lime-222281222715
LithiumLi222282122715
Mica-222282122715
RheniumRe222282122715
ScandiumSc222282122715
SilverAg313181132715
Soda ash-222282122715
Talc-222282122715
ThoriumTh222282122715
TungstenW222282122715
VanadiumV222282122715
ArsenicAs222282121614
BoronB222282121614
CopperCu312172122714
Feldspar-213172122714
Kaolin-212162222814
MagnesiumMg222282121614
ManganeseMn212161322814
Perlite-222282112614
SeleniumSe222282121614
TitaniumTi221272122714
Vermiculite-222282112614
ZincZn322292111514
SiliconSi222281121513
ZirconiumZr221271122613
Iron & SteelFe122271111411
SC—Scarcity, MS—Monopoly of Supply, PS—Political Stability, VCC—Vulnerability to Climate Change, SR—Supply Risk, CL—Consumption level, Sub—Substitutability, GWP—Global Warning Potential, TMR—Total Material Requirements, MR—Material Risk.

References

  1. Chen, J.M.; Chi, C.Y. Reverse channel choice in a closed-loop supply chain with new and differentiated remanufactured goods. J. Ind. Prod. Eng. 2019, 36, 81–96. [Google Scholar] [CrossRef]
  2. Sadeghi Ahangar, S.; Sadati, A.; Rabbani, M. Sustainable design of a municipal solid waste management system in an integrated closed-loop supply chain network using a fuzzy approach: A case study. J. Ind. Prod. Eng. 2021, 38, 323–340. [Google Scholar] [CrossRef]
  3. Tseng, M.L.; Tran, T.P.T.; Ha, H.M.; Bui, T.D.; Lim, M.K. Sustainable industrial and operation engineering trends and challenges Toward Industry 4.0: A data driven analysis. J. Ind. Prod. Eng. 2021, 38, 581–598. [Google Scholar] [CrossRef]
  4. Bott, R. Environmental benefits of recycling. Wrap 2014, 1, 1–5. [Google Scholar] [CrossRef]
  5. Joseph, C.V.; Yunus, M.Y.M.; Ismail, N.A.; Kanthasamy, R. Economic potential assessment of neodymium recovery from Malaysia e-waste resource. Mater. Today Proc. 2019, 17, 707–716. [Google Scholar] [CrossRef]
  6. Mossali, E.; Picone, N.; Gentilini, L.; Rodrìguez, O.; Pérez, J.M.; Colledani, M. Lithium-ion batteries towards circular economy: A literature review of opportunities and issues of recycling treatments. J. Environ. Manag. 2020, 264, 110500. [Google Scholar] [CrossRef] [PubMed]
  7. Wong, Y.C.; Al-Obaidi, K.M.; Mahyuddin, N. Recycling of end-of-life vehicles (ELVs) for building products: Concept of processing framework from automotive to construction industries in Malaysia. J. Clean. Prod. 2018, 190, 285–302. [Google Scholar] [CrossRef]
  8. Sonoc, A.; Jeswiet, J.; Soo, V.K. Opportunities to improve recycling of automotive lithium ion batteries. Procedia CIRP 2015, 29, 752–757. [Google Scholar] [CrossRef]
  9. Barteková, E.; Kemp, R. Critical Raw Material Strategies in Different World Regions (Issue 31). 2016. Available online: https://www.merit.unu.edu/publications/wppdf/2016/wp2016-005.pdf (accessed on 23 August 2021).
  10. Graedel, T.E.; Barr, R.; Chandler, C.; Chase, T.; Choi, J.; Christoffersen, L.; Friedlander, E.; Henly, C.; Jun, C.; Nassar, N.T.; et al. Methodology of metal criticality determination. Environ. Sci. Technol. 2012, 46, 1063–1070. [Google Scholar] [CrossRef]
  11. Gupta, V.; Biswas, T.; Ganean, K. Critical Non-Fuel Mineral Resources for India’s Manufacturing Sector: A Vision for 2030; Department of Science and Technology, Government of India: New Delhi, India, 2016.
  12. Andersson, P. Chinese assessments of “critical” and “strategic” raw materials: Concepts, categories, policies, and implications. Extr. Ind. Soc. 2020, 7, 127–137. [Google Scholar] [CrossRef]
  13. Hatayama, H.; Tahara, K. Criticality assessment of metals for japan’s resource strategy. Mater. Trans. 2015, 56, 229–235. [Google Scholar] [CrossRef] [Green Version]
  14. Wang, P.; Kara, S. Material criticality and circular economy: Necessity of manufacturing oriented strategies. Procedia CIRP 2019, 80, 667–672. [Google Scholar] [CrossRef]
  15. Kastanaki, E.; Giannis, A. Forecasting quantities of critical raw materials in obsolete feature and smart phones in Greece: A path to circular economy. J. Environ. Manag. 2022, 307, 114566. [Google Scholar] [CrossRef] [PubMed]
  16. Černý, I.; Vaněk, M.; Maruszewska, E.W.; Beneš, F. How economic indicators impact the EU internal demand for critical raw materials. Resour. Policy 2021, 74, 102417. [Google Scholar] [CrossRef]
  17. Helbig, C.; Schrijvers, D.; Hool, A. Selecting and prioritizing material resources by criticality assessments. One Earth 2021, 4, 339–345. [Google Scholar] [CrossRef]
  18. Schrijvers, D.; Hool, A.; Blengini, G.A.; Chen, W.Q.; Dewulf, J.; Eggert, R.; van Ellen, L.; Gauss, R.; Goddin, J.; Habib, K.; et al. A review of methods and data to determine raw material criticality. Resour. Conserv. Recycl. 2020, 155, 104617. [Google Scholar] [CrossRef]
  19. Speirs, J.; Houari, Y.; Gross, R. Materials Availability: Comparison of material criticality studies—Methodologies and results Working Paper III. UK Energy Res. Cent. 2013, 30, 5–22. [Google Scholar]
  20. Schrijvers, D.; Blengini, G.A.; Cimprich, A.; Chen, W.; Correia, V.; Eggert, R.; Gupta, V.; Hagelüken, C.; Hirohata, A.; Ku, A.; et al. Material Criticality: An Overview for Decision-Makers. May 2020. Available online: https://irtc.info/brochure/ (accessed on 25 August 2021).
  21. Morley, N.; Eatherley, D. Material Security: Ensuring Resource Availability for the UK Economy; C-Tech Innovation Ltd.: Capenhurst, UK, 2008; pp. 1–36. [Google Scholar]
  22. Erdmann, L.; Graedel, T.E. Criticality of non-fuel minerals: A review of major approaches and analyses. Environ. Sci. Technol. 2011, 45, 7620–7630. [Google Scholar] [CrossRef]
  23. Lloyd, S.; Lee, J.; Clifton, A.; Elghali, L.; France, C. Recommendations for assessing materials criticality. Proc. Inst. Civ. Eng. Waste Resour. Manag. 2012, 165, 191–200. [Google Scholar] [CrossRef] [Green Version]
  24. Sébastien, S.; Kong, M.A.; Planchon, M.; Saidi, N.; Devauze, C.; Petavratzi, E.; Gunn, G.; Brown, T.; Shaw, R.; Lefebvre, G.; et al. Study on the review of the list of Critical Raw Materials Criticality Assessments. In Office of the European Union (Issue 2); European Commission: Luxembourg, 2017. [Google Scholar] [CrossRef]
  25. Fortier, S.M.; Nassar, N.T.; Lederer, G.W.; Brainard, J.; Gambogi, J.; McCullough, E.A. Draft Critical Mineral List—Summary of Methodology and Background Information—U.S. Geological Survey; US Geological Survey: Reston, VA, USA, 2018; Volume 3359, pp. 1–26.
  26. Hatayama, H.; Tahara, K. Evaluating the sufficiency of Japan’s mineral resource entitlements for supply risk mitigation. Resour. Policy 2015, 44, 72–80. [Google Scholar] [CrossRef]
  27. Bortnikov, N.S.; Volkov, A.V.; Galyamov, A.L.; Vikent’ev, I.V.; Aristov, V.V.; Lalomov, A.V.; Murashov, K.Y. Mineral resources of high-tech metals in Russia: State of the art and outlook. Geol. Ore Depos. 2016, 58, 83–103. [Google Scholar] [CrossRef]
  28. Mohamed Sultan, A.A.; Mativenga, P.T. Sustainable Location Identification Decision Protocol (SuLIDeP) for determining the location of recycling centres in a circular economy. J. Clean. Prod. 2019, 223, 508–521. [Google Scholar] [CrossRef]
  29. Sultan, A.A.; Lou, E.; Mativenga, P.T. What should be recycled: An integrated model for product recycling desirability. J. Clean. Prod. 2017, 154, 51–60. [Google Scholar] [CrossRef]
  30. Dahmus, J.; Gutowski, T. Material Recycling at Product End-of-Life. In Proceedings of the 2006 IEEE International Symposium on Electronics and the Environment, Scottsdale, AZ, USA, 8–11 May 2006; Volume 2, pp. 206–211. [Google Scholar] [CrossRef]
  31. Eco-Innovation. Glossary of Terms Used in the Eco-Innovation Observatory. European Commission’s Directorate-General for the Environment. 2015. Available online: http://www.eco-innovation.eu/ (accessed on 23 August 2020).
  32. Straub, J. In search of technology readiness level (TRL) 10. Aerosp. Sci. Technol. 2015, 46, 312–320. [Google Scholar] [CrossRef]
  33. Minerals and Geoscience Department Malaysia. Malaysian Minerals Yearbook 2013; Minerals and Geoscience Department Malaysia: Sabah, Malaysia, 2014.
  34. Spencer, B. 2016 Minerals Yearbook Malaysia [Advance Release] (Issue May). 2021. Available online: https://www.usgs.gov/media/files/mineral-industry-malaysia-2016-pdf (accessed on 23 January 2022).
  35. NRC. Minerals, Critical Minerals, and the U.S. Economy—Report in Brief; NRC: Washington, DC, USA, 2008. [Google Scholar]
Figure 1. The framework of material security dimensions and indicators.
Applsci 12 03456 g001
Figure 2. Product distributions based on desirability for recycling for Malaysia.
Applsci 12 03456 g002
Table 1. Strategies for mitigating critical materials in the world [9].
RegionCharacteristicsInitiativesStrategies
China
  • Resource rich.
  • Dominant producer.
  • Largest REEs supplier and consumer.
  • Increase competitiveness among local manufacturers.
  • Hold back REEs for domestic purpose.
  • Protect exploitation of REEs.
  • Avoid restriction of REEs in future.
  • Reduce availability of raw materials.
  • Declare REEs as protected and strategic materials.
  • Introduce several industrial policies to control the exploitation of REEs.
  • Offer grants and loans to countries in exchange for access to their raw materials.
  • Implement circular economy as new economic model.
  • Apply Reduce, Reuse and Recycle (3R) in production process.
USA
  • REE dominator in second half of 20th century.
  • REE goods manufacturer such as neodymium-iron-boron-magnetic powders.
  • Assure materials availability for national economic well-being.
  • Solve environmental problems.
  • Limit availability of REEs.
  • Change in geopolitics in late 1980s.
  • China tightens its REE export quotas.
  • Devise policies targeting the environment.
  • Establish a list of critical materials to the US economy.
  • Establish an agency for maximising domestic mineral resource development and environmental mitigation.
  • Provide funding for development of techniques which improve separation and decrease cost of processing REEs.
  • Develop substitute materials and technology and eliminate the use of critical materials in certain industries.
  • Develop recovery and separation technology for REEs from electronic waste.
Europe
  • Resource poor.
  • Low production of metallic minerals.
  • High import dependence on raw materials.
  • Low exploration and development of minerals.
  • Main REE sources are from finished good products.
  • Maintain access to sources of supply.
  • Insufficient data of availability of minerals.
  • Reduce the environmental impact of the industry.
  • Improve material and energy efficiency.
  • Sustain the supply of raw materials.
  • Decrease import dependence on raw materials.
  • Recycle waste and substitute other materials to prevent shortage of certain materials.
  • Promote domestic exploration of raw materials.
  • Identify the most critical materials and update the mining inventory.
  • Focus on recycling projects and increase R&D in substitution.
  • Develop policies in management of raw materials.
Japan
  • Resource poor.
  • Highly dependent on import minerals.
  • Economy significantly dependent on refining REEs into metals and alloys.
  • REE products manufacturer.
  • Largest consumer of dysprosium (one of the REEs).
  • Economic warfare during World War 2.
  • Reduce import dependency on certain raw materials.
  • Sustain economic security.
  • Lower the usage of REEs.
  • Japan’s government declare policies that support material exploration and development.
  • Focus on recycling and stockpiling of rare metals.
  • Improve resource security by increasing self-sufficiency by launching Strategic Energy Plan.
  • Recycle scrap and end-of-life products.
  • R&D in recycling technology.
  • Collect end-of-life products and transform into secondary supply of raw materials.
Australia
  • Major minerals exporters.
  • Leader in extracting several raw materials including REEs.
  • Increase in metals’ prices.
  • Increase international competitiveness.
  • Sustain resources’ availability.
  • Provide secure supply of REEs.
  • Increase investor confidence in resources sector.
  • Improve regulatory environment.
  • Declare REEs as critical minerals due to high resource potential.
  • Provide information on sustainable mining practices to mine managers and other related departments.
  • Design a framework to support minerals’ development.
  • Develop methods to extract REEs with better energy efficiency.
Table 2. Descriptions of critical material security indicators, adapted from [21].
DimensionsDescriptions
Consumption LevelsFor some materials, data on total annual use is available. This data shows how reliant national or global economies are on the material’s future availability.
SubstitutabilityThe readier a substance is to be replaced by another; the more secure economies will be regarding future supply shortages. In some cases, copper can be replaced by aluminum, a more common metal. However, substitutes for magnesium, required to harden steel, are few.
Global Warming PotentialThe Eco Invent database provides the GWP over 100 years in kg CO2 equivalents generated per kilogram of material mined. The GWP of minerals varies greatly. For example, a kilogram of platinum requires almost 15 tonnes of CO2 equivalents to mine and beneficiate, while the same weight of aluminum from bauxite requires only 8 g.
Total Material RequirementThe total weight of rocks and other substrate mined to obtain a given weight of metal or other mineral also provides a rough indication of environmental impact.
ScarcityPhysical scarcity has a clear impact on a material’s overall security, but determining scarcity is notoriously difficult. Japan’s National Institute for Material Science recently presented predictions for which metals’ reserves, and, in some cases, reserve bases, will be depleted by 2050. Aluminum consumption, for example, is not expected to have an impact on reserves by 2050. In contrast, the institute predicts that silver will significantly outgrow its reserve base over the same time period. Such projections are likely to be overly pessimistic, and thus data on material scarcity is deemed secondary in importance.
Monopoly SupplyWhen the world’s production of a certain substance is concentrated in a single or in two countries, future supply becomes vulnerable. For instance, over 80% of the world’s platinum is being mined in South Africa.
Political InstabilityMaterial security, arguably, is impacted by a country’s governance, notably its political stability and the countries from which materials are sourced. War, starvation, and other forms of disturbance can disrupt supplies. By analysing the principal nation’s production data, it is possible to assign a (rough) political stability score to each substance. The World Bank’s Governance Indicator was used to collect information on political stability. The website provides percentile rankings for 212 countries and territories based on a variety of criteria, including “political stability and the lack of violence/terrorism.”
Vulnerability to Climate ChangeCertain regions are anticipated to be more vulnerable to climate change consequences than others. Additionally, this susceptibility can be utilized to forecast future material insecurity. The German Advisory Council on Climate Change issued a map indicating which regions of the world are most likely to suffer disproportionately from climate change. These hotspots were very poorly translated into climate change in the Material Security Spreadsheet. Score of vulnerability is based on proximity to hotspots.
Table 3. Top 20 critical materials for the UK, the EU, India, Australia and Japan.
RankUKEUIndiaAustraliaJapan
1GoldDysprosiumStrontiumGalliumNeodymium
2RhodiumMagnesiumPhosphateIndiumDysprosium
3MercurySamariumPotashTungstenIndium
4PlatinumGadoliniumVanadiumCobaltNiobium
5StrontiumRhodiumBoronNiobiumTin
6SilverTungstenBariumManganeseSilver
7AntimonyNeodymiumLithiumMolybdenumZinc
8TinCeriumChromiumAntimonyTantalum
9MagnesiumHolmiumMolybdenumLithiumManganese
10TungstenLutetiumSiliconVanadiumCobalt
11BaryteTerbiumNiobiumNickelGold
12TalcThuliumCobaltTantalumPlatinum
13BismuthYtterbiumLimestoneTerbiumIron
14PalladiumAntimonySeleniumChromiumRhodium
15NickelPhosphorusAntimonySeleniumPalladium
16BoronNiobiumGypsumTitaniumLead
17AndalusiteErbiumNickelStrontiumCopper
18MolybdenumCobaltBentoniteGraphiteChromium
19ZincPalladiumGermaniumTinMolybdenum
20HolmiumBismuthGraphiteGermaniumTungsten
Table 4. Scoring matrix used to determine a material’s criticality score.
DimensionSupply Risk (SR)Material Risk (MR)
Indicator/
Criteria
ScarcityMonopoly SupplyPolitical InstabilityVulnerability to Climate ChangeMalaysia Consumption LevelSubstitutabilityGlobal Warming PotentialTotal Material Requirement
Score1Not predicted to reach reserves by 2050Any one country has a concentration of less than 33.3%.Political Stability Percentile greater than 66.6%More than 51 climate risk indexLess than 1000 tonnes per yearHigh Less than 1 kg CO2 per kg material extractedLess than 100 tonnes/tonne mineral
2Predicted to overrun reserves by 2050Any one country has a concentration of between 33.3% and 66.6%.Political Stability Percentile between 33.3–66.6%21–50 climate risk indexBetween 1000 and 1,000,000 tonnes per yearIf the data is not readily available Between 1 and 100 kg CO2 per kg material extractedBetween 100 to 10,000 tonnes/tonne mineral
3Predicted to overrun reserve base by 2050Any one country has a concentration greater than 66.6%.Political Stability Percentile less than 33.3%1–20 climate risk indexMore than 1,000,000 tonnes per yearLowMore than 100 kg CO2 per kg material extractedMore than 1000 tonnes/tonne mineral
Table 5. Extracted top 28 Critical Materials list for Malaysia.
MaterialSymbolSupply Risk (SR)Total
SR
Material RiskTotal
MR
Criticality
Score
SCMSPSVCCCLSubGWPTMR
PalladiumPd3222922331019
RhodiumRh2222823331119
GoldAu3122831331018
PlatinumPt322292133918
TelluriumTe2222823231018
AmmoniaNH3222282322917
BromineBr222282322917
IndiumIn322292132817
MolybdenumMo222282322917
NiobiumNb233191322817
OsmiumOs222282223917
Phosphate rock-222282322917
RutheniumRu222282322917
StrontiumSr222282322917
ThalliumTl222282322917
YttriumY222282322917
Andalusite-222282222816
BariumBa222282222816
BaryteBaSO4222281322816
BorateBO3222282222816
CeriumCe222282222816
DysprosiumDy222282222816
ErbiumEr222282222816
EuropiumEu222282222816
Fluorspar-222282312816
GadoliniumGd222282222816
GalliumGa222282132816
HafniumHf222282222816
SC—Scarcity, MS—Monopoly of Supply, PS—Political Stability, VCC—Vulnerability to Climate Change, SR—Supply Risk, CL—Consumption level, Sub—Substitutability, GWP—Global Warning Potential, TMR—Total Material Requirements, MR—Material Risk.
Table 6. Supply Risk and Material Risk of materials.
Material
Supply risk9 ZnSb, PbNi, Sn InPt, Pd,
8 SiAs, B, Mg, Perlite, Se, Vermiculite, Al, Asbestos, Bentonite, Be, Bi, Cd, Co, diamond, diatomite, Ge, C, Kyanite, Lime, Li, Mica, Re, Sc, Ag, Soda Ash, Talc, Th, W, VAndalusite, Ba, BaSO4, BO3, Ce, Dy, Erbium, Eu, Fluorspar, Gd, Ga, Hf, He, Ho, I, Ir, La, Lu, Mercury, Rubber, Nd, Pr, Pm, Sm, Si metal, Tb, Tm, U, Yb NH3, Br, Mo, Os, phosphate, Ru, Sr, Tl, YAu, TeRh,
7Fe ZrCu, Feldspar, Ti Cr, Nb
6 Kaolin, Mn Ta
4567891011
Material risk
Table 7. Material groupings that are critical to the Malaysian economy.
MaterialsSymbolMaterial
Security Score
Palladium, RhodiumPd, Rh19
Gold, Platinum, TelluriumAu, Pt, Te18
Ammonia, Bromine, Indium, Molybdenum, Niobium, Osmium, Phosphate rock, Ruthenium, Strontium, Thallium, YttriumNH3, Br, In, Mo, Nb, Os, Ru, Sr, Tl, Y17
Andalusite, Barium, Baryte, Borate, Cerium, Dysprosium, Erbium, Europium, Fluorspar, Gadolinium, Gallium, Hafnium, Helium, Holmium, Iodine, Iridium, Lanthanum, Lutetium, Mercury, Natural rubber, Neodymium, Nickel, Praseodymium, Promethium, Samarium, Silicon metal, Tantalum, Terbium, Thulium, Tin, Uranium, YtterbiumBa, BaSO4, BO3, Ce, Dy, Er, Eu, Gd, Ga, Hf, He, Ho, Ir, La, Lu, I, Nd, Ni, Pr, Pm, Sm,
Ta, Tb, Tm, Sn, U, Yb
16
Aluminium, Antimony, Asbestos, Bentonite, Beryllium, Bismuth, Cadmium, Chromium, Cobalt, Diamonds (unit in carat), Diatomite, Germanium, Graphite, Kyanite, Lead, Lime, Lithium, Mica, Rhenium, Scandium, Silver, Soda ash, Talc, Thorium, Tungsten, VanadiumAl, Sb, Be, Bi, Cd, Cr, Co, Ge, C, Pb, Li, Re, Sc, Ag, Th, W, V15
Arsenic, Boron, Copper, Feldspar, Kaolin, Magnesium, Manganese, Perlite, Selenium, Titanium, Vermiculite, ZincAs, B, Cu, Mg, Mn, Se, Ti, Zn14
Silicon, ZirconiumSi, Zr13
Iron & SteelFe11
Table 8. International comparisons with Malaysia on top ten critical materials.
RankMalaysiaUKEUIndiaAustraliaJapan
1PalladiumGoldDysprosiumStrontiumGalliumNeodymium
2RhodiumRhodiumMagnesiumPhosphateIndiumDysprosium
3GoldMercurySamariumPotashTungstenIndium
4PlatinumPlatinumGadoliniumVanadiumCobaltNiobium
5TelluriumStrontiumRhodiumBoronNiobiumTin
6AmmoniaSilverTungstenBariumManganeseSilver
7BromineAntimonyNeodymiumLithiumMolybdenumZinc
8IndiumtinCeriumChromiumAntimonyTantalum
9MolybdenumMagnesiumHolmiumMolybdenumLithiumManganese
10NiobiumTungstenLutetiumSiliconVanadiumCobalt
Table 9. Products Recycling Desirability Index.
ProductSimplicityMaterial
Security Desirability
Technology Readiness DesirabilityRecycling Desirability IndexMarket Price (RM)
Car battery 0.640.4201.002.06250.00
DVD-R0.510.3001.001.8160.00
Mobile phone0.380.4661.001.85550.00
Desktop computer 0.250.5201.001.771550.00
Wind turbine (100 kW) 0.780.0020.601.3824,000.00
Refrigerator 0.510.0511.001.561900.00
Coffee maker 0.520.0201.001.54100.00
Tire 0.550.3701.001.92200.00
Ergo chair 0.50.2101.001.7150.00
PET Bottle0.920.0001.001.920.30
Table 10. Comparison of Malaysian products recycling desirability index with other countries.
ProductProduct Recycling Desirability Index
MalaysiaUKEUUSAIndia
1Car battery2.062.081.651.791.73
2PET bottle1.921.921.921.921.92
3Tire1.921.551.861.551.55
4Mobile Phone1.851.951.761.561.93
5DVD-R1.811.911.541.521.81
6Desktop Computer1.771.831.721.852.25
7Ergo Chair1.711.501.681.651.64
8Refrigerator1.561.561.691.581.68
9Coffee Maker1.541.541.531.531.62
10Wind turbine 1.381.681.681.711.74
Publisher’s Note: MDPI stays neutral with regard to jurisdictional claims in published maps and institutional affiliations.

