
An Experimental Investigation of Passive Jet Control Method on Bridge Tower Wake


1
Key Lab of Smart Prevention and Mitigation of Civil Engineering Disasters of the Ministry of Industry and Information Technology, Harbin Institute of Technology, Harbin 150090, China
2
Key Lab of Structures Dynamic Behavior and Control of the Ministry of Education, Harbin Institute of Technology, Harbin 150090, China
*
Author to whom correspondence should be addressed.
Appl. Sci. 2022, 12(9), 4691; https://doi.org/10.3390/app12094691
Submission received: 2 March 2022
/
Revised: 29 April 2022
/
Accepted: 1 May 2022
/
Published: 6 May 2022
(This article belongs to the Special Issue New Advances in Fluid Structure Interaction)
Abstract
:In this study, we employed a four-hole cobra probe to measure the wake characteristics of a rec-tangular bridge tower model in a wind tunnel. The scale of the model was 1:30, and the Reynolds number varied from 1.38 × 10⁵ to 2.27 × 10⁵ by changing the yaw angle. A measurement plane with 9 × 19 measurement points was horizontally set at the middle height behind the model. The wake characteristics of the test model without control, i.e., the baseline case, was first tested in the yaw angle range from 0° to 90°; then, four kinds of passive jet control cases were tested to study their control effects on the bridge tower wake. To evaluate the wake characteristics, three main aspects, i.e., mean velocity, turbulence intensity, and velocity frequency, were investigated. The meas-urement results indicate that the passive jet control method can achieve an effect in suppressing the turbulence of the wake but can slightly modify the mean velocity distribution. The dominant frequency distribution region was eliminated when the yaw angle was small but slightly expanded at a large angle. The differences between cases show a trend that the larger the suction coefficient is, the better the control effects are.
1. Introduction
The cable system bridge is the most widely used large-span bridge system. With the increasing requirement of the span, a growing number of extra-large cable system bridges have come into service, and the wind resistance performance is the primary limitation to the span of the bridge. As the bridge span grows, the wind effect appears more complex, and unprecedented wind-induced phenomena could occur. The wake flow characteristics of bridge towers is an interesting research branch that could lead to the oscillation of the cable behind the tower. For cable-stayed bridges, some parts are under the influence of the tower wake, particularly the long stay cable. In suspender bridges, the suspenders near the tower are wholly in the influence region of the tower wake. The oscillation motion of these suspenders is much more complex due to the unstable wake flow.
The characteristics of cylinder wake have been sufficiently investigated. Knisely [1] reviewed and further researched the Strouhal numbers of the wake of rectangular cylinders; Norberg [2] also investigated the wake frequencies by using a hot wire. Shimada and Ishihara [3] used a two-layer k-ε model to numerically study the aerodynamic characteristics of an infinite-length rectangular cylinder and gained a great agreement in the distribution of mean pressure, but the fluctuating pressure distribution was underestimated compared with the real model. Assi et al. [4] investigated the wake-induced vibration (WIV) of tandem circular cylinders and considered the vibration as a consequence of the interaction between the wake and the structure, which differs from vortex-induced vibration (VIV). The experiment confirmed the wake displacement theory proposed by Zdravkovich [5]. Carmo et al. [6] performed a numerical study on the phenomenon of WIV to a cylinder at a low Reynolds number (Re). Bearman [7] reviewed the research of circular cylinder wakes, regarding wake-induced vibration as a form of VIV. The downstream cylinder is under the collective effect of vortex shedding from both upstream structures and itself. Wang et al. [8] performed a two-dimensional numerical simulation of two tandem cylinders at low Re flow and found that the WIV phenomenon comes to aggravation when the size of the cylinder upstream is larger than that downstream. Li et al. [9] conducted a wind tunnel test and a computational fluid dynamics (CFD) simulation to investigate the WIV of the suspenders in wake of a bridge tower. The experiment found that the suspender in the wake of the tower would carry out an elliptical orbit motion at a specific wind speed when the frequency of the wake fits the natural frequency of the suspenders. In another part, a tower with four corners cut decreases the RMS aerodynamic coefficient and facilitates the suppression of the WIV of suspenders.
On the other hand, many studies have been conducted to investigate the suppression of VIV of cylinders. A technology based on suction and jet flow was confirmed to be effective. Amitay et al. [10,11] modified the aerodynamic characteristics of cylinders by using fluidic actuators. The closed recirculating flow regimes generated by jet flow could be equivalent to a virtual surface which can modify the characteristics of aerodynamics. Crook et al. [12] used synthetic jets to delay the separation point on cylinders, with the jet placed near the separation line. Many relevant studies were performed in the 21st century [13,14,15] that also indicated that the turbulence of wake also can be decreased, and even the vortex street could be eliminated. Hao Feng et al. [16,17] investigated the mode of wake by proper orthogonal decomposition, as the synthetic jet is applied to control the vortex shedding. The particle image velocimetry (PIV) results show that a synthetic jet could generate a vortex pair further downstream, and the proper orthogonal decomposition (POD) analysis indicates that this vortex pair, together with the vorticity shear layers near the cylinder, forms the vortex structures further downstream. Chen et al. [18] performed an experimental investigation on the suction-based flow control method, investigated the pressure distribution on the surface of a circular cylinder with suction slits, and found that the steady suction method exhibits excellent control effectiveness and can distinctly suppress the VIV, the amplitudes of cylinder vibrations, fluctuating pressure coefficients and lift coefficients of the circular cylinder model. They also applied PIV for further study [19], and the results show that the separation points on the test model in the PIV measurement plane are pushed further downstream, and the wake closure length also varies significantly along the span-wise direction of the test model for the cases with the suction flow control. Chen et al. [20,21] first proposed a passive jet apparatus, performed an experimental and numerical study to investigate a passive control method that has passive windward suction and a leeward jet over a circular cylinder, and found that the mean drag and the dynamic wind loads acting on the cylinder are suppressed. This apparatus could manipulate the shedding process of the wake vortices, and the jets could modify the wake stability by displacing the region of absolute instability further downstream. This method was also investigated by Zhang et al. [22] to apply to a bridge girder to control the flow separation. Chen et al. [23] further developed the passive jet method on a rectangular cylinder, taking a tower column as a prototype. The passive jet also has adequate control effects on the aerodynamic forces acting on the column.
The WIV of suspenders was found to be caused by the vortices from the bridge tower shedding into the tower wake [9,24]. Therefore, in this paper, we aim to further apply this passive jet apparatus to the bridge tower to modify the characteristics of the wake. We conducted an experiment to measure the time histories of wind speed at each measurement point. The experiment setup is introduced in Section 2, the results of tower wake characteristics are shown in Section 3, and finally, a discussion and conclusions are presented in Section 4.
2. Experimental Setup
The experiment was conducted in a closed-circuit boundary layer wind tunnel affiliated with the Joint Laboratory of Wind Tunnel and Wave Flume (Joint Lab WTWF), Harbin Institute of Technology. The wind tunnel contains two test sections. The size (width × height × length) of the larger one is 6.0 m × 3.6 m × 50 m, and the smaller one is 4.0 m × 3.0 m × 25 m. Our experiment was performed in the small section, where the wind speed can be adjusted continuously from 3 m/s to 30 m/s, the turbulence intensity of incoming wind speed is no more than 0.46%. The small section equips two turntable systems and a three-dimensional automated traverse measurement system.
2.1. Bridge Tower Model
The bridge tower model was designed using the Xihoumen Bridge as prototype, which is a steel box girder suspension bridge with a main span of 1650 m, located in Zhejiang Province, China. The prototype bridge tower is an overhead gantry type, which can be simplified as two separate independent rectangle cross-section bridge towers when only the wake flow of tower is investigated. We investigate only one tower model, without considering the interaction of the wake of two towers. The cross-section of the model is a 283 mm (B) × 217 mm (D) rectangle, with a side length of 23 mm square corner cut at each corner, and the scale ratio is set to 1:30, as shown in Figure 1. The data presented in this paper correspond to dimensionless distances of B = 283 mm and D = 217 mm in cross-wind and along-wind directions. The height of the column model is 2.9 m, and thus, the remaining 0.1 m to the ceiling can spare space for the clamp device. The model is assembled with thick planks, which provide enough stiffness to limit deformation. The surface of the model is flat and glossy by polishing. A jack system, mounted between the tower model and ceiling, firmly immobilizes the model. The tower model always maintains rigidity and keeps static during the experiment. At the bottom of the tower model, a 20 mm thick wooden turn plate is arranged to adjust the yaw angle to the incoming flow when the jack system is inoperative.
The yaw angle of model α is set from 0 degrees to 90 degrees, with an interval of 10°. The blocking ratio of the model varies by the yaw angle, reaching a minimum of 5.4% when the yaw angle is 0° and a maximum of 8.9% when the yaw angle is 50°.
2.2. Passive Jet Rings
The present study adopts four kinds of passive jet rings to take control of the tower wake flow, which refers to the design in Chen et al. [23]. The ring is an annular flow channel with slits made by a 1 mm thick plastic plate, as Figure 2 shows. The top view of the ring is a rounded rectangular box, of which the outer size is 323 mm × 257 mm, with a 43 mm radius rounded corner in each corner, and the inner size is 283 mm × 217 mm; thus, it can closely fit the tower model. The intermediate part of 18 mm thickness, considering the thickness of the plate, constitutes the hollow flow channel. The height of the passive jet ring is 100 mm. Several rectangular slits are distributed around the side walls of the ring. The major differences between these four categories of jet ring are the size and the distribution of these slits. The size of slits in the first and third categories is 80 mm × 30 mm, and that in the second and fourth categories is 60 mm × 30 mm. For the first category, there are nine and seven slits on each long and short side, respectively, and for the second category, there are seven and five slits. For the third and fourth categories, the slits of the first and second categories on the long side are sealed, seven and five slits are distributed on each short side, respectively, and no slits are arranged on the long side. The clear spacing between two slits on each side is 30 mm. All the slits adopt axisymmetric distribution on both two principal axes.
In this study, we calculate the dimensionless coefficient of suction (Chen et al., 2015):
where Ssuc is the summary area of the suction slits on one passive jet ring projection to the plane perpendicular to the direction of flow; l = asin α + bcos α is the total projection length of the ring perpendicular to the incoming flow; H is the height of the passive jet ring; h is the length of the suction slit; d is the width of the suction slit; a and b are the length of the long and short side of the ring, respectively; na and nb are the number of the slits distributed on each long and short side, respectively, and α is the yaw angle of the ring.
2.3. Experiment Details and Measurement Point Arrangement
In this experiment, a four-hole pressure probe (Series 100 Cobra Probe, Turbulent Flow Instrumentation Pty Ltd., Victoria, Australia) was used to measure the characteristics of the bridge tower wake flow. There are 172 measurement points in the zone of tower wake, distributed on a 2.4 m × 1.8 m horizontal plane 1.5 m above the ground (half of the wind tunnel section height), as shown in Figure 1. In this plane, nine rows perpendicular to the incoming flow distribute at the interval of 300 mm, and nineteen columns parallel to the incoming flow distribute at the interval of 100 mm. The middle measurement point in the first row is 200 mm away from the back of the tower model. Taking the same scale ratio as the tower model, the realistic locations of four suspenders behind the bridge tower correspond to the middle points in rows 3, 5, 7, and 9. The measurement points distribution can be seen in Figure 3. At each measurement point, the sampling frequency is 625 Hz, and the sampling time is 20 s.
The cobra probe is fixed on the bracket on the three-dimensional traverse measurement system, with its probe head straight towards the incoming flow. The traverse measurement system has a built-in coordinate system, by which we can precisely change the position of the probe. It also has a jack system to firmly fix the whole traverse measurement system when data are collected. The position of the probe is changed to the measurement points mentioned above one by one during the experiment. The incoming wind speed U0 is set to 10 m/s, corresponding to the range of Reynolds numbers (Re = ρU0L/μ, where ρ is the air density, μ is the dynamic viscosity coefficient of air, L is the projection length of the tower cross-section) from 1.38 × 10⁵ to 2.27 × 10⁵, which varies by the projection length (L = Bsin α + Dcos α) when the yaw angle α changes. As the yaw angle changes, the corresponding positions of the suspenders vary, revolving the same degrees around the bridge tower. The locations of the first four imaginary suspenders behind the tower are labeled A1 to A4. When the yaw angle continues to increase, the imaginary suspenders behind the other side tower come into the wake zone of the tower model, the locations of which are labeled B1 to B4. There are five test conditions in this study, recorded as Case 0–Case 4. Case 0 is the baseline condition, in which only a tower model is tested, without passive jet control. Case 1–Case 4, corresponding to the category of the passive jet ring from 1 to 4, respectively, are controlled conditions, in which fourteen passive jet rings are installed on the tower model, distributed at the interval of 100 mm. The ring in the middle is installed 1.5 m from the ground, the same height as the probe. The yaw angle changes from 0 to 90 in Case 0 to Case 2, and from 0 to 30 in Case 3 to Case 4, because few suction slits work at a large angle in Case 3 and 4. The test conditions are shown in Table 1, and the value of suction coefficients at different yaw angles in each case are listed in Table 2.
3. Results and Discussions
3.1. Mean Velocity Distribution
The cobra probe has a natural property called the acceptance ratio. The wind speed data are collected only when the local wind speed is in the range from 2 to 50 m/s; moreover, the direction of the speed vector is contained by the front cone with a 45-degree half-angle [25]. Data history would be placed as zero when the acceptance condition is not satisfied. Zero data history is rejected when the mean velocity distribution is calculated. Only u and v velocity components are taken into consideration due to the two-dimensional model, and the velocity is expressed in non-dimensional form as the local wind speed divides the incoming wind speed. The fourth-order spline interpolation is adopted for each measurement point.
Figure 4 shows the mean dimensionless speed (U/U0) distribution in each test condition, where the black arrows refer to the local wind velocity vector. The general distribution trend of wind velocity is almost the same, and it can be divided into three regions. A low-value zone is located near the position (0, 0), which can be regarded as the low-speed region. This region is created due to the bridge tower shielding effects and the recirculation zone. Due to the limitation of the cobra probe, the mean velocity is always downstream, which is not tally with the fact; thus, the low-speed region is defined as the location where the data acceptance ratio (the proportion of non-zero data) of the probe is less than 50%. A slow diffusion region is located downstream of the low-speed region, where the speed is approximately half of the incoming wind speed. The high-speed region is distributed on two sides of the Y-axis, where the mean speed is almost not affected by the bridge tower model.
The non-dimensional area (S1/BD) of the low-speed region is shown in Figure 5, where S1 is the area where the data acceptance ratio is less than 50% in the tower wake. In Case 0, there is a notable minimum area at 10 degrees equal to 0.386, and the second minimum area is equal to 0.503 at 80 degrees. This indicates that the low-speed area of the rectangular column with corner cuts minimizes not at the position perpendicular to the incoming flow, but at the position of little degree rotation. In Case 1 and Case 2, the low-speed region extends downstream compared with Case 0, every 0–90 degrees; in Case 3 and Case 4, an obvious expanding low-speed region can be observed at 10 and 20 degrees. These phenomena can be explicated by the previous study (Chen et al., 2015), where the PIV results show that the wake vortex is pushed by jet flow and stretched, which would induce the expansion of the low-speed region.
To show the distribution of the velocity on the Y-axis, Figure 6 adopts the velocity of measurement points in the final row (X/B = 8.48) in different cases. The trend of velocity is consistent in all cases. The distribution on the Y-axis shows the shape of a saddle, and the velocity increases first and then decreases as the yaw angle increases. It can be indicated that the passive jet ring significantly modifies the velocity in the near wake but slightly changes the velocity distribution further downstream.
3.2. Turbulence Intensity Distribution
The turbulence intensity distribution in the wake region is achieved. To the measurement points with zero data, the zeros are rejected in the calculation, the same as velocity. The processing method may lead to some deviation from the true value when the acceptance ratio is low.
The fourth-order spline interpolation is also used to gain the final distribution. Figure 7 shows the distribution of the turbulence intensity distribution. All pictures reveal a universal distribution mode in the tower wake. A core area of the turbulence is located at the back of the tower model, which possesses a high turbulence intensity attaining about 60%. Then, a diffusion zone of the turbulence appears downstream, where the turbulence generally decreases, and the width of the zone increases. Two main differences between uncontrolled and controlled cases must be noticed. First, the core zone of turbulence is enlarged in some controlled cases. The explanation for this phenomenon is that the low-speed region is enlarged in controlled cases as shown in the velocity part, which directly leads to this consequence. Second, there is a low turbulence region inside the core zone in some controlled cases, which may be due to the jet flow from the passive jet ring, as the jet flow would suppress the shedding vortex at the back of the tower model.
To quantitatively compare the turbulence intensity, Figure 8 shows the turbulence intensity distribution in the row at X/B = 8.48, where the turbulence is totally diffused, and the acceptance ratio is 100%; thus, the deviation can be averted. At 0 degrees, Case 3 shows the best control effect, the peak value reduces by 19.3%, and the width of the wake decreases evidently; other cases show more or fewer control effects. At 10 and 20 degrees, all cases control the turbulence effectively. Case 3 and Case 4 attain the best consequence, which reduces 32.5% and 30.2% at 10 degrees and 17.9% and 20.7% at 20 degrees, respectively. When the yaw angle comes to 30 degrees, Case 3 has no control effect but amplifies the peak value for 7.4%, while Case 1 gains the best effect for a 32.5% reduction. The suction coefficient and flow transmission loss can elucidate this variation trend rationally. When the yaw angle is small (0–20 degrees), the differences in the suction coefficients between Cases 1 and 2 and Cases 3 and 4 are small, but the flow would leak from the side slits in Cases 1 and 2, which induces the abating of the jet flow. Hence, Cases 3 and 4 perform better in small yaw angles. As the yaw angle continuously increases, Cases 1 and 2 obtain larger suction coefficients than Cases 3 and 4; on the other hand, because each side functions as a suction or jet wall, no conception of leakage would exist, so Cases 1 and 2 can perform better at a large yaw angle. This is the reason that Cases 3 and 4 are only conducted at 0–30 degrees. A similar phenomenon also appears in the study of the application to a circular cylinder (Chen et al., 2015), where five pairs of slits perform better in wind fluctuating load suppression than 13 pairs of slits. At 40–90 degrees, Cases 1 and 2 gain a control effect in most degrees, and generally, Case 1 performs better. Case 1 attains the control reduction of [34.1, 26.8, 27.7, 30.2, 0.8, 27.0] percent at 40–90 degrees and Case 2 attains the control reduction of [6.6, 15.9, 10.9, 19.7, −18.5, 18.0] percent. Notably, at 80 degrees, Cases 1 and 2 have no control effects—Case 2 even has a negative reduction. The turbulence of Case 0 has an obvious decrease at 80 degrees, which needs to be further explained. The general tendency indicates that Case 1 would have considerable control effects in different yaw angles because the suction coefficient of Case 1 is the largest. The larger the suction coefficient, the better control effects.
3.3. Dominant Frequency Distribution
Here, we processed the wind speed time history data to gain the power spectrum density. In this part, if there is zero data history, this is also taken into consideration, which means the total length of time history data is the same. We gathered the dominant frequencies of the spectrum in all measurement points, then transformed them into dimensionless frequencies (Strouhal number, St = fsL/U0, where fs is the shedding frequency, i.e., the dominant frequency in the wake). The distribution of dimensionless frequencies is obtained, as shown in Figure 9. To eliminate interference from dominant frequencies with small peak values, and for the comparison between cases, a threshold value of power spectral density (PSD) was set. Only the frequencies whose peak value was over the threshold value were counted, and the remaining zones were filled with zeros. If no PSD threshold was set, there is always a dominant frequency anywhere in the wake field, no matter how weak the energy level corresponding to that frequency. The threshold value of PSD in Figure 9 is set as 0.5. In this figure, most St numbers of wake in each case are uniform, but some divergences are mostly located in the middle of wake, especially in Case 0. Comparing the cases, we can find that divergences decline in Cases 1 and 2; especially in Case 1, the St numbers are almost uniform, and the distribution appears clean.
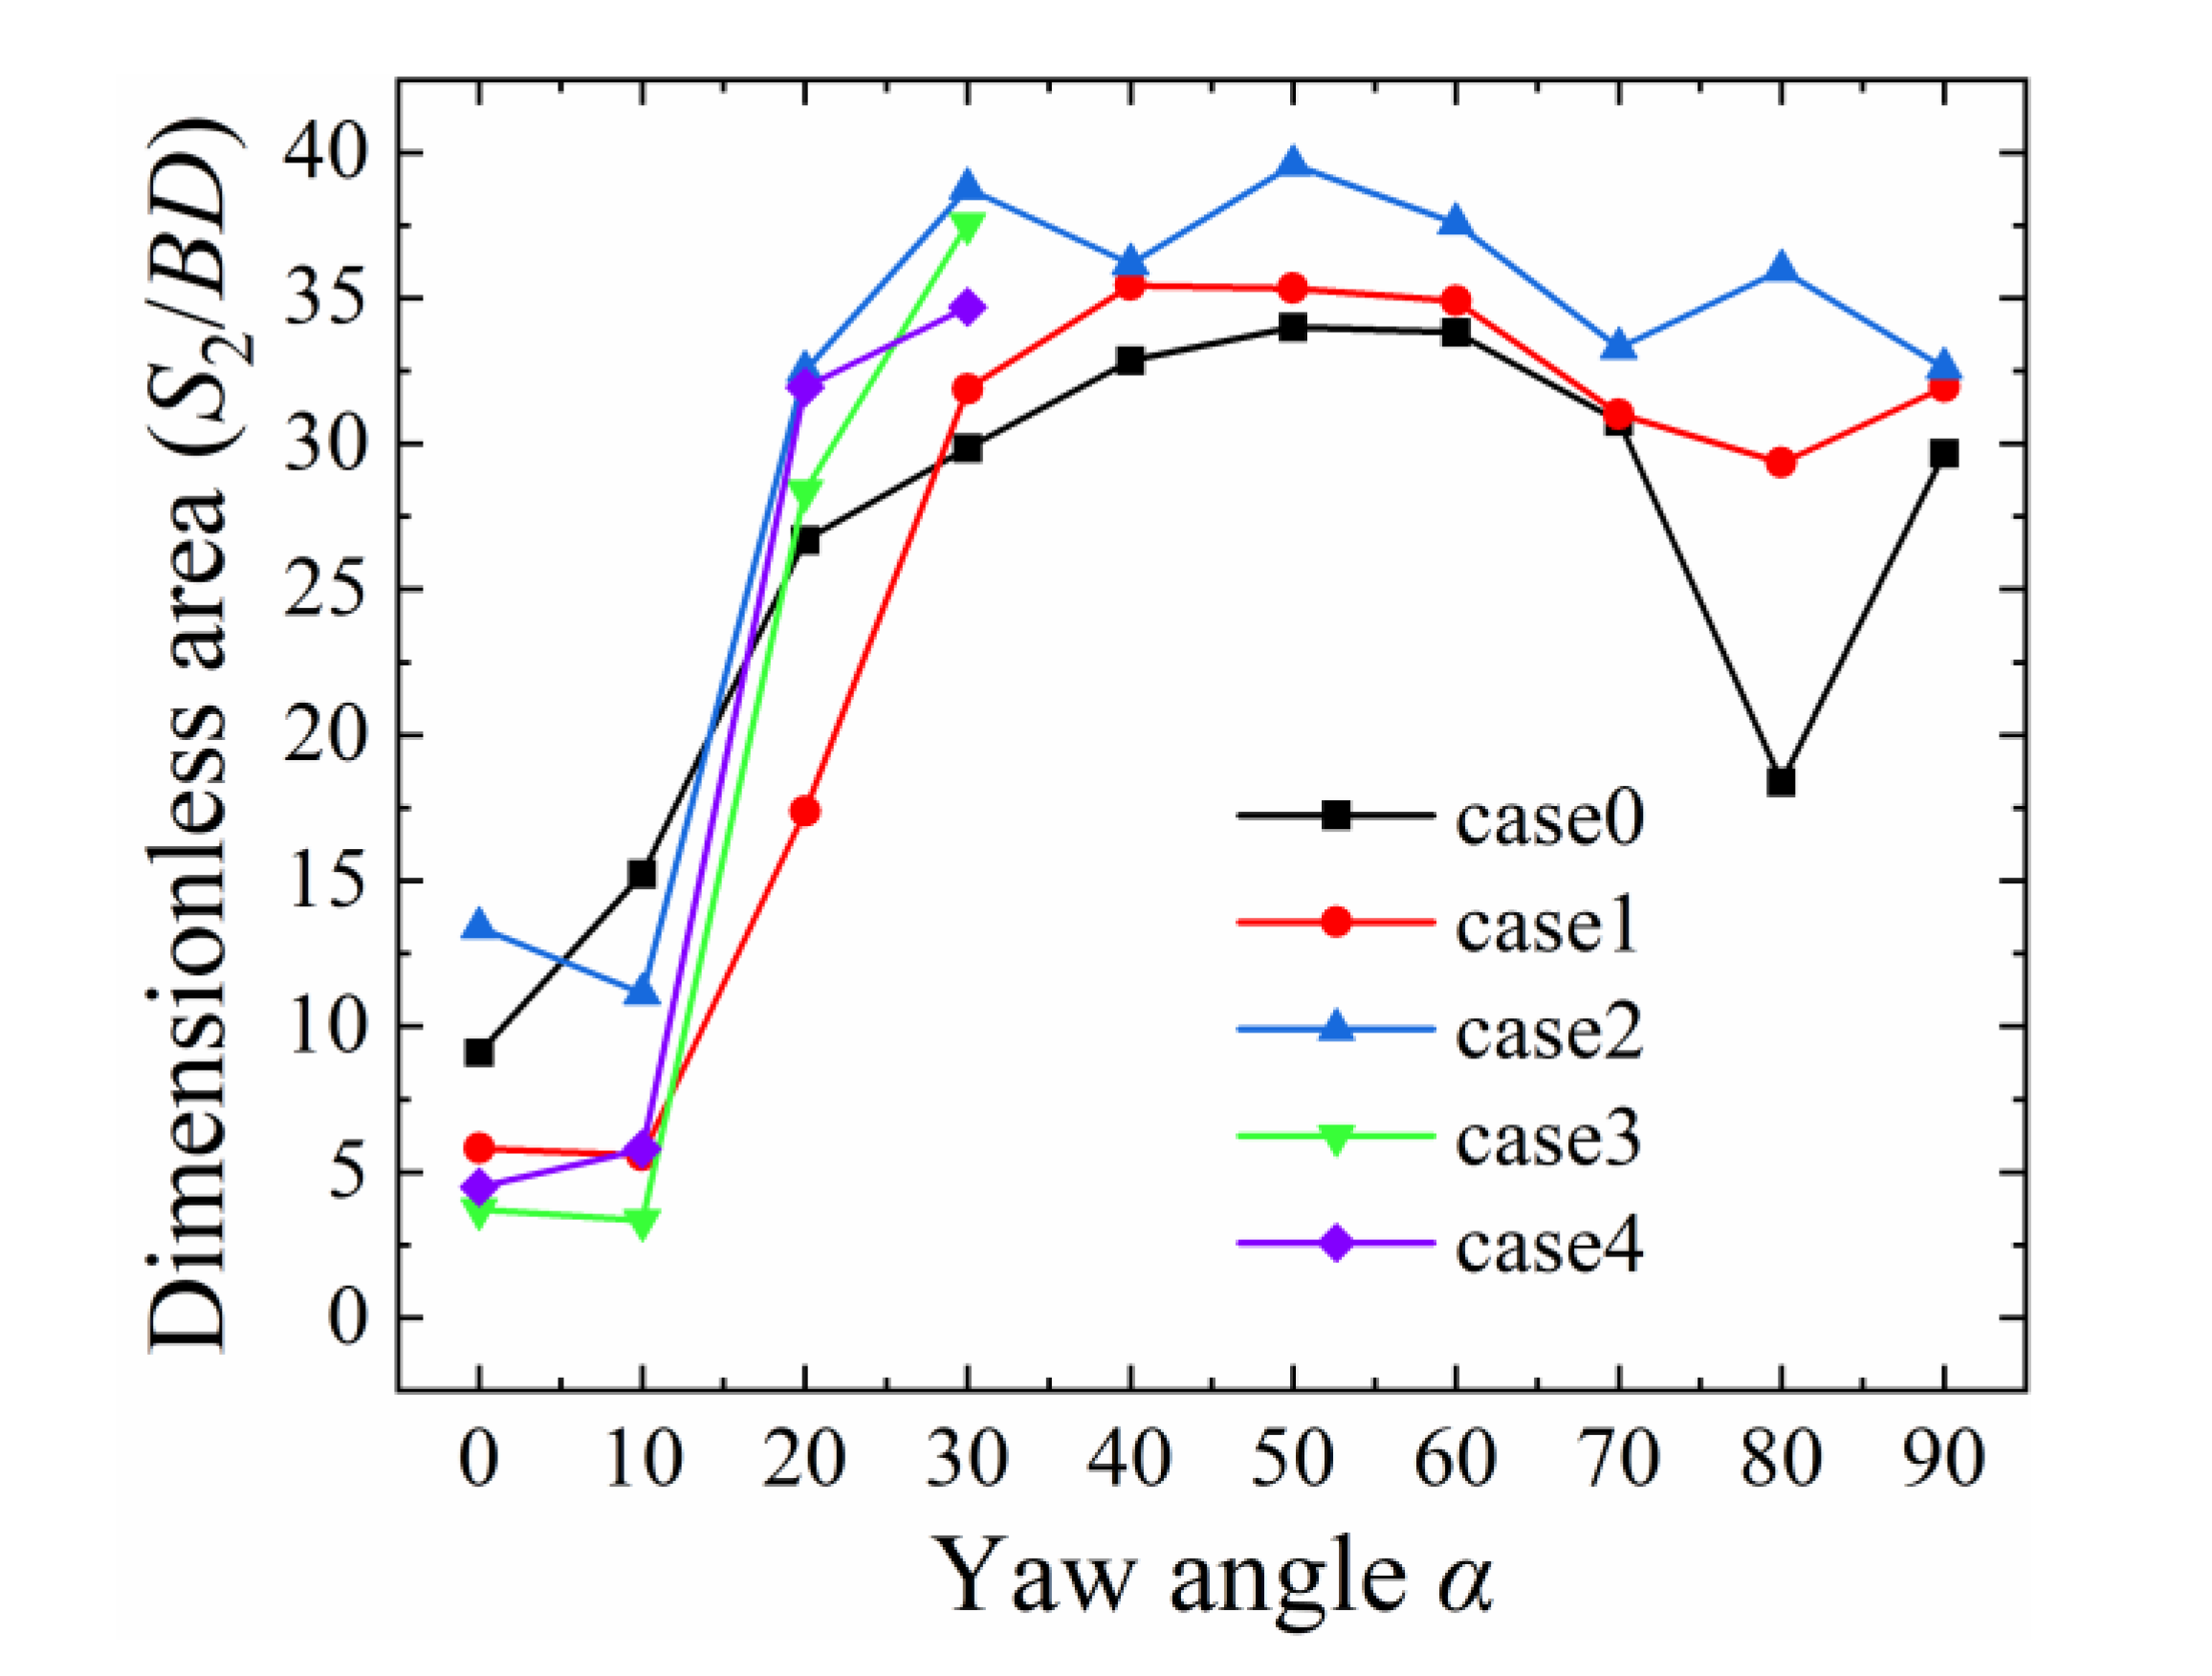
In Cases 3 and 4, the distribution region shrinks to 0 and 10 degrees. For a better comparison of the area change in the distribution region, Figure 10 shows the dimensionless area (S2/BD) of the region in each case. The threshold value of PSD is also set as 0.5. Two trends in different sections of the yaw angle appear. When the yaw angle is small (0–10 degrees), Cases 1, 3, and 4 all reveal a great control effect. Cases 1–4 attain [36.0, −47.2, 59.1, 50.6] and [63.3, 26.9, 78.0, 61.9] percent reduction of area in 0 and 10 degrees, respectively. However, when the yaw angle increases, the area expands, where Case 1 shows the least expansion, except at 80 degrees, with no more than 4% of the area expanding. As in the turbulence intensity distribution, a drop of the area appears at 80 degrees in Case 0, which causes the amplification of the negative control effects of all cases at 80 degrees. Case 2 has the same trend of the area variation by degrees as Case 1, but the effect is worse—29% amplification of area is the maximum at 30 degrees, without considering 80 degrees. Cases 1 and 3 have larger suction coefficients, so these cases perform better than others. If only a small yaw angle is taken into consideration, Case 3 would be recommended, because the position of the suspenders would come out of the wake region at large yaw angles. For engineering applications, Case 1 would be better for various yaw angles.
4. Conclusions
In the present study, the characteristics of the wake of a bridge tower were tested with a four-hole cobra probe using the traverse system moving to each measurement point one by one. The cross-section of the tower model is rectangular with corner cuts, and the yaw angle was thus set from 0 to 90 degrees. Overall, the wake region is a diffusion zone, the width increases downstream, and a low-speed region is located at the near back of the tower. As the yaw angle increases, the area of the low-speed region first increases and then decreases, and the maximum appears at 50 degrees. The performance of the cobra probe is evidently restrained in the low-speed region because the acceptance ratio would be extremely low, and deviation is not avoidable. However, the ratio would rapidly reach 100% out of that region. Four controlled cases were set for comparison of the effects of modification in the wake of the model. Two of them were tested at 0–90 degrees, with suction and jet slits distributed on four sides, and the rest were designed for small yaw angles, with slits only distributed on the windward and leeward sides. The suction coefficients of Cases 1 and 2 vary in a small region, from [0.65, 0.35] to [0.67, 0.39], respectively, when the yaw angle changes. The suction coefficients of Cases 3 and 4 sharply decrease when the degree increases. The experimental results indicate that passive jet flow would enlarge the low-speed region; however, velocity distribution further downstream has no significant change. For the turbulence of the wake, the passive jet control method shows the control effects in several cases, where the peak value is suppressed and the width of the high turbulence region is also limited. An imperative trend should be noted: the higher the suction coefficient is, the better the control effects are. From the frequency results, we can conclude that the passive jet method, in some cases, can conspicuously shrink the area of the dominant frequency distribution region with a small yaw angle. However, this conclusion cannot fit the situation with a large yaw angle. The influence of the flow transmission loss is also reflected in the difference between Cases 1 and 3 or Cases 2 and 4. The jet slits distributed at the profile would cause the leak of flow, thus weakening the control effects, but it can contribute to keeping the suction coefficient at a steady level when the yaw angle grows, and thus, a control effect on the turbulence can be maintained. Whether the side jet slits are adopted must take actual demand into consideration.
Similar passive jet rings have been proven to have a good control effect on the aerodynamic force of the bridge tower itself and can effectively suppress the vortex-induced vibration of the bridge tower [23]. In this study, we mainly focused on the effects of the passive jet method on wake characteristics. The results show that the passive jet can change the velocity, turbulence, and main frequency characteristics in the wake region of the bridge tower. It has been proven that the passive jet rings for the bridge tower will effectively control both the around flow field and the wake flow region; however, the control capability on the WIV of the suspenders remains to be further investigated for practical engineering.
Author Contributions
Conceptualization, Y.H. and W.C.; methodology, Y.H. and W.C.; software, Y.H.; validation, W.C.; formal analysis, Y.H.; investigation, Y.H.; resources, W.C.; data curation, Y.H.; writing—original draft preparation, Y.H.; writing—review and editing, W.C.; visualization, Y.H.; supervision, W.C.; project administration, W.C.; funding acquisition, W.C. All authors have read and agreed to the published version of the manuscript.
Funding
This research was funded by the National Natural Science Foundation of China grant number U2106222, 52008140, and 51978222.
Institutional Review Board Statement
Not applicable.
Informed Consent Statement
Not applicable.
Data Availability Statement
Not applicable.
Acknowledgments
This work was funded by the National Natural Science Foundation of China through Grants U2106222, 52008140, and 51978222.
Conflicts of Interest
The authors declare no conflict of interest.
References
- Knisely, C.W. Strouhal Numbers of Rectangular Cylinders at Incidence: A Review and New Data. J. Fluids Struct. 1990, 4, 371–393. [Google Scholar] [CrossRef]
- Norberg, C. Flow around Rectangular Cylinders: Pressure Forces and Wake Frequencies. J. Wind Eng. Ind. Aerodyn. 1993, 49, 187–196. [Google Scholar] [CrossRef]
- Shimada, K.; Ishihara, T. Application of a Modified K-ε Model to the Prediction of Aerodynamic Characteristics of Rectangular Cross-Section Cylinders. J. Fluids Struct. 2002, 16, 465–485. [Google Scholar] [CrossRef]
- Assi, G.R.S.; Bearman, P.W.; Meneghini, J.R. On the Wake-Induced Vibration of Tandem Circular Cylinders: The Vortex Interaction Excitation Mechanism. J. Fluid Mech. 2010, 661, 365–401. [Google Scholar] [CrossRef]
- Zdravkovich, M.M. REVIEW—Review of Flow Interference Between Two Circular Cylinders in Various Arrangements. J. Fluids Eng. 1977, 99, 618. [Google Scholar] [CrossRef]
- Carmo, B.S.; Sherwin, S.J.; Bearman, P.W.; Willden, R.H.J. Flow-Induced Vibration of a Circular Cylinder Subjected to Wake Interference at Low Reynolds Number. J. Fluids Struct. 2011, 27, 503–522. [Google Scholar] [CrossRef]
- Bearman, P.W. Circular Cylinder Wakes and Vortex-Induced Vibrations. J. Fluids Struct. 2011, 27, 648–658. [Google Scholar] [CrossRef]
- Wang, H.; Yang, W.; Nguyen, K.D.; Yu, G. Wake-Induced Vibrations of an Elastically Mounted Cylinder Located Downstream of a Stationary Larger Cylinder at Low Reynolds Numbers. J. Fluids Struct. 2014, 50, 479–496. [Google Scholar] [CrossRef]
- Li, Y.; Tang, H.; Lin, Q.; Chen, X. Vortex-Induced Vibration of Suspenders in the Wake of Bridge Tower by Numerical Simulation and Wind Tunnel Test. J. Wind Eng. Ind. Aerodyn. 2017, 164, 164–173. [Google Scholar] [CrossRef]
- Amitay, M.; Smith, B.; Glezer, A. Aerodynamic Flow Control Using Synthetic Jet Technology. In Proceedings of the 36th AIAA Aerospace Sciences Meeting and Exhibit, Reno, NV, USA, 12–15 January 1998. [Google Scholar] [CrossRef]
- Amitay, M.; Honohan, A.; Trautman, M.; Glezer, A.; Amitay, M.; Honohan, A.; Trautman, M.; Glezer, A. Modification of the Aerodynamic Characteristics of Bluff Bodies Using Fluidic Actuators. In Proceedings of the 28th Fluid Dynamics Conference, Snowmass Village, CO, USA, 29 June–2 July 1997. [Google Scholar] [CrossRef]
- Crook, A.; Sadri, A.M.; Wood, N.J. The Development and Implementation of Synthetic Jets for the Control of Separated Flow. In Proceedings of the 17th Applied Aerodynamics Conference, Norfolk, VA, USA, 28 June–1 July 1999; Volume 99, p. 3176. [Google Scholar] [CrossRef]
- Fransson, J.H.M.; Konieczny, P.; Alfredsson, P.H. Flow around a Porous Cylinder Subject to Continuous Suction or Blowing. J. Fluids Struct. 2004, 19, 1031–1048. [Google Scholar] [CrossRef]
- Wang, J.; Feng, L.; Xu, C. Experimental Investigations on Separation Control and Flow Structure around a Circular Cylinder with Synthetic Jet. Sci. China Ser. E Technol. Sci. 2007, 50, 550–559. [Google Scholar] [CrossRef]
- Dong, S.; Triantafyllou, G.S.; Karniadakis, G.E. Elimination of Vortex Streets in Bluff-Body Flows. Phys. Rev. Lett. 2008, 100, 204501. [Google Scholar] [CrossRef] [PubMed] [Green Version]
- Feng, L.H.; Wang, J.J. Synthetic Jet Control of Separation in the Flow over a Circular Cylinder. Exp. Fluids 2012, 53, 467–480. [Google Scholar] [CrossRef]
- Feng, L.-H.; Wang, J.-J.; Pan, C. Proper Orthogonal Decomposition Analysis of Vortex Dynamics of a Circular Cylinder under Synthetic Jet Control. Phys. Fluids 2011, 23, 014106. [Google Scholar] [CrossRef]
- Chen, W.-L.; Xin, D.-B.; Xu, F.; Li, H.; Ou, J.-P.; Hu, H. Suppression of Vortex-Induced Vibration of a Circular Cylinder Using Suction-Based Flow Control. J. Fluids Struct. 2013, 42, 25–39. [Google Scholar] [CrossRef]
- Chen, W.-L.; Li, H.; Hu, H. An Experimental Study on a Suction Flow Control Method to Reduce the Unsteadiness of the Wind Loads Acting on a Circular Cylinder. Exp. Fluids 2014, 55, 1707. [Google Scholar] [CrossRef]
- Chen, W.-L.; Wang, X.; Xu, F.; Li, H.; Hu, H. Passive Jet Flow Control Method for Suppressing Unsteady Vortex Shedding from a Circular Cylinder. J. Aerosp. Eng. 2017, 30, 04016063. [Google Scholar] [CrossRef] [Green Version]
- Chen, W.-L.; Gao, D.-L.; Yuan, W.-Y.; Li, H.; Hu, H. Passive Jet Control of Flow around a Circular Cylinder. Exp. Fluids 2015, 56, 201. [Google Scholar] [CrossRef]
- Zhang, L.-Q.; Chen, G.-B.; Chen, W.-L.; Gao, D.-L. Separation Control on a Bridge Box Girder Using a Bypass Passive Jet Flow. Appl. Sci. 2017, 7, 501. [Google Scholar] [CrossRef]
- Chen, W.L.; Huang, Y.W.; Gao, D.L.; Meng, H.; Chen, G.B.; Li, H. Passive Suction Jet Control of Flow Regime around a Rectangular Column with a Low Side Ratio. Exp. Therm. Fluid Sci. 2019, 109, 109815. [Google Scholar] [CrossRef]
- Chen, W.L.; Huang, Y.W.; Meng, H. Wake-Induced Vibration of a Suspender Cable in the Rear of a Bridge Tower. J. Fluids Struct. 2020, 99, 103166. [Google Scholar] [CrossRef]
- Mallipudi, S.; Selig, M.; Long, K. Use of a Four Hole Cobra Pressure Probe to Determine the Unsteady Wake Characteristics of Rotating Objects. In Proceedings of the 24th AIAA Aerodynamic Measurement Technology and Ground Testing Conference, Portland, OR, USA, 28 June–1 July 2004; American Institute of Aeronautics and Astronautics: Reston, VA, USA, 2004; pp. 1–9. [Google Scholar]
Figure 1.
Schematic diagram of test layout.
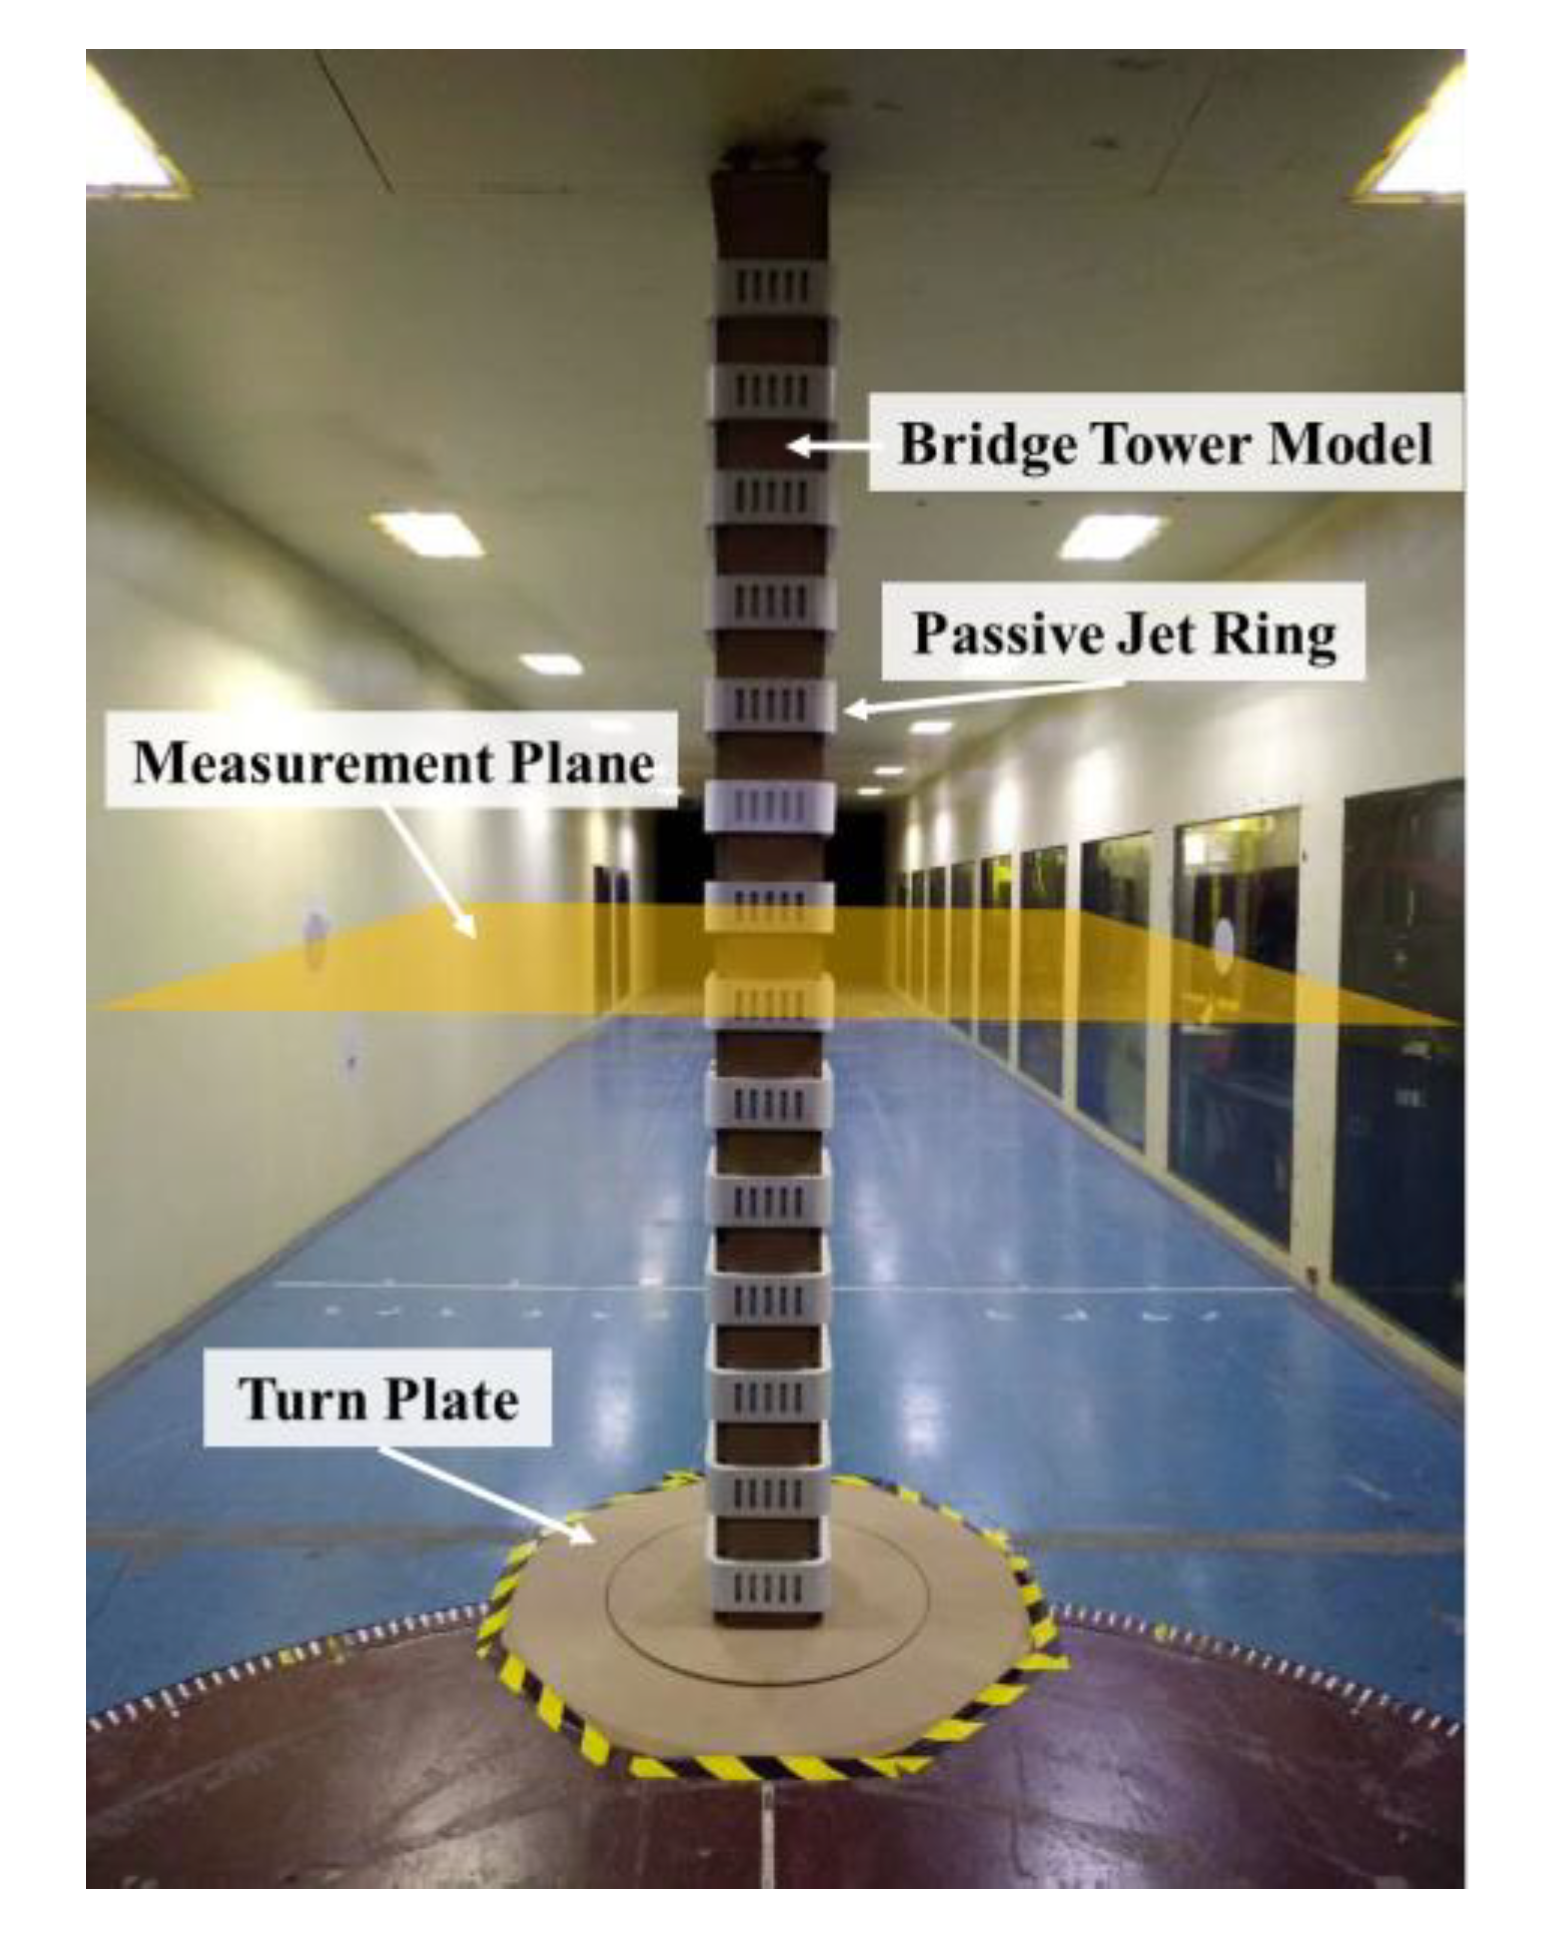
Figure 2.
Passive jet ring structure schematic diagram.

Figure 3.
Measurement points arrangement sketch map.
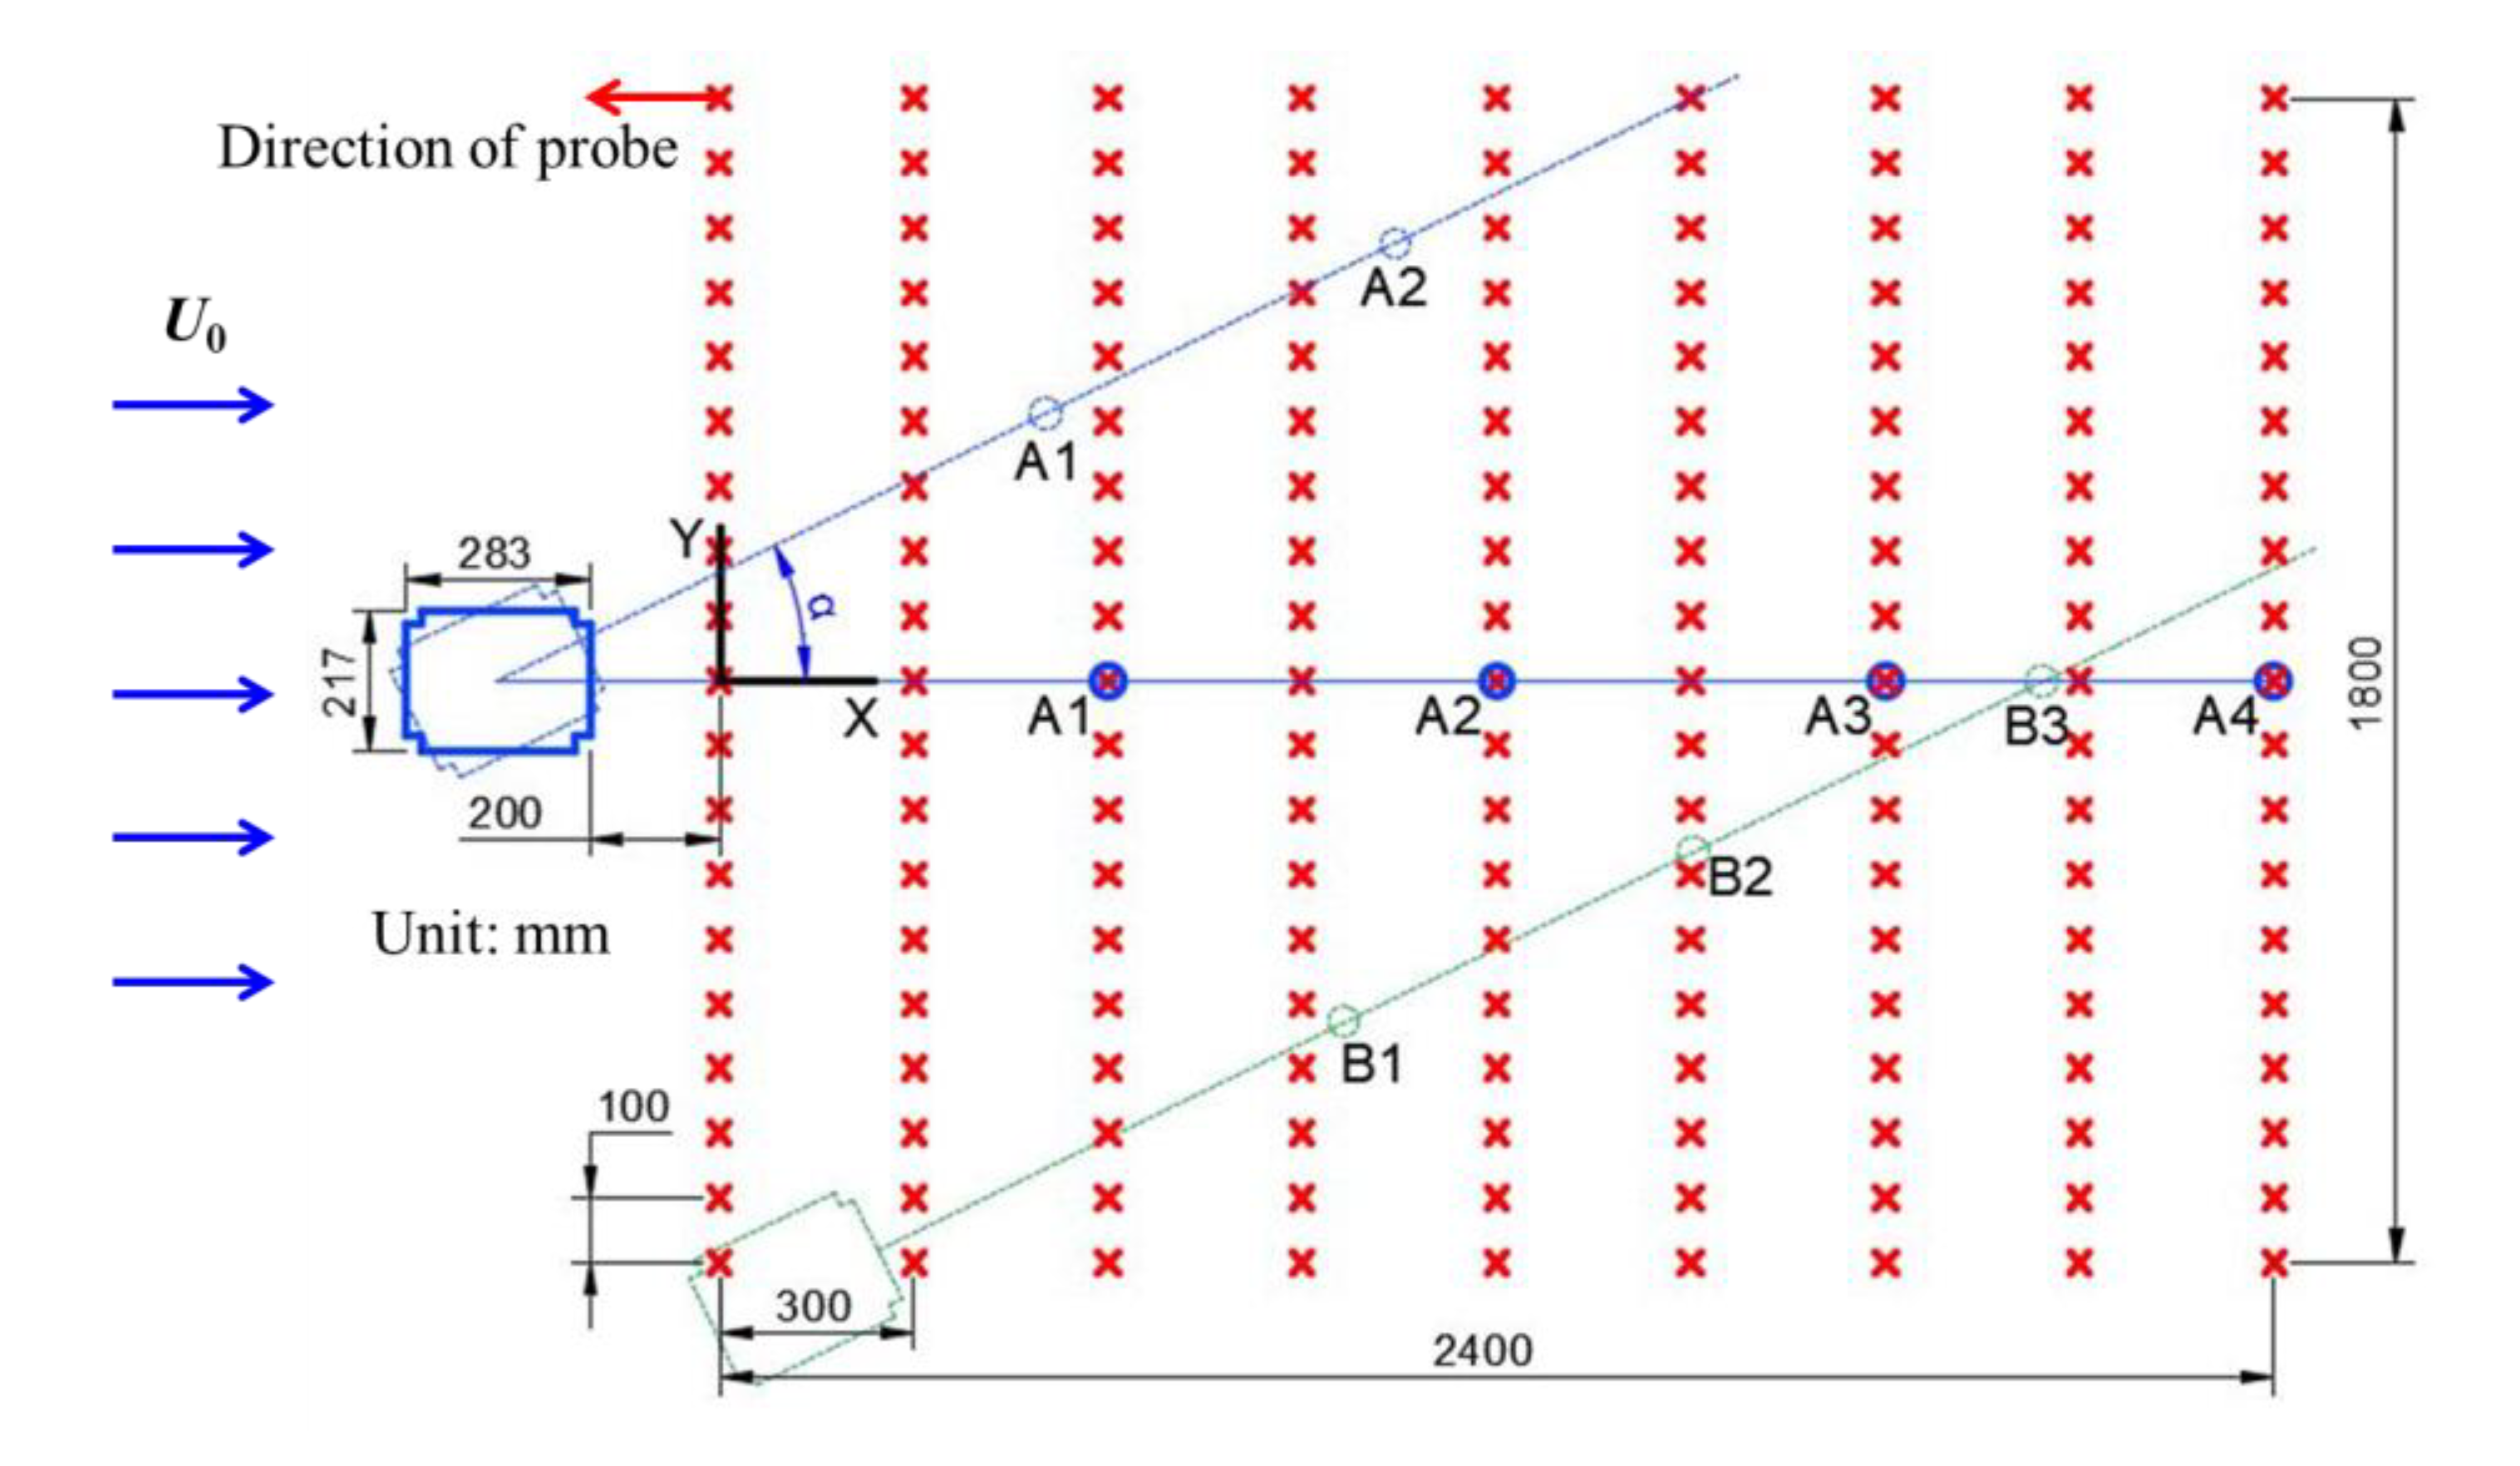
Figure 4.
Dimensionless mean speed (U/U0) distribution of tower wake.
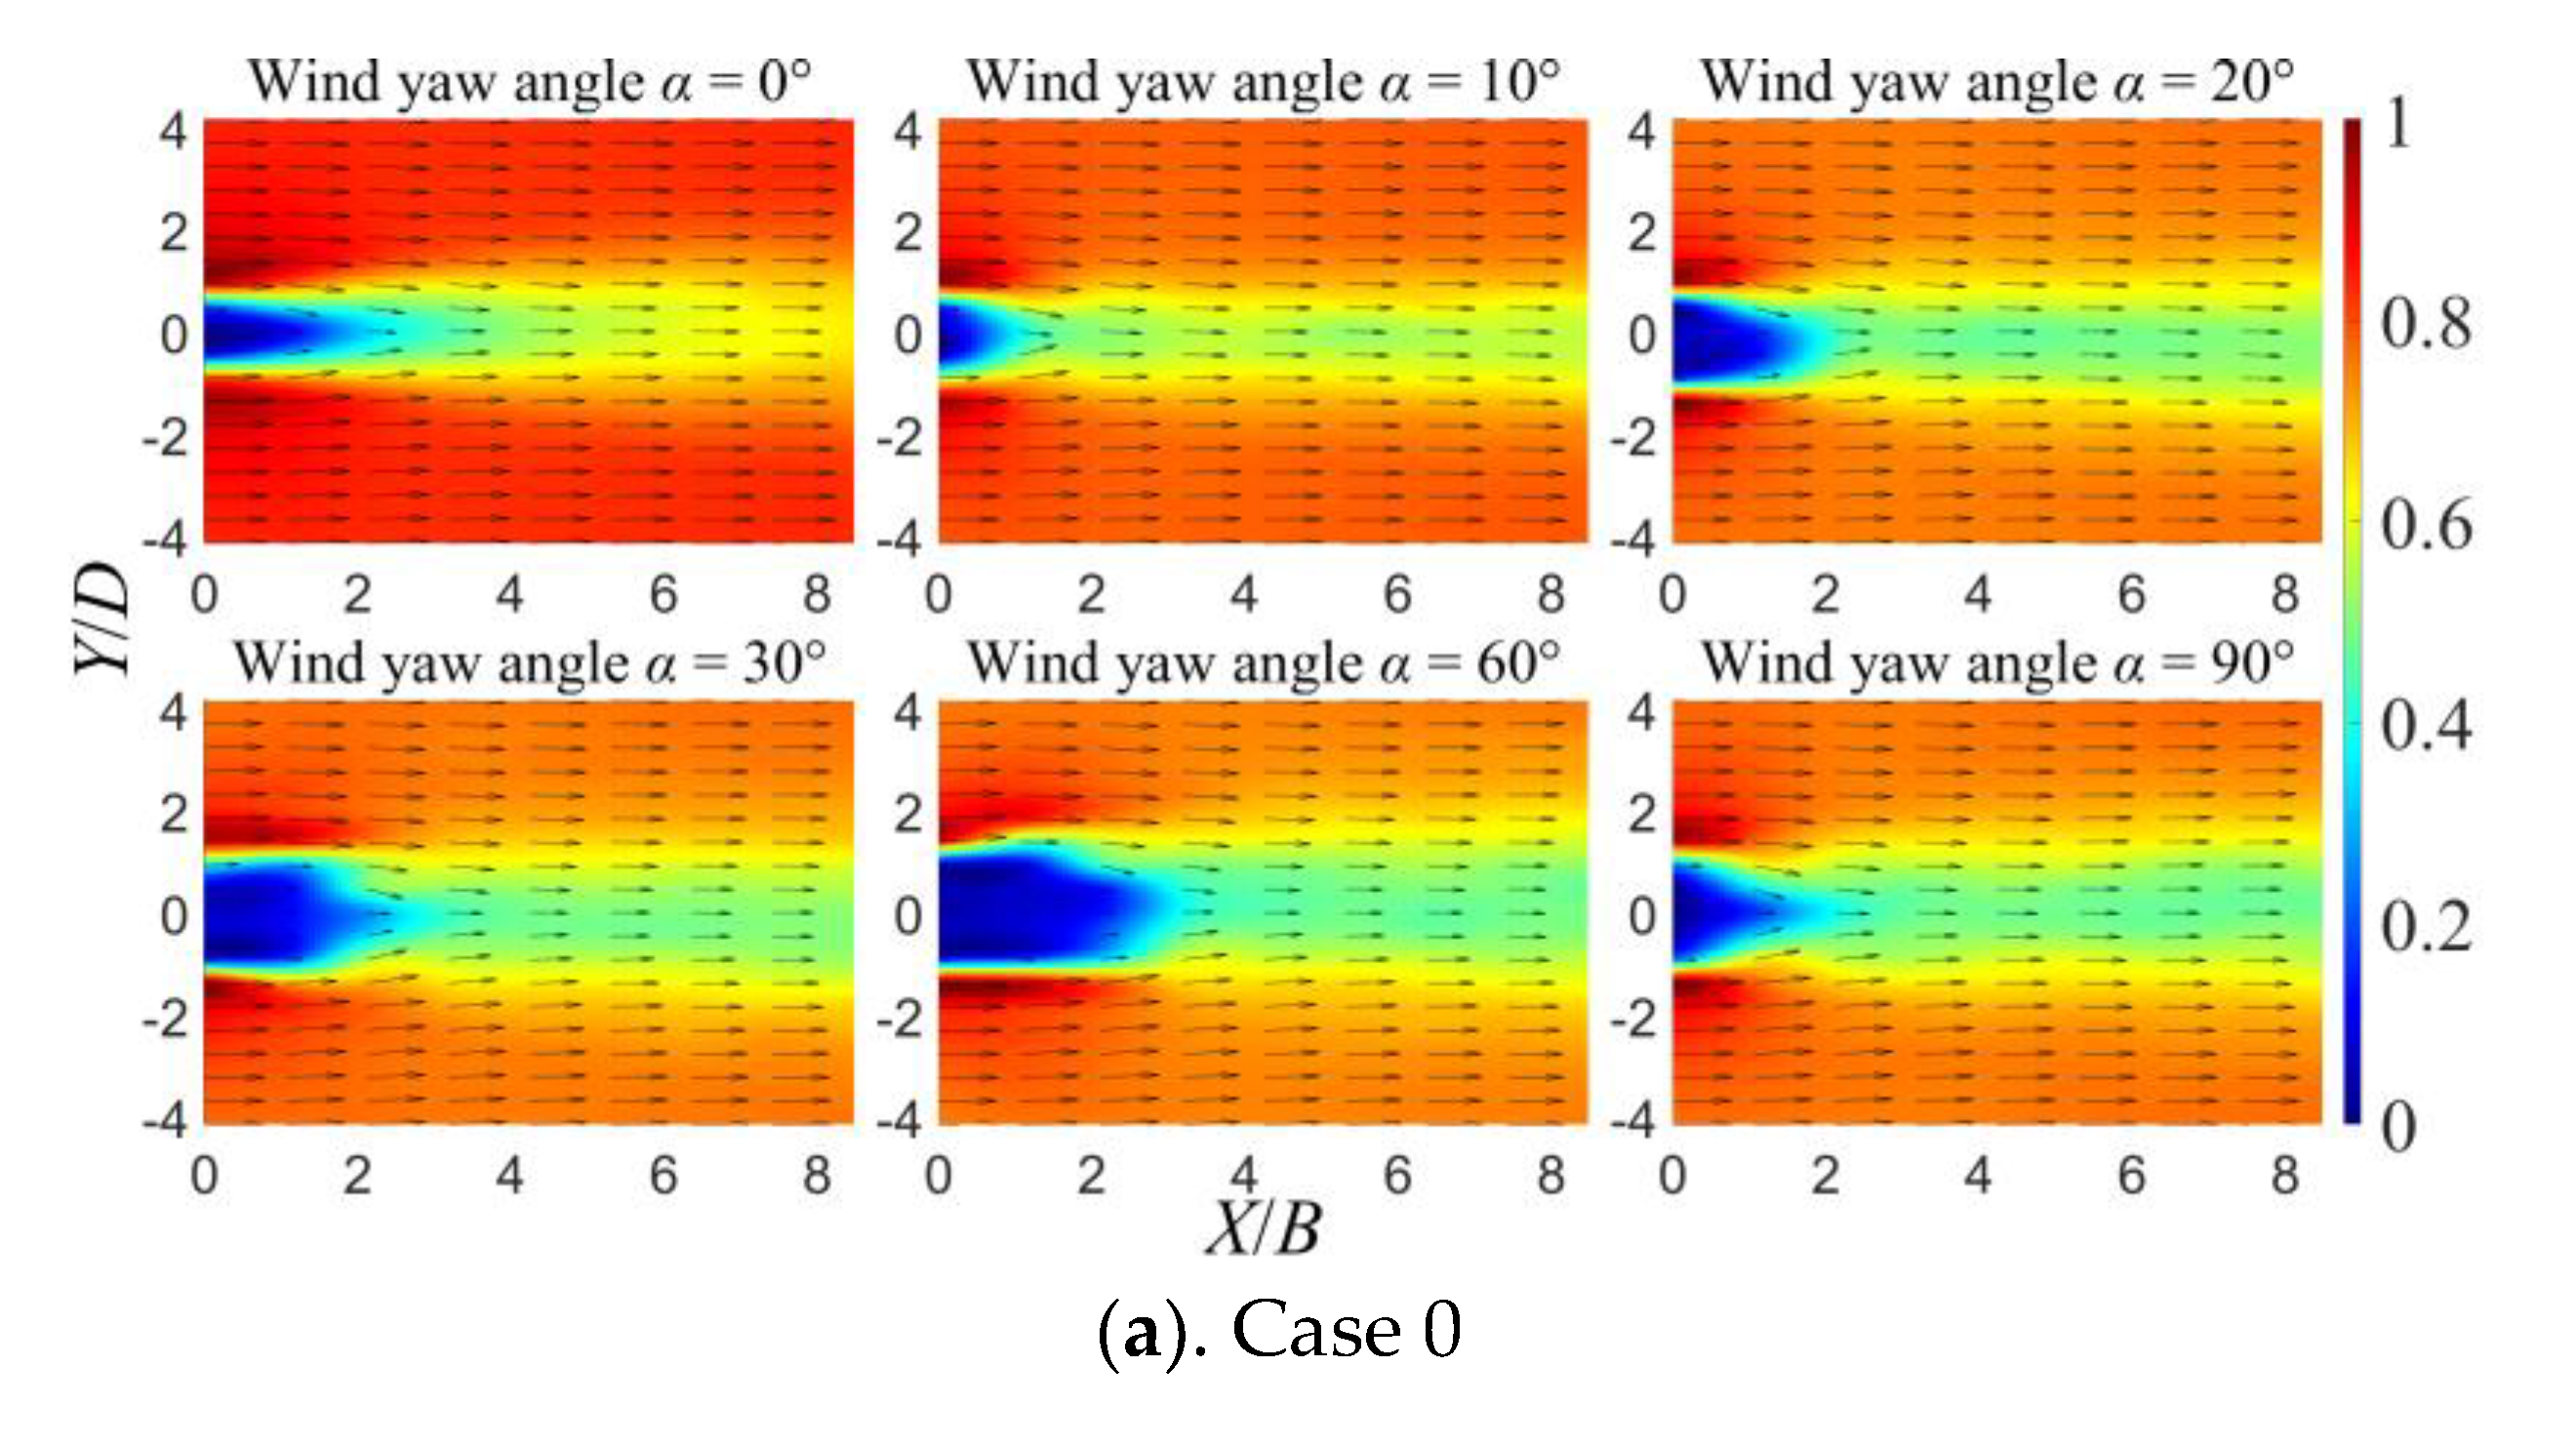
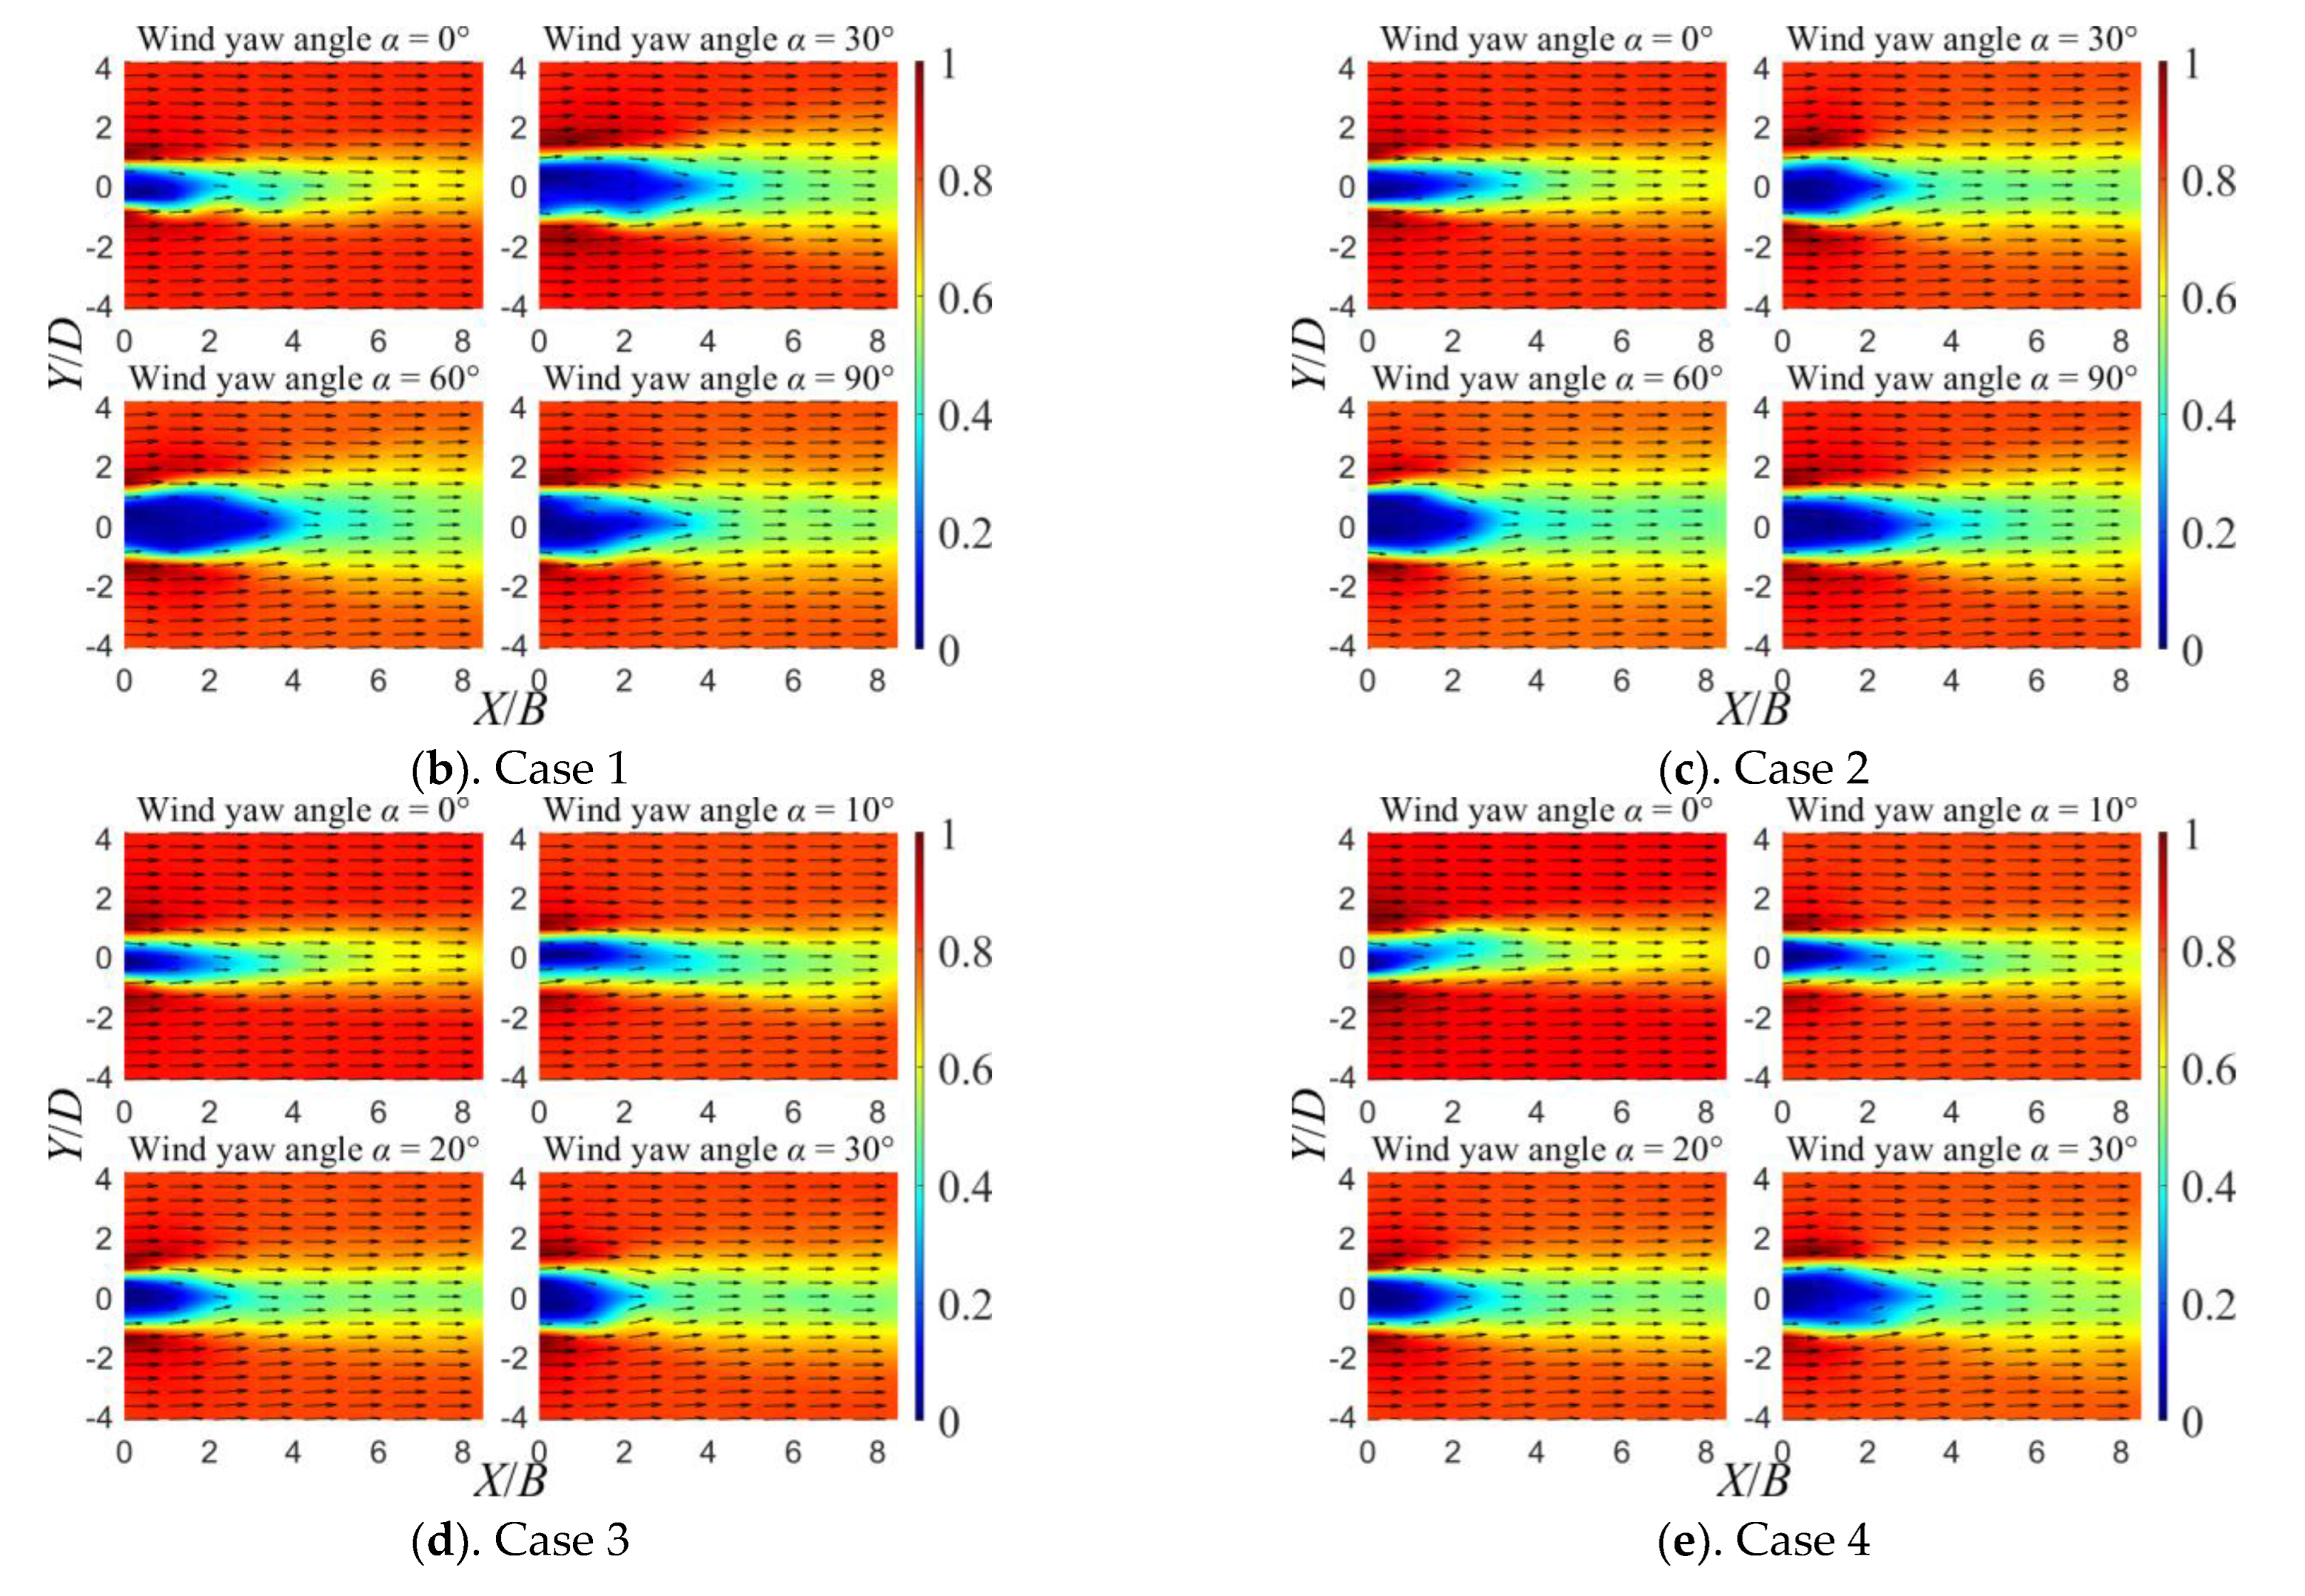
Figure 5.
Dimensionless area of low-speed region.
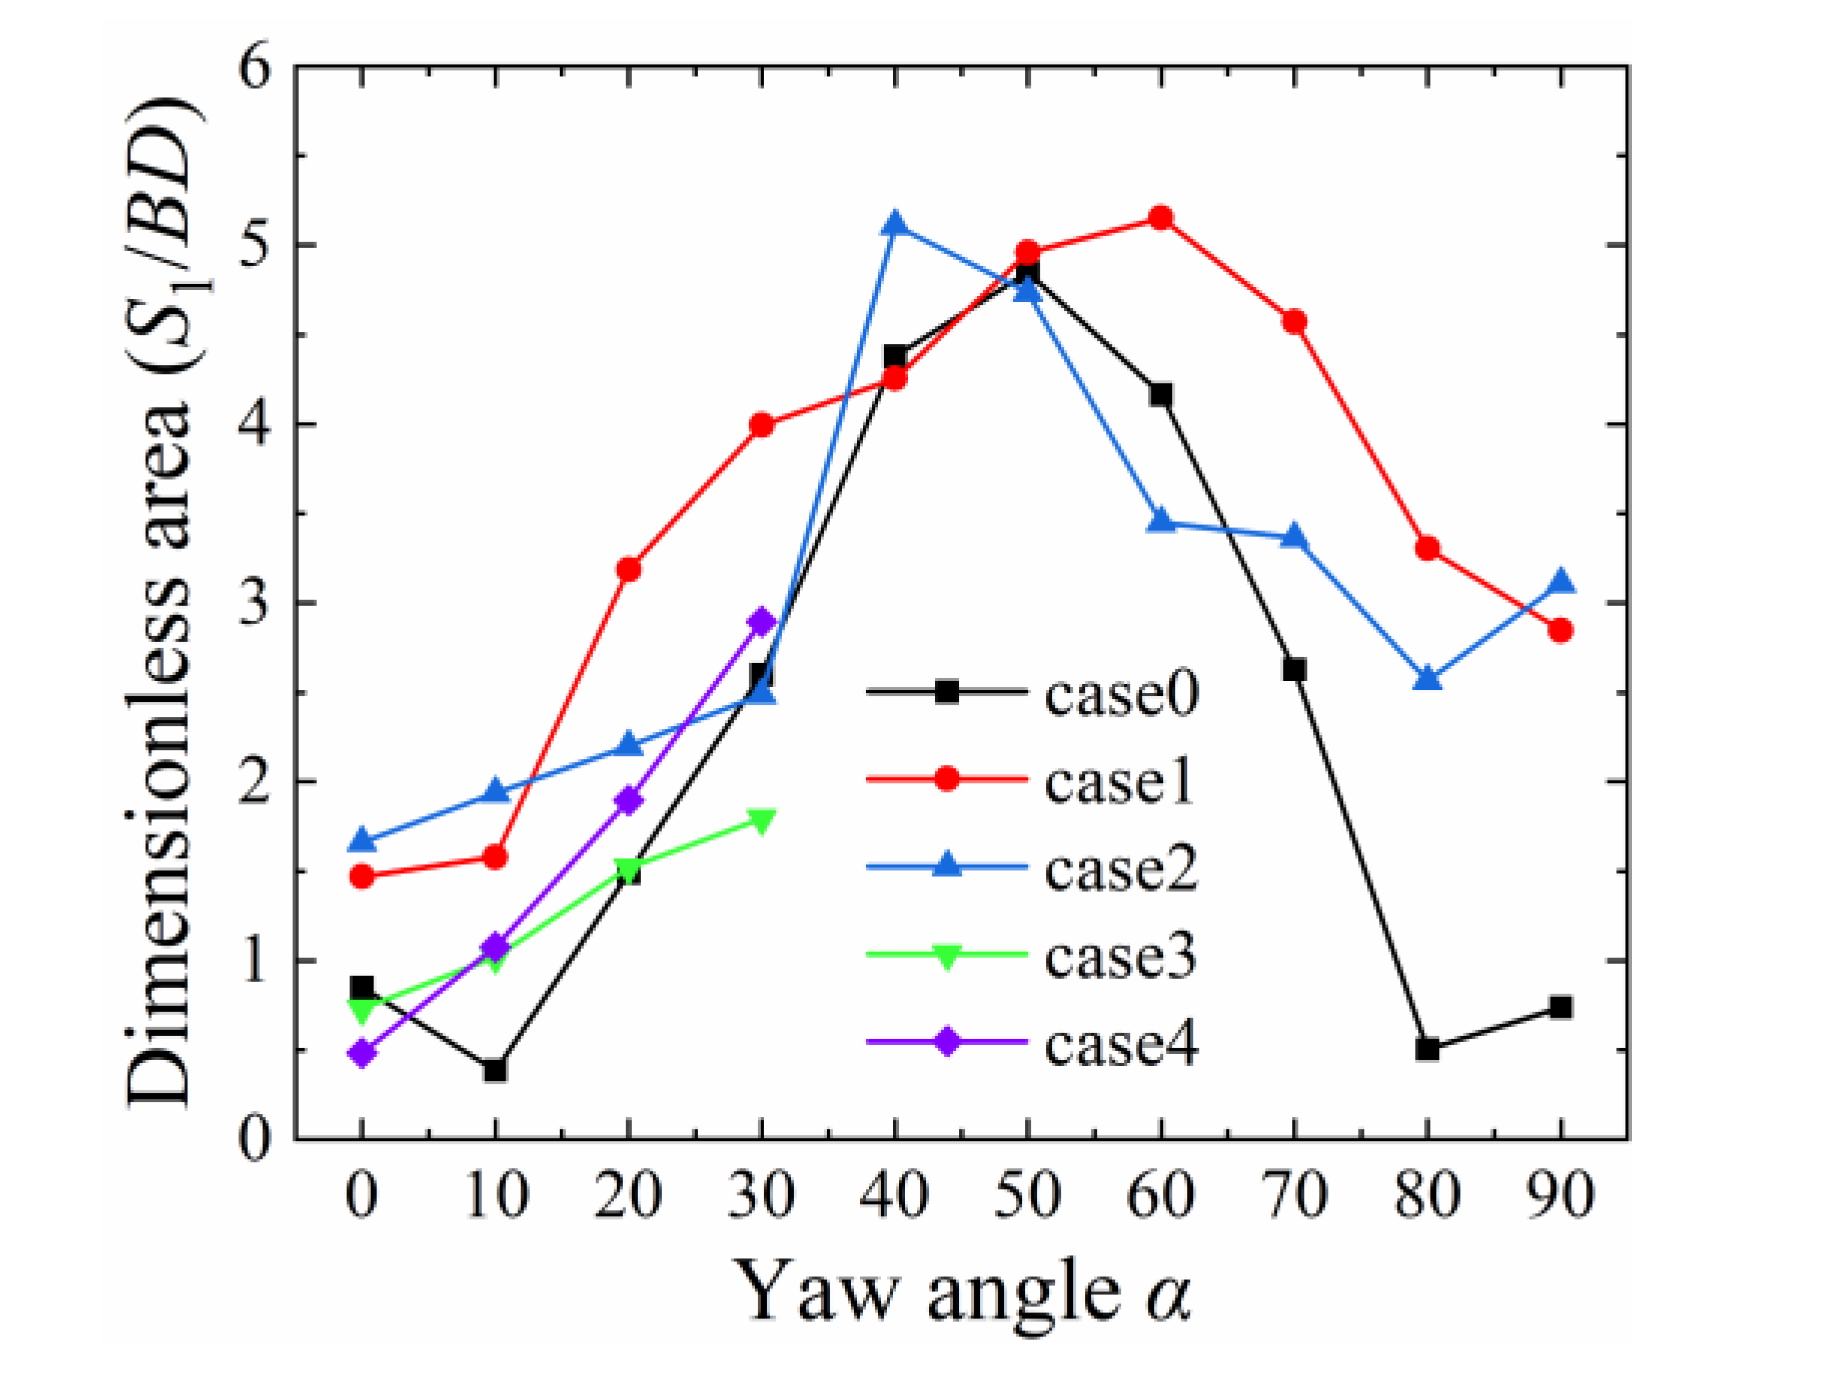
Figure 6.
Dimensionless speed distribution at X/B = 8.48.

Figure 7.
Turbulence intensity distribution of tower wake.
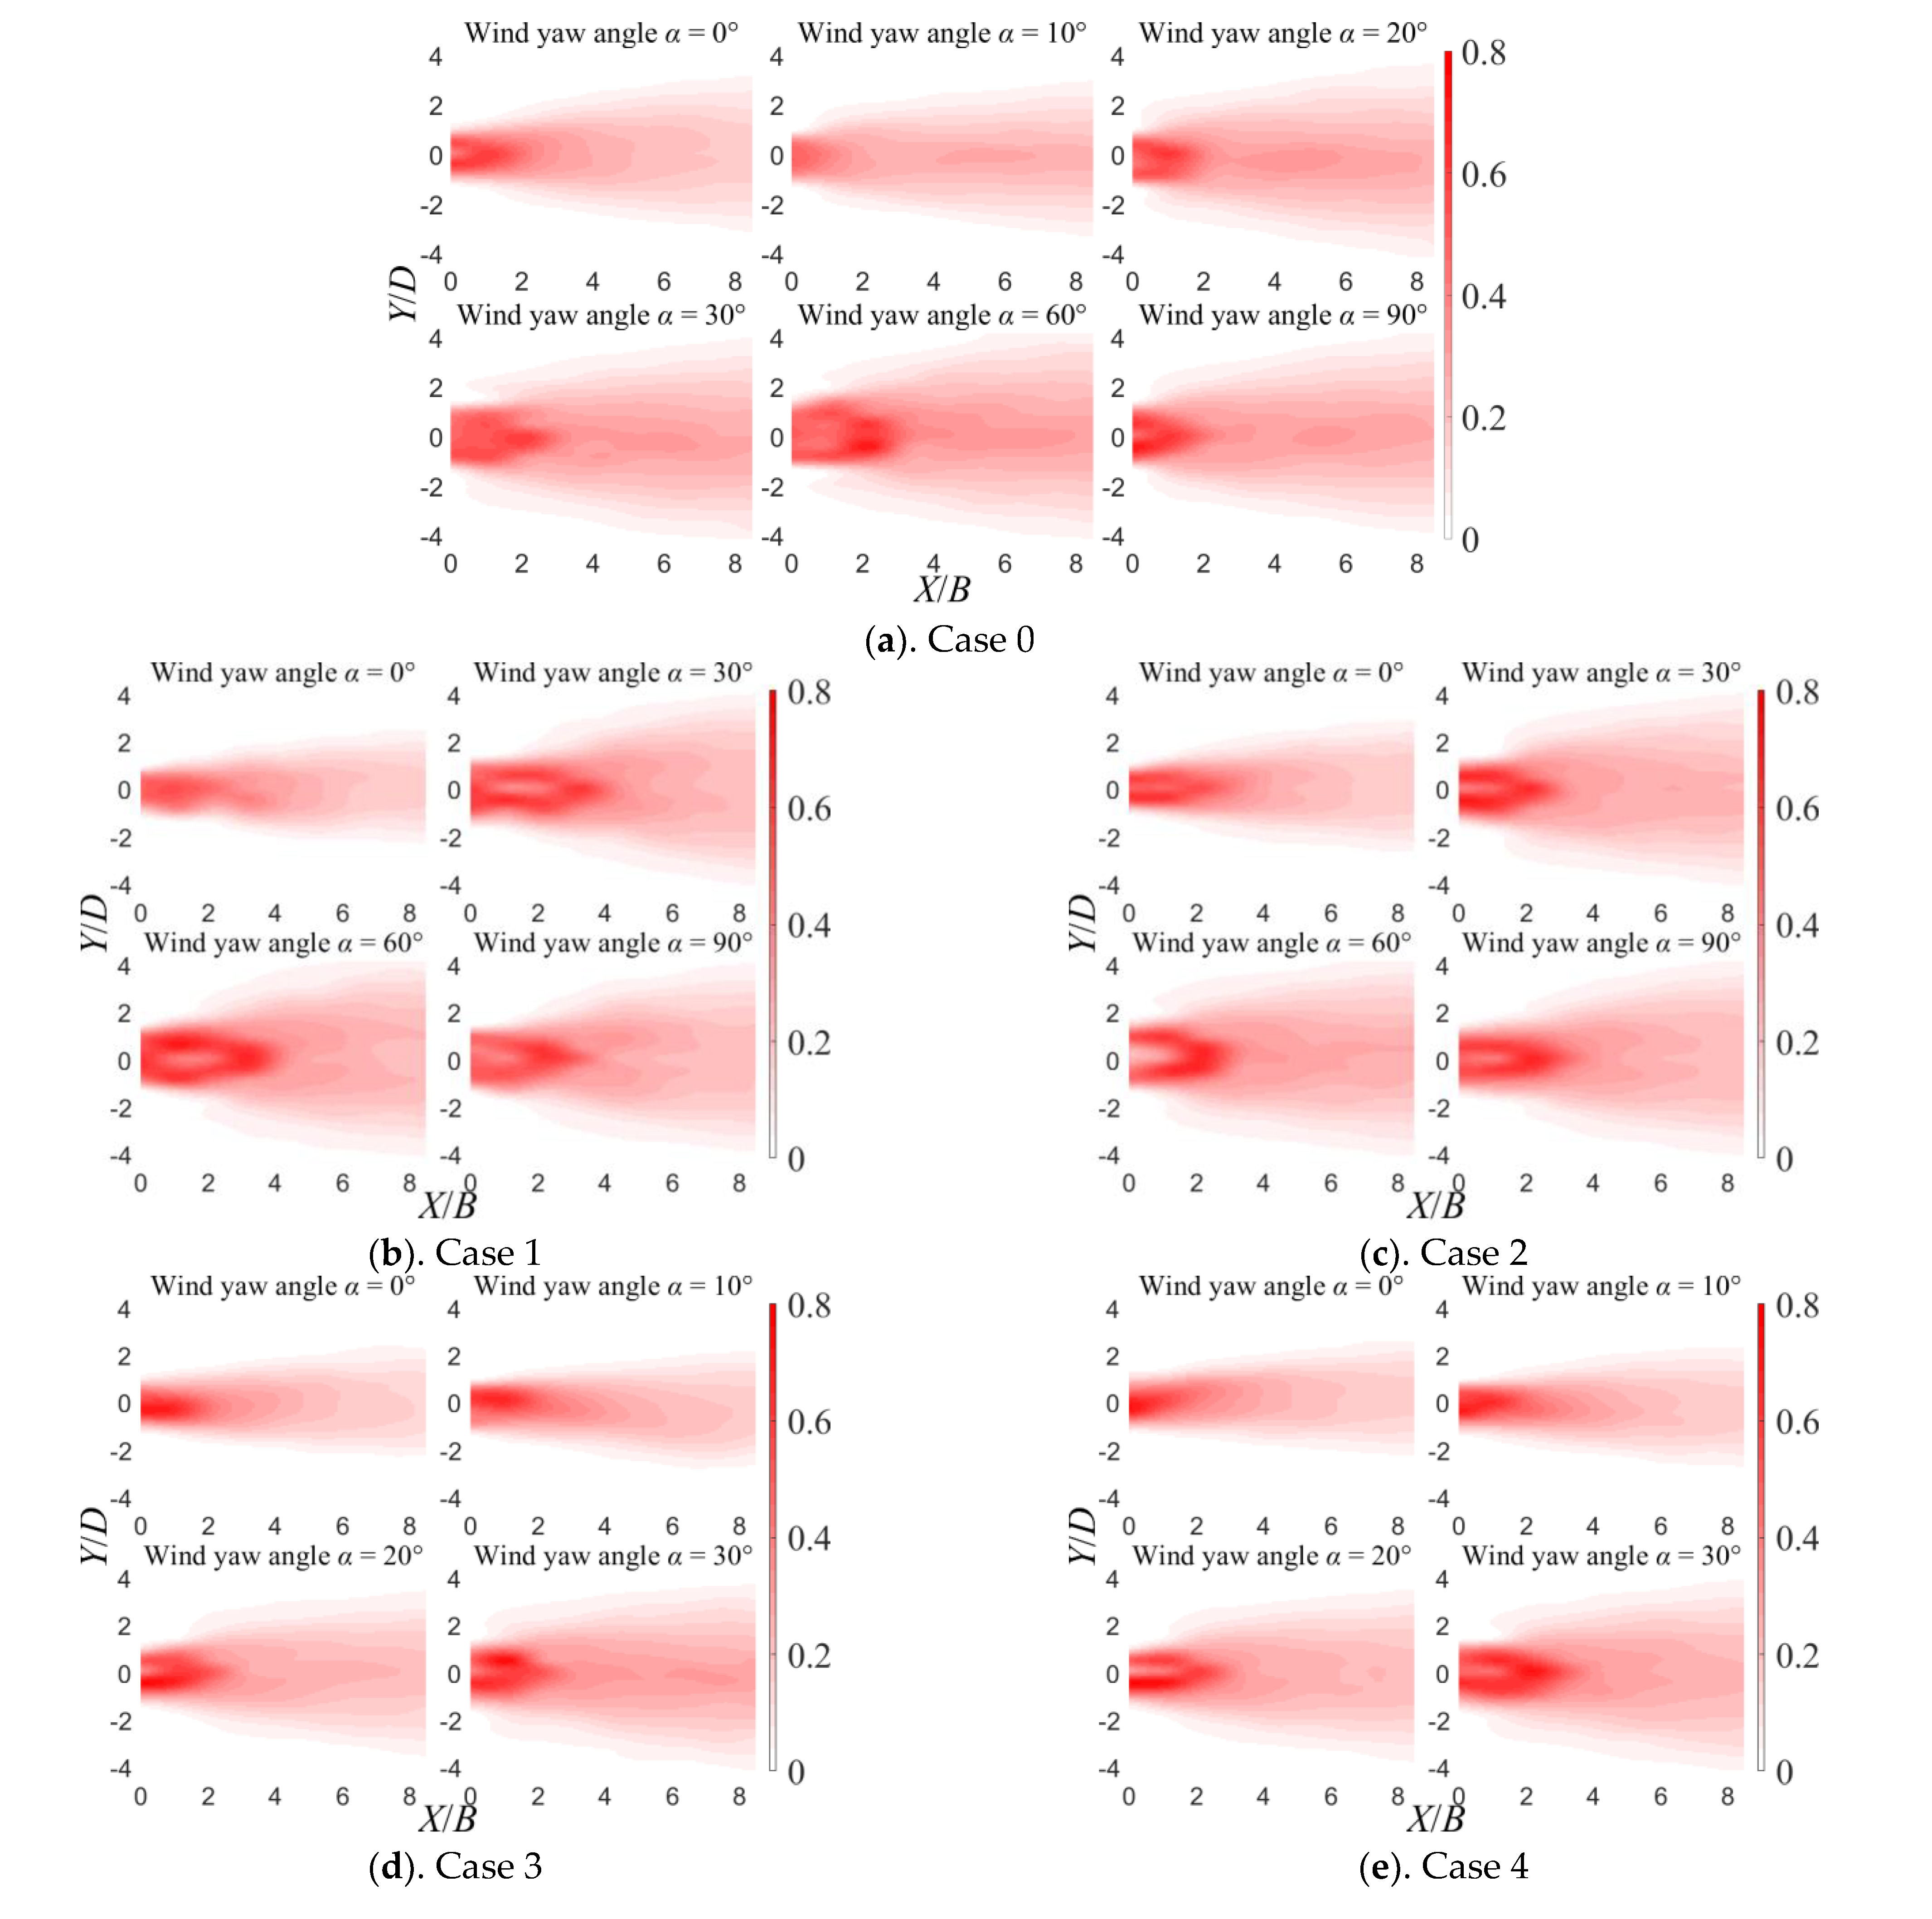
Figure 8.
Turbulence intensity distribution at X/B = 8.48.
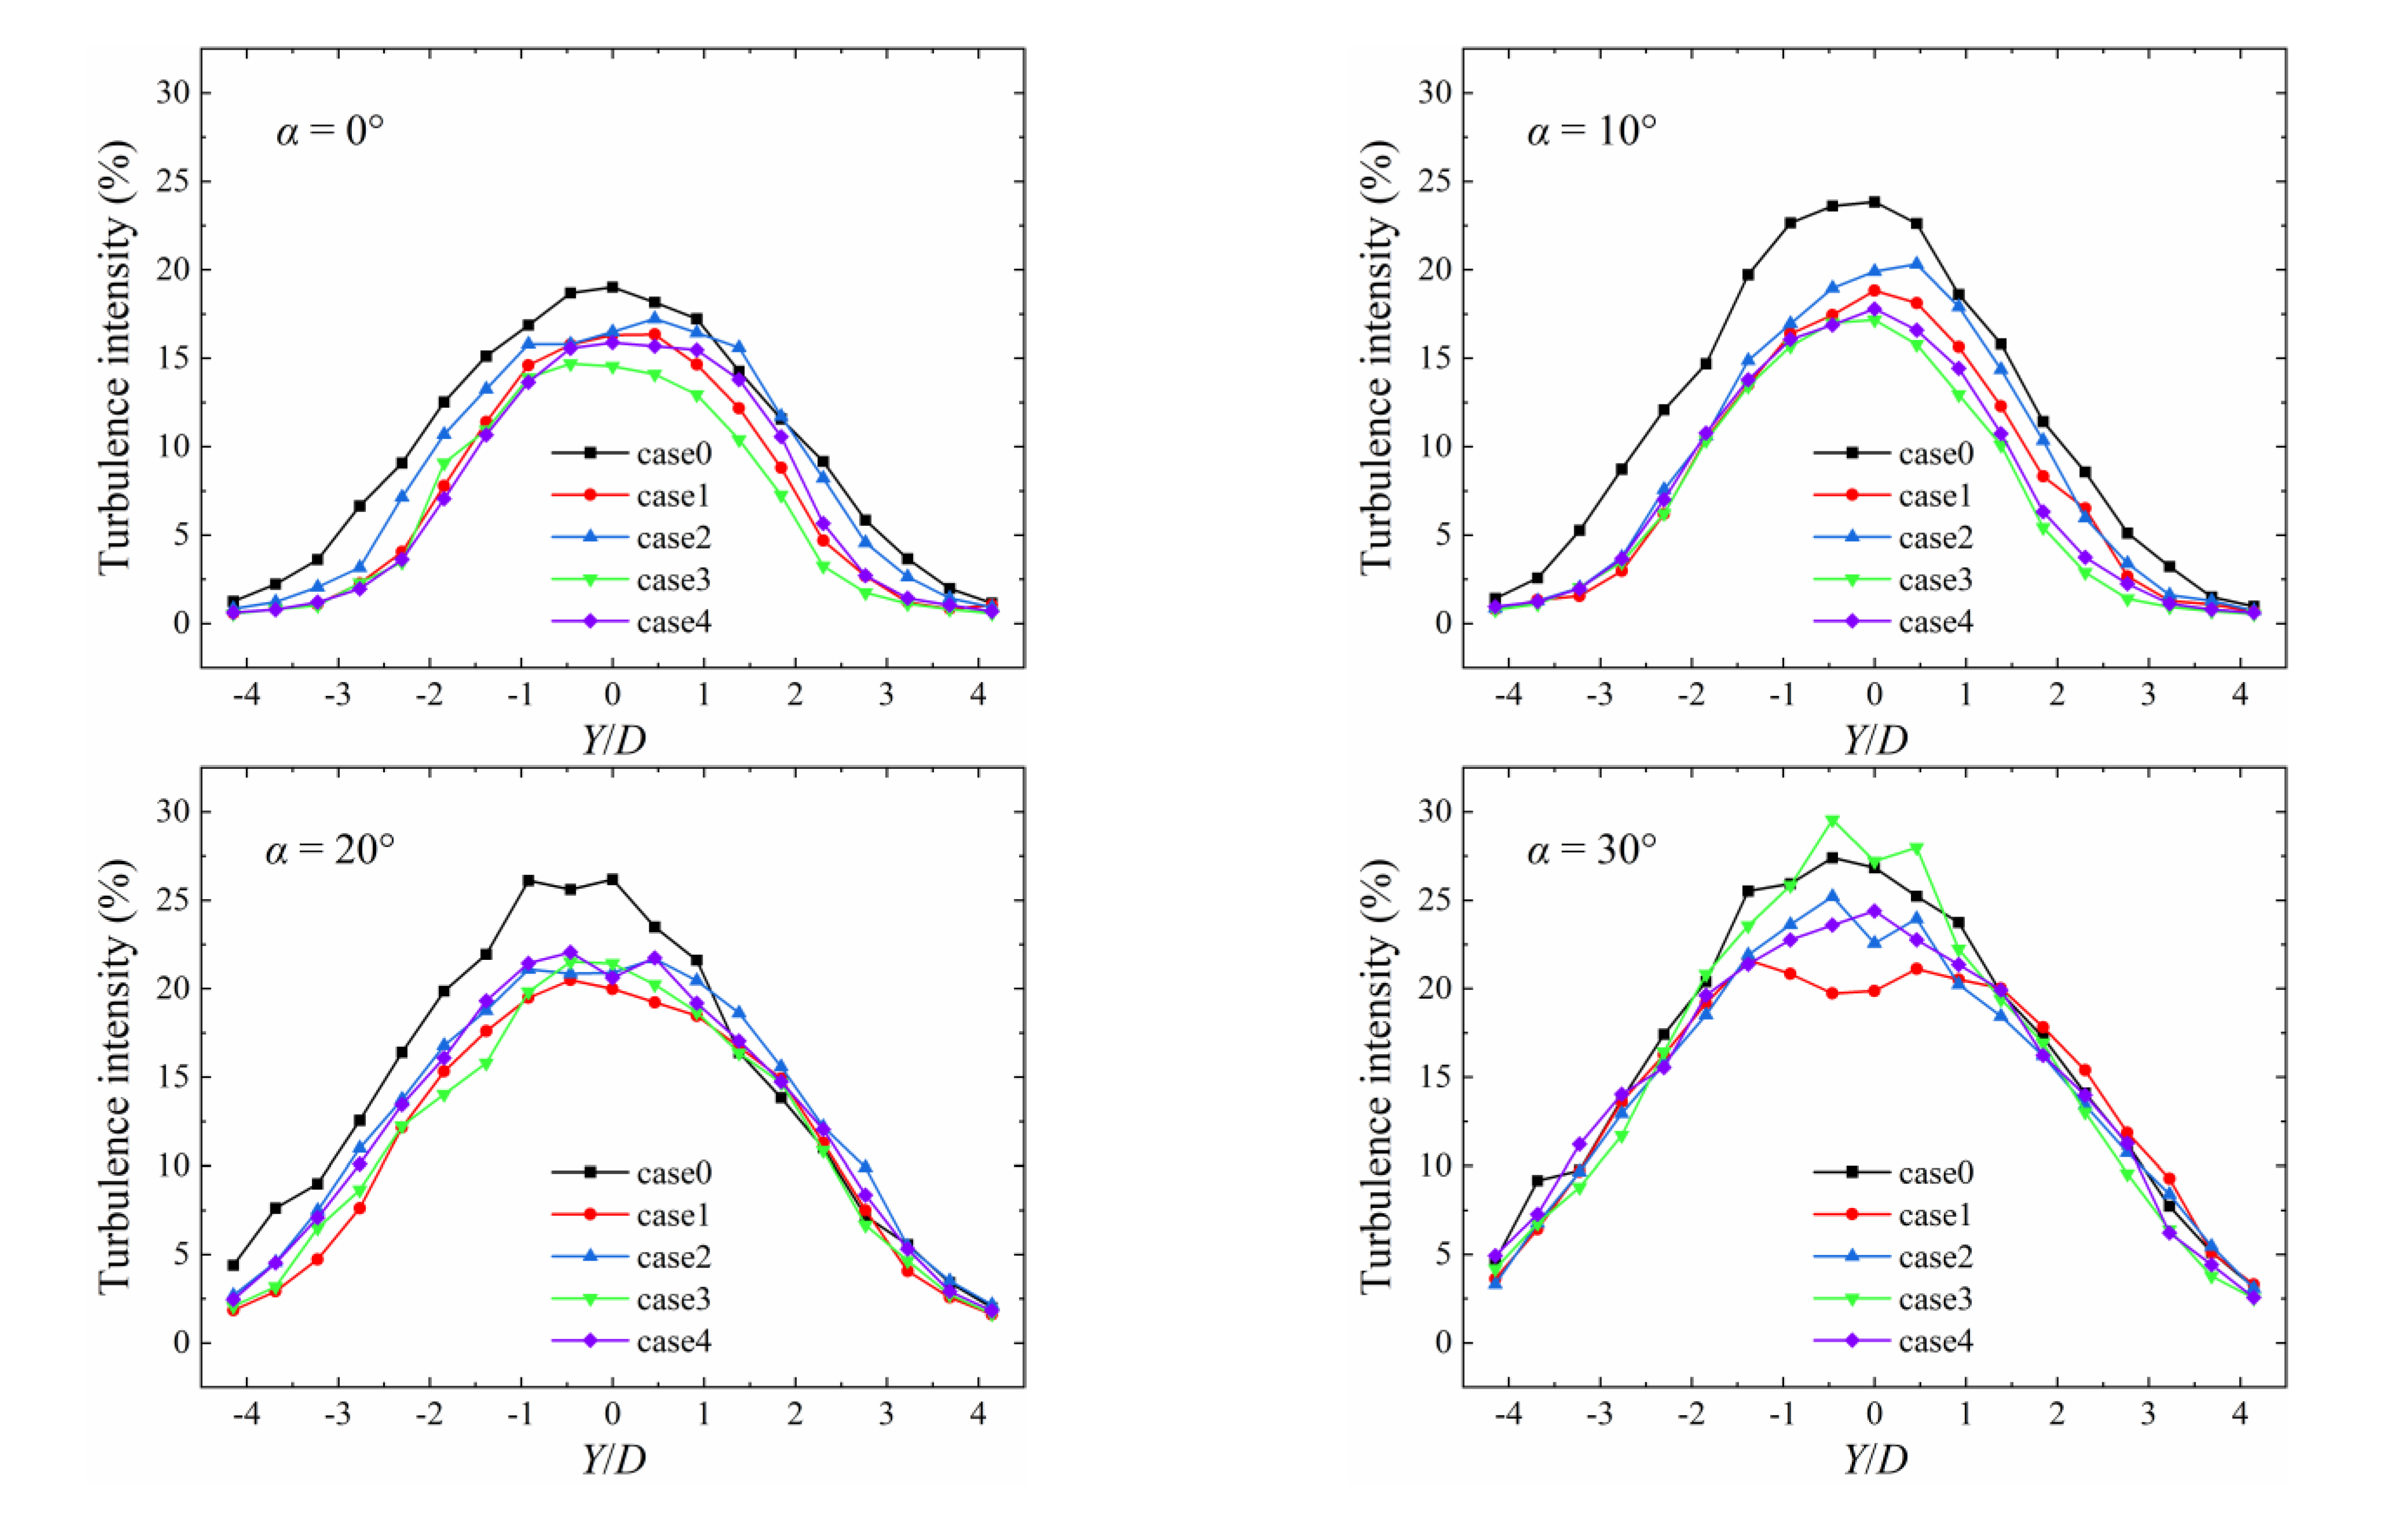
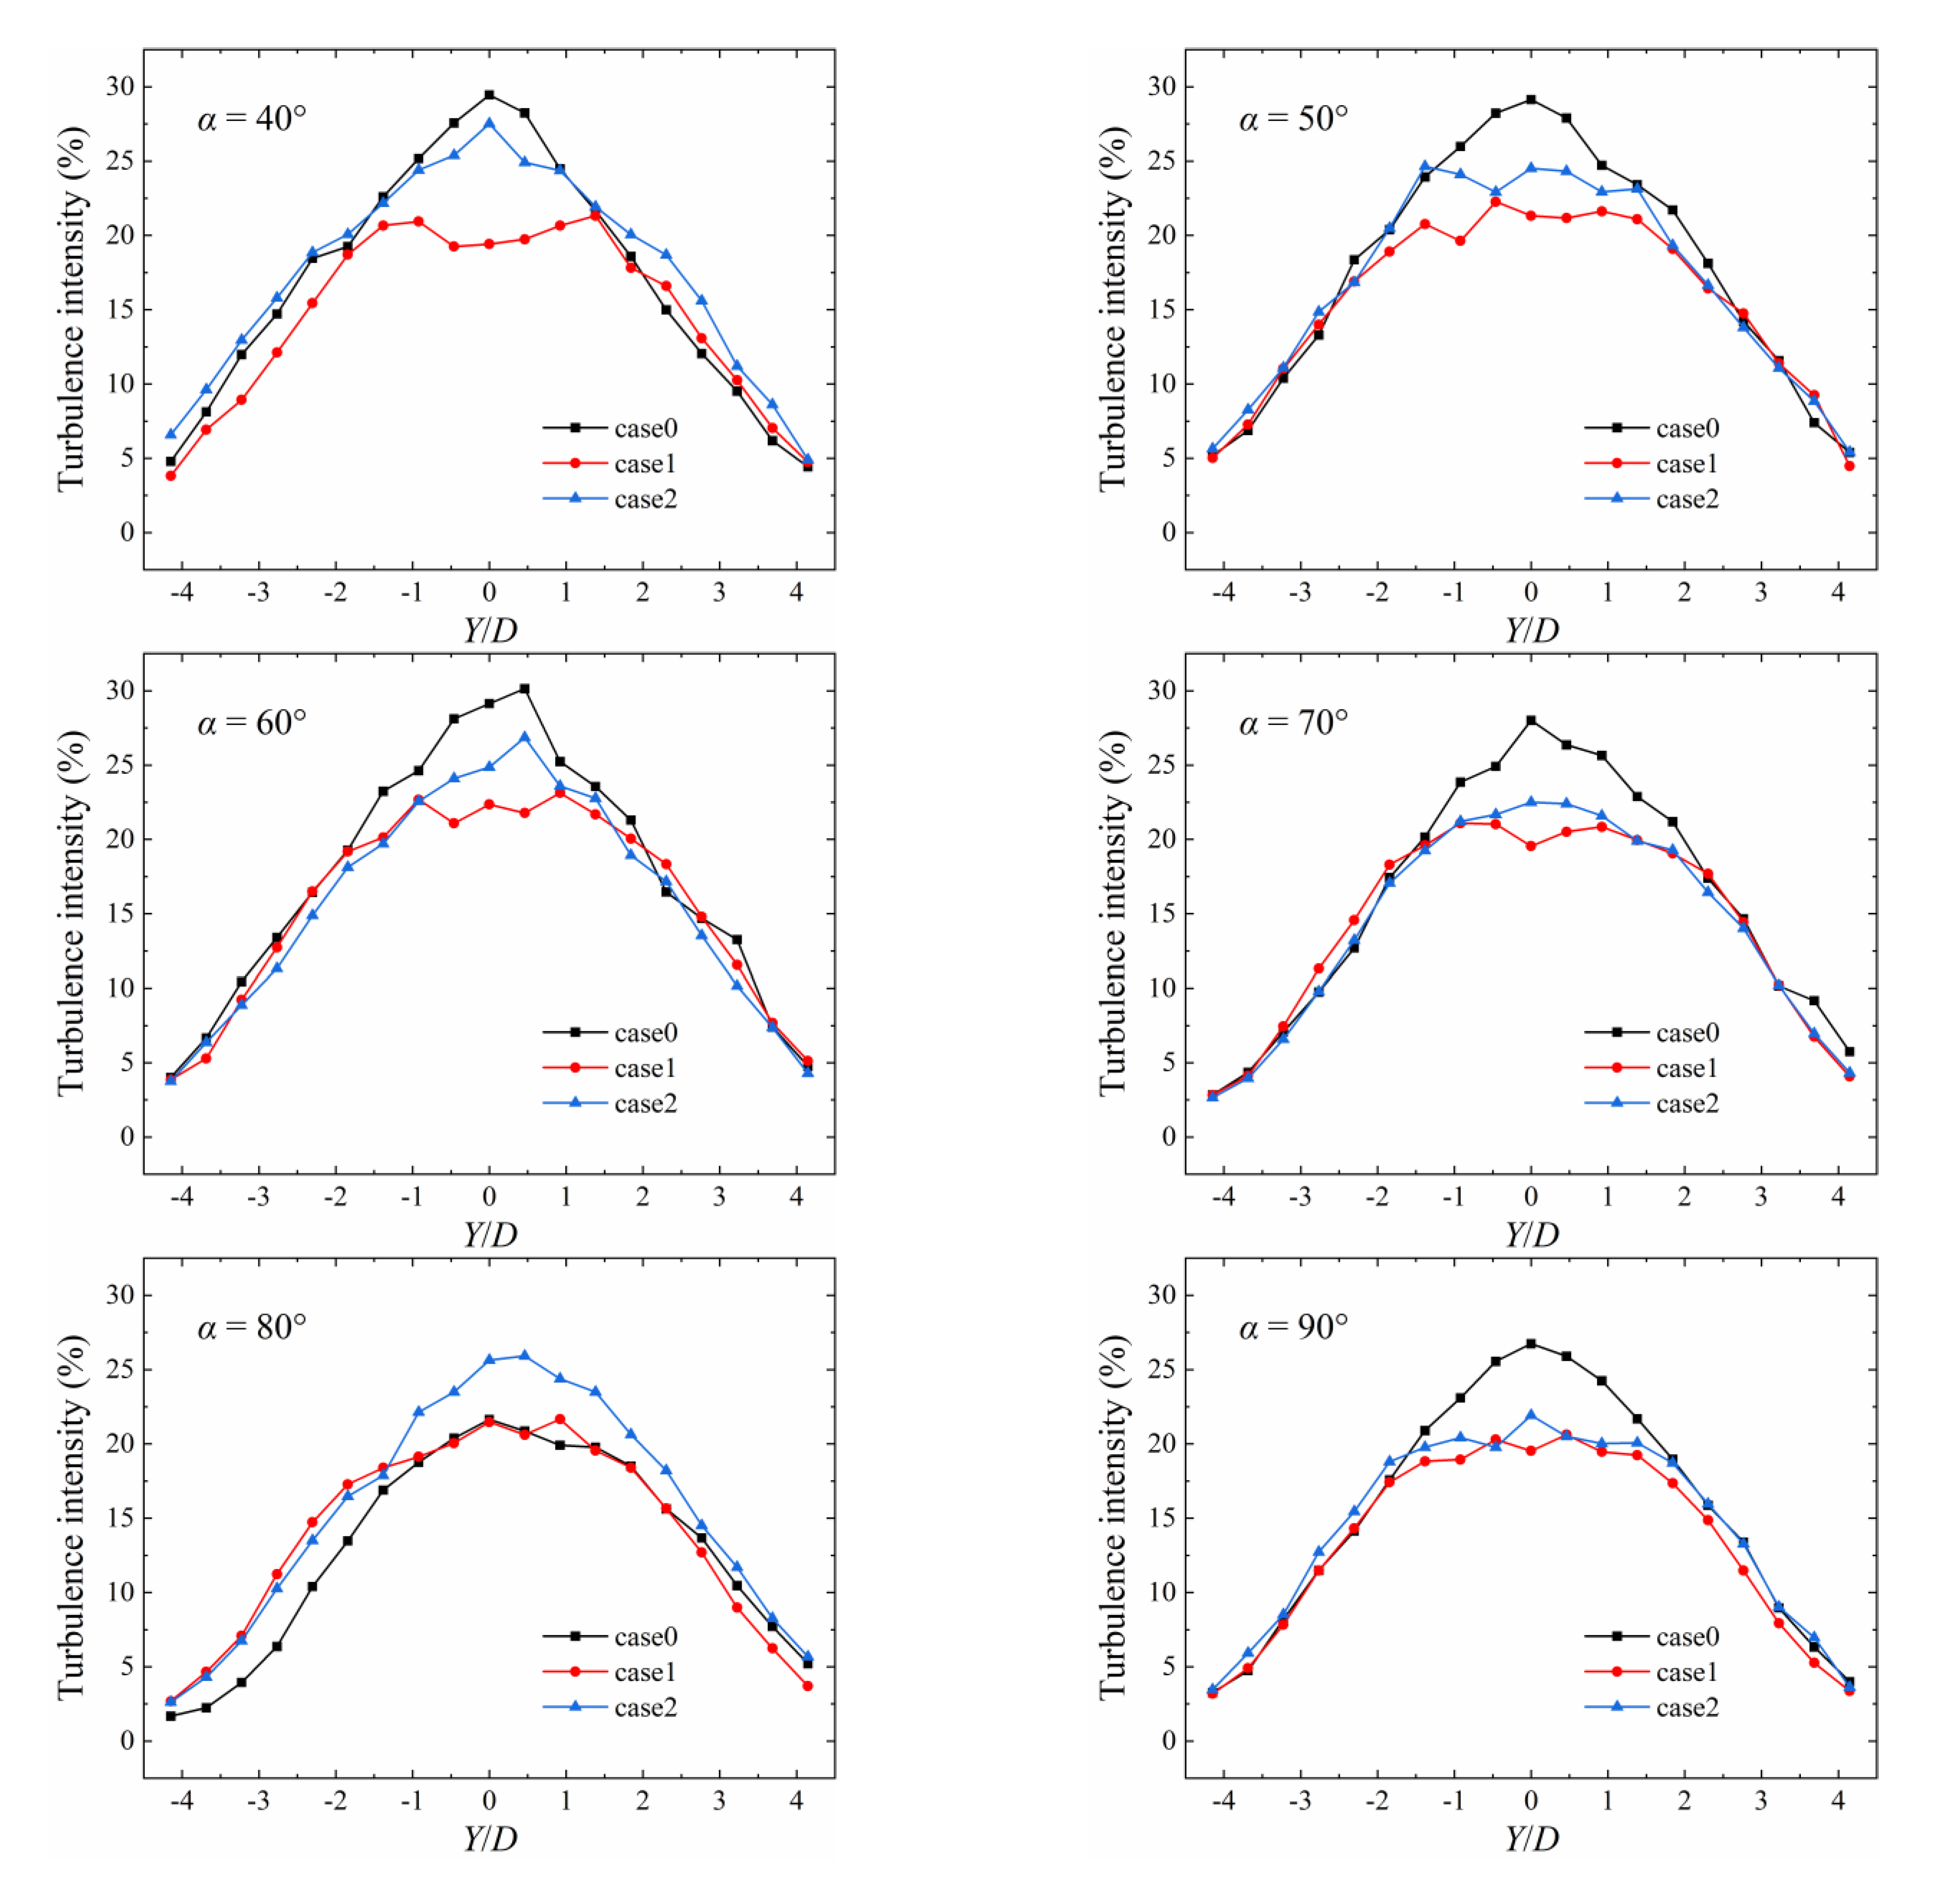
Figure 9.
Dimensionless dominant frequency (fD/U0) distribution of tower wake.
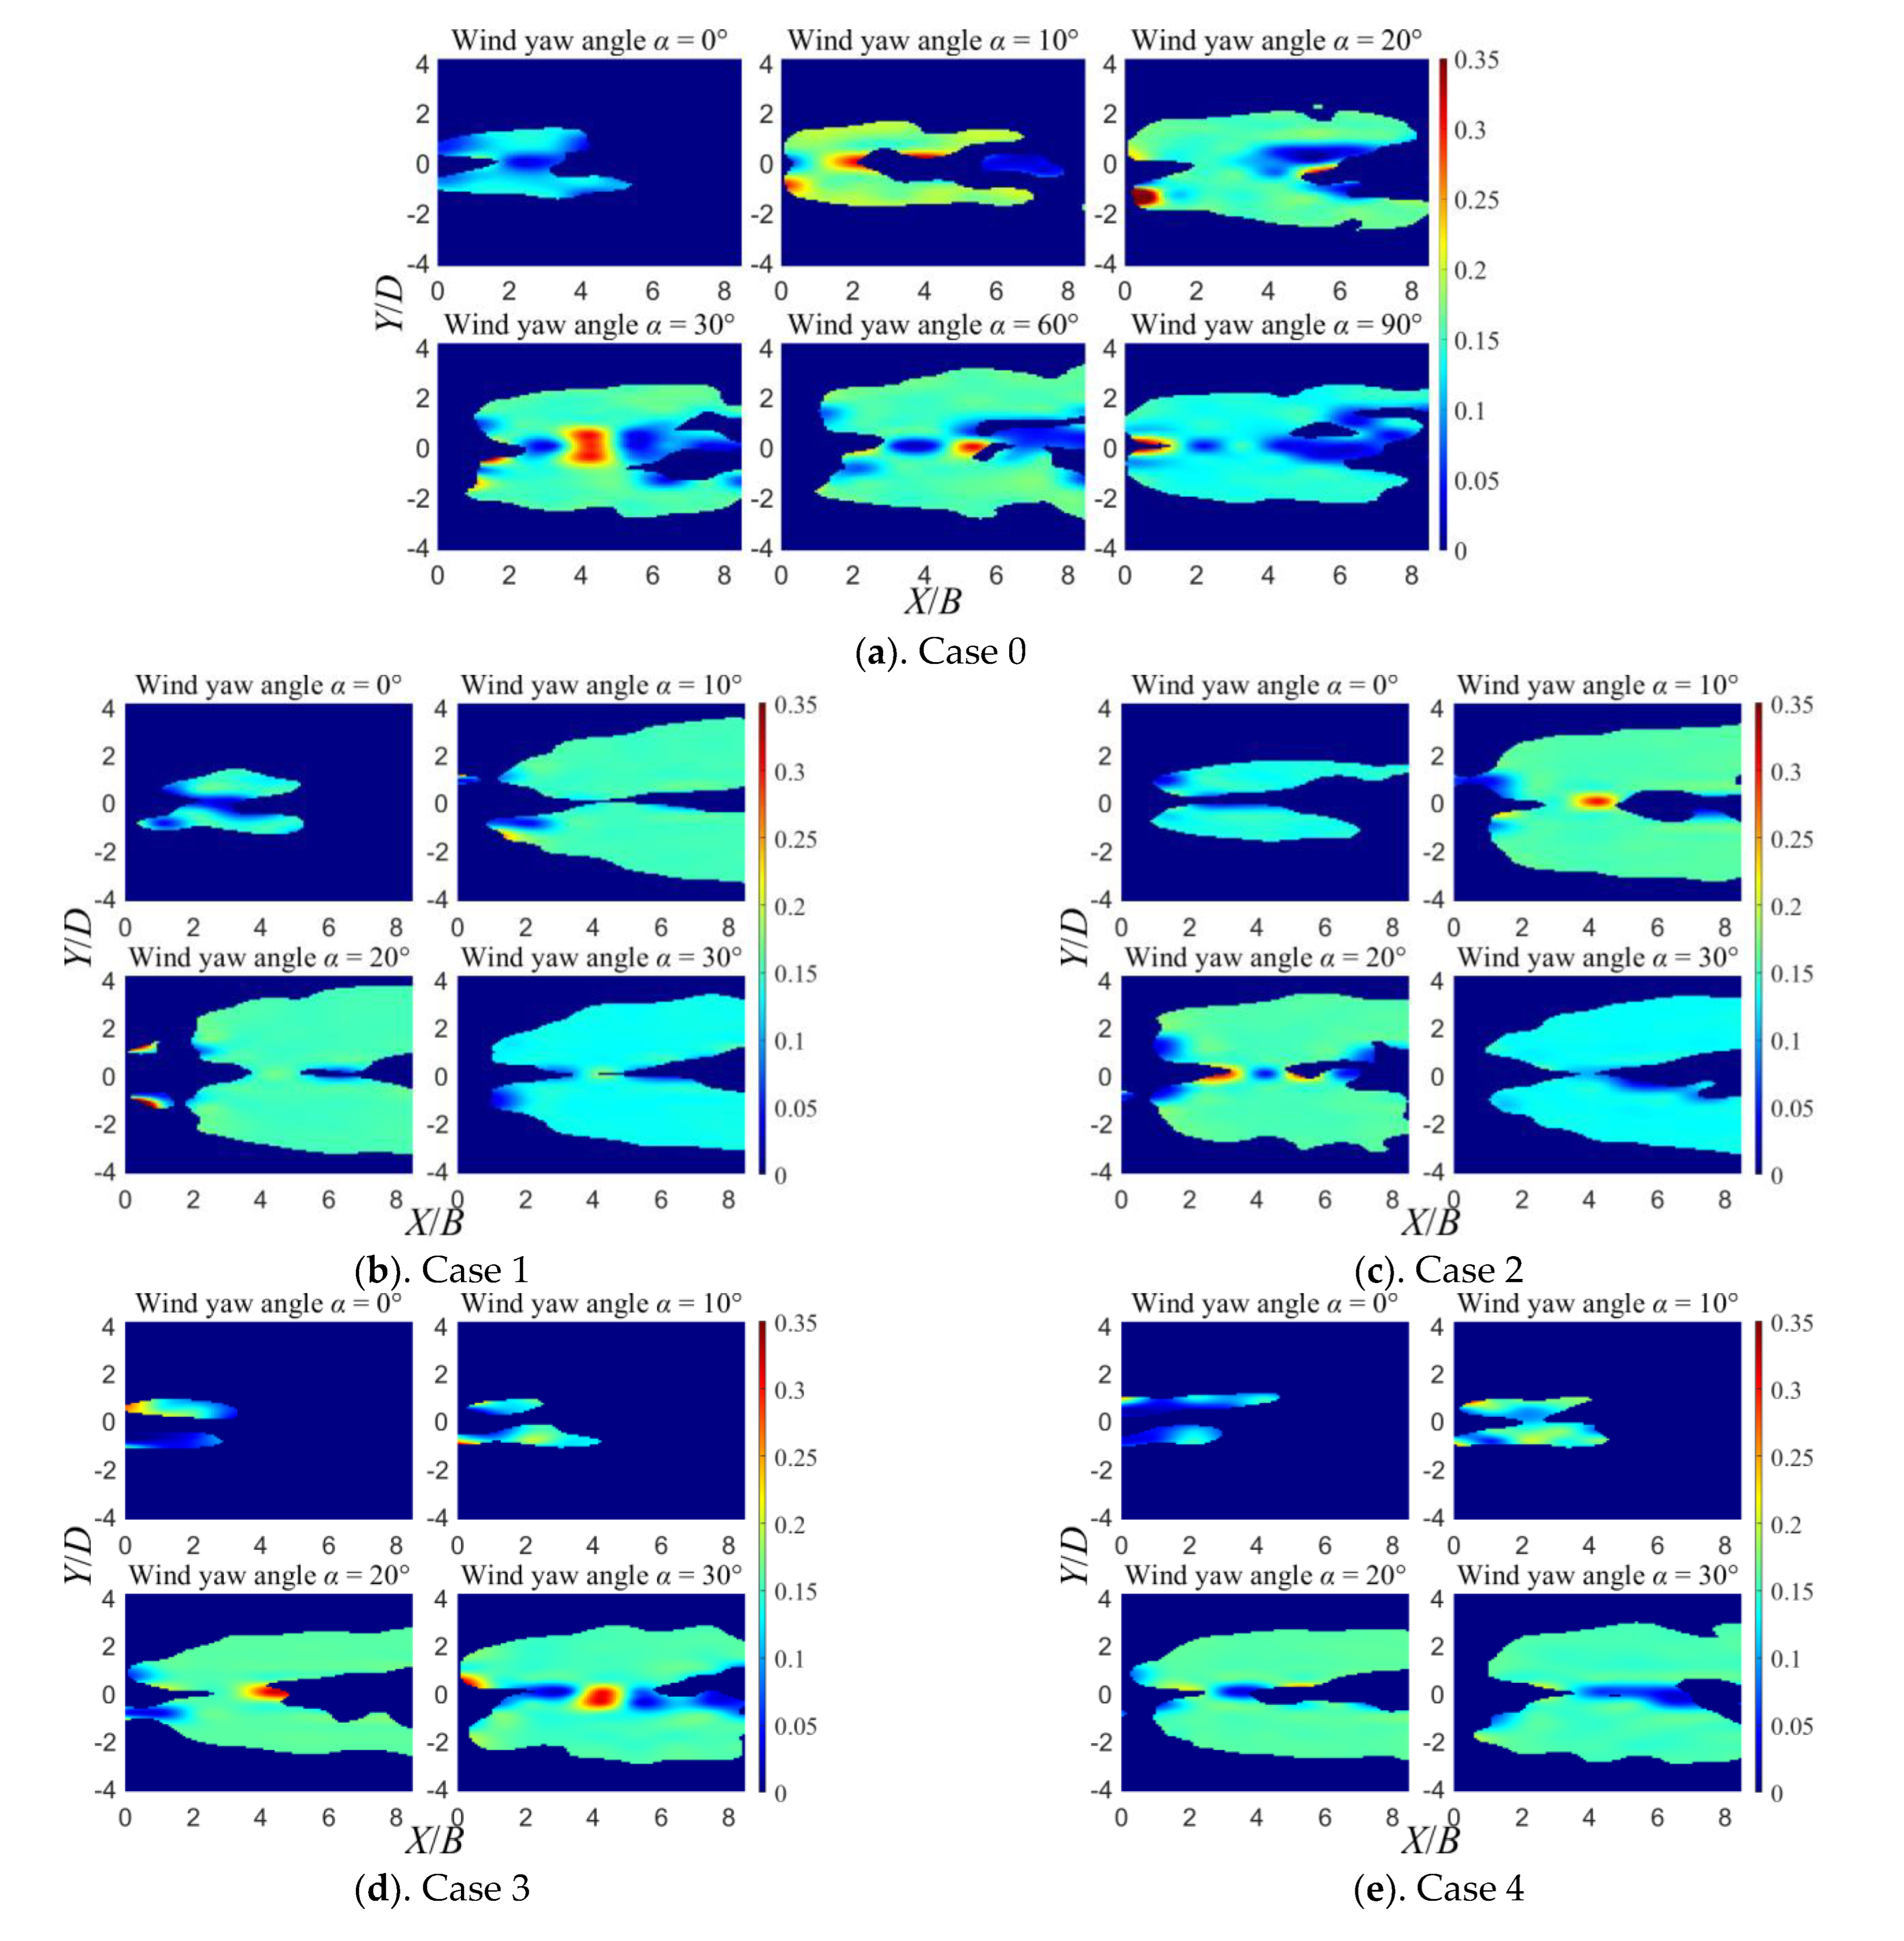
Figure 10.
Area of PSD > 0.5 dominant frequency distribution region.

Table 1.
Test conditions of the experiment.
| Designation | Type of Passive Jet Ring | Slits Number at Long Side | Slits Number at Short Side | Length of Slits |
|---|---|---|---|---|
| Case 0 | without control | - | - | - |
| Case 1 | Category 1 | 9 | 7 | 80 mm |
| Case 2 | Category 2 | 7 | 5 | 60 mm |
| Case 3 | Category 3 | 0 | 7 | 80 mm |
| Case 4 | Category 4 | 0 | 5 | 60 mm |
Table 2.
Suction coefficients for each case in the experiment.
| Yaw Angle | 0° | 10° | 20° | 30° | 40° | 50° | 60° | 70° | 80° | 90° |
|---|---|---|---|---|---|---|---|---|---|---|
| Case 1 | 0.654 | 0.656 | 0.658 | 0.660 | 0.661 | 0.663 | 0.664 | 0.665 | 0.667 | 0.669 |
| Case 2 | 0.350 | 0.357 | 0.363 | 0.367 | 0.371 | 0.374 | 0.378 | 0.381 | 0.385 | 0.390 |
| Case 3 | 0.654 | 0.535 | 0.449 | 0.379 | - | - | - | - | - | - |
| Case 4 | 0.350 | 0.287 | 0.240 | 0.203 | - | - | - | - | - | - |
Publisher’s Note: MDPI stays neutral with regard to jurisdictional claims in published maps and institutional affiliations. |
© 2022 by the authors. Licensee MDPI, Basel, Switzerland. This article is an open access article distributed under the terms and conditions of the Creative Commons Attribution (CC BY) license (https://creativecommons.org/licenses/by/4.0/).
Share and Cite
MDPI and ACS Style
Huang, Y.; Chen, W. An Experimental Investigation of Passive Jet Control Method on Bridge Tower Wake. Appl. Sci. 2022, 12, 4691. https://doi.org/10.3390/app12094691
AMA Style
Huang Y, Chen W. An Experimental Investigation of Passive Jet Control Method on Bridge Tower Wake. Applied Sciences. 2022; 12(9):4691. https://doi.org/10.3390/app12094691
Chicago/Turabian StyleHuang, Yewei, and Wenli Chen. 2022. "An Experimental Investigation of Passive Jet Control Method on Bridge Tower Wake" Applied Sciences 12, no. 9: 4691. https://doi.org/10.3390/app12094691
Note that from the first issue of 2016, this journal uses article numbers instead of page numbers. See further details here.