
Computer Simulations of Dual-Antenna Microwave Ablation and Comparison to Experimental Measurements

Faculty of Environmental and Life Sciences, Beijing University of Technology, Beijing 100124, China
*
Authors to whom correspondence should be addressed.
Appl. Sci. 2023, 13(1), 26; https://doi.org/10.3390/app13010026
Submission received: 14 November 2022
/
Revised: 17 December 2022
/
Accepted: 17 December 2022
/
Published: 20 December 2022
(This article belongs to the Special Issue Recent Advances in Mathematical Modeling of Energy-Based Tumor Ablation)
Abstract
:Single-antenna microwave ablation (MWA) is mainly used to treat small tumors less than 3 cm in diameter. To obtain a larger coagulation zone in a single ablation, a dual-antenna ablation approach was proposed. A three-dimensional finite element method (FEM) simulation model of parallel dual-antennas was developed. Ex vivo experiments at 50 W for 8 min were performed to verify the model. Both the temperature changes in tissue and the size of the coagulation zone were recorded. The effects of dual-antenna spacing, heating power, and blood perfusion on the coagulation zone were analyzed. Fifteen experiments were carried out. The errors between the mean measurements and simulated results at the set temperature points were 1.08 °C, 0.95 °C, and 2.1 °C, respectively. For the same conditions, the blood perfusion of 1.0, 1.5, and 3.0 kg/(m3·s) can result in a reduction in the coagulation volume by 18.4%, 25.4%, and 42.5%. As the spacing increased, the coagulation zone of each antenna started to fuse together later and the resulting integral coagulation zone became larger. Dual-antenna MWA is expected to be used for the treatment of tumors larger than 5 cm in diameter.
1. Introduction
Hepatocellular carcinoma (HCC) is the third leading cause of cancer death worldwide [1]. The five-year survival rate for HCC is the second lowest after pancreatic cancer. [2]. Hepatic resection surgery, liver transplantation, and ablation therapy are common treatment means of HCC [3]. It is reported that most hepatic tumors are inoperable and only about 25% of patients are suitable for traditional surgical resection [4,5]. Minimally invasive techniques of liver tumor treatment such as radiofrequency (RF) ablation and microwave ablation (MWA) procedures have a wide range of indications [6]. MWA can be used as a complementary or stand-alone treatment for HCC [7]. Nowadays, CT-based [8] or ultrasound-guided [9] MWA of liver tumors is becoming more widely employed.
Most MWA applicators are performed with a single antenna. One of the most obvious shortcomings of single-antenna ablation is the small size of the coagulation zone [10]. For small tumors less than 3 cm in diameter, the physician is required to ablate them completely at once [11]. Thus, single-antenna ablation requires a precise puncture. For large tumors more than 5 cm in diameter, there is a continuing need for multi-antenna MWA [12]. To obtain a larger coagulation zone, many studies have been developed as early as 1993 by Clibon et al. [13]. It took more than 20 min of simultaneous heating of three to four antennas to achieve the therapeutic effect [14,15]. Trembly et al. [16] calculated the power deposition along a diagonal cross-section within a parallel array of four antennas. However, there were uneven temperatures, a complicated placement process, and a tendency for the position to shift. Mukherjee et al. [17] investigated the effect of parallel and non-parallel antennas on the shape of the coagulation zone. It was found that the 2.45 GHz needle applicator was more susceptible to antenna tip deflection than the 915 MHz antenna. Aparna et al. [18] found that the 2.45 GHz antenna could produce a larger coagulation zone more rapidly than the 915 MHz antenna. A dual-slot 2.45 GHz antenna was the best choice for MWA [19]. Poch et al. [20] investigated the multi-pin radiofrequency ablation (RFA) antennas and used a square triangular array of antennas to obtain a larger coagulation zone. Nevertheless, the cross-sectional area of the coagulation zone under application of three applicators was only around 958 mm2 [20]. Shi et al. [21] investigated the simulation of double 915 MHz antennas in ex vivo bovine livers, to provide the technical basis for treating large liver tumors in one ablation session. There has been an increasing demand for dual-antenna arrays or even multi-antenna MWA. Dual-antenna MWA has been proven to be clinically feasible. With ablation times between 3 and 7 min and a spacing between two antennas of 1 to 2 cm, tumors more than 5 cm in diameter can be treated. The clinical effects are satisfactory [22]. Dual-antenna MWA is always cost-saving and more convenient than multi-antenna (three or four antennas) MWA to both patients and surgeons. Therefore, dual-antennas are widely used in the ablation of large tumors [17]. However, the shortcomings of dual-antenna MWA are low temperatures, long treatment times, and difficult antenna deployment. How to achieve accurate tumor treatment with MWA with two needle applicators deserves further investigation.
In this study, in order to systematically analyze the coagulation zone changes of dual-antenna MWA, the simulation model was established and validated by ex vivo experiments. The spacing between two parallel antennas was continuously adjusted and the synchronous heating was kept on. The effects of heating power, dual-antenna spacing, and blood perfusion on the MWA coagulation zone were studied. In addition, the differences between isothermal and Arrhenius models of the coagulation zone were compared. A reliable prediction for dual-antenna MWA was generated because the heating parameters used in this study are common in clinical procedures [23], which could, in turn, provide clinical guidance for MWA procedures.
2. Materials and Methods
2.1. Experimental Setup
The experimental system consisted of a cooled-shaft MWA device (KY-2000; Kangyou Microwave Energy Sources Institute, Nanjing, China), two microwave antennas (KY-2450A), a metallic thermocouple (YWY-2, Kangyou Microwave Energy Sources Institute, Nanjing, China), and ex vivo porcine livers, as shown in Figure 1. The microwave device was equipped with two independent water-cooling systems. The thermocouple could record the temperature changes in real-time. The maximum power of the MWA device was 70 W and the maximum continuous heating time was 20 min. The microwave antennas operated at 2.45 GHz. The thermometer was 1 mm in diameter and 120 mm in length with a measurement accuracy of 0.1 °C.
In ablation procedures, the heating power always ranges from 40 W to 60 W, and the heating time is between 3 and 10 min. Therefore, the ex vivo MWA experiments were carried out by the dual-antenna array with the settings of 50 W and 8 min. The spacings between two antennas were set to 20 mm, 30 mm, and 40 mm, respectively.
2.2. Finite Element Modeling
The finite element simulation modeling was based on COMSOL Multiphysics (version. 5.5; COMSOL Inc., Stockholm, Sweden). The dimensions of the 2.45 GHz microwave antenna are shown in Table 1. As illustrated in Figure 2, the origin of the coordinate system was set at the emission point of one antenna. The initial and boundary conditions used in the simulation can be found in reference [24]. Two temperature measurement points P1 and P2 were arranged, where P1 is the midpoint of the two emission points and P2 is the point symmetrical to P1 about a microwave antenna. The positions of P1 and P2 in the model were varied with the dual-antenna array spacing.
The dual-antenna MWA results were simulated by coupling the solution of two physical fields, including the electromagnetic field and biological heat transfer field. The Helmholtz harmonic Equation (1) was used to calculate the electromagnetic energy deposition [25], and the specific absorption rate (SAR) in the tissue was calculated by Equation (2) [26]. The Pennes bioheat transfer Equation (3) [27] was used to solve for transient heat transfer within the tissue.
where is the relative permittivity of the biological tissue; is the relative permittivity of the vacuum; is the electrical conductivity of the biological tissue (S/m); is the electric field strength (V/m); is the relative magnetic permeability ( = 1); denotes the free space wave number; is the tissue density (kg/m3); is the specific absorption rate (W/kg); denotes the temperature (°C); is the time (s); denotes the specific heat capacity (J/(kg·°C)); denotes the specific heat capacity of blood (J/(kg·°C)); is the thermal conductivity (W/(m·°C)); is the blood perfusion (kg/(m3·s)); is the heat generated by tissue metabolism (W/m3). The subscript “b” represents the related parameters of blood.
In the FEM model, in order to describe the real variation in input parameters, the temperature-dependent electrical parameters, the specific heat capacity function based on water content variation, and the linear thermal conductivity function were used in this study.
The specific heat capacity function based on the change in water content is as follows [28]:
where and represent the specific heat capacities at 25 °C and 70 °C, respectively; represents the temperature coefficient ; represents the latent heat constant (set to 2260 ); is the water content.
2.3. Model Validation Based on Ex Vivo Experiments
The ex vivo experiments were carried out at a room temperature of 25 °C. During the MWA procedure, a thermometer was placed at a position midway horizontally between the two antennas to monitor the temperature changes during porcine liver heating. Fifteen sets of valid data were obtained for each antenna setting. The average temperature at the measurement point was taken as the experimental data. After each group of experiments, the porcine liver was dissected along the longitudinal axis, and the coagulation zone sizes were measured. Some characteristic lengths of the MWA coagulation zone are shown in Figure 3, where Rmax indicates the maximum transverse length of the fused coagulation zone, RL indicates the maximum longitudinal length, and Rf indicates the longitudinal length at the interface of the two coagulation zones.
The coagulation zone is the most direct measure of effectiveness of liver tumor MWA and its accurate characterization is, therefore, critical. The isothermal model [30] and the Arrhenius model [31] were compared to obtain the accurate evaluation model of the MWA coagulation zone. The Arrhenius model considers the cumulative effect of energy based on time and temperature. It can characterize the thermal coagulation degree of the tissue in a period of time. The Arrhenius model is given by [32]:
where denotes the degree of tissue necrosis; denotes the proportion of undamaged cells within biological tissue cells when unexposed; denotes the proportion of undamaged cells within the tissue at the moment of exposure(s); denotes the frequency factor (s−1); denotes the biological reaction energy (J/mol); denotes the flux gas constant R = 8.314 J/(mol·K); T(t) denotes the absolute temperature (K).
The thermal damage parameters and frequency factors [33] for the tumor were A = 3.247 × 1043 s−1 and = 2.814 × 10⁵ J/mol [34], respectively. The range is [0, 1], with 0 indicating that the tissue is not necrotic and 1 indicating that the tissue is completely necrotic.
The isothermal model is one in which a specific temperature is used as a threshold. The portion of tissue that reaches this threshold is considered to have undergone necrosis [35]. Studies have shown that cells die instantaneously at temperatures above 60 °C and that heating at 50–60 °C for a period of time can destroy the tumor irreversibly. For liver tumors, an isothermal threshold of 54 °C is the most frequently used [36].
In order to obtain a more accurate and convenient method of characterizing the coagulation zone for dual-antenna MWA, the isothermal model and the Arrhenius model were compared with the ex vivo experiments, respectively.
2.4. Influence of Heating Parameters and Blood Perfusion on Coagulation Zone
In dual-antenna MWA, the heating parameters mainly refer to the MWA treatment time, the microwave input power, and the spacing between two applicators. The doctor can change the heating parameters to obtain different sizes of coagulation zones. In order to comprehensively analyze the changes in coagulation zones with heating parameters, a total of nine kinds of different simulations were carried out. The time of MWA was set to 8 min. The simulation settings include total input powers of 40 W, 50 W, and 60 W combined with antenna spacings of 20 mm, 30 mm, and 40 mm. The heating parameters of dual-antenna MWA for application to treat liver tumors can be obtained from these simulations.
Blood perfusion is defined as the blood flow per unit volume of tissue per unit of time in microcirculatory units such as the capillary network, small arteries, and small veins [37]. The perfusion is generally expressed as , and the unit is usually kg/(m3·s) [38]. The blood perfusion of the normal human liver is approximately 8.0 kg/(m3·s), while the perfusion of tumors is between 1.5 and 8.0 kg/(m3·s) [39]. Different dual-antenna spacings and heating parameters were set. The effect of blood perfusion in MWA was explored based on the temperature distribution and the coagulation zone volume to improve the accuracy and to obtain more realistic results.
3. Results
3.1. FEM Model Verification by Ex Vivo Experiments
The simulation results of dual-antenna array temperature distributions and coagulation zones were validated using ex vivo experimental data. With the use of two parallel antennas under 50 W to be spaced 20 mm, 30 mm, and 40 mm apart, fifteen experiments were carried out for 8 min of treatment time. At the end of the experiments, the porcine liver was cut along the antenna longitudinal direction to obtain the section presented in Figure 4. The coagulation zone was rotationally symmetrical. From the inside to the outside are the carbonized zone, coagulation zone, and bleeding zone [40]. The values of the characteristic lengths Rmax, RL, and Rf were measured. Furthermore, the temperatures at measurement point P1 were recorded during the MWA experiments. The average values of these parameters were used as the results of the ex vivo experiments and compared with the FEM simulation data.
3.1.1. Experimental Validation Based on Temperature Distribution
The measured temperature changes at point P1 showed the same trend as the simulated results (Figure 4). The maximum temperatures measured at P1 for 20 mm spacing, 30 mm spacing, and 40 mm spacing were 106.88 °C, 82.16 °C, and 57.27 °C, respectively. The temperature rise curve shows that the smaller the values of the dual-antenna spacing, the higher the final temperature at P1 that can be reached. The average differences between the MWA simulation temperatures and the ex vivo measurements under the antenna spacings of 20 mm, 30 mm, and 40 mm were 1.08 °C, 0.95 °C, and 2.1 °C, respectively. When the spacing was 20 mm in Figure 4, the temperature rise rates of the two curves were very close in the first minute. During the ablation, there were some errors between the experimental data and the simulated temperature due to the thermal deformation of the tissue.
The comparisons of characteristic lengths and temperature changes demonstrate that the FEM model can accurately simulate the actual effects of dual-antenna MWA. Therefore, the FEM model can be used to conduct further studies for analyzing the effects of different heating parameters and antenna spacings in dual-antenna arrays for MWA.
3.1.2. Experimental Validation Based on Coagulation Zone Models
The results of the 54 °C isothermal surfaces and Arrhenius models for the heating parameters of 30 mm spacing and 50 W input power at the time of 8 min are shown in Figure 5. The black lines indicate the 54 °C, 60 °C, and 65 °C isothermal contours, and the green lines indicate the coagulation range represented by the Arrhenius model. The isothermal model is simpler and smoother. In our modeling investigations, it was found that under the same conditions, the coagulation zone characterized by the Arrhenius model ( = 1) was very close to the 65 °C isotherm but smaller than the 54 °C isothermal contour. The area enclosed by the Arrhenius model (about 23.11 cm2) was approximately 26% smaller than the 54 °C isothermal area (about 31.31 cm2).
The comparisons between the characteristic lengths measured in the ex vivo experiments and the calculated coagulation zones are shown in Table 3. For both Rf and RL, the errors between the measurements and the 54 °C isothermal model (IS-54) were around 2 mm, while the errors between the measurements and the Arrhenius model were more than 5 mm. As for Rmax, liver shrinkage and inaccurate antenna layout made the errors slightly larger. Nonetheless, the errors between the measurements and the IS-54 were within 5 mm. In contrast, the errors between the experimental data and the Arrhenius model were significantly larger. The isothermal model showed better agreement with the measurements. Therefore, the coagulation zone was characterized by the IS-54 in this study.
3.2. Influences of Heating Parameters on MWA Coagulation Zone
A dual-antenna MWA coagulation zone is formed by the fusion of two single-antenna coagulation zones. The clinically common heating parameters such as matrix input power and different dual-antenna spacings were employed to simulate the changes in the coagulation zone after 8 min of MWA. Table 4 lists the time at which the coagulation zones formed by the two antennas began to fuse under the different heating paraments. It is clear that under the same spacing, the increase in total input power could reduce the time at which the coagulation zone starts to fuse. With regard to the 20 mm spacing and 60 W input power, the fusion of the two coagulation zones occurred at 28 s. For the 40 mm spacing and 60 W input power, it took at least 190 s for fusion to occur. The fusion of two coagulation zones was substantially attributable to microwave energy deposition and tissue heat conduction. As the spacing increased, the interacted microwave energy deposition effects of dual-antennas diminished. This is why the coagulation zone in the case of the 40 mm spacing fused together later. The study of the coagulation zone fusion is helpful for physicians to determine the shortest ablation time for the dual-antenna MWA procedure.
Based on the dual-antenna FEM model, the effects of different spacing between two applicators and total matrix input powers on the coagulation zone were analyzed. At each spacing (20 mm, 30 mm, and 40 mm), the experiments were conducted with 40 W, 50 W, and 60 W power for 8 min, respectively. It was found that the fusion coagulation zone exhibited specific characteristics at different spacings. For the 20 mm spacing, the coagulation zones of the two antennas fused earliest. As compared to the 30 mm and 40 mm spacings, the depression in the fused coagulation zone between the two antennas was less obvious. With increasing spacing or decreasing total input power, the coagulation zones fused later. The depression in the fused coagulation zone became more pronounced.
3.3. Influences of Blood Perfusion on MWA Results
In clinical procedures, the perfusion of liver tumors varies depending on the location and size of their growth [38]. In order to improve the clinical applicability of the dual-antenna MWA simulation model, the effects of different blood perfusion rates on temperature distribution and coagulation zone were systematically simulated and analyzed. These data were obtained by changing the value of in the MWA model. The results showed that as perfusion increased, the temperature and the coagulation volume decreased. As shown in Figure 6, in the early stages of the ablation procedure, there was a subtle difference in the temperature increase of the liver tissue. However, as the time increased until the end of ablation treatment, the temperature differences were significant. Compared to the case without perfusion, the temperature drop of P1 at 480 s was approximately 5.87 °C, 8.26 °C, and 14.75 °C for = 1.0 kg/(m3·s), = 1.5 kg/(m3·s), and = 3.0 kg/(m3·s), respectively.
According to Table 5, the volume of the coagulation zone was reduced by 18.4%, 25.4%, and 42.5% for = 1.0 kg/(m3·s), = 1.5 kg/(m3·s), and = 3.0 kg/(m3·s), respectively. Therefore, if the effects of blood perfusion are not considered, the predicted coagulation zone volume will inevitably be larger than the actual one.
4. Discussion
MWA for liver tumors is becoming increasingly popular because of its broad indications, ease of operation, and rapid recovery. In order to achieve the treatment of larger tumors, dual-antenna or multi-antenna ablations have been employed. However, most MWA treatment planning schemes [41,42] are based on single-antenna simulations. The multi-antenna coagulation zone was simply considered as a superposition of different antenna MWAs, thus lacking a complete numerical analysis. The simulation accuracy of dual-antenna or multi-antenna ablations needs to be further improved.
Karampatzakis et al. [43] studied ablation zones created by double-slot coaxial antennas in triangular and square configurations. However, their theoretical parametric study did not take parallel dual-antenna MWA into account. Chiang et al. [44] found that the dual-slot microwave antenna can create a more spherical ablation zone than the monopole antenna. The direct spacing of the two transmitting points of the dual-slot antenna was fixed. How the heating parameters (total input power, antenna spacings, etc.) affect the coagulation zone is still unknown. Therefore, the current work aimed to study the temperature distribution and the coagulation zone changes under different heating parameters by using two monopole antennas. A dual-antenna FEM model was developed to show the temperature distribution and the coagulation zone over time. Gas and Kurgan [33] mentioned the use of the Arrhenius method to characterize the coagulation zone. This study was based on the results of single-antenna multi-slot coaxial MWA. In addition, the isothermal method was used to characterize the coagulation zone. In some previous studies, the dual-antenna (multi-antenna) MWA coagulation zone was characterized by the superimposition of single-antenna coagulation zones. In our FEM simulations, the IS-54 surface was used to characterize the coagulation zone because this model was more consistent with the ex vivo experiment results.
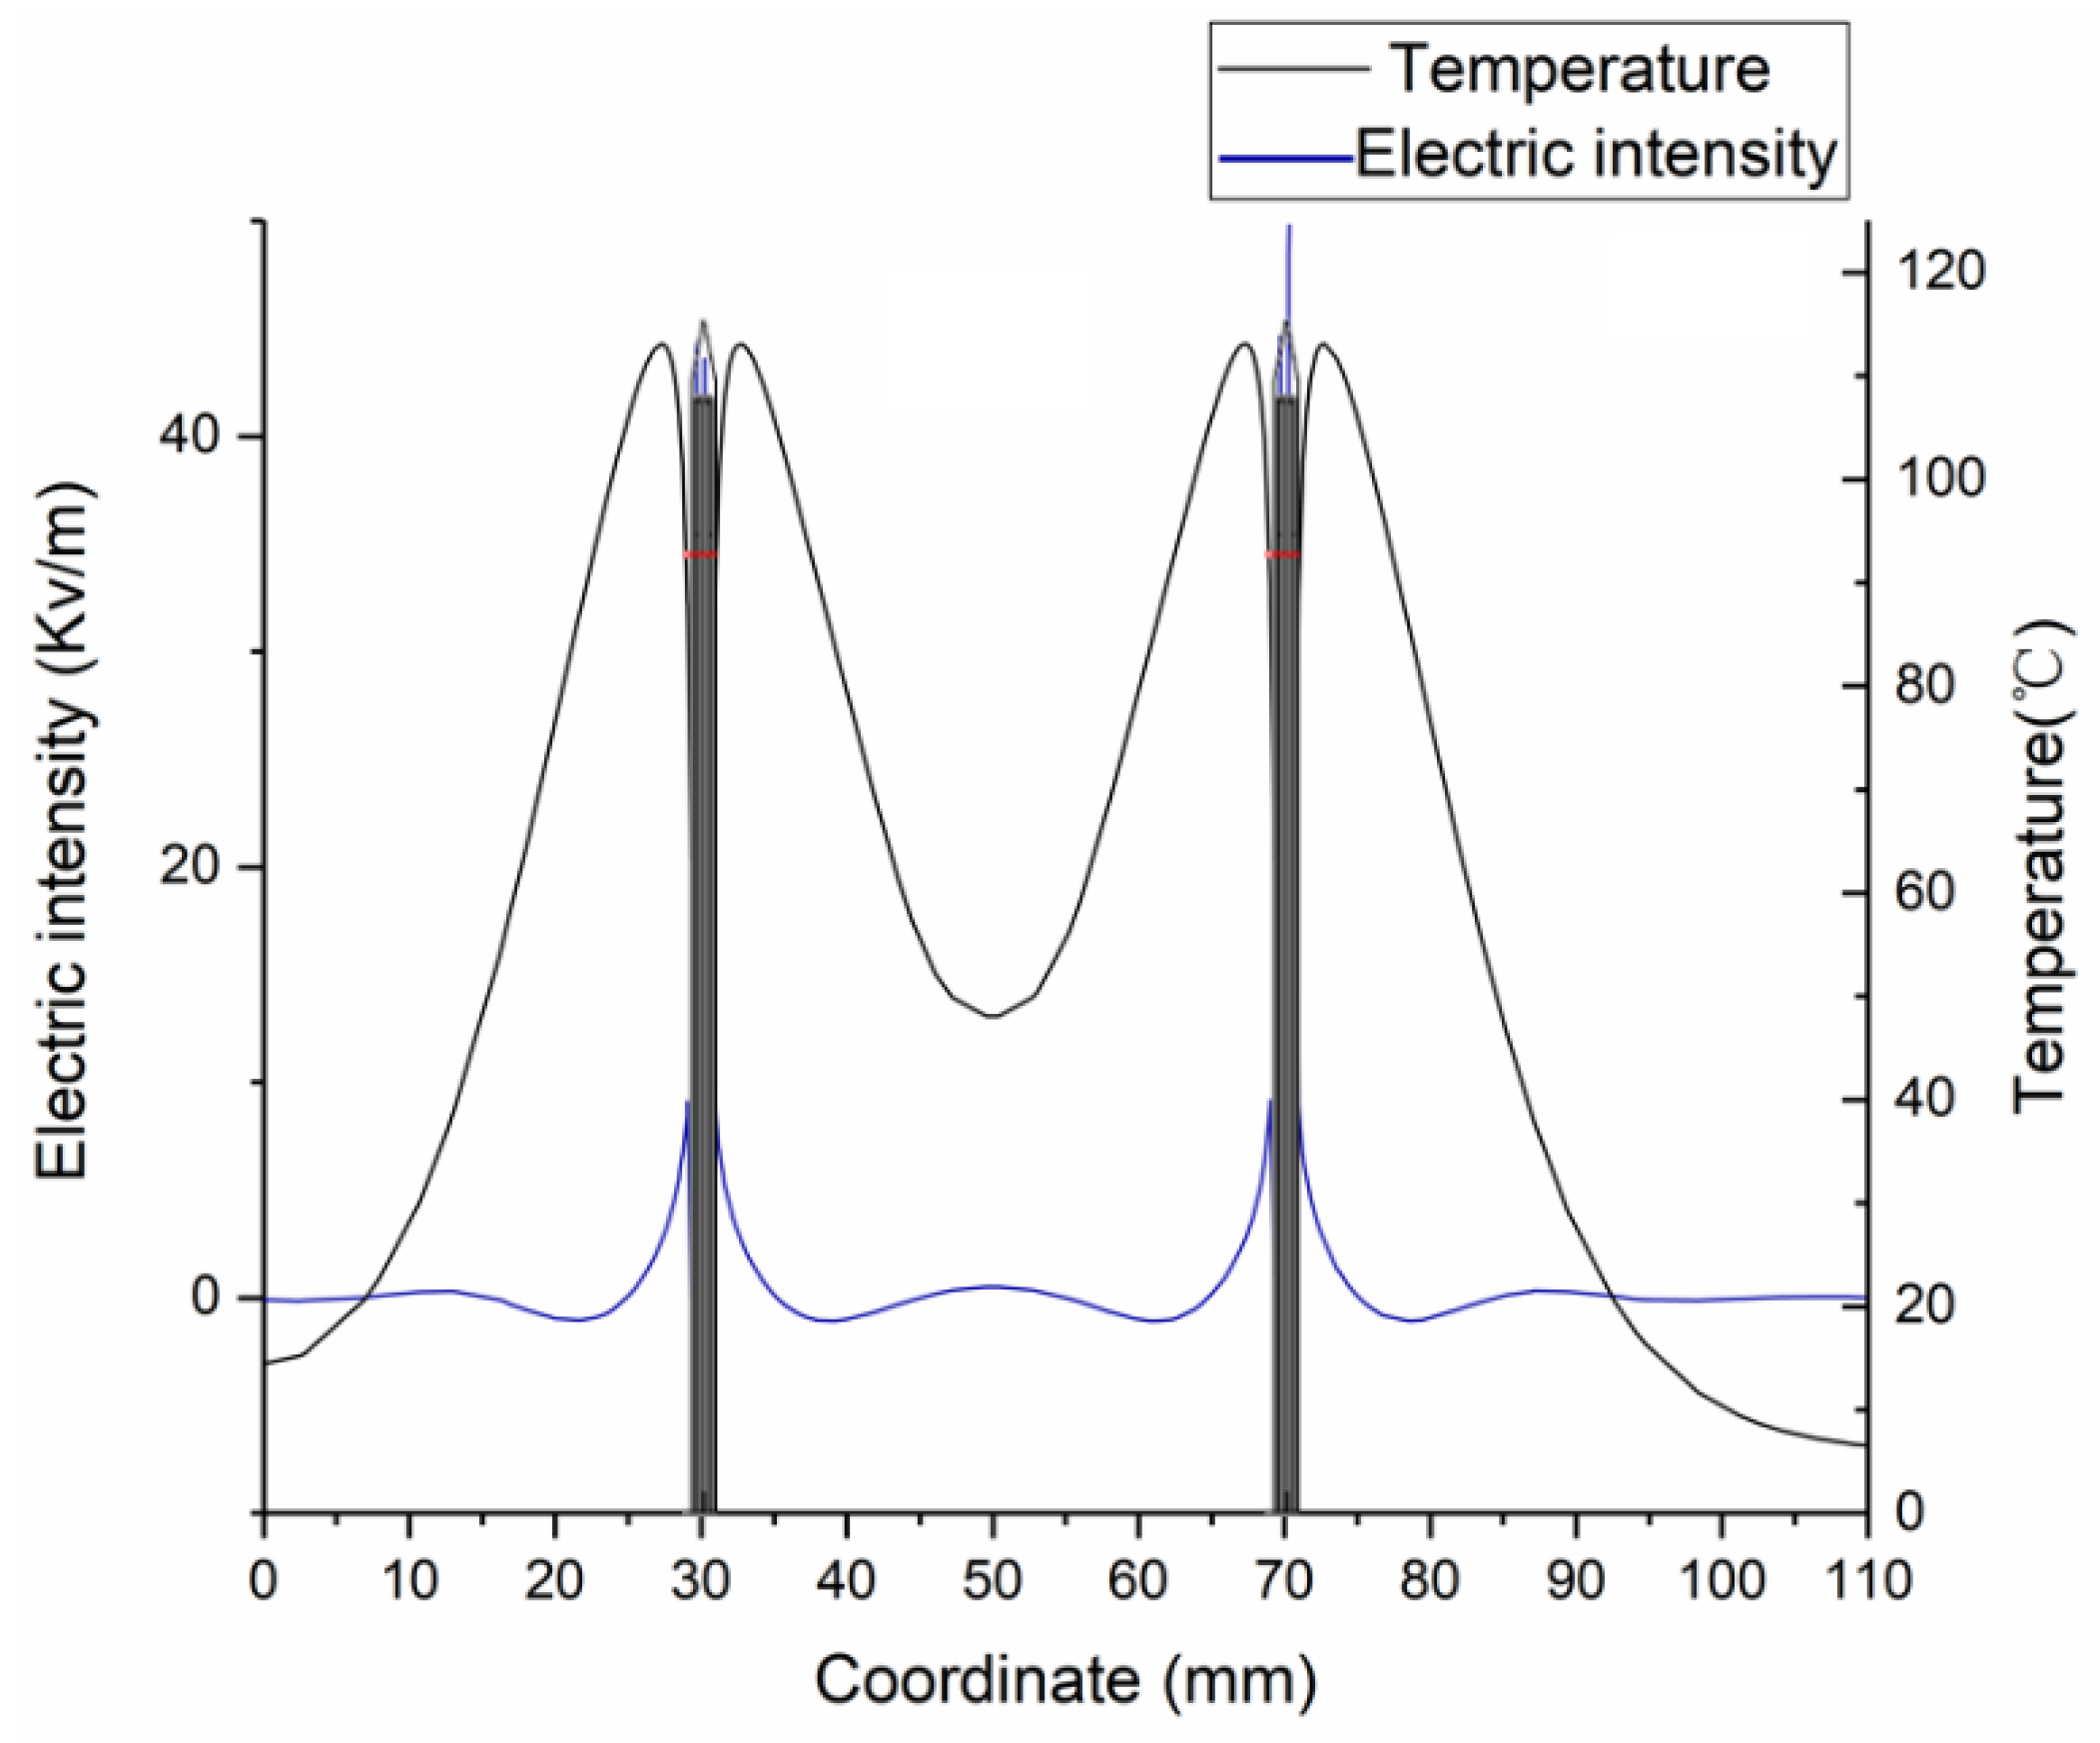
The SAR coefficient plays an important role in the MWA temperature distribution simulation. Furthermore, SAR is directly related to the electric field strength affecting the tissue (see Equation (2)). Thus, this study discussed the electric field changes along the axis y = 0 (Figure 2) for single-antenna MWA and dual-antenna MWA. Figure 7 illustrates the diagram of single-antenna electric field distribution at 480 s. The electric field intensity on both sides of the antenna is substantially symmetrical. In the case of dual-antenna MWA, the trends of the temperature changes and the electric field are essentially the same (Figure 8). The dual-antenna electric field intensity at the respective point is not a linear superposition of two single-antenna electric fields, but rather less than the sum of both single-antenna electric field intensities. This is due to the fact that at respective timepoints, the temperature in dual-antenna MWA is higher than the corresponding temperature in single-antenna MWA, leading to the declines in the electric parameters being more rapid in dual-antenna MWA. The nonlinear relationships between the dual-antenna electric field and the single-antenna electric field are complicated and need to be further investigated.
In addition, the effects of blood perfusion on the ablation results cannot be ignored. The liver itself is a blood-rich organ [32] and is distributed with many small and large vessels. The cooling effects of large vessels [23,45], the coagulation of small vessels [46], and the perfusion of liver blood flow all have an impact on the simulation results of the coagulation zone sizes. However, most simulations are performed under idealized conditions. The MWA temperature may be lowered to some extent due to blood perfusion. The temperature difference was close to 30 °C under blood perfusion levels of 3.0 kg/(m3·s) and 8.0 kg/(m3·s) [38,39]. Therefore, if the results of the ex vivo experiments are used to assess the in vivo MWA condition, this will inevitably lead to a larger coagulation zone than the actual result.
There are still some shortcomings in this study. First, during the ex vivo experiments, the tissue will shrink and deform as the porcine liver is heated. Deformation can cause parallel dual-antenna deflections in the range of 1 to 3 mm. Mukherjee et al. [17] investigated the effect of this offset on the coagulation zone, but in general, an offset of 1 to 3 mm did not significantly affect the results. Second, some pig livers without large blood vessels were selected for MWA to facilitate experimental validation. However, the existence of large blood vessels will lead to the heat-sink effect, thus affecting the actual coagulation zone. Third, the ex vivo experiments were performed at a room temperature of 20 °C, which differs from the average human body normal temperature of 37 °C. The simulated results can provide a valuable reference for medical doctors, but do not fully reflect the actual in vivo situation. Furthermore, the spacing variation between two antennas can produce a specific coupling effect in the near field. How this coupling effect will affect the coagulation zone and temperature distribution still needs further study. Although only one specific MWA applicator model is involved, this study can be extended to other applicators by changing the FEM model.
5. Conclusions
A parallel dual-antenna microwave thermal ablation model was developed. The simulation data by this model were substantially consistent with the ex vivo experimental results. Because of the superimposed electric field, the dual-antenna MWA produced a larger coagulation zone. It was found that the dual-antenna MWA could be used to treat tumors larger than 5 cm in diameter. As the dual-antenna spacing increased, more time was needed to form a larger coagulation zone. Blood perfusion influenced the increase in tissue temperature. Therefore, these factors need to be taken into account during the clinical MWA procedure. Because the heating parameters investigated in this study are derived from clinical practice, this study can provide a practical reference for MWA treatment of large tumors.
Author Contributions
Conceptualization, H.G. and S.W.; methodology and software, J.W., J.L. and Y.Z.; validation, S.H.; writing—original draft preparation, J.W.; writing—review and editing, H.G.; project administration, H.G.; funding acquisition, S.W. All authors have read and agreed to the published version of the manuscript.
Funding
This research was funded by the National Natural Science Foundation of China (Grant No. 61871005 and No. 82171941).
Institutional Review Board Statement
Not applicable.
Informed Consent Statement
Not applicable.
Data Availability Statement
Not applicable.
Acknowledgments
The authors would like to thank the anonymous reviewers for their constructive comments and suggestions.
Conflicts of Interest
The authors declare no conflict of interest.
References
- Siegel, R.L.; Miller, K.D.; Fuchs, H.E.; Jemal, A. Cancer statistics. CA Cancer J. Clin. 2022, 72, 7–33. [Google Scholar] [CrossRef] [PubMed]
- Sung, H.; Ferlay, J.; Siegel, R.L.; Laversanne, M.; Soerjomataram, I.; Jemal, A.; Bray, F. Global cancer statistics 2020: GLOBOCAN estimates of incidence and mortality worldwide for 36 cancers in 185 countries. CA Cancer J. Clin. 2021, 71, 209–249. [Google Scholar] [CrossRef] [PubMed]
- Pucci, C.; Martinelli, C.; Ciofani, G. Innovative approaches for cancer treatment: Current perspectives and new challenges. Ecancermedicalscience 2019, 13, 961–987. [Google Scholar] [CrossRef]
- Tanis, E.; Spliethoff, J.W.; Evers, D.J.; Langhout, G.C.; Snaebornsson, P.; Prevoo, W.; Hendriks, B.H.W.; Ruers, T.J.M. Real-time in vivo assessment of radiofrequency ablation of human colorectal liver metastases using diffuse reflectance spectroscopy. Eur. J. Surg. Oncol. 2016, 42, 251–259. [Google Scholar] [CrossRef] [PubMed]
- Phan, K.; An, V.; Ha, H.; Phan, S.; Lam, V.; Pleass, H. Hepatic resection for malignant liver tumors in the elderly: A systematic review and meta-analysis. ANZ J. Surg. 2015, 85, 815–822. [Google Scholar] [CrossRef] [Green Version]
- Izzo, F.; Granata, V.; Grassi, R.; Fusco, R.; Delrio, P.; Carrafiello, G.; Azoulay, D.; Petrillo, A.; Curley, S.A. Radiofrequency Ablation and Microwave Ablation in Liver Tumors: An Update. Oncologist 2019, 24, 990–1005. [Google Scholar] [CrossRef] [Green Version]
- Brace, C.L. Microwave ablation Technology: What every User should know. Curr. Probl. Diagn. Radiol. 2009, 38, 61–67. [Google Scholar] [CrossRef] [Green Version]
- de Baère, T.; Roux, C.; Deschamps, F.; Tselikas, L.; Guiu, B. Evaluation of a New CT-Guided Robotic System for Percutaneous Antenna Insertion for Thermal Ablation of Liver Tumors: A Prospective Pilot Study. Cardiovasc. Interv. Radiol. 2022, 45, 1701–1709. [Google Scholar] [CrossRef]
- Giampiero, F.; Franca, M.M.; Laura, R.; Francesco, G.; Eugenio, C.; Fulvia, T.; Ilario, D.S. Role of Contrast-Enhanced Ultrasound in the Detection of Complications After Ultrasound-Guided Liver Interventional Procedures. J. Ultrasound Med. 2020, 40, 1665–1673. [Google Scholar] [CrossRef]
- Wright, A.S.; Lee, F.T.; Mahvi, D.M. Hepatic microwave ablation with multiple antennae results in synergistically larger zones of coagulation necrosis. Ann. Surg. Oncol. 2003, 10, 275–283. [Google Scholar] [CrossRef]
- Toshikuni, N.; Takuma, Y.; Goto, T.; Yamamoto, H. Prognostic Factors in Hepatitis C Patients with a Single Small Hepatocellular Carcinoma after Radiofrequency Ablation. Hepatogastroenterology 2012, 59, 2361–2366. [Google Scholar] [CrossRef] [PubMed]
- Phasukkit, P.; Tungjitkusolmun, S.; Sangworasil, M. Finite-Element Analysis and In Vitro Experiments of Placement Configurations Using Triple Antennas in Microwave Hepatic Ablation. IEEE Trans. Biomed. Eng. 2019, 56, 2564–2572. [Google Scholar] [CrossRef] [PubMed]
- Clibbon, K.L.; McCowen, A. Thermal modeling of non-ideal interstitial microwave antenna array hyperthermia for the treatment of cancer. In Proceedings of the IEEE MTT-S International Microwave Symposium Digest, Atlanta, GA, USA, 14–18 June 1993; Volume 2, pp. 1147–1150. [Google Scholar] [CrossRef]
- Yu, N.C.; Lu, D.S.K.; Raman, S.S.; Dupuy, D.E.; Simon, C.J.; Lassman, C.; Aswad, B.I.; Ianniti, D.; Busuttil, R.W. Hepatocellular carcinoma: MWA with multiple straight and loop antenna clusters-Pilot comparison with pathologic findings. Radiology 2006, 239, 269–275. [Google Scholar] [CrossRef] [PubMed] [Green Version]
- Ryan, T.P.; Turner, P.F.; Hamilton, B. Interstitial microwave transition from hyperthermia to ablation: Historical perspectives and current trends in thermal therapy. Int. J. Hyperth. 2010, 26, 415–433. [Google Scholar] [CrossRef]
- Trembly, B.S. The Effects of Driving Frequency and Antenna Length on Power Deposition Within a Microwave Antenna Array Used for Hyperthermia. IEEE Trans. Biomed. Eng. 1985, 32, 152–157. [Google Scholar] [CrossRef]
- Mukherjee, S.; Curto, S.; Albin, N.; Natarajan, B.; Prakash, P. Multiple-antenna MWA: Analysis of non-parallel antenna implants. In Proceedings of the PIE Conference on Energy-Based Treatment of Tissue and Assessment VIII, San Francisco, CA, USA, 8–9 February 2015; p. 93260U. [Google Scholar] [CrossRef]
- Aparna, V.C.; Gandhi, A.S.; Harsh, R. Minimally Invasive MWA Antenna Designs at 915 MHz and 2.45 GHz. In Proceedings of the 28th National Conference on Communications (NCC), Mumbai, India, 24–27 May 2022; pp. 280–284. [Google Scholar] [CrossRef]
- Gas, P. Study on interstitial microwave hyperthermia with multi-slot coaxial antenna. Rev. Roum. Sci. Tech.-Ser. Electrotech. Energetique 2014, 59, 215–224. [Google Scholar] [CrossRef]
- Poch, F.G.M.; Rieder, C.; Ballhausen, H.; Knappe, V.; Ritz, J.; Gemeinhardt, O.; Kreis, M.; Lehmann, K.S. The vascular cooling effect in hepatic multipolar radiofrequency ablation leads to incomplete ablation ex vivo. Int. J. Hyperth. 2016, 32, 749–756. [Google Scholar] [CrossRef]
- Shi, W.; Liang, P.; Zhu, Q.; Yu, X.L.; Shao, Q.J.; Lu, T.; Wang, Y.; Dong, B.W. Microwave ablation: Results with double 915 MHz antennae in ex vivo bovine livers. Eur. J. Radiol. 2011, 79, 214–217. [Google Scholar] [CrossRef]
- Kok, H.P.; van der Zee, J.; Guirado, F.N.; Bakker, A.; Datta, N.R.; Abdel-Rahman, S.; Schmidt, M.; Wust, P.; Crezee, J. Treatment planning facilitates clinical decision making for hyperthermia treatments. Int. J. Hyperth. 2021, 38, 532–551. [Google Scholar] [CrossRef]
- Claudio, A.; Laura, F.; Vanni, L. Tissue shrinkage in microwave ablation of liver: An ex vivo predictive model. Int. J. Hyperth. 2017, 33, 101–109. [Google Scholar] [CrossRef] [Green Version]
- Wang, J.Y.; Wu, S.C.; Wu, Z.Y.; Gao, H.J.; Huang, S.Y. Influences of blood flow parameters on temperature distribution during liver tumor microwave ablation. Front. Biosci. Landmark 2021, 26, 504–516. [Google Scholar] [CrossRef]
- Gas, P.; Kurgan, E. Comparative Analysis Between the 2D and 3D Models of Interstitial Microwave Hyperthermia. In Proceedings of the 2016 17th International Conference Computational Problems of Electrical Engineering (CPEE), Sandomierz, Poland, 14–17 September 2016; IEEE Xplore. pp. 1–4. [Google Scholar] [CrossRef]
- Chiang, J.; Wang, P.; Brace, C.L. Computational modeling of microwave tumor ablations. Int. J. Hyperth. 2013, 29, 308–317. [Google Scholar] [CrossRef]
- Arkin, H.; Xu, L.X.; Holmes, K.R. Recent developments in modeling heat transfer in blood-perfused tissues. IEEE Trans. Biomed. Eng. 1994, 41, 97–107. [Google Scholar] [CrossRef] [PubMed]
- Gao, H.; Wang, X.; Wu, S.; Zhou, Z.; Bai, Y. 2450-MHz microwave ablation temperature simulation using temperature-dependence feedback of characteristic parameters. Int. J. RF Microw. Comput.-Aided Eng. 2019, 29, e21488. [Google Scholar] [CrossRef] [Green Version]
- Cavagnaro, M.; Pinto, R.; Lopresto, V. Numerical models to evaluate the temperature increase induced by ex vivo microwave thermal ablation. Phys. Med. Biol. 2015, 60, 3287–3311. [Google Scholar] [CrossRef]
- Portosi, V.; Loconsole, A.; Valori, M.; Marrocco, V.; Fassi, I.; Bonelli, F.; Pascazio, G.; Lampignano, V.; Fasano, A.; Prudenzano, F. Low-Cost Mini-Invasive Microwave Needle Applicator for Cancer Thermal Ablation: Feasibility Investigation. IEEE Sens. J. 2021, 21, 14027–14034. [Google Scholar] [CrossRef]
- Qadri, A.M.; Chia, N.J.Y.; Ooi, E.H. Effects of saline volume on lesion formation during saline-infused radiofrequency ablation. Appl. Math. Model. 2017, 43, 360–371. [Google Scholar] [CrossRef]
- He, X.; Bhowmick, S.; Bischof, J.C. Thermal therapy in urologic systems: A comparison of Arrhenius and thermal isoeffective dose models in predicting hyperthermic injury. J. Biomech. Eng. 2009, 131, 074507. [Google Scholar] [CrossRef]
- Gas, P.; Kurgan, E. Evaluation of thermal damage of hepatic tissue during thermotherapy based on the arrhenius model. In Proceedings of the 2018 Progress in Applied Electrical Engineering (PAEE), Koscielisko, Poland, 18–22 June 2018; pp. 1–4. [Google Scholar] [CrossRef]
- Rossmanna, C.; Haemmerich, D. Review of temperature dependence of thermal properties, dielectric properties, and perfusion of biological tissues at hyperthermic and ablation temperatures. Crit. Rev. Biomed. Eng. 2014, 42, 467–492. [Google Scholar] [CrossRef] [Green Version]
- Singh, S.; Bhowmik, A.; Repaka, R. Thermal analysis of induced damage to the healthy cell during RFA of breast tumor. J. Therm. Biol. 2016, 58, 80–90. [Google Scholar] [CrossRef]
- Sun, Y.; Cheng, Z.; Dong, L.; Zhang, G.; Wang, Y.; Liang, P. Comparison of temperature curve and ablation zone between 915- and 2450-MHz cooled-shaft microwave antenna: Results in ex vivo porcine livers. Eur. J. Radiol. 2012, 81, 553–557. [Google Scholar] [CrossRef] [PubMed]
- Thorne, A.M.; Ubbink, R.; Brüggenwirth, I.M.A.; Nijsten, M.; Porte, R.; de Meijer, V.E. Hyperthermia-induced changes in liver physiology and metabolism: A rationale for hyperthermic machine perfusion. Am. J. Physiol. Gastrointest. Liver Physiol. 2020, 319, 43–50. [Google Scholar] [CrossRef]
- Kress, R.; Roemer, R. A comparative analysis of thermal blood perfusion measurement techniques. J. Biomech. Eng. 1987, 109, 218–225. [Google Scholar] [CrossRef] [PubMed]
- Liang, P.; Dong, B.W.; Yu, X.L.; Yi, D.J.; Cheng, Z.G.; Su, L.; Peng, J.S.; Nan, Q.; Wang, H.J. Computer-aided dynamic simulation of microwave-induced thermal distribution in coagulation of liver cancer. IEEE Trans. Biomed. Eng. 2001, 48, 821–829. [Google Scholar] [CrossRef] [PubMed]
- Singh, S.; Melnik, R. Thermal ablation of biological tissues in disease treatment: A review of computational models and future directions. Electromagn. Biol. Med. 2020, 39, 49–88. [Google Scholar] [CrossRef] [PubMed]
- Chen, Z.P.; Miller, W.H.; Roemer, R.B.; CETAS, T.C. Errors between two-dimensional and three-dimensional thermal model predictions of hyperthermia treatments. Int. J. Hyperth. 1990, 6, 175–191. [Google Scholar] [CrossRef]
- Schumann, C.; Rieder, C.; Preusser, T. Interactive multi-criteria planning for radiofrequency ablation. Int. J. Comput. Assist. Radiol. Surg. 2015, 10, 879–889. [Google Scholar] [CrossRef]
- Karampatzakis, A.; Kühn, S.; Tsanidis, G.; Neufeld, E.; Samaras, T.; Kuster, N. Heating characteristics of antenna arrays used in microwave ablation: A theoretical parametric study. Comput. Biol. Med. 2013, 43, 1321–1327. [Google Scholar] [CrossRef]
- Chiang, J.; Hynes, K.A.; Bedoya, M.; Brace, C.L. A Dual-Slot Microwave Antenna for More Spherical Ablation Zones: Ex Vivo and in vivo Validation. Radiology 2013, 268, 382–389. [Google Scholar] [CrossRef] [Green Version]
- Vaidya, N.; Baragona, M.; Lavezzo, V.; Maessen, R.; Veroy, K. Simulation study of the cooling effect of blood vessels and blood coagulation in hepatic radio-frequency ablation. Int. J. Hyperth. 2021, 38, 95–104. [Google Scholar] [CrossRef]
- Barnat, N.; Grisey, A.; Gerold, B.; Yon, S.; Anquez, J.; Aubry, J. Vein wall shrinkage induced by thermal coagulation with high-intensity-focused ultrasound: Numerical modeling and in vivo experiments in sheep. Int. J. Hyperth. 2020, 37, 1238–1247. [Google Scholar] [CrossRef] [PubMed]
Figure 1.
Experimental platform for dual-antenna MWA.

Figure 2.
Geometric model of dual-antenna in MWA simulation.
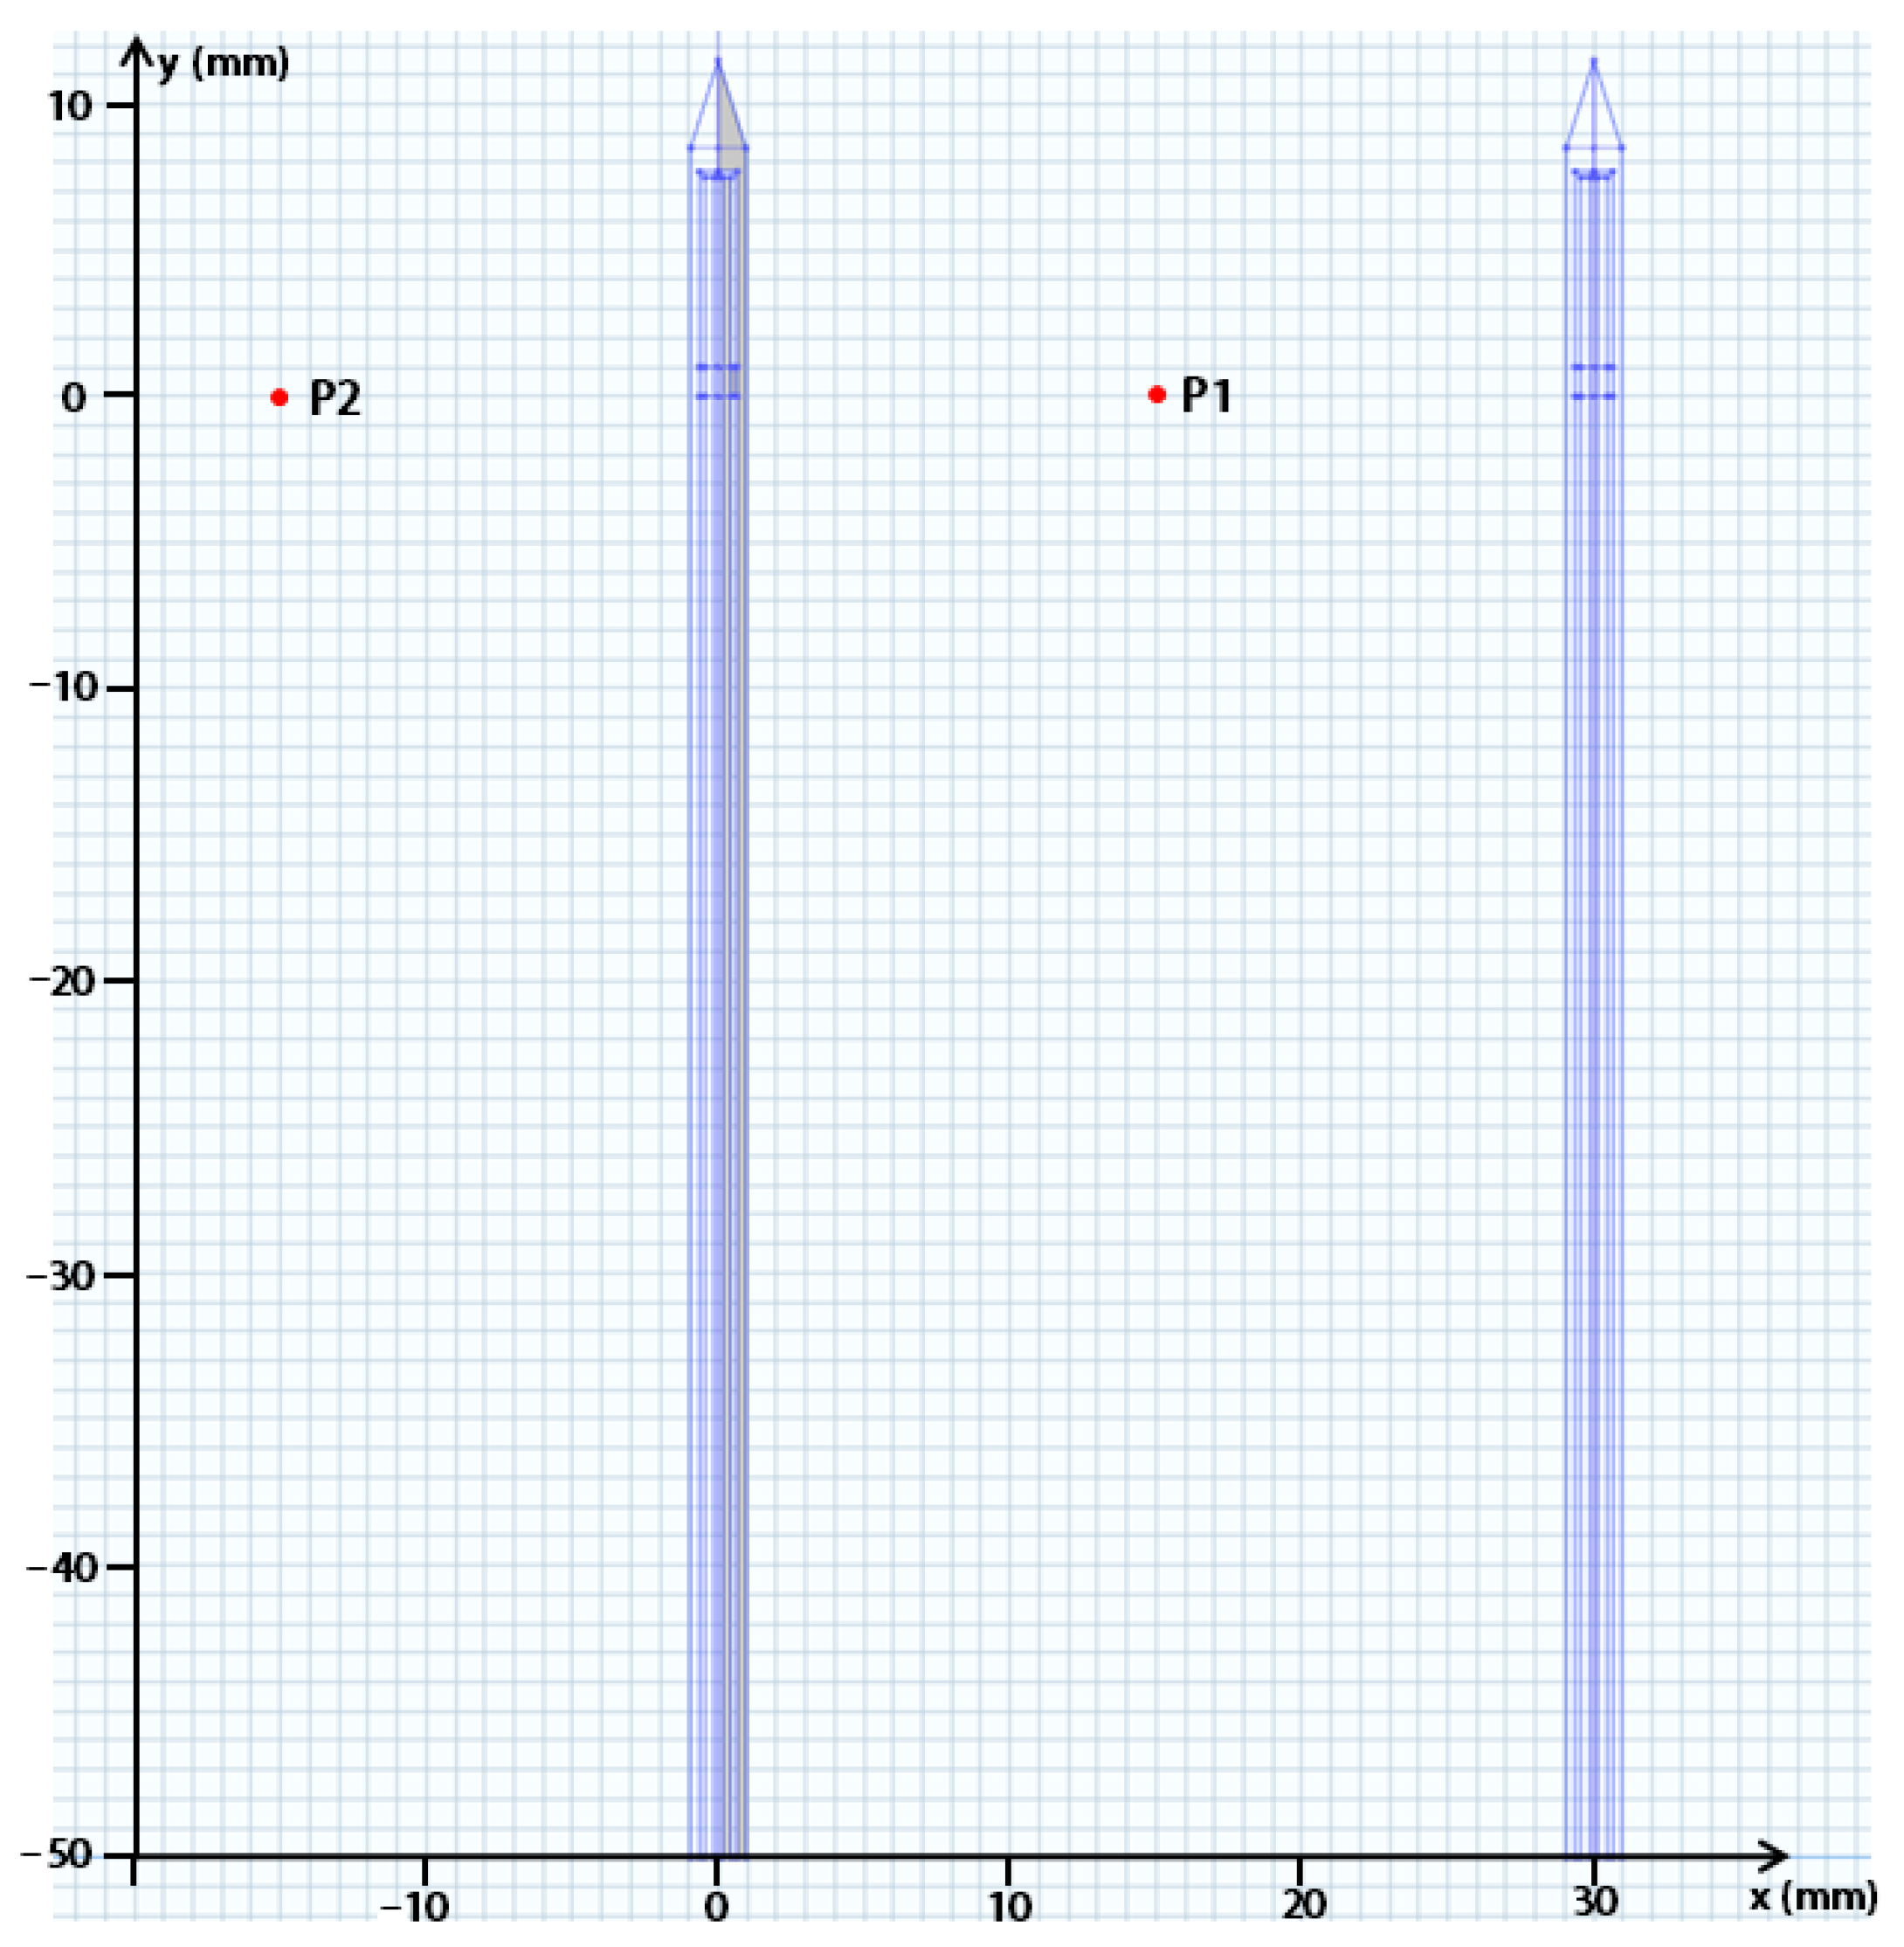
Figure 3.
Schematic diagram of Rmax, RL, and Rf in the fused coagulation zone.
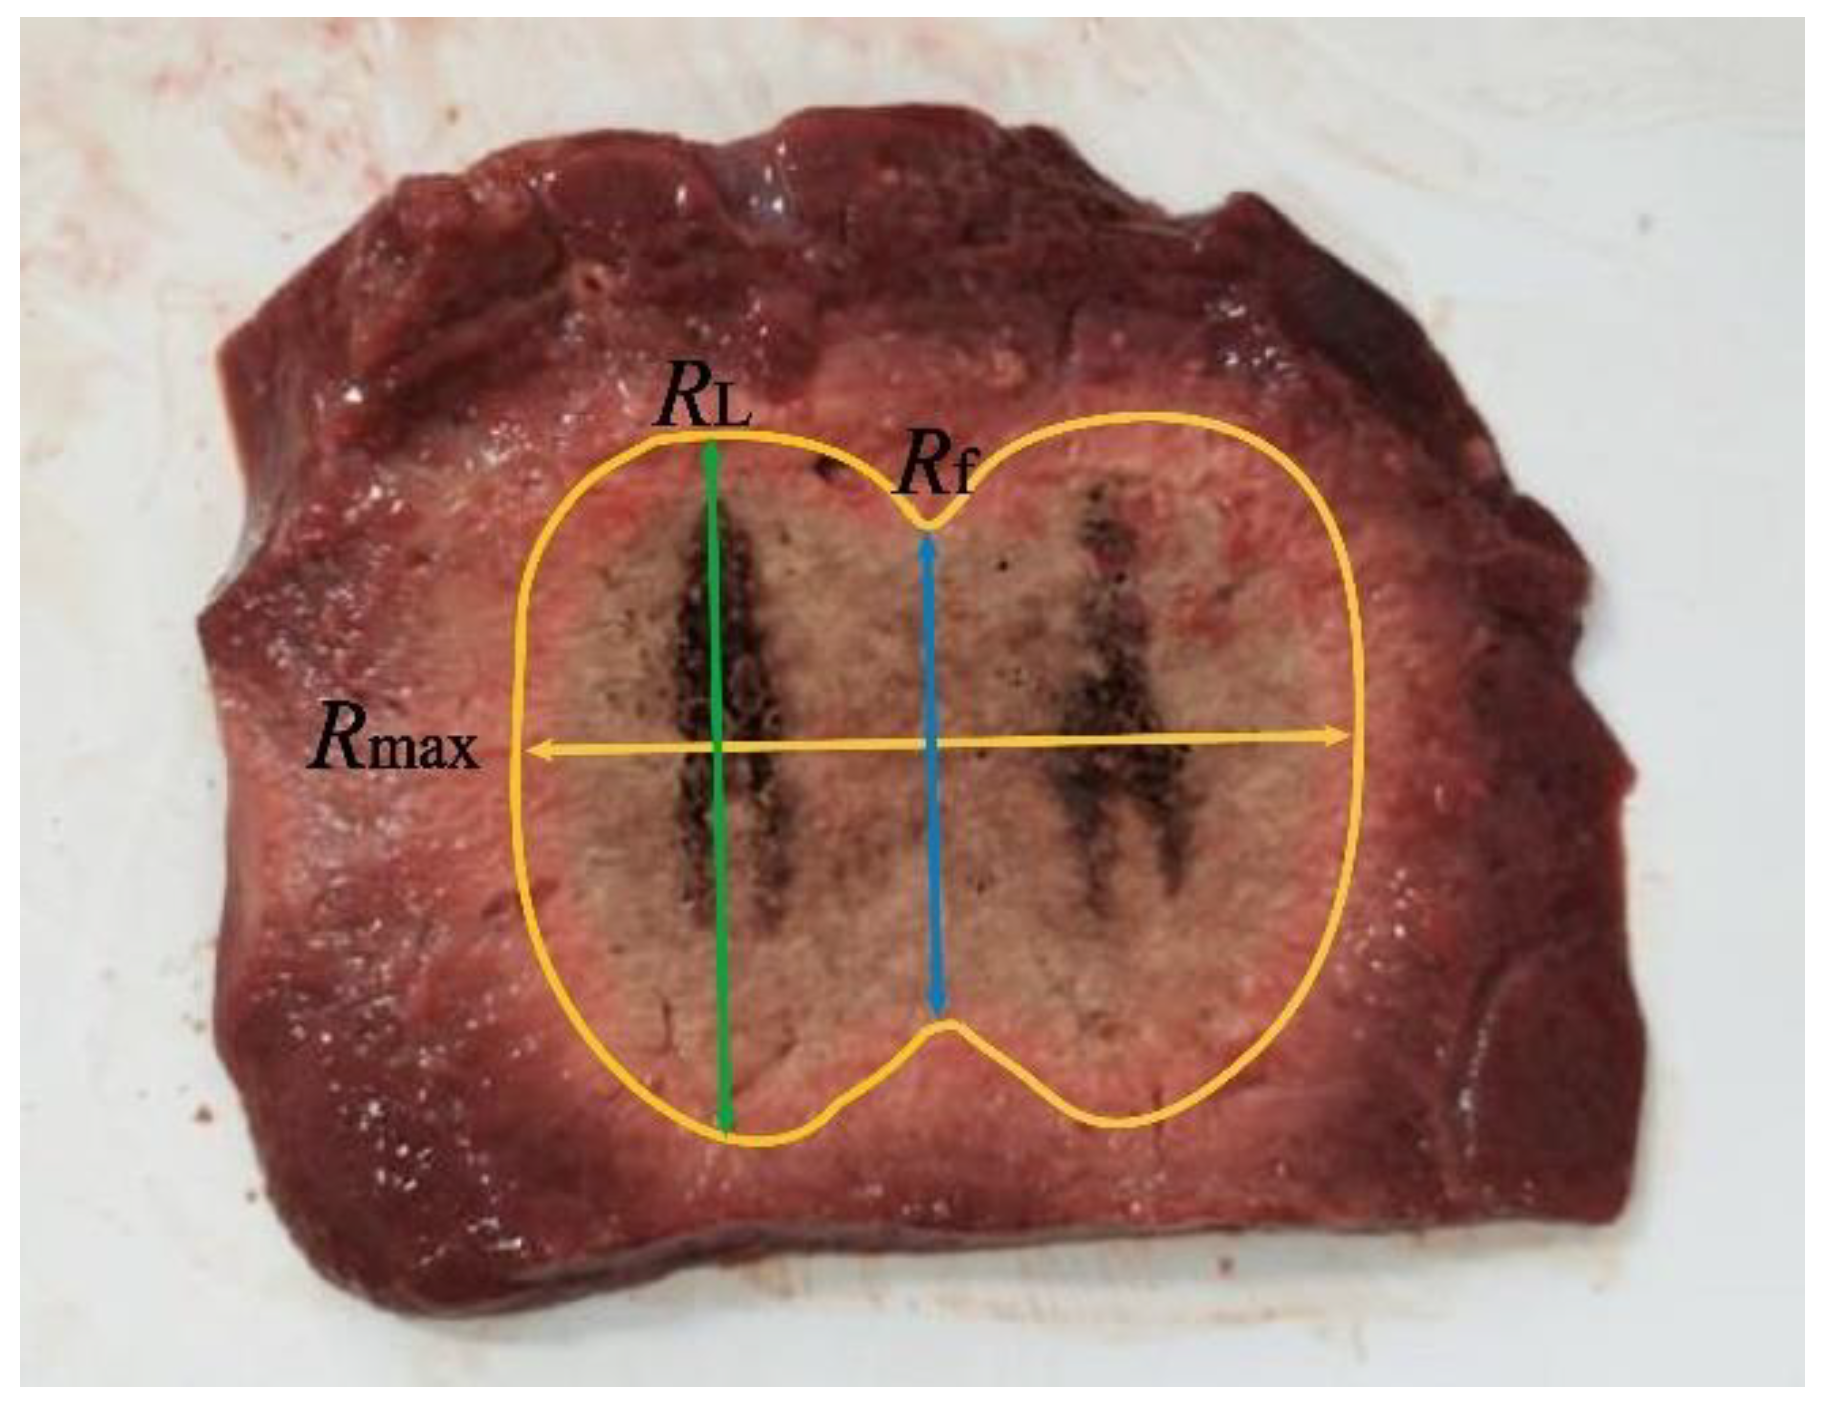
Figure 4.
Comparisons of the average temperature changes at P1 and the simulation results (three different dual-antenna spacings: 20 mm, 30 mm, and 40 mm, under the same heating parameters of 50 W matrix input power and 8 min treatment time).
Figure 4.
Comparisons of the average temperature changes at P1 and the simulation results (three different dual-antenna spacings: 20 mm, 30 mm, and 40 mm, under the same heating parameters of 50 W matrix input power and 8 min treatment time).
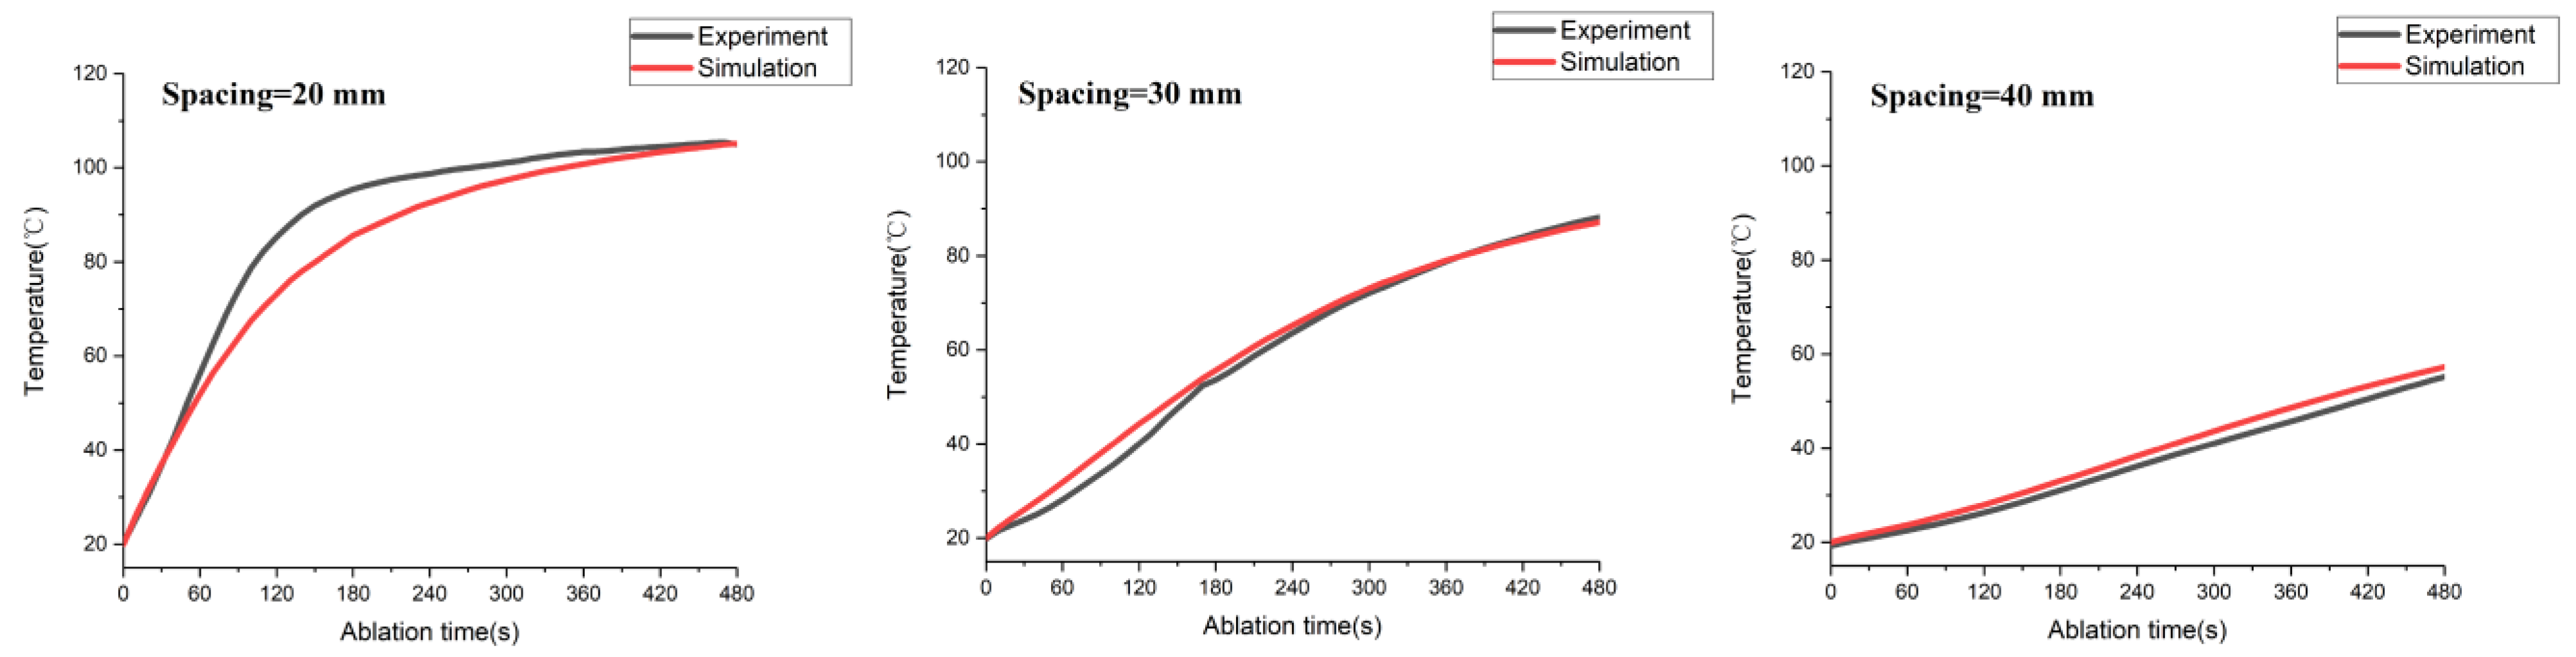
Figure 5.
The results of the 54 °C, 60 °C, and 65 °C isothermal surface and Arrhenius model after 8 min of treatment time.
Figure 5.
The results of the 54 °C, 60 °C, and 65 °C isothermal surface and Arrhenius model after 8 min of treatment time.
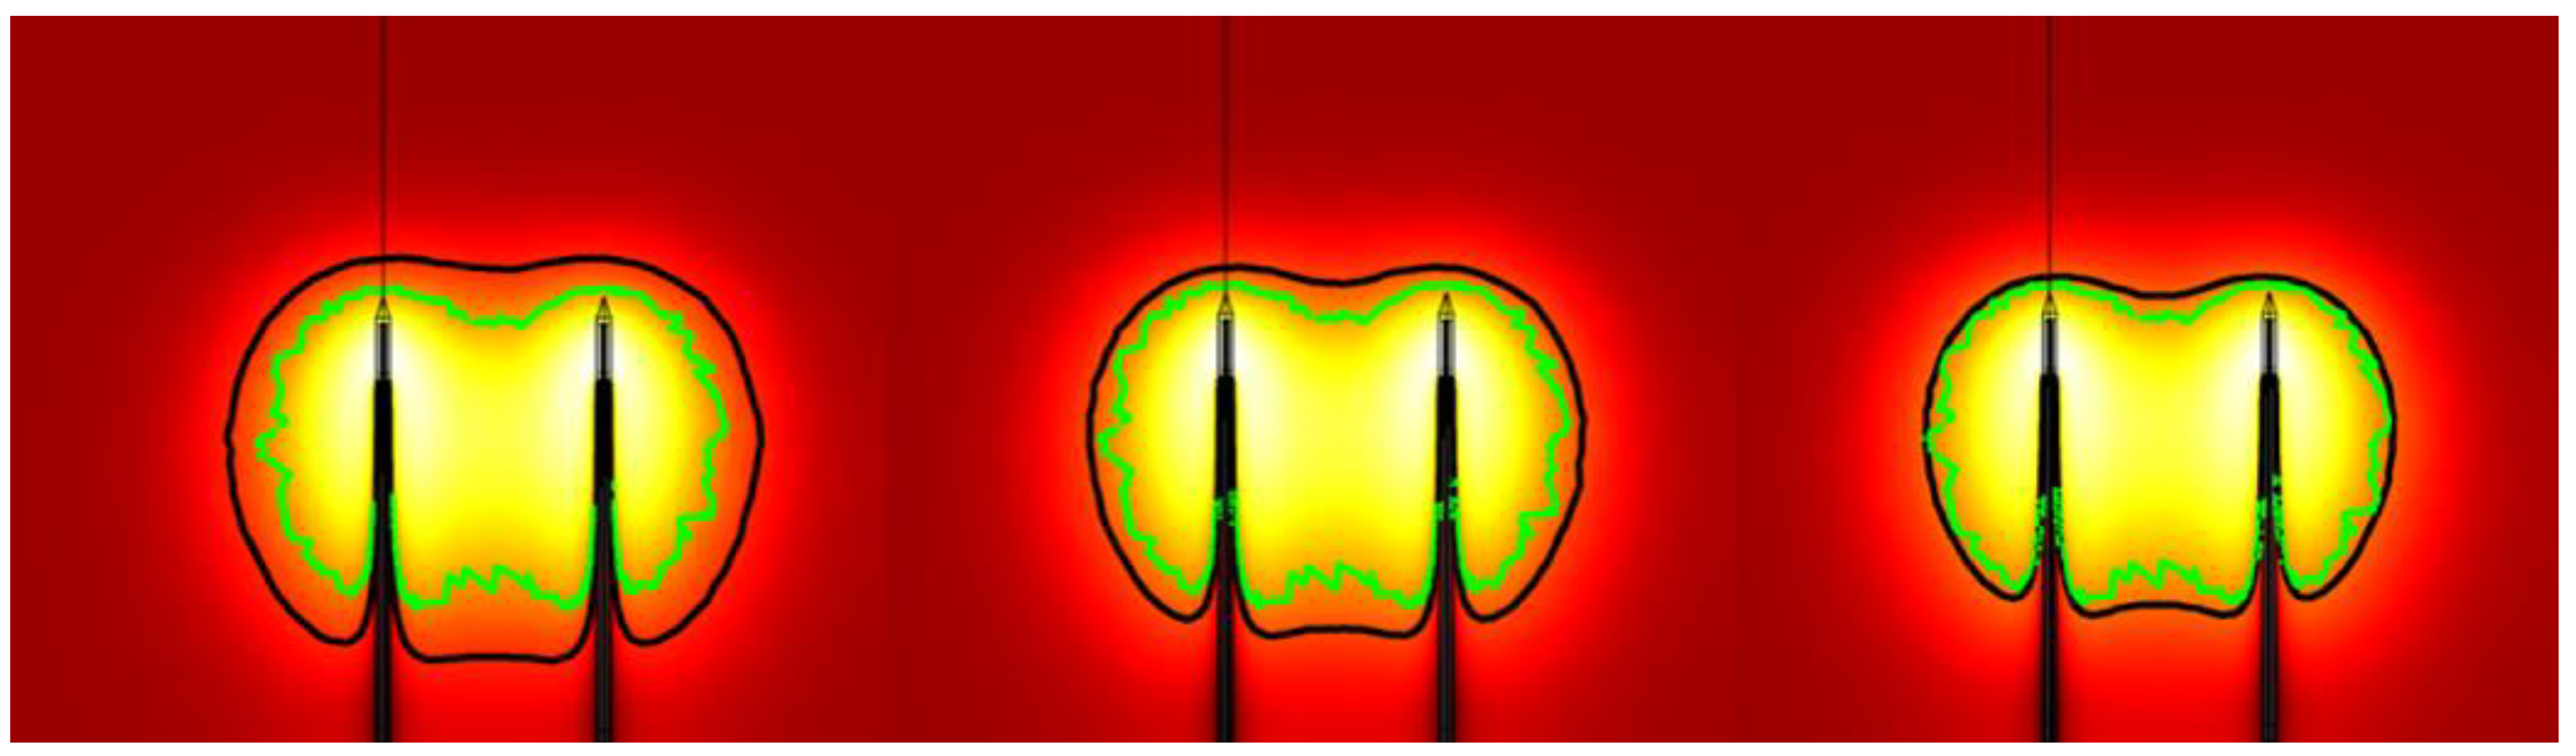
Figure 6.
Temperature rising curves at point P1 under three different blood perfusions (dual-antenna spacing: 30 mm; heating parameter: 50 W matrix input power, and 8 min treatment time).
Figure 6.
Temperature rising curves at point P1 under three different blood perfusions (dual-antenna spacing: 30 mm; heating parameter: 50 W matrix input power, and 8 min treatment time).
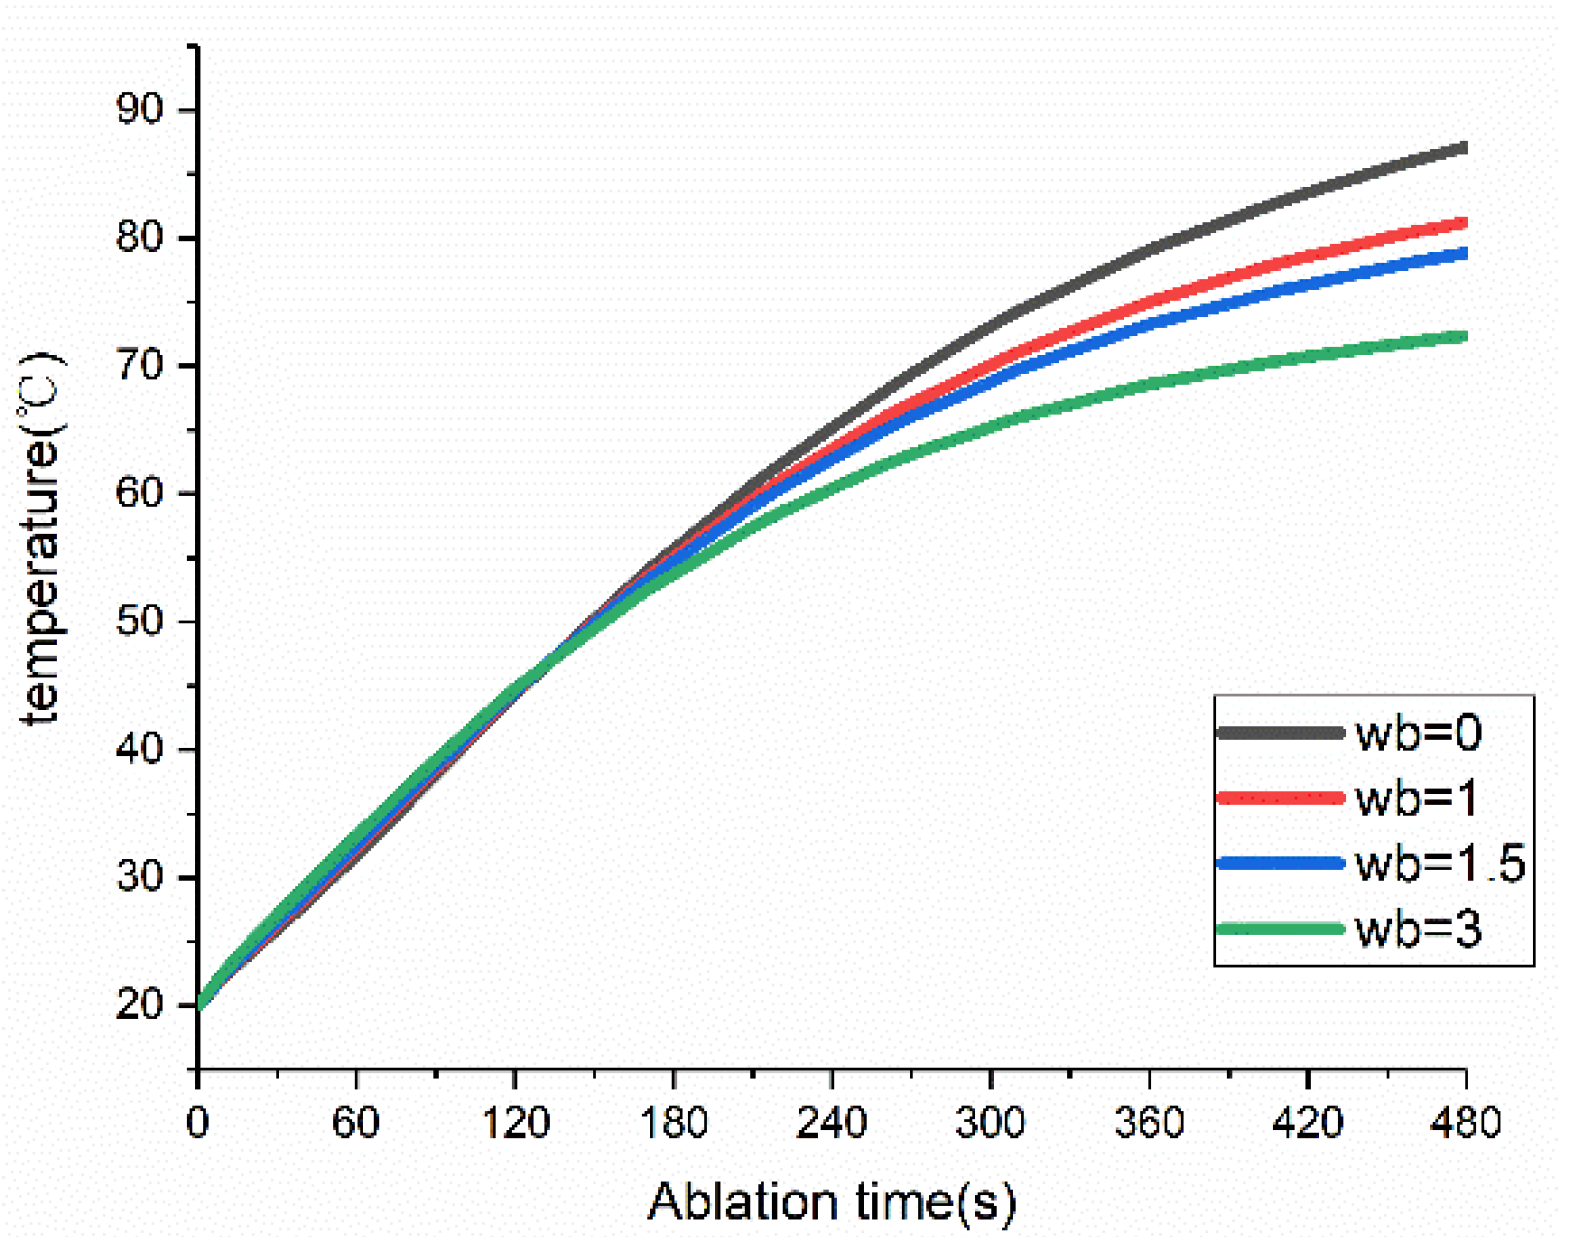
Figure 7.
Single-antenna electric field (Erms) distribution diagram.
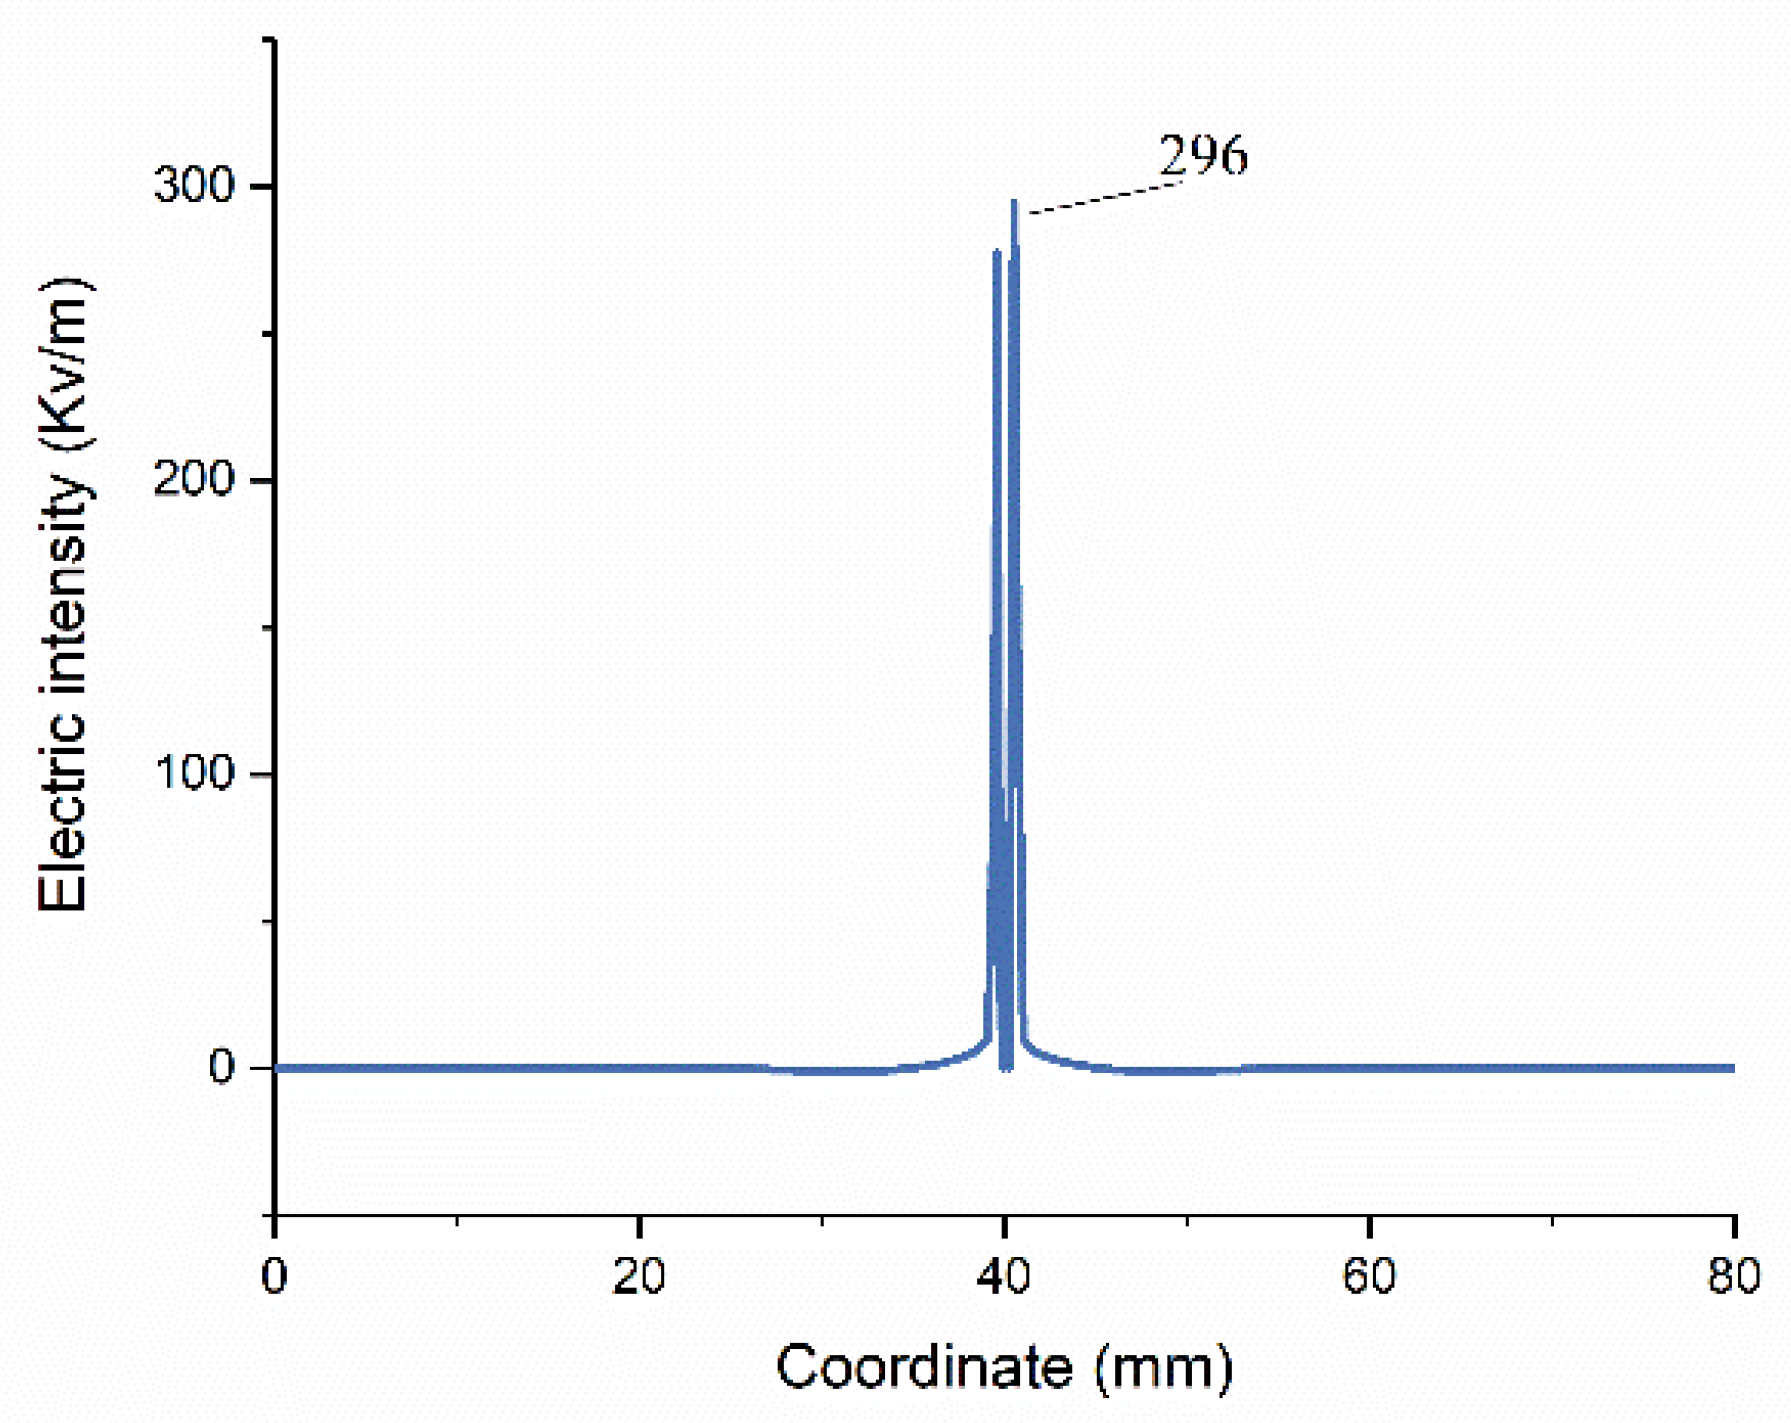
Figure 8.
Electric field (Erms) and temperature distribution diagram in dual-antenna MWA.

Table 1.
Dimensions of the 2.45 GHz microwave antenna.
| Property | Value |
|---|---|
| Outer diameter of the antenna | 1.9 mm |
| Inner diameter of the antenna | 1.3 mm |
| Distance from emission point to tip of antenna | 11.5 mm |
| Total length | 191.5 mm |
Table 2.
The values of characteristic parameters of ex vivo porcine liver at 25 °C.
| Tissue | (kg/m3) | Cp (J/(kg·K)) | (W/(m·K)) | (S/m) | |
|---|---|---|---|---|---|
| Porcine liver | 1050 | 3628 | 0.565 | 1.8 | 44.3 |
Table 3.
Comparisons of experimental data and simulation results under three dual-antenna spacings (in millimeters).
Table 3.
Comparisons of experimental data and simulation results under three dual-antenna spacings (in millimeters).
| Spacing | Characteristic Length | Experiment Data | IS-54 Model | Arrhenius Model | Error-1 * | Error-2 ** |
|---|---|---|---|---|---|---|
| 40 mm | Rmax (mm) | 69.9 | 74.00 | 66.00 | 5.87% | −5.58% |
| Rf (mm) | 20.10 | 21.00 | N/A | 4.48% | N/A | |
| RL (mm) | 42.5 | 44.00 | 35.1 | 3.53% | −17.41% | |
| 30 mm | Rmax (mm) | 57.88 | 62.00 | 55.00 | 7.12% | −4.98% |
| Rf (mm) | 37.75 | 40.00 | 24.00 | 5.96% | −36.42% | |
| RL (mm) | 42.63 | 45.00 | 37.00 | 5.56% | −13.21% | |
| 20 mm | Rmax (mm) | 53.13 | 55.00 | 44.00 | 3.52% | −17.18% |
| Rf (mm) | 46.25 | 48.00 | 37.00 | 3.78% | −20.00% | |
| RL (mm) | 47.13 | 48.00 | 37.00 | 1.85% | −21.49% |
* Error-1 indicates the relative errors between the experimental data and IS-54, ** Error-2 indicates the relative errors between the experiment data and Arrhenius model.
Table 4.
Time for the coagulation zone fusion under different heating parameters (in seconds).
| Spacing | 40 W | 50 W | 60 W |
|---|---|---|---|
| 20 mm | 70 | 34 | 28 |
| 30 mm | 110 | 90 | 80 |
| 40 mm | 240 | 210 | 190 |
Table 5.
Reduction in coagulation zone volume under three types of blood perfusion.
| (kg/(m3·s) | 1.0 | 1.5 | 3.0 | |
|---|---|---|---|---|
| Antenna Matrix Spacing, Total Input Power | ||||
| 2 cm, 40 W | 18.1% | 25.2% | 41.9% | |
| 2 cm, 50 W | 17.3% | 24.4% | 40.6% | |
| 2 cm, 60 W | 16.9% | 23.8% | 39.8% | |
| 3 cm, 40 W | 18.4% | 25.9% | 43.0% | |
| 3 cm, 50 W | 17.6% | 24.6% | 41.5% | |
| 3 cm, 60 W | 17.0% | 23.8% | 40.1% | |
| 4 cm, 40 W | 20.2% | 28.7% | 48.0% | |
| 4 cm, 50 W | 19.1% | 26.8% | 45.2% | |
| 4 cm, 60 W | 18.1% | 25.6% | 43.4% | |
| Mean | 18.4% | 25.4% | 42.5% | |
Disclaimer/Publisher’s Note: The statements, opinions and data contained in all publications are solely those of the individual author(s) and contributor(s) and not of MDPI and/or the editor(s). MDPI and/or the editor(s) disclaim responsibility for any injury to people or property resulting from any ideas, methods, instructions or products referred to in the content. |
© 2022 by the authors. Licensee MDPI, Basel, Switzerland. This article is an open access article distributed under the terms and conditions of the Creative Commons Attribution (CC BY) license (https://creativecommons.org/licenses/by/4.0/).
Share and Cite
MDPI and ACS Style
Wang, J.; Huang, S.; Gao, H.; Liu, J.; Zhang, Y.; Wu, S. Computer Simulations of Dual-Antenna Microwave Ablation and Comparison to Experimental Measurements. Appl. Sci. 2023, 13, 26. https://doi.org/10.3390/app13010026
AMA Style
Wang J, Huang S, Gao H, Liu J, Zhang Y, Wu S. Computer Simulations of Dual-Antenna Microwave Ablation and Comparison to Experimental Measurements. Applied Sciences. 2023; 13(1):26. https://doi.org/10.3390/app13010026
Chicago/Turabian StyleWang, Jinying, Shengyang Huang, Hongjian Gao, Ju Liu, Yubo Zhang, and Shuicai Wu. 2023. "Computer Simulations of Dual-Antenna Microwave Ablation and Comparison to Experimental Measurements" Applied Sciences 13, no. 1: 26. https://doi.org/10.3390/app13010026
Note that from the first issue of 2016, this journal uses article numbers instead of page numbers. See further details here.