


Influence of Porosity on Drag Coefficient of Perforated Road Signs

1
Department of Civil Engineering, Kyung Hee University, Yongin-si 17104, Republic of Korea
2
Department of Future & Smart Construction Research, Korea Institute of Civil Engineering and Building Technology, Goyang-si 10223, Republic of Korea
*
Author to whom correspondence should be addressed.
Appl. Sci. 2023, 13(1), 502; https://doi.org/10.3390/app13010502
Submission received: 24 November 2022
/
Revised: 23 December 2022
/
Accepted: 28 December 2022
/
Published: 30 December 2022
(This article belongs to the Special Issue Future Transportation)
Abstract
:To ensure the structural stability of road signs against strong gusts of wind, perforated road signs with sign boards perforated at regular intervals have been adopted for use in urban road infrastructure. However, ASCE 7-22 standards do not consider the drag coefficient of signs with low porosity, i.e., less than 30%. Therefore, here, computational fluid dynamics (CFD) analysis was performed to analyze the drag coefficient of perforated road signs with a porosity of less than 30%. The aspect and clearance ratios, which are the width/height ratio of a perforated road sign and the height of the perforated road sign/its distance from the ground, respectively, were set as parameters. Subsequently, the drag coefficient of perforated road signs with a porosity of 30% was calculated, and the effect of porosity and wind speed on the drag coefficient of perforated road signs was analyzed. Results show that the drag coefficient of perforated road signs decreased as the porosity increased, with a drag coefficient reduction effect of up to 0.85 times. Furthermore, perforated road signs with a high clearance ratio exhibited significant decreased drag coefficient. For perforated road signs, the drag coefficient does not show a clear correlation with wind speed.
1. Introduction
Under abnormal weather conditions, such as strong gusts of wind, induced by natural phenomena, road facilities, such as road signs, frequently get damaged. This damage accounts for approximately 8% of all damage to public facilities during natural disasters [1]. Being composed of panel structures, road signs are adversely affected by the wind load that accounts for approximately 96% of all effective loads [2]. In addition, road signs have a clearance area between the ground and the sign, and additional vehicle-induced flow occurs in the clearance area when vehicles are passing by [3]. Therefore, to ensure structural stability of road signs against wind load, signs perforated at regular intervals have been integrated into road sign structural design [4].
The primary design factor that determines the airflow and wind load of a structure is the drag coefficient, which is a dimensionless coefficient used to quantify the resistance of a structure in fluid environments such as air and water. For perforated road signs, the drag coefficient is influenced by the holes in the sign. Therefore, the drag coefficient of the perforated sign should be investigated to determine whether perforated road signs remain adequately stable in inclement weather conditions.
ASCE 7-22 (Minimum Design Loads and Associated Criteria for Buildings and Other Structures) is an American standard that specifies the drag coefficient according to the aspect and clearance ratios, which are the width/height ratio of a sign and the ratio of the height of the sign to that of the ground clearance, respectively. Furthermore, it presents a formula to calculate the drag coefficient reduction factor according to the porosity of the sign. However, ASCE 7-22 has the following limitations for perforated road signs [5]. Although ASCE 7-22 presents the drag reduction factor according to the porosity of the sign, it ignores perforated signs with a porosity of less than 30%. However, in practice, a porosity of less than 20% is required to ensure the legibility of characters [6]. Therefore, the drag coefficient of signs with a porosity less than 30% must be considered. In addition, the sign drag coefficient of ASCE 7-22 is based on the wind tunnel test results for the basic wind speed of 10 m/s. However, the drag coefficient in actual conditions depends on the wind speed as well as the cross-sectional geometry of the structure [7]. Thus, the drag coefficient must be investigated at various wind speeds by reflecting the continuous increase in wind speed caused by abnormal climate. Moreover, the drag coefficient is uniformly applied in Structural Design Actions (AS 1170.2) [8], an Australian standard; the Road Sign Handbook [9], a Japanese standard, and the Road Sign Standard [10], a Korean standard, without considering the porosity of road signs and the wind speed.
Several studies on the drag coefficient of perforated panel structures have been conducted. Constantinescu et al. [11] conducted computational fluid dynamics (CFD) analysis to analyze airflow affecting highway road and traffic signs. They analyzed the pressure distribution and stress on the front and rear of the panels and proposed criteria for increasing the wind load coefficient of the design standard of the American Association of State Highway and Transportation Officials by 30%. Qiu et al. [12] proposed an optimal value of porosity to improve the aerodynamic behavior of low-rise building parapets. They conducted CFD analysis, and the highest aerodynamic performance was observed in the case of parapets with a porosity of 38.2 to 52.3%. Abdollah et al. [13] proposed an aerodynamic strategy that optimizes the corners of a building to reduce the drag of the building using the large eddy simulation (LES) method for turbulence analysis. They analyzed the wind load reduction performance according to the building geometry. Korea Expressway Corporation [14] analyzed whether the standard wind speed used in the design of windproof facilities installed on roads in strong wind areas was appropriate. They found that gusting winds must also be considered for the safety of road signs, because they are not considered in windbreak wall design standards. Kim et al. [15] proposed installation criteria to ensure the structural stability of windbreak walls installed on bridges. They conducted a wind tunnel test on the wind resistance characteristics of windbreak walls according to porosity and height. The results showed that the drag coefficient of windbreak walls increased as the windbreak wall height increased and the porosity decreased. Letchford [16] calculated the drag coefficient of a rectangular signboard using various variables. In the study, the width/height ratio of the signboard, the height ratio between the signboard and the ground and the porosity of the signboard were applied as variables. However, the final proposed drag coefficient was the experimental result of applying only the basic wind speed of 10 m/s. In other words, various wind speeds were not reflected in the final result. Giannoulis et al. [17] studied the wind load of panels with various porosities and proposed the drag coefficient of the panels according to the porosity. However, in the analysis, only panels installed on the ground were considered; the drag coefficient of elevated panels was ignored. Xu et al. [18] conducted CFD analysis on panels perforated using various shapes and standards. They analyzed the wind load reduction effect by setting the diameter and spacing of the holes drilled in the panels as variables. However, the drag coefficient was fixed at 1.2, thereby ignoring the changes in drag coefficient due to the wind speed. Song et al. [19] conducted a wind tunnel test to assess the drag coefficient of an insect net used for agriculture. The porosity of the applied insect net was 65%, and the wind speed ranged from 1 to 22 m/s. When the drag was measured by increasing the wind speed, the drag coefficient of the insect net converged to 0.7 at a low wind speed of less than 10 m/s and showed a tendency to decrease at a high wind speed of more than 20 m/s. Ping et al. [20] analyzed the characteristics of airflow around fences with various porosities. They analyzed the relationships among the porosity, height and wind speed of the fences. The drag was found to be high at a porosity of less than 20%, which later converged to a certain value as the porosity increased. The Korea Institute of Civil Engineering and Building Technology [2] proposed a road sign installation technology that applies a perforated plate and analyzed its effect. They proposed a structural form of the post and its manufacturing technology to facilitate the application of the perforated plate. Furthermore, they conducted a legibility test by installing a road sign with the perforated plate. Filip et al. [21] determined the drag coefficients for longitudinal finned tubes, considering various wind directions. Numerical analysis was performed by CFD analysis, and experimental testing was performed in a wind tunnel test. Feng et al. [22] conducted CFD analysis to examine the wind loads on spherical structures with different height and diameter ratios. The results show that the largest pressure coefficient at the windward surface increased with the height and diameter ratios.
In this study, the drag coefficient was analyzed to enable the detailed design of perforated road signs with porosity less than 30%. CFD analysis was conducted and implemented to reflect the existing conditions in the actual environment. The aspect ratio, clearance ratio and porosity of the actual perforated road signs were applied, and the drag coefficient of perforated road signs was calculated according to the porosity and wind speed. Finally, based on the analysis results, the drag coefficient reduction effect of perforated road signs with porosity less than 30% was analyzed.
2. Computational Fluid Dynamics Analysis of Perforated Road Sign
In the CFD analysis, the width of the analyzed perforated road sign is denoted by B, and its height by S. The height of the installed perforated road sign from the ground is marked by H. The analysis model followed the Road Sign Standard, which is a standard for actual road signs. The aspect ratio (B/S) ranged from 1.0 to 4.0, and the clearance ratio (S/H) from 0.2 to 0.5. Figure 1 shows the geometry of the perforated road sign model analyzed in the CFD analysis. For the perforated road sign model, the hole spacing was adjusted according to the porosity by applying the appropriate 6 mm diameter hole derived in consideration of readability and retro-reflection in the previous study [2]. The material used in actual road signs was used as the material of the perforated road sign model applied in the analysis, as shown in Table 1.
The “Midas NFX” software was used for the CFD analysis of this study [23]. In addition, the “Two-equation k–ε” turbulence model capable of implementing realistic fluid turbulence was applied to analyze the airflow pattern around the perforated road sign [24]. The k-ε turbulence model is commonly used in turbulence analysis because it effectively models the kinetic energy of turbulence. The turbulence intensity and length applied to the model was 0.05 and 0.004 m, respectively. The fluid loaded on the analysis model was air at 25 °C. In addition, it was set as incompressible. In the analysis, 1500 iterations were applied for sufficient convergence to an approximate value. Table 2 shows the conditions of the applied turbulence model.
In the CFD analysis, many parameter analyses were performed, considering the aspect ratio, clearance ratio and porosity of the perforated road sign. Among the turbulence analysis models, the Reynolds-averaged Navier–Stokes (RANS) model calculates the average value of the change in turbulence occurring within a period of time. Accordingly, in the CFD analysis, the most efficient RANS model was applied in various parameter analyses. The formula for calculating the turbulent flow in the RANS model is the Navier–Stokes equation, which is given in Equation (1).
where, is the wind speed, p is the wind pressure, is the air density, is the gravity, and is the viscosity of wind.
In the CFD analysis, a virtual wind tunnel test domain is required to apply a fluid to the target structures. Figure 2 shows the geometry of the CFD analysis wind tunnel test domain. A study of turbulence CFD analysis of windbreaks was performed by Agarwal et al. [25]. For the virtual wind tunnel test domain applied in this study, the methodology of the previous literature was applied. Figure 2a shows the conditions of the wind tunnel domain. The virtual wind tunnel test domain applied in the CFD analysis was set to the form of a hexahedral box to include the inlet and outlet of the fluid. Wall boundary conditions were applied to the ground, top and side walls of the domain, and to remove the influence on the fluid, all the walls were set in a no-slip condition. The top and side walls of the domain set the wind speed in the vertical direction to 0 m/s, the dimensions of which were set to prevent interference with the fluid flow inside the domain. Figure 2b shows the aspect of the wind tunnel domain. The width of the inlet was set to five times the vertical length of the perforated road sign, and the width of the outlet and height of the domain were set to 10 times that.
In the CFD analysis, boundary conditions were set to analyze the pure drag coefficient of the perforated road sign. In actual roads, road signs are fixed to the ground with posts; it is difficult to calculate the pure drag coefficient of perforated road signs considering the posts, due to wind pressure dispersion. Xu et al. [18] performed a CFD analysis to analyze the wind load of traffic signs, and in the CFD analysis, elevated traffic signs installed away from the ground were modeled without posts. In the CFD analysis, the air flow and wind pressure around the perforated road sign are analyzed, so even if the perforated road sign is modeled away from the ground without post, it was confirmed that the CFD analysis is running properly.
The parameters applied in the CFD analysis are the aspect ratio (B/S) and clearance ratio (S/H), which are the width/height ratio of the perforated road sign and the ratio of the height of the perforated road sign to its ground clearance, respectively. The parameters were set considering the aspect and clearance ratios of actual road signs. The aspect ratio was set to 1.0, 2.0, and 4.0 and the clearance ratio to 0.2, 0.3, and 0.5. In addition, five porosities (0, 5, 10, 20, and 30%) and six wind speeds ranging from 10 to 60 m/s were applied. Table 3 shows the parameters applied in the CFD analysis.
Bitog et al. [26] calculated the drag coefficient using the difference in wind pressure between the front and rear surfaces of a structure. In this study, the drag coefficient of the perforated road sign was also calculated using the difference in wind pressure between the front and rear of the perforated road sign. The calculation formula is given by Equation (2).
where, is the wind pressure on the front surface, and is the wind pressure on the rear surface.
In this study, the drag coefficient was calculated using the difference in wind pressure between the front and rear of the perforated road sign. Figure 3a shows the drag coefficient of road sign with 0% porosity and Figure 3b shows the drag coefficient of perforated road sign with 30% porosity. The drag coefficient of the perforated road sign with 30% porosity was lower than that of the road sign with 0% porosity. The drag coefficient of perforated road signs does not change significantly with the aspect ratio. The drag coefficient was high in perforated road signs with a low clearance ratio.
To verify the validity of the CFD analysis conducted in this study, the drag coefficient of the road sign with 0% porosity calculated using the CFD analysis was compared with that obtained from the wind tunnel test in a study by Letchford [13]. The drag coefficient of the road sign calculated using the CFD analysis was found to be approximately 98% of that obtained in the wind tunnel test, as shown in Figure 4. This verified that the CFD environment of this study was properly implemented.
A wind tunnel test was conducted to analyze the drag coefficient reduction ratio of the perforated road sign, and the results were compared with the CFD analysis results. In the wind tunnel test, two types of wind speeds, 10 m/s and 20 m/s, were applied, and two types of road signs, a road sign with 0% porosity and a perforated road sign with 10% porosity, were tested. Figure 5a shows a road sign with 0% porosity and Figure 5b shows a perforated road sign with 10% porosity. Table 4 shows the result of comparing the wind tunnel test and CFD analysis; the difference in drag coefficient reduction ratio was analyzed to be 6.5% at a wind speed of 10 m/s, and 8.0% at 20 m/s.
3. Results and Discussion
3.1. Drag Coefficient of Perforated Road Signs According to the Porosity
To calculate the drag coefficient of the perforated road sign with a porosity less than 30%, CFD analysis was conducted on perforated road signs with porosities of 0, 5, 10, 20, and 30%. The wind pressure and wind speed distribution of the perforated road sign according to the porosity is shown in the following figures. Figure 6 and Figure 7 show the results at a wind speed of 10 m/s when the aspect ratio was 2.0 and the clearance ratio was 0.5.
In Figure 6, the wind pressure distribution around the perforated sign can be identified by contour. It was found that a tail-shaped low wind speed area occurs behind the perforated road sign; it is a separation region at the rear surface of the structure subjected to the wind load where the fluid velocity transitions. The separation region of the sign with 0% porosity was analyzed to have the longest length and the largest area, and that with 10% porosity had a shorter length and decreased area compared with the case with 0% porosity. In the perforated road sign with 30% porosity, the area of the separation region was significantly reduced. As the porosity increased, the length of the flow separation on the rear surface of the perforated road sign decreased, and the area of the separation region also decreased. This phenomenon can be attributed to the fact that the pores in the perforated road sign affect the pressure and wind speed by generating airflow around the perforated road sign. If the area of this separation region decreases, the drag coefficient decreases. This correlation between the area of the separation region and the drag coefficient was verified through a study by Babin et al. [27]. The CFD analysis results showed that the drag coefficient decreased as the porosity of the perforated road sign increased. In Figure 7, the wind speed distribution around the perforated sign can be identified by contour. The wind pressure difference between the front and rear of the road sign was the lowest in the perforated road sign with a porosity of 30%.
Figure 8 shows the drag coefficient of the perforated road sign according to the porosity. Although the drag coefficient of the perforated road sign differed with changes in the aspect and clearance ratios, the reduction in the drag coefficient of the perforated road sign according to the porosity exhibited a consistent trend. The drag coefficient decreased as the porosity increased, and it converged to 1.2 for the perforated road signs with a porosity of 20% or higher.
The reduction effect of the drag coefficient of the perforated road sign according to the porosity was analyzed. The drag coefficient reduction ratio according to the porosity is expressed as the ratio of the drag coefficient of the road sign with the 0% porosity to that of the perforated road sign. Figure 9 shows the drag coefficient reduction effect of perforated road signs according to the porosity. The following characteristics were observed. First, for perforated road signs, the drag coefficient reduction effect increases as the porosity increases. Compared with the road sign with a porosity of 0%, the drag coefficient reduction effect was found to be 0.88, 0.86, 0.85 and 0.85 times for the road signs with a porosity of 5%, 10%, 20% and 30%, respectively. Second, the drag coefficient reduction effect of perforated road signs is more affected by the clearance ratio than the aspect ratio. Finally, the perforated road signs close to the ground have a higher drag coefficient reduction effect than those far from the ground. The drag coefficient reduction effect of the perforated road sign with a clearance ratio of 0.2 was analyzed to be 0.9 times, while that of the perforated road signs with clearance ratios of 0.3 and 0.5 was found to be 0.85 times that of the road sign with a porosity of 0%.
3.2. Drag Coefficient of Perforated Road Signs According to the Wind Speed
To calculate the drag coefficient of perforated road signs according to the wind speed, CFD analysis was conducted at different wind speeds of from 10 to 60 m/s. The wind pressure and wind speed distribution of perforated road signs according to the wind speed is shown in the following figures. Among them, Figure 10 and Figure 11 show the results of a case with an aspect ratio of 2.0, a clearance ratio of 0.5 and a porosity of 10%.
In Figure 10, the difference in wind pressure distribution occurring at the front and rear of the perforated road sign did not show a significant change according to the wind speed. In Figure 11, the wind speed distribution, the length and the area of the separation region at the rear of the perforated road sign did not show a significant effect on the wind speed.
The Royal Netherlands Meteorological Institute [28] analyzed the relationship between wind speed and drag coefficient. It was found that wind speed and drag coefficient had a parabolic relationship. According to the study, it was analyzed that the drag coefficient increases as the wind speed increases, and shows the maximum value under wind speeds of 30–35 m/s, and decreases when the wind speed exceeds 35 m/s.
However, the drag coefficient of the perforated road sign does not show a clear trend with the wind speed. Figure 12 shows the drag coefficient of perforated road signs according to the wind speed. It was found that the air flow from the hole in the perforated road sign affects the pressure and wind speed behind the perforated road sign, so that the difference in wind pressure between the front and the rear of the perforated road sign is constant.
Figure 13 shows the drag coefficient reduction effect of perforated road signs according to the wind speed. The drag coefficient reduction ratio according to the wind speed is expressed as the ratio of the drag coefficient of the perforated road sign in the case of wind speed of 10 m/s, and that for each wind speed. The drag coefficient range according to the wind speed was found to increase as the aspect ratio and clearance ratio of perforated road signs increased. For the perforated road sign with an aspect ratio of 2.0 and a clearance ratio of 0.2, the drag coefficient was found in a narrow range of 0.98 to 1.00 times, depending on the wind speed. However, In the case of the perforated road sign with an aspect ratio of 4.0 and a clearance ratio of 0.5, the drag coefficient by wind speed was found in a wider range of 0.97 to 1.03 times.
3.3. Effect of Reducing the Cross Section of Post According to the Application of Perforated Road Signs
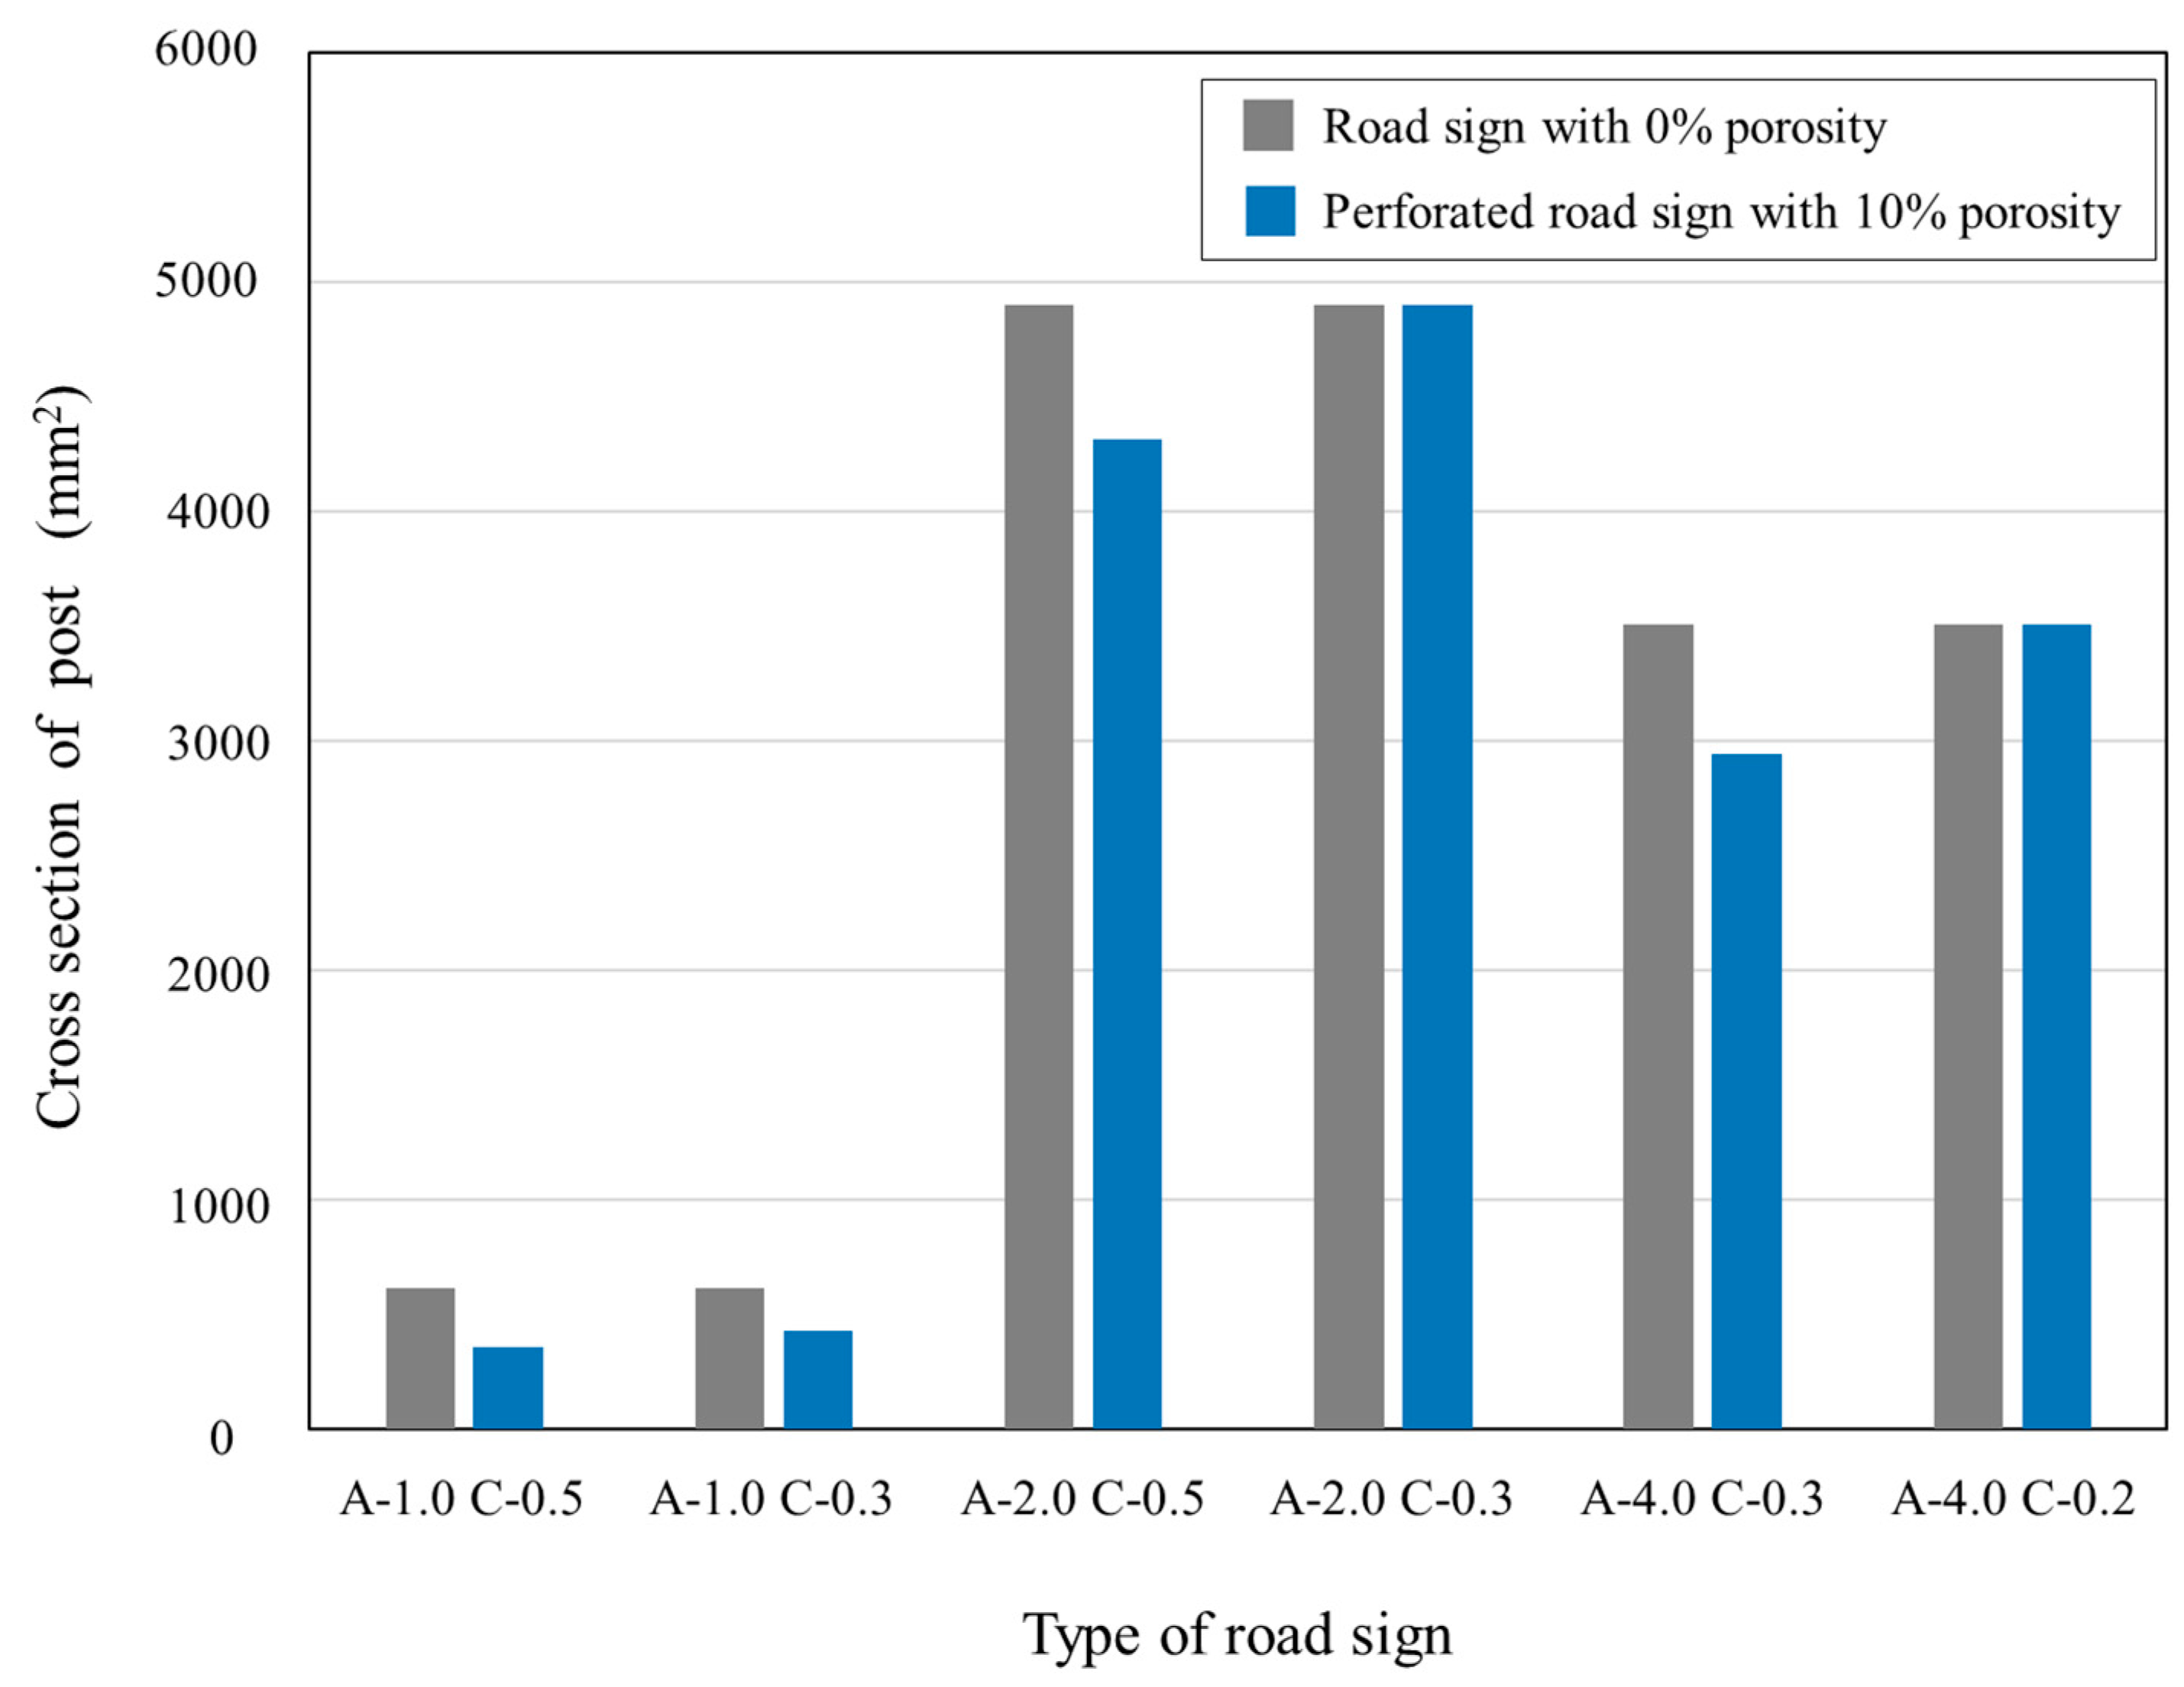
The effect of reducing the cross-section of the post, according to the application of perforated road signs, was analyzed. Figure 14 shows the cross-section of the post of a road sign with 0% porosity and a perforated road sign with 10% porosity. For the perforated road signs, it was analyzed that the cross section of post was reduced by up to 38.2% at aspect ratio 1.0 and clearance ratio 0.5. It was found that the reduction rate of the cross section of post was relatively high in the perforated road sign with clearance ratio 0.5.
4. Conclusions
In this study, the drag coefficient of perforated road signs with porosity less than 30% was analyzed using CFD analysis. The analysis was conducted using the aspect and clearance ratios of perforated road signs as parameters, and the drag coefficient was analyzed according to the porosity of the perforated road sign and the wind speed. Based on the analysis results, the following conclusions were drawn.
- As the porosity of perforated road signs increased, the drag coefficient was found to decrease. This effect can be attributed to the fact that the area of the separation region on the rear surface of the perforated road sign decreased as the porosity increased. In addition, the influence of porosity on the drag coefficient of perforated road signs was analyzed. The perforated road sign with a porosity of 30% showed a drag coefficient reduction effect of up to 0.85 times. Moreover, the drag coefficient reduction rate of perforated road signs was found to be more affected by the clearance ratio than the aspect ratio. The drag coefficient reduction effect of the perforated road sign with a clearance ratio of 0.2 was 0.9 times, while that of signs with clearance ratios of 0.3 and 0.5 was 0.85 times, indicating that the perforated road signs closer to the ground have a higher drag coefficient reduction effect.
- For perforated road signs, the drag coefficient does not show a clear correlation with the wind speed. It is found that the difference in wind pressure between the front and rear of the perforated road sign shows a constant trend, owing to the air flow through the hole in the perforated road sign. Furthermore, the drag coefficient reduction rate of perforated road signs according to the wind speed was analyzed. The analysis results showed that the drag coefficient range according to the wind speed increased as the aspect and clearance ratios of perforated road signs increased.
This study provides a foundation for further research to prepare a drag coefficient calculation formula that considers the porosity of perforated road signs and wind speed.
Author Contributions
H.S.: Writing—Reviewing and Editing, Conceptualization, Project administration. K.C.: Data curation, Investigation. W.C.: Writing—Original draft preparation, Writing—Reviewing and Editing. All authors have read and agreed to the published version of the manuscript.
Funding
This study was funded by “Road Sign Management Center Operation” from Korea Institute of Civil Engineering and Building Technology, 2022.
Data Availability Statement
Not applicable.
Conflicts of Interest
The authors declare no conflict of interest.
References
- Natural Disaster Annual Report 2020; 11-1741000-000002-11; Ministry of the Interior and Safety: Sejong, Republic of Korea, 2021; p. 110.
- Korea Institute of Civil Engineering and Building Technology. Development and Commercialization of Lightweight Road Sign; KICT 2015-197; p. 1. 2015. Available online: https://www.kict.re.kr/researchResultWeb/getResearchResultDepthList.es?mid=a20201030000 (accessed on 23 November 2022).
- Jeon, J.Y.; Han, K.M.; Song, J.S.; Park, S.H. Computational Fluid Dynamic (CFD) Analysis-based Feasibility Study on Wind Power Generation due to Traveling Vehicles on Highway. J. Kor. Soc. Civil Eng. 2013, 33, 739–748. [Google Scholar]
- Sung, H.K.; Chong, K.S. Experimental Investigation of the Drag Coefficient of Porous Road Signs. J. Kor. Acad. Industr. Coop. Soc. 2018, 19, 71–76. [Google Scholar]
- ASCE 7-22 Minimum Design Loads and Associated Criteria for Buildings and Other Structures; American Society of Civil Engineers: Reston, VA, USA, 2022.
- A Study on the Structure and Manufacturing Method of Road Signs; 11-1613000-000712-01; Korea Institute of Civil Engineering and Building Technology: Goyang, Republic of Korea, 2015.
- Gao, Z.; Peng, W.; Gao, C.Y.; Li, Y. Parabolic dependence of the drag coefficient on wind speed from aircraft eddy-covariance measurements over the tropical Eastern Pacific. Sci. Rep. 2020, 10, 1805. [Google Scholar] [CrossRef] [Green Version]
- AS 1170.2:2021; Australian Standard Structural Design Actions Wind Actions. ISO: Geneva, Switzerland, 2021.
- Road Sign Handbook; Japan Contractors Association of Traffic Signs and Lane Markings: Ishikawa, Japan, 2022.
- Ministry of Land, Infrastructure and Transport. Road Sign Standard. 2021. Available online: https://www.mlit.go.jp/road/road_e/pdf/ROAD2021web.pdf (accessed on 23 November 2022).
- Constantinescu, G.; Bhatti, A.; Tokyay, T. A Numerical Study of Wind Loads on Large Highway Sign Structures. In Proceedings of the 18th Analysis and Computation Specialty Conference, Vancouver, BC, Canada, 24–26 April 2008. [Google Scholar] [CrossRef]
- Qiu, Y.; San, B.; Zhao, Y. Numerical Simulation and Optimization of Wind Effects of Porous Parapets on Low-Rise Buildings with Flat Roofs. Adv. Civil Eng. 2019, 3402613, 11. [Google Scholar] [CrossRef]
- Daemei, A.B.; Darvish, A.; Aeinehvand, R.; Razzaghipour, A. Large-Eddy Simulation (LES) on the Square and Triangular Tall Buildings to Measure Drag Force. Adv. Civil Eng. 2021, 2021, 6666895. [Google Scholar] [CrossRef]
- Korea Expressway Corporation. Improvement of Design Standards for Wind Protection Facilities in Strong Winds, Highway Design Guidebook; Korea Expressway Corporation: Gimcheon-si, Republic of Korea, 2011. [Google Scholar]
- Kim, I.C.; Park, T.G.; Lee, J.H.; Lee, Y.J. An Experimental Study on the Seohae Grand Bridge's Aerodynamic Behaviors induced Wind Fences. J. Wind Eng. Inst. Kor. 2003, 7, 193–199. [Google Scholar]
- Letchford, C.W. Wind loads on rectangular signboards and hoardings. J. Wind Eng. Industr. Aerodyn. 2001, 89, 135–151. [Google Scholar] [CrossRef]
- Giannoulis, A.; Stathopoulos, T.; Briassoulis, D.; Mistrioti, A. Wind loading on vertical panels with different permeabilities. J. Wind Eng. Industr. Aerodyn. 2012, 107, 1–16. [Google Scholar] [CrossRef]
- Xu, J.; Xu, H.; Zeng, C.; Xie, C.; Guo, J. CFD Simulation Study on Wind Load of Perforated Traffic Sign Board. PLoS ONE 2020, 15, e0240927. [Google Scholar] [CrossRef] [PubMed]
- Song, H.S.; Yu, S.C.; Kim, Y.Y.; Lim, S.Y. Evaluation of Wind Load and Drag Coefficient of Insect Net in a Pear Orchard using Wind Tunnel Test. J. Kor. Soc. Agri. Eng. 2019, 61, 75–83. [Google Scholar]
- Ping, L.V.; Dong, Z.; Luo, W.; Qian, G. The pressure-field characteristics around porous wind fences: Results of a wind tunnel study. Environ. Earth Sci. 2013, 68, 947–953. [Google Scholar]
- Lisowski, E.; Lisowski, F. Determination of Aerodynamic Drag Coefficients of Longitudinal Finned Tubes of LNG Ambient Air Vaporizers Using CFD and Experimental Methods. Appl. Sci. 2022, 12, 10865. [Google Scholar] [CrossRef]
- Wang, F.; Jiang, G. Numerical Investigations of Wind Loads on Spherical Structures with Various Types of Configurations. Building 2022, 12, 1832. [Google Scholar] [CrossRef]
- Midas NFX 2020 R1 (64bit); MIDAS Information Technology Co., Ltd: Pangyo, Republic of Korea, 2021.
- Kim, S.H.; Kim, I.H.; Chang, Y.B. A Study of Three Dimensional Flow Characteristics near the Porous Wall. J. Energy Eng. 2019, 28, 19–28. [Google Scholar]
- Agarwal, A.; Irtaza, H. Numerical Investigation of the Turbulent Wind Flow Through Elevated Windbreak. J. Inst. Eng. Ser. A 2018, 99, 311–320. [Google Scholar] [CrossRef]
- Bitog, J.P.; Lee, I.B.; Hwang, H.S.; Shin, M.H.; Hong, S.W.; Seo, I.H.; Mostasa, E.; Pang, Z. A wind tunnel study on aerodynamic porosity and windbreak drag. J. Forest Sci. Technol. 2011, 7, 8–16. [Google Scholar] [CrossRef]
- Babin, T.; Sangeetha, N.; Sudalaiyandi, D.P. Reducing the drag resistance of automotive cars by diminishing the wake separation zone. In Proceedings of the International Conference on Sustainable Engineering and Technology (icONSET 2018), Bengaluru, India, 19–20 April 2018; Volume 2039. [Google Scholar]
- Drag at High Wind Velocities—A Review; Technical Report; TR-361; Royal Netherlands Meteorological Institute: De Bilt, The Netherlands, 2017; pp. 2–4.
Figure 1.
CFD analysis model of perforated road sign.

Figure 2.
Virtual wind tunnel domain.
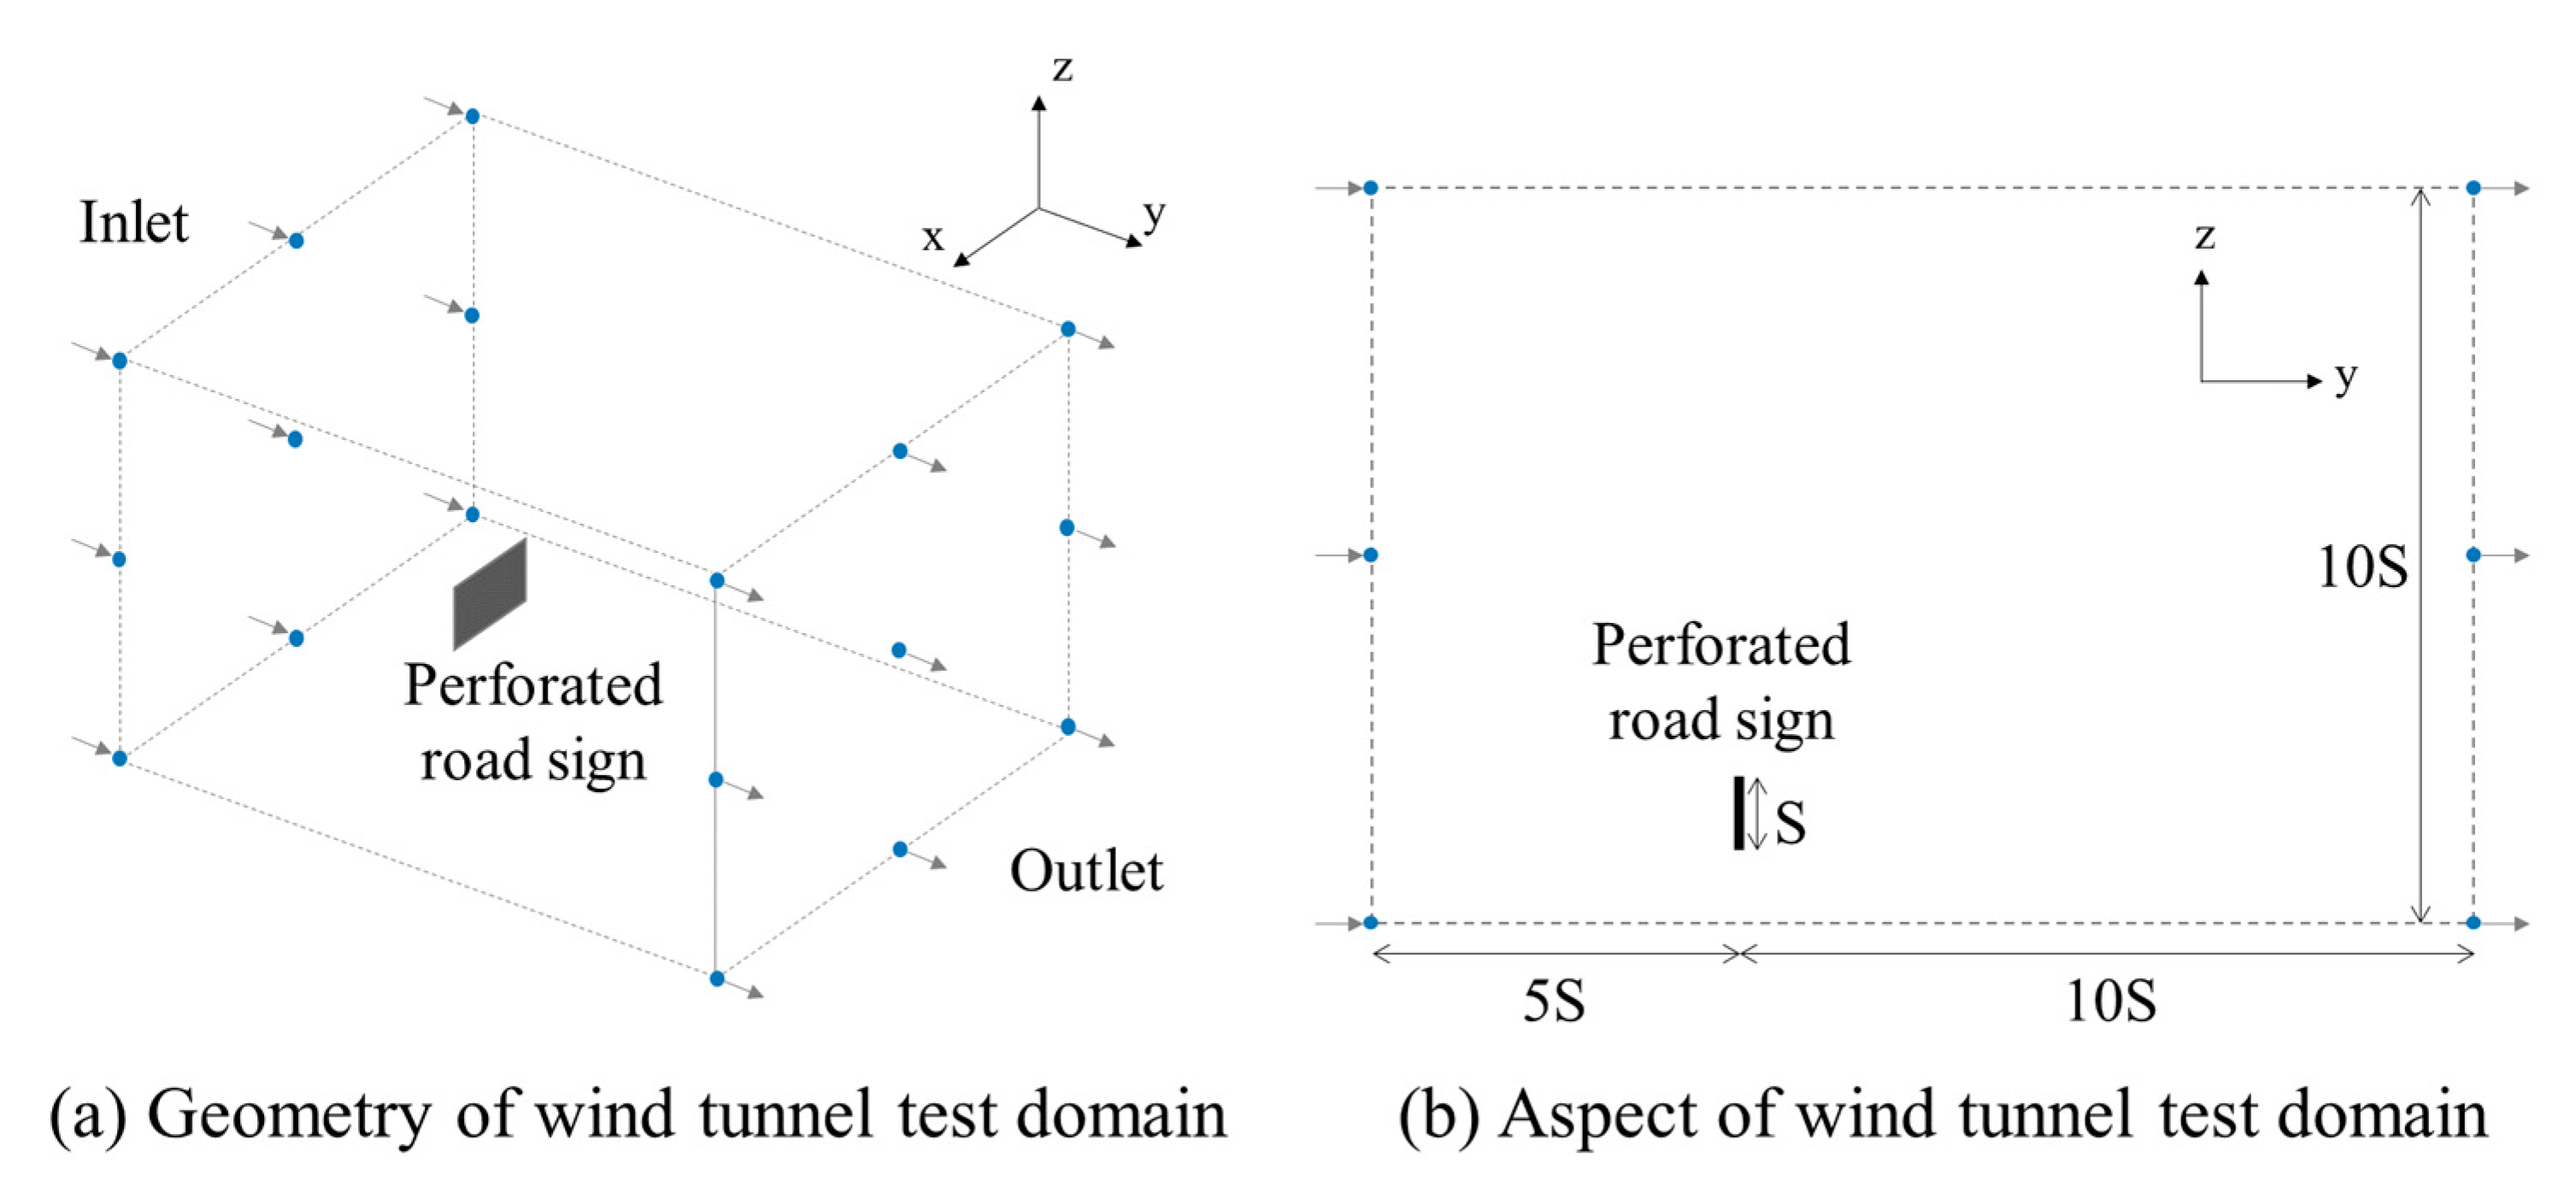
Figure 3.
Drag coefficient of perforated road sign with 0% and 30% porosity.

Figure 4.
Suitability verification of CFD analysis.

Figure 5.
Wind tunnel test of perforated road sign.
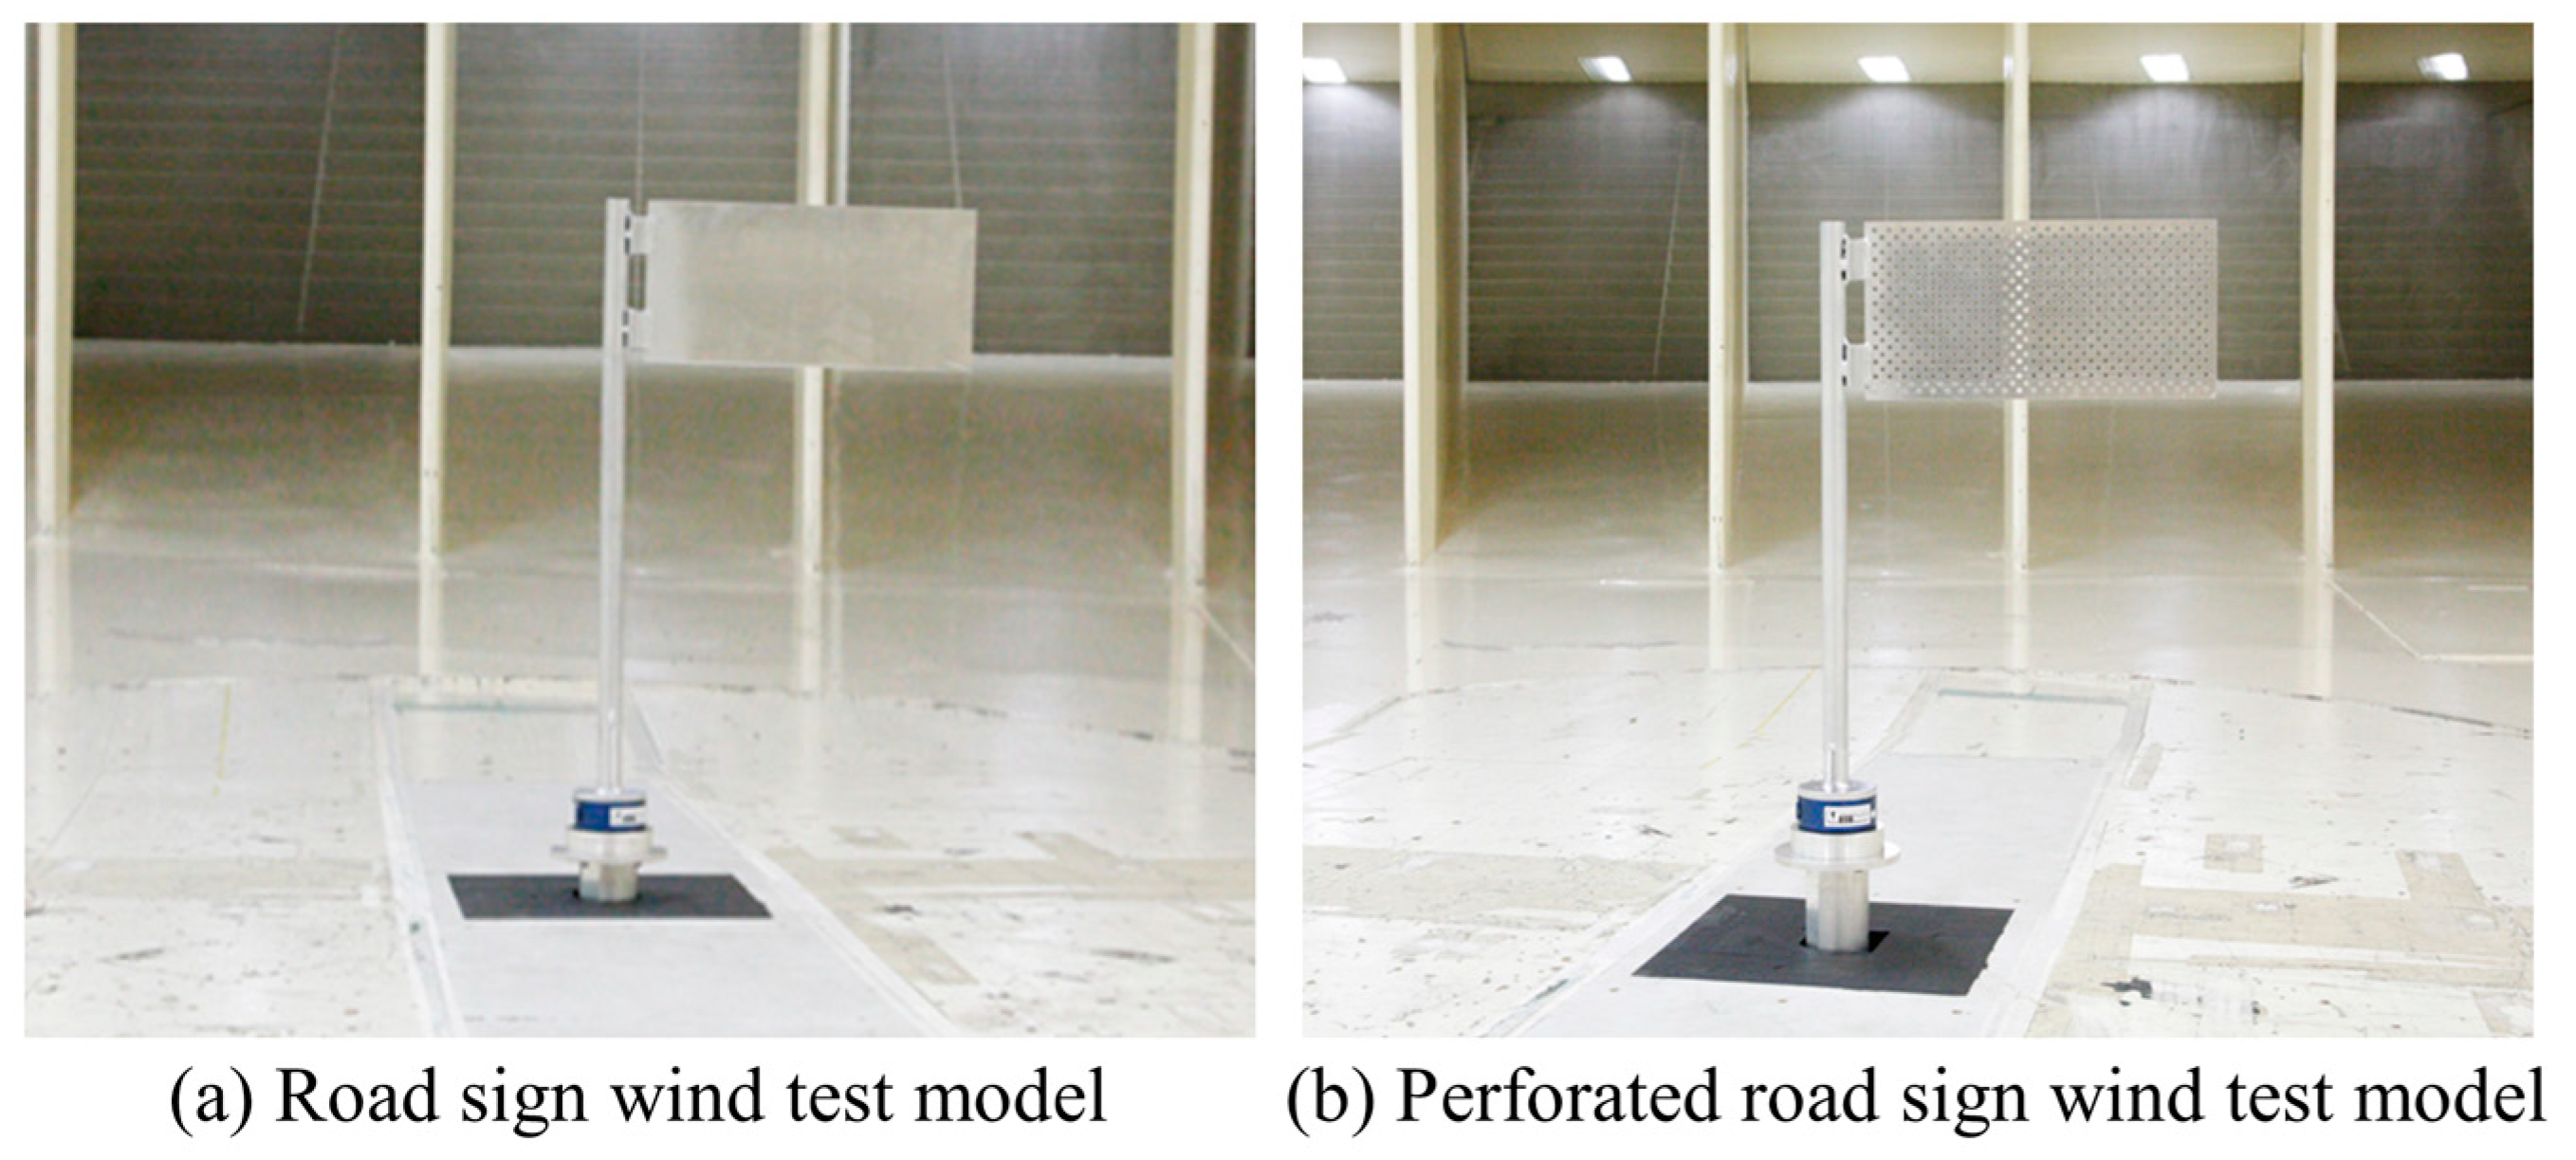
Figure 6.
Wind pressure distribution of perforated road sign by porosity.

Figure 7.
Wind speed distribution of perforated road sign by porosity.

Figure 8.
Correlation between porosity and drag coefficient.

Figure 9.
Drag coefficient reduction ratio of perforated road sign by porosity.
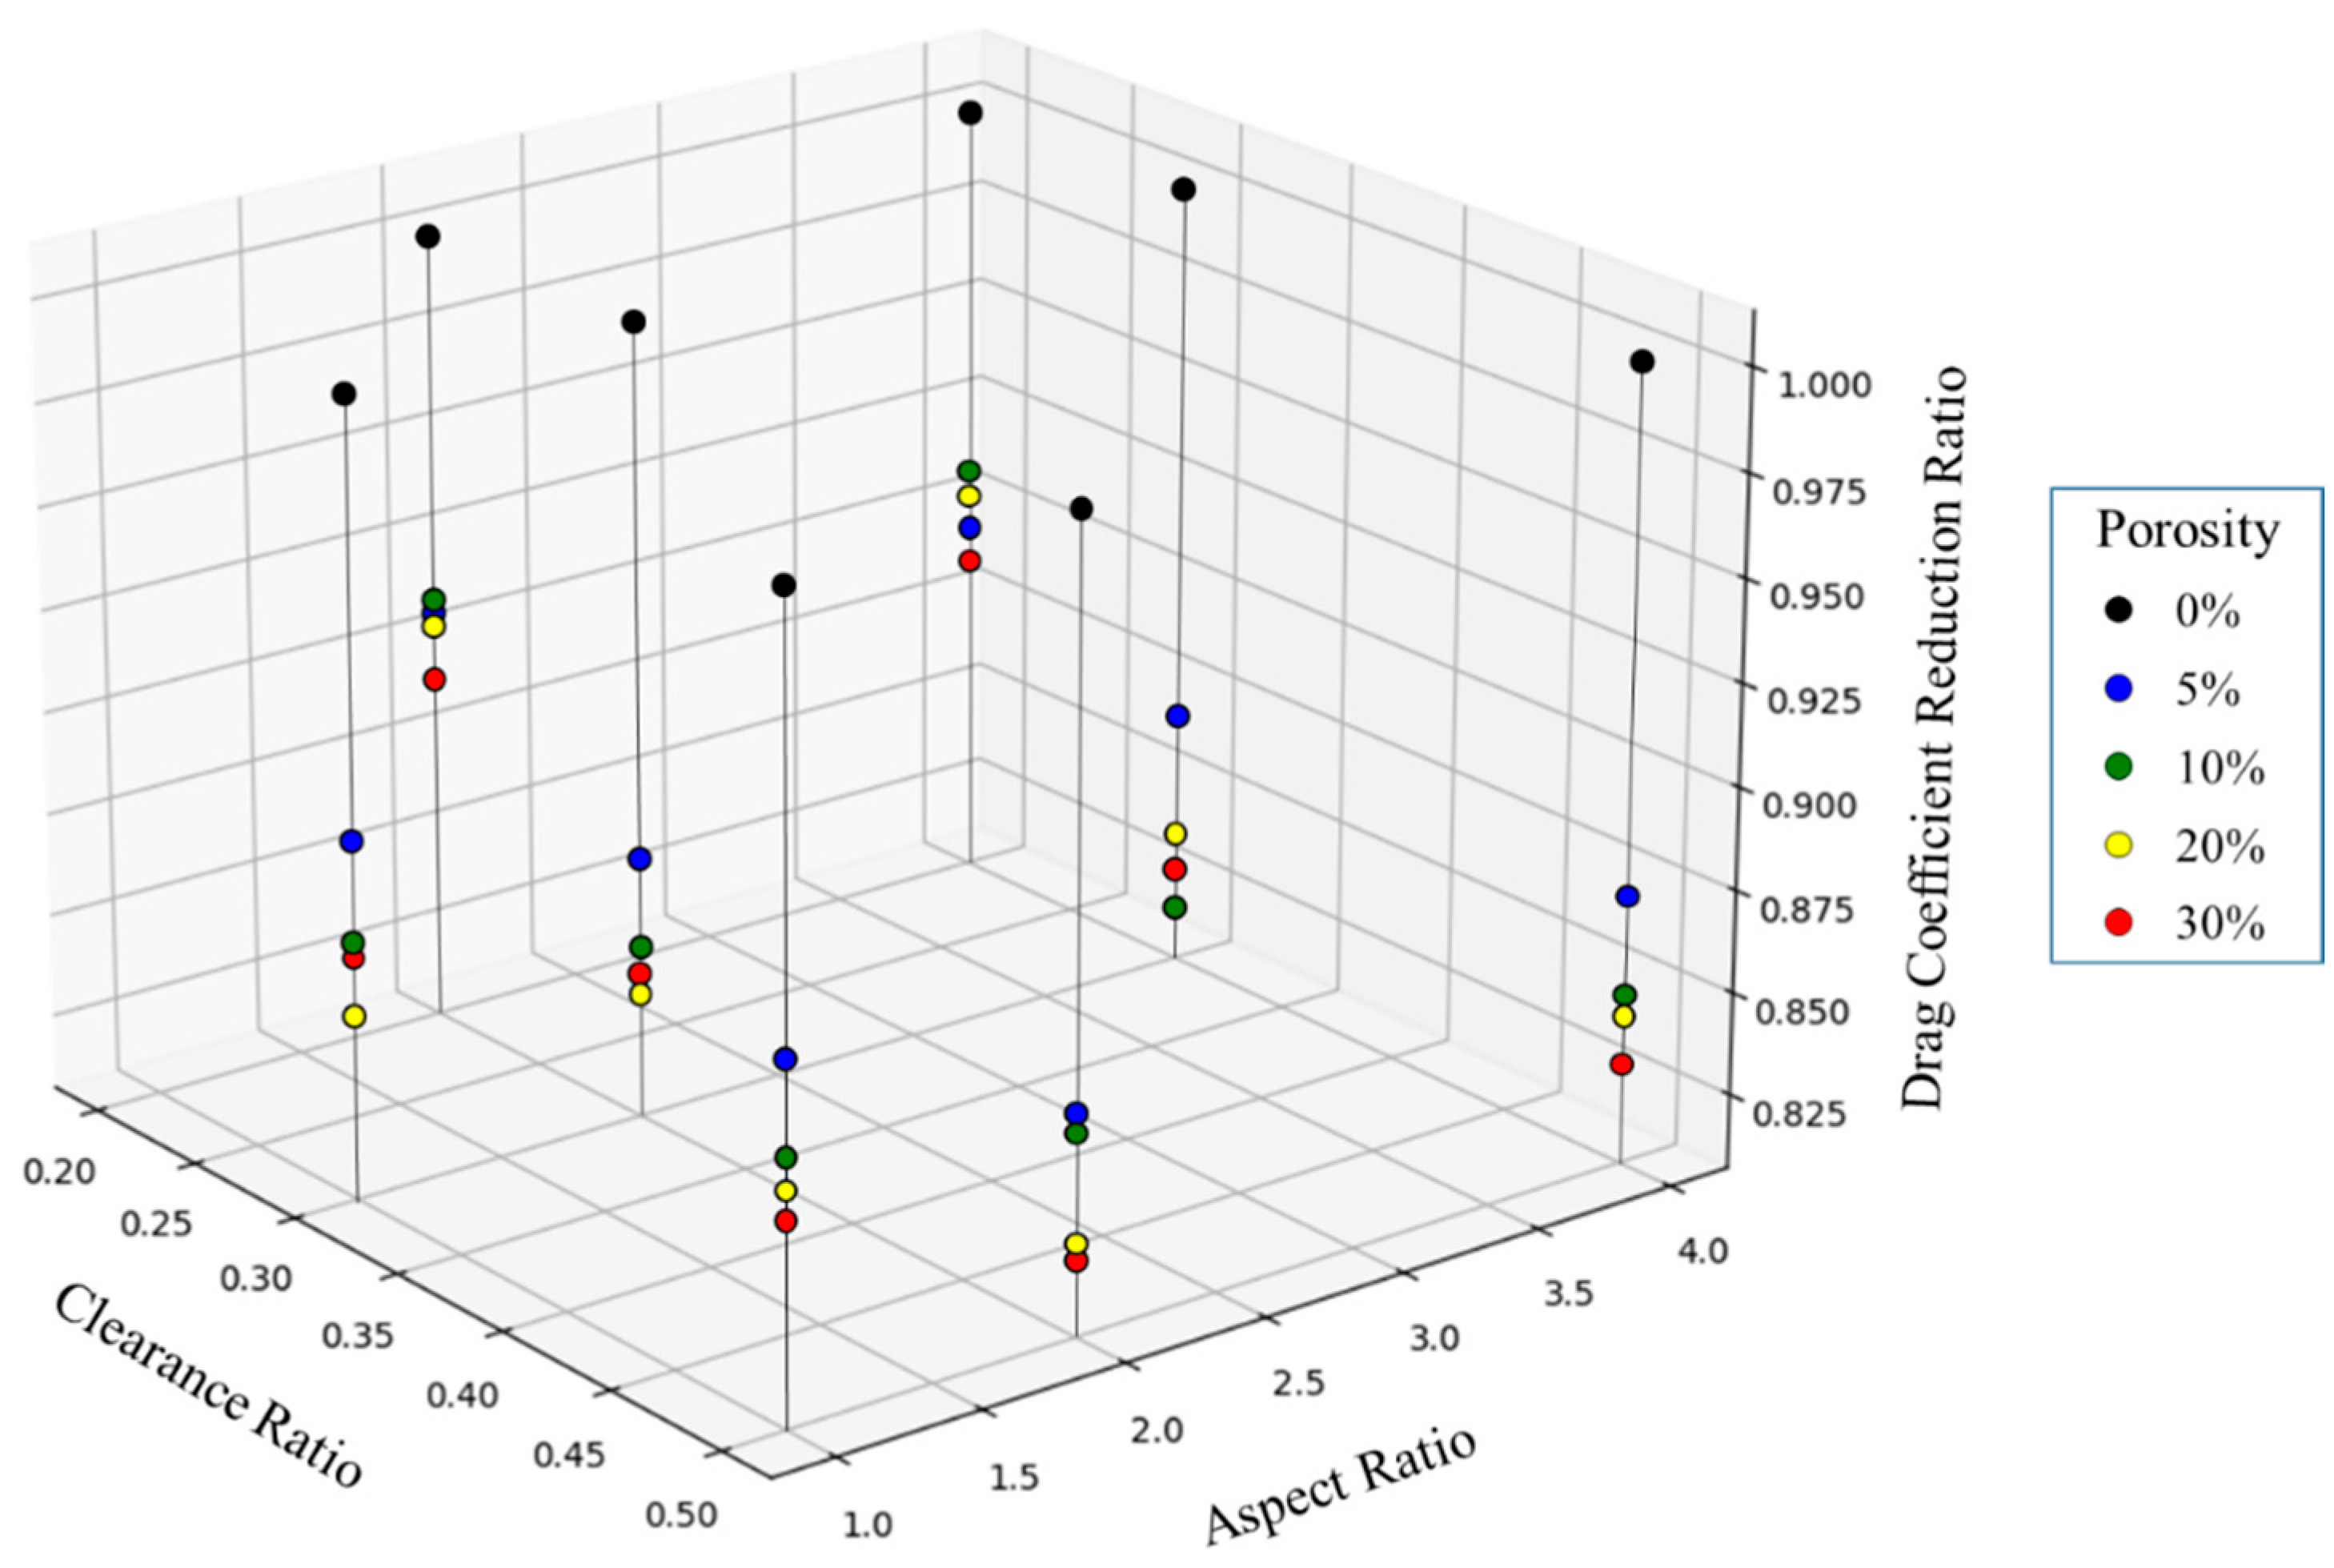
Figure 10.
Wind pressure distribution of perforated road sign by wind speed.
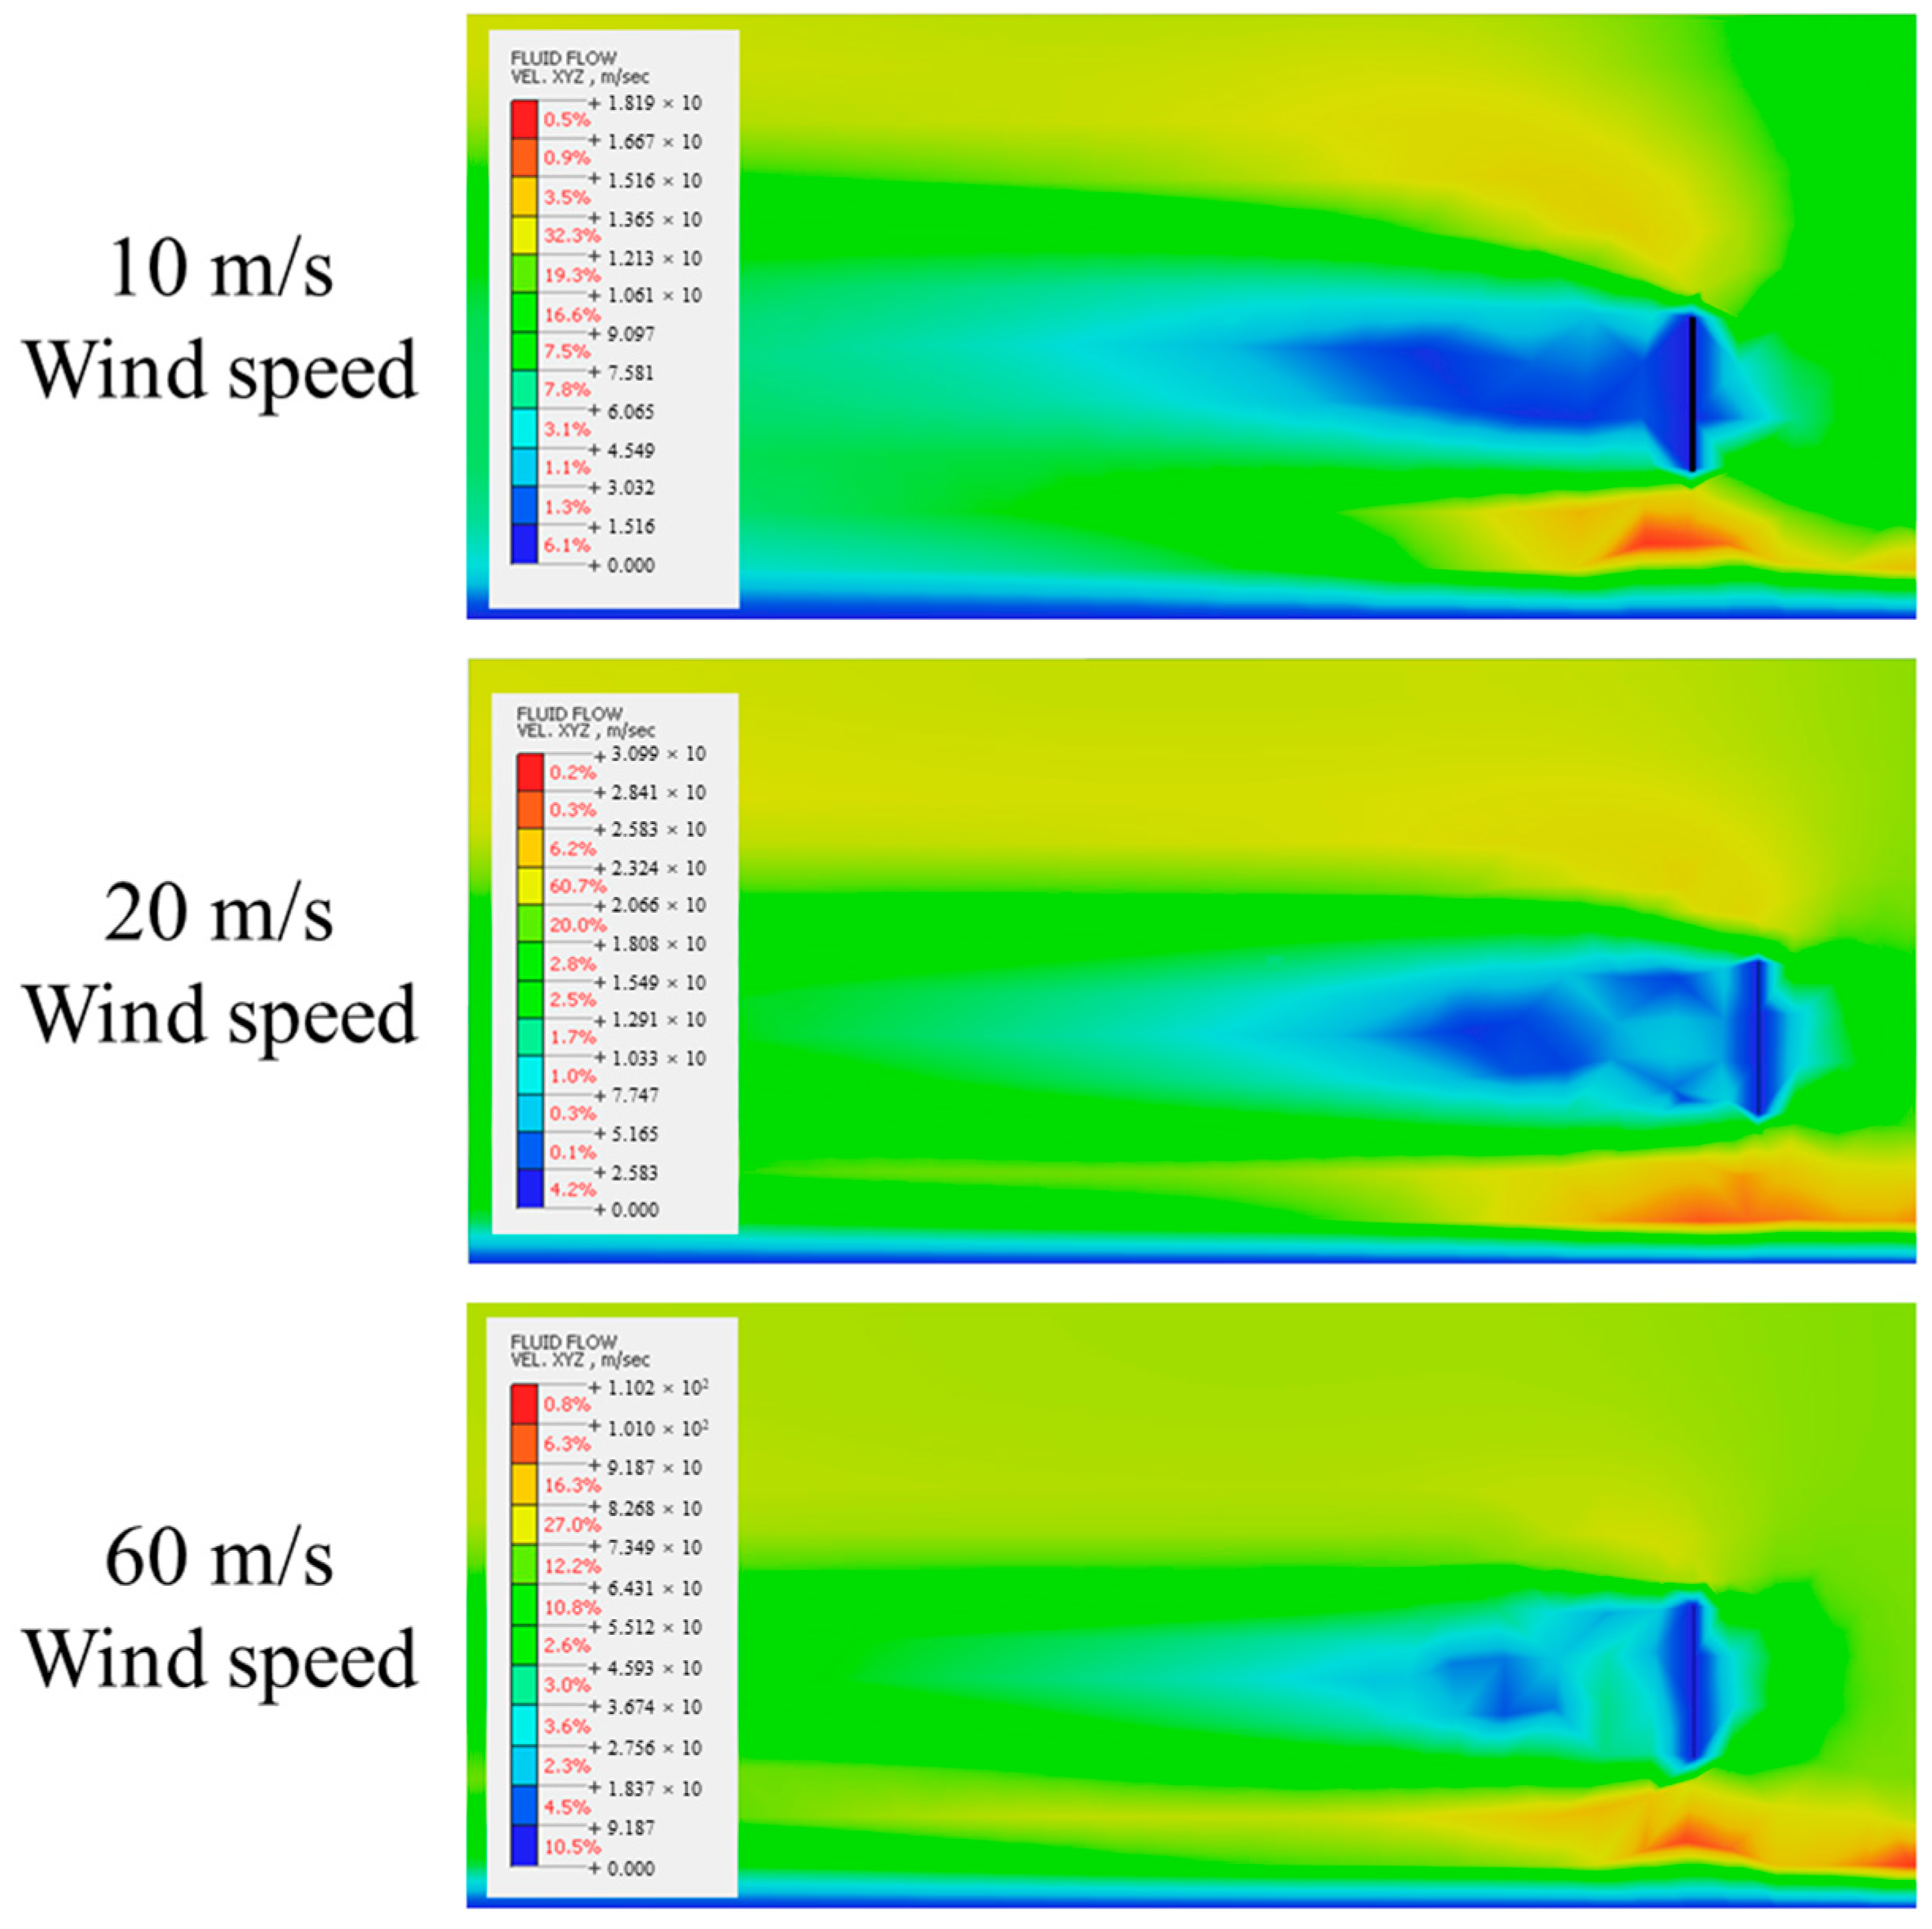
Figure 11.
Wind speed distribution of perforated road sign by wind speed.

Figure 12.
Correlation between wind speed and drag coefficient.
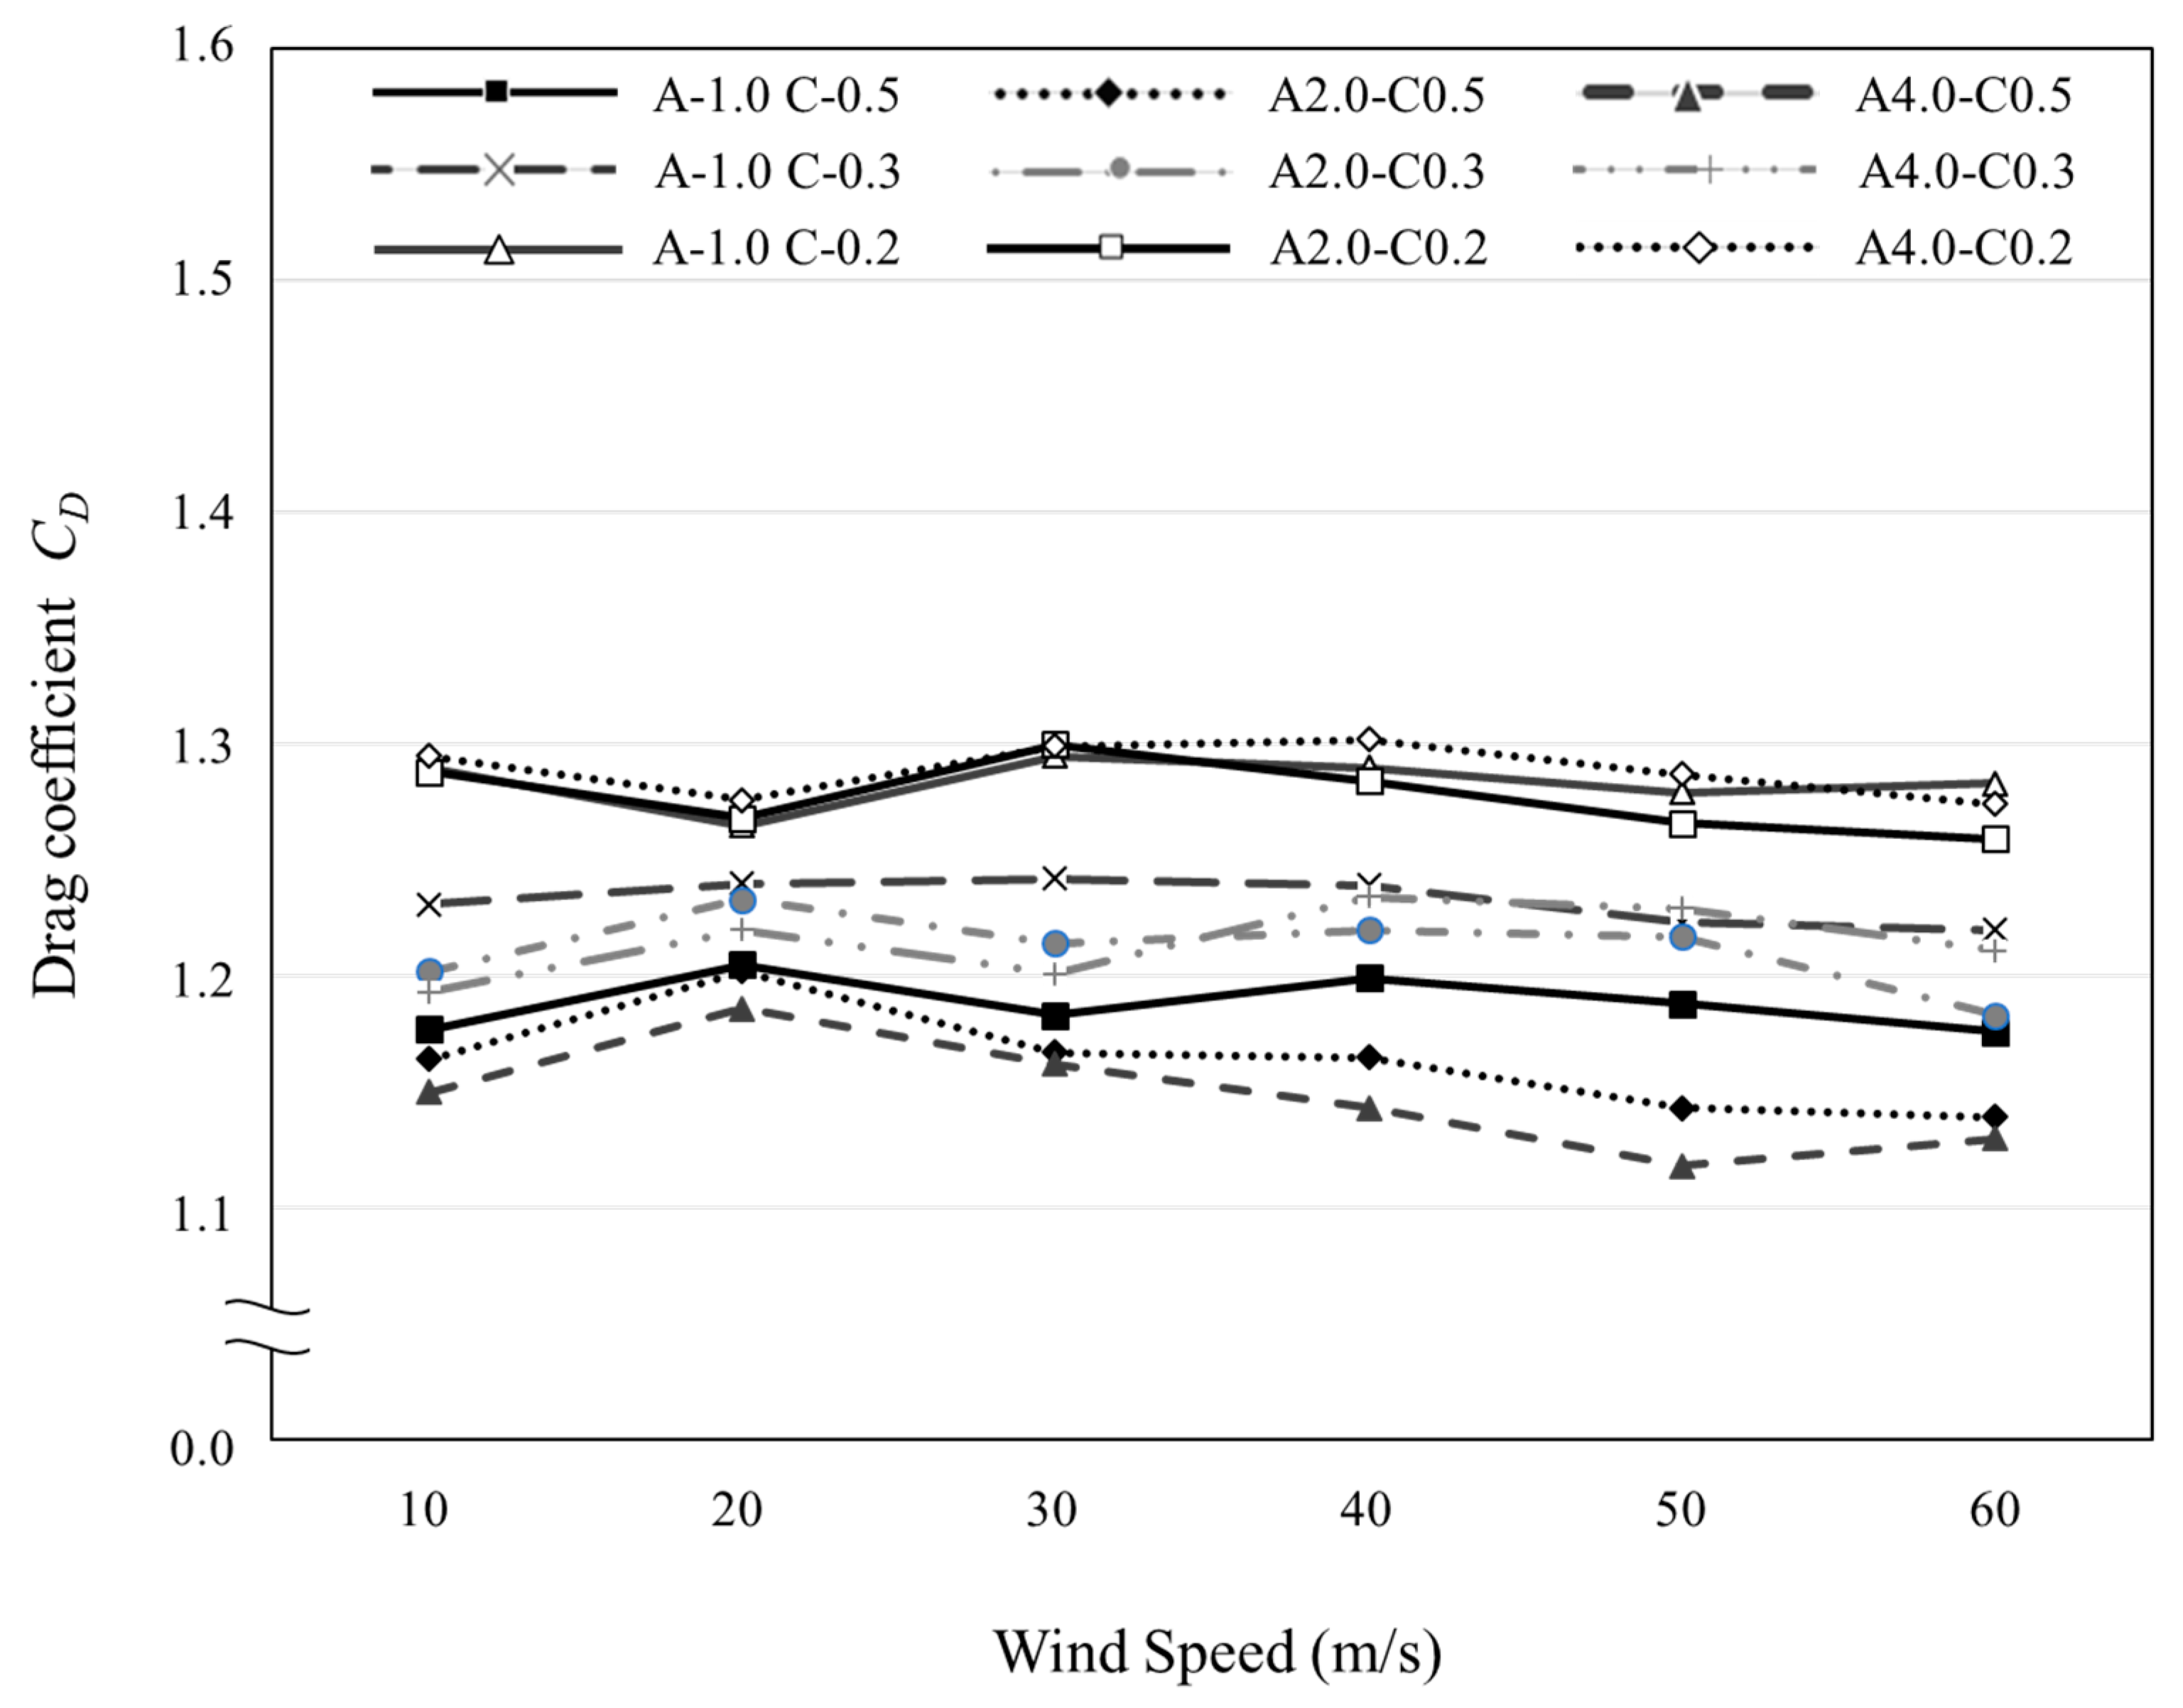
Figure 13.
Drag coefficient reduction ratio of perforated road sign by wind speed.
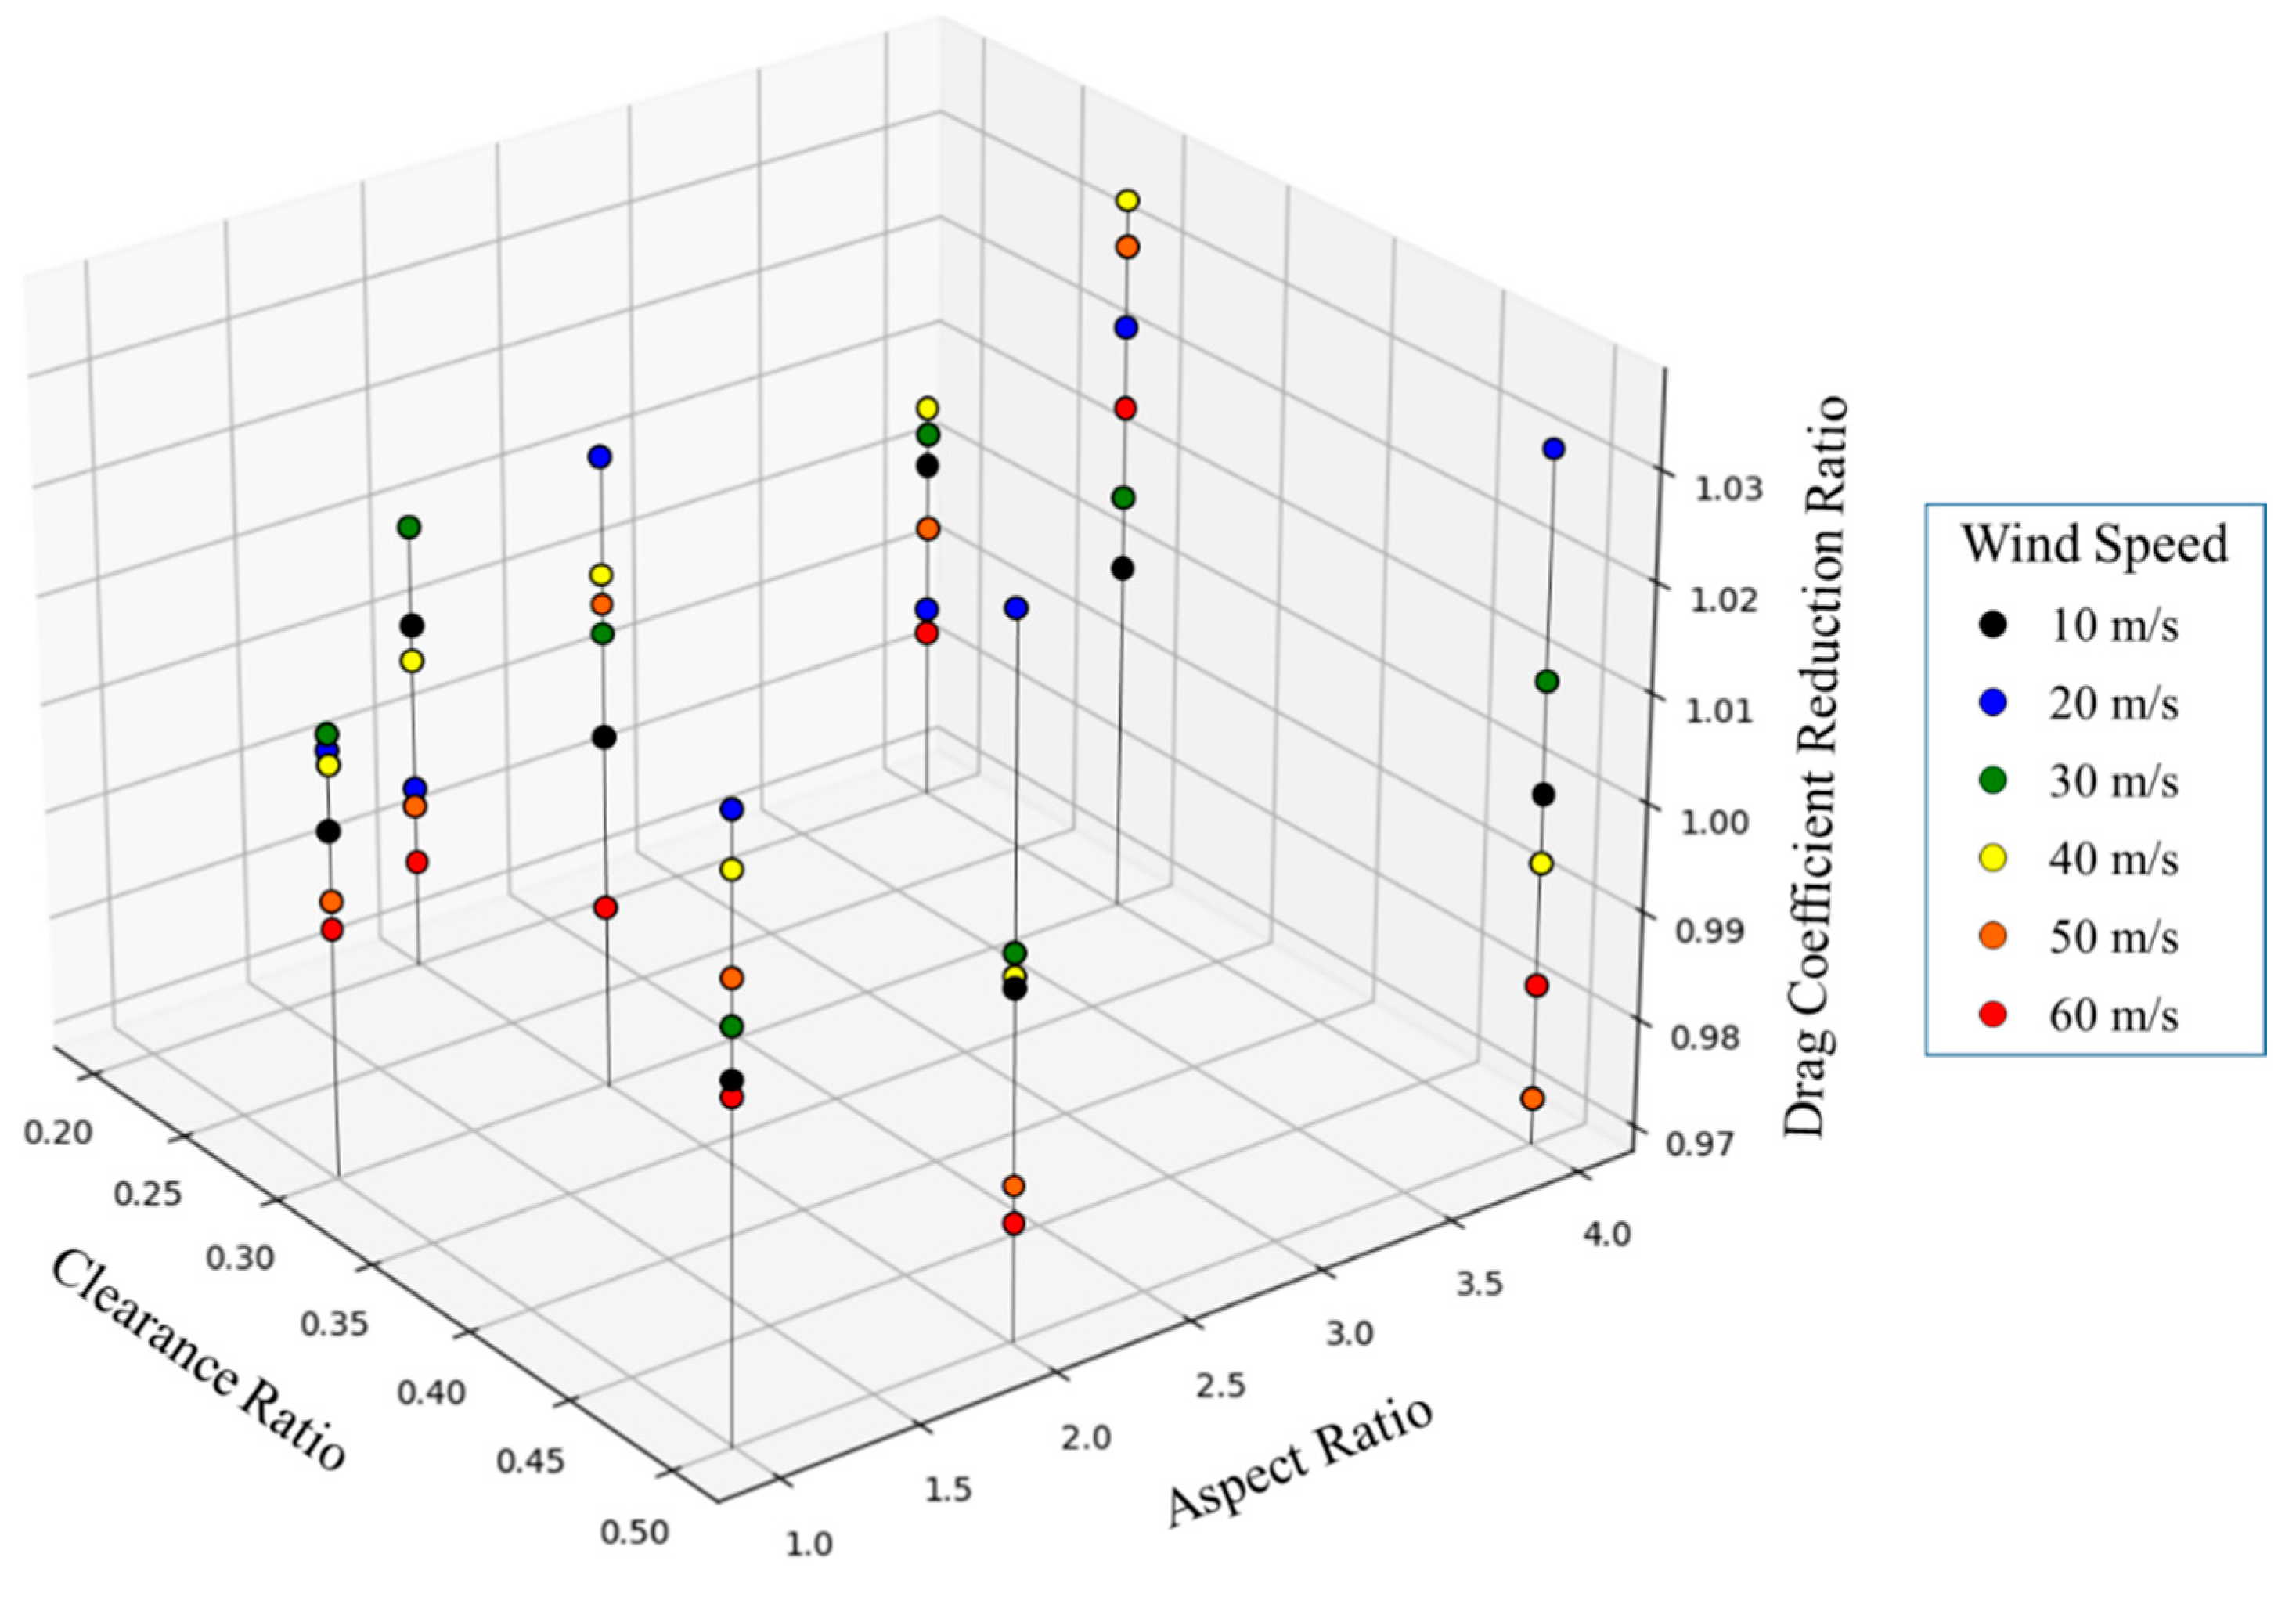
Figure 14.
Effect of reducing the cross section of perforated road sign post.

Table 1.
Material of perforated road sign.
| Property | Unit | Value |
|---|---|---|
| Material | Alloy steel | - |
| Elastic modulus | N/mm2 | 210 |
| Poisson’s ratio | - | 0.28 |
| Tensile strength | N/mm2 | 730 |
Table 2.
Specific of fluid flow model.
| Property | Unit | Value |
|---|---|---|
| Turbulence model | Two-equation k–ε | - |
| Air density | kg/m3 | 1.1845 |
| Viscosity | kg/(m∙s) | 1.8444 × 10⁻⁵ |
| Turbulence intensity | % | 5 |
| Turbulence length scale | m | 0.004 |
| Number of iterations | - | 1500 |
Table 3.
CFD analysis parameters.
| Parameter Name | Aspect Ratio (A) | Clearance Ratio (C) |
|---|---|---|
| A2.0-C0.2 | 2.0 | 0.2 |
| A4.0-C0.2 | 4.0 | |
| A1.0-C0.3 | 1.0 | 0.3 |
| A2.0-C0.3 | 2.0 | |
| A4.0-C0.3 | 4.0 | |
| A1.0-C0.5 | 1.0 | 0.5 |
| A2.0-C0.5 | 2.0 | |
| A4.0-C0.5 | 4.0 |
Table 4.
Drag coefficient reduction ratio of perforated road sign.
| Test Type | Wind Speed | Drag Coefficient Reduction Ratio |
|---|---|---|
| Wind tunnel test | 10 m/s | 0.974 |
| 20 m/s | 0.978 | |
| CFD analysis | 10 m/s | 0.911 |
| 20 m/s | 0.900 |
Disclaimer/Publisher’s Note: The statements, opinions and data contained in all publications are solely those of the individual author(s) and contributor(s) and not of MDPI and/or the editor(s). MDPI and/or the editor(s) disclaim responsibility for any injury to people or property resulting from any ideas, methods, instructions or products referred to in the content. |
© 2022 by the authors. Licensee MDPI, Basel, Switzerland. This article is an open access article distributed under the terms and conditions of the Creative Commons Attribution (CC BY) license (https://creativecommons.org/licenses/by/4.0/).
Share and Cite
MDPI and ACS Style
Sung, H.; Chong, K.; Chung, W. Influence of Porosity on Drag Coefficient of Perforated Road Signs. Appl. Sci. 2023, 13, 502. https://doi.org/10.3390/app13010502
AMA Style
Sung H, Chong K, Chung W. Influence of Porosity on Drag Coefficient of Perforated Road Signs. Applied Sciences. 2023; 13(1):502. https://doi.org/10.3390/app13010502
Chicago/Turabian StyleSung, Hongki, Kyusoo Chong, and Wonseok Chung. 2023. "Influence of Porosity on Drag Coefficient of Perforated Road Signs" Applied Sciences 13, no. 1: 502. https://doi.org/10.3390/app13010502
Note that from the first issue of 2016, this journal uses article numbers instead of page numbers. See further details here.