Article

The Obesity Paradox: Associations between the Body Mass Index and Self-Perceived Health, Depression Status, and Pain Level in Older People

by
Ángel Denche-Zamorano
1,
Diana Salas-Gómez
2,*,
Jorge Carlos-Vivas
3,*,
Sabina Barrios-Fernandez
4,
Eugenio Merellano-Navarro
5,
Daniel Collado-Mateo
6,
Pedro R. Olivares
7,8 and
José Carmelo Adsuar
1
1
Promoting a Healthy Society Research Group (PHeSO), Faculty of Sport Sciences, University of Extremadura, 10003 Caceres, Spain
2
Movement Analysis Laboratory, Physiotherapy School Cantabria, Escuelas Universitarias Gimbernat (EUG), University of Cantabria, 39300 Torrelavega, Spain
3
Physical Activity for Education, Performance and Health, Faculty of Sport Sciences, University of Extremadura, 10003 Caceres, Spain
4
Occupation, Participation, Sustainability and Quality of Life (Ability Research Group), Nursing and Occupational Therapy College, University of Extremadura, 10003 Cáceres, Spain
5
Faculty of Education, Universidad Católica del Maule, Talca 3466706, Chile
6
Centre for Sport Studies, Rey Juan Carlos University, 28043 Fuenlabrada, Spain
7
Faculty of Education, Psychology and Sport Sciences, Universidad de Huelva, 21007 Huelva, Spain
8
Facultad de Educación, Universidad Autonoma de Chile, Santiago 7500912, Chile
*
Authors to whom correspondence should be addressed.
Appl. Sci. 2023, 13(1), 588; https://doi.org/10.3390/app13010588
Submission received: 6 December 2022 / Revised: 29 December 2022 / Accepted: 30 December 2022 / Published: 31 December 2022

Abstract

:
Population growth and physical inactivity have led to health and social consequences derived from chronic diseases and decreased quality of life in the elderly. Some research suggests that overweight in older people may not be associated with the negative effects on some health indicators. This study analysed the associations between Self-Perceived Health (SPH), Depression status, Pain Level, and Body Mass Index (BMI) in people over 70 years who are residents in Spain, with a final sample composed of 13,895 participants. A cross-sectional study using data from the European Health Surveys in Spain (EHIS2014 and 2020) and the National Health Survey (ENSE2017) was conducted. Dependency associations were observed between SPH, Depression Status, and Pain Level with BMI in the outcomes from the three surveys analysed (p < 0.001). Negative SPH, Depression Status, and Severe/Extreme Pain Degree prevalence were higher in the Underweight groups, being the lowest in Normal-weight and Overweight groups (p < 0.05). High levels of negative SPH, Depression, and Severe/Extreme Pain risks were found in the Underweight compared to the Normal-weight group, but not in Overweight ones. Overweight was not linked with an increased risk of the conditions analysed compared to the Normal-weight groups in older residents in Spain. The Underweight group presented the highest negative SPH prevalence, Depression, and Severe/Extreme Pain. Moreover, Obesity increased the negative SPH, Depression, and Pain Degree risks compared to the Normal-weight and Overweight groups in this population.

1. Introduction

Population growth and physical inactivity have led to health and social consequences derived from chronic diseases and decreased quality of life in the elderly [1]. Ageing is associated with changes in the organism that vary in rhythm and gradualness, all of them influenced by genetic and environmental factors, including economic and working conditions, eating habits, and lifestyle habits [2]. Among the physical changes in the ageing process, we may highlight sarcopenia; loss of muscle mass and strength [3,4]; frailty syndrome [5], which is characterised by a state of vulnerability, weakness, and decreased physiological functions; a reduced capacity to resist stress, leading to increased fall risk, hospitalisation, and mortality [3,6]. These two phenomena can coexist, and together with other physical condition components’ deterioration, can lead to a loss of functional autonomy and mobility, dependence, and morbidity and mortality [7].
Obesity is defined as the excessive accumulation of adipose tissue in the body and is a health risk factor associated with more than 200 medical complications, with increased risk of morbidity and mortality. Obesity is considered complex, multifactorial, and a global pandemic [8], becoming a concern in both high- and low-income countries [9]. It affects all age groups and has a high prevalence in the elderly [10]: it is estimated that 38.5% of older adults present this condition [11,12]. Thus, it is considered the fifth leading cause of death worldwide [8,13,14].
Self-Perceived Health (SPH) is a health indicator of the individual overall perception of their health, including both physical and psychological factors, and has proved to be a valuable health-related status predictor, as it integrates objective knowledge about potential medical conditions together with the individual interpretation [15,16]. Previous research has shown that SPH and Physical Activity Level (PAL) are positively related [17,18].
Depression is considered a contributing factor to morbidity in the elderly, and older people with depressive symptoms experience decreased functionality and health-related quality of life [19] as even the severity of this condition may be greater in this population [20]. Evidence shows that weight loss increases the quality of life and decreases depression in the elderly [21,22,23], but being older and having depressive symptoms are negatively associated with adherence to Physical Activity (PA) programs [24]. Then, reduced physical activity and increased sedentary behaviour in older people aggravate ageing and enhancer frailty [25]. Older adults present a higher incidence of diseases, comorbidities, and injuries that can lead to pain, higher rates of surgery and hospitalisation, and slower recovery, making them particularly vulnerable to pain [26]. Although PA’s impact on the health and quality of life of older people is well-known [27,28,29] and previous evidence suggests that exercise may improve pain severity, more research is still needed [30]. However, inactive elderly people often experience pain when exercising, and if they are overweight or obese, their pain degree increases [31,32], so it becomes a barrier to exercise [33].
Some research claims that overweight in older people could be considered a protective factor for health and may be associated with lower mortality [4,34,35,36,37]. Therefore, this study’s aims included: (1) exploration of the associations between BMI and SPH, Depression prevalence, and Pain Degree presented by residents in Spain over 70 years old; (2) examination of the potential differences between proportions of positive and negative SPH, Depression, and different pain degrees based on the BMI; (3) assessment of the negative or positive SPH risk, Depression Status, and High Pain Level with different BMIs.

2. Materials and Methods

2.1. Design

This study was a cross-sectional analysis with data extracted from the last three main health surveys conducted in Spain: The European Health Survey of Spain carried out in 2014 (EESE2014) [38], the last one conducted in 2020 (EESE2020) [39], and The Spanish National Health Survey 2017 (ENSE2017) [40], using data from the answers given by the participants to the adult questionnaire. The Spanish Ministry of Health, Consumer Affairs and Social Welfare (MSCBS) conducted these health surveys periodically, in collaboration with the Spanish National Statistics Institute (INE), to ascertain the status and other health indicators of the population residing in this country. The questionnaires, methodologies, and microdata were published by the MSCBS and are publicly available at https://www.sanidad.gob.es/estadEstudios/estadisticas/bancoDatos.htm (accessed on 8 November 2022). The surveys were conducted by trained and accredited professionals. The participants in these surveys were residents of Spain, over 15 years old, and randomly selected, following a three-stage stratified random method. Once selected, participants were informed about the surveys and their purpose, about the confidential and anonymous nature of their data, and then they chose whether to participate or not.

2.2. Participants

The interviews were conducted between 15 September 2014 and 25 January 2015 (EESE2014), October 2016 and October 2017 (ENSE2017), and 15 July 2019 and 24 July 2020 (EESE2020). The surveys gathered 22,842 participants (EESE2014), 23,089 participants (ENSE2017), and 22,072 participants (EESE2020). Thus, the initial sample was 68,003 participants from the EESE2014, ENSE2017, and EESE2020 surveys. However, the following eligibility criteria were applied: (1) being 70 years old or older and (2) submitting height and weight data. Thus, the final sample was composed of 13,895 participants. Figure 1 shows the flowchart of the study sample’s eligibility criteria.
Additionally, for the analyses that included the Depression Status variable, participants who answered NS/NC (item 25.20a) were excluded: four from the EESE2014, six from the ENSE2017, and four from the EESE2020. Moreover, for the analyses including Pain Degree (item 45), four in the EESE2014, four in the ENSE2017, and seven in the EESE2020 who did not know or did not answer this item were also excluded.

2.3. Procedures

Using microdata provided by the MSCBS, the following variables were completed and created: Age (years); Sex (male or female); Height (item 109 in the three questionnaires, with answers: in cm, or don’t know or don’t answer (NS/NC)); Weight (item 110 in the three questionnaires, with answers: in kg or NS/NC); BMI (created with data from items 109 and 110, applying the formula: BMI = weight (kg) ÷ height2 (meters)); BMI Group (from the BMI variable, considering: Underweight (BMI < 18.5), Normal Weight (BMI ≥ 18.5 and <25), Overweight (BMI ≥ 25 and <30), and Obesity (BMI ≥ 30)). The variable SPH was constructed using item 21 in the three questionnaires (“In the last 12 months, would you say your health status has been very good, good, fair, fair, bad, or very bad?”), with answers grouped into three levels, considering: Negative SPH (answers: bad or very bad), Fair SPH (answers: fair), and Positive SPH (answers: good or very good). The Depression Status was considered using item 25.20a (“Have you ever suffered from Depression?”, with possible answers: Yes, No, or NS/NC.); the Pain Degree variable with item 45 (“During the last four weeks, what pain degree have you experienced?”) with possible answers: None, Very mild, Mild, Moderate, Severe, Extreme, or NS/NC; responses were grouped into three levels: None/Very mild, Mild/Moderate, and Severe/Extreme.

2.4. Statistical Analysis

All these analyses were performed with the IBM SPSS Statistics v.25 statistical software, accepting a level of significance less than 0.05. A Kolmogorov–Smirnov normality study was performed to check data distribution. Non-parametric statistics were used, so variables were presented using the median and interquartile range (continuous variables: age and BMI) and absolute and relative frequencies (categorical variables: BMI Group, SPH, Depression Status, and Pain Degree). Non-parametric statistical tests were performed to analyse the dependence relationship between categorical variables (chi-square test) and possible intergroup differences: Mann–Whitney U test (continuous variables), and z-test for independent proportions using the Bonferroni correction (categorical variables). Probability risks and their confidence intervals of negative SPH, Depression, and Severe/Extreme Pain according to their BMI group were calculated, taking as a reference the Normal-weight group.

3. Results

Tables S1–S3 show the descriptive data and between-sex comparison, as well as the dependency relationships between sex and categorical variables (BMI group, SPH, Depression, and Pain Degree) in the three surveys.
First, the EESE2014 showed participants with a median age of 78 years (10) and BMI of 26.8 (5.4); 21.4% presented a Negative SPH, 18.7% had Depression, and 15.7% had Severe/Extreme Pain Degree. Associations were found between sex and SPH, Depression prevalence, and Pain Degree (p < 0.001). Women displayed a higher prevalence than men related to Negative SPH (24.0% vs. 17.6%, p < 0.05), Depression (24.8% vs. 9.9%, p < 0.05), and Severe/Extreme Pain (20.1% vs. 9.4%, p < 0.05) (Table S1). Second, similar results were found in the ENSE2017 participants, with participants showing a median age of 78 (10) and a BMI of 26.7 (5.2). The same dependency relationships were found between sex and the other variables (p < 0.001). Women presented a higher prevalence compared to men: Negative SPH (22.4% vs. 14.1%, p < 0.05), Depression (24.8% vs. 9.0%, p < 0.05), and Severe/Extreme Pain (20.9% vs. 8.6%, p < 0.05) (Table S2). Finally, the EESE2020 sample outcomes were similar (Table S3).

3.1. Self-Perceived Health

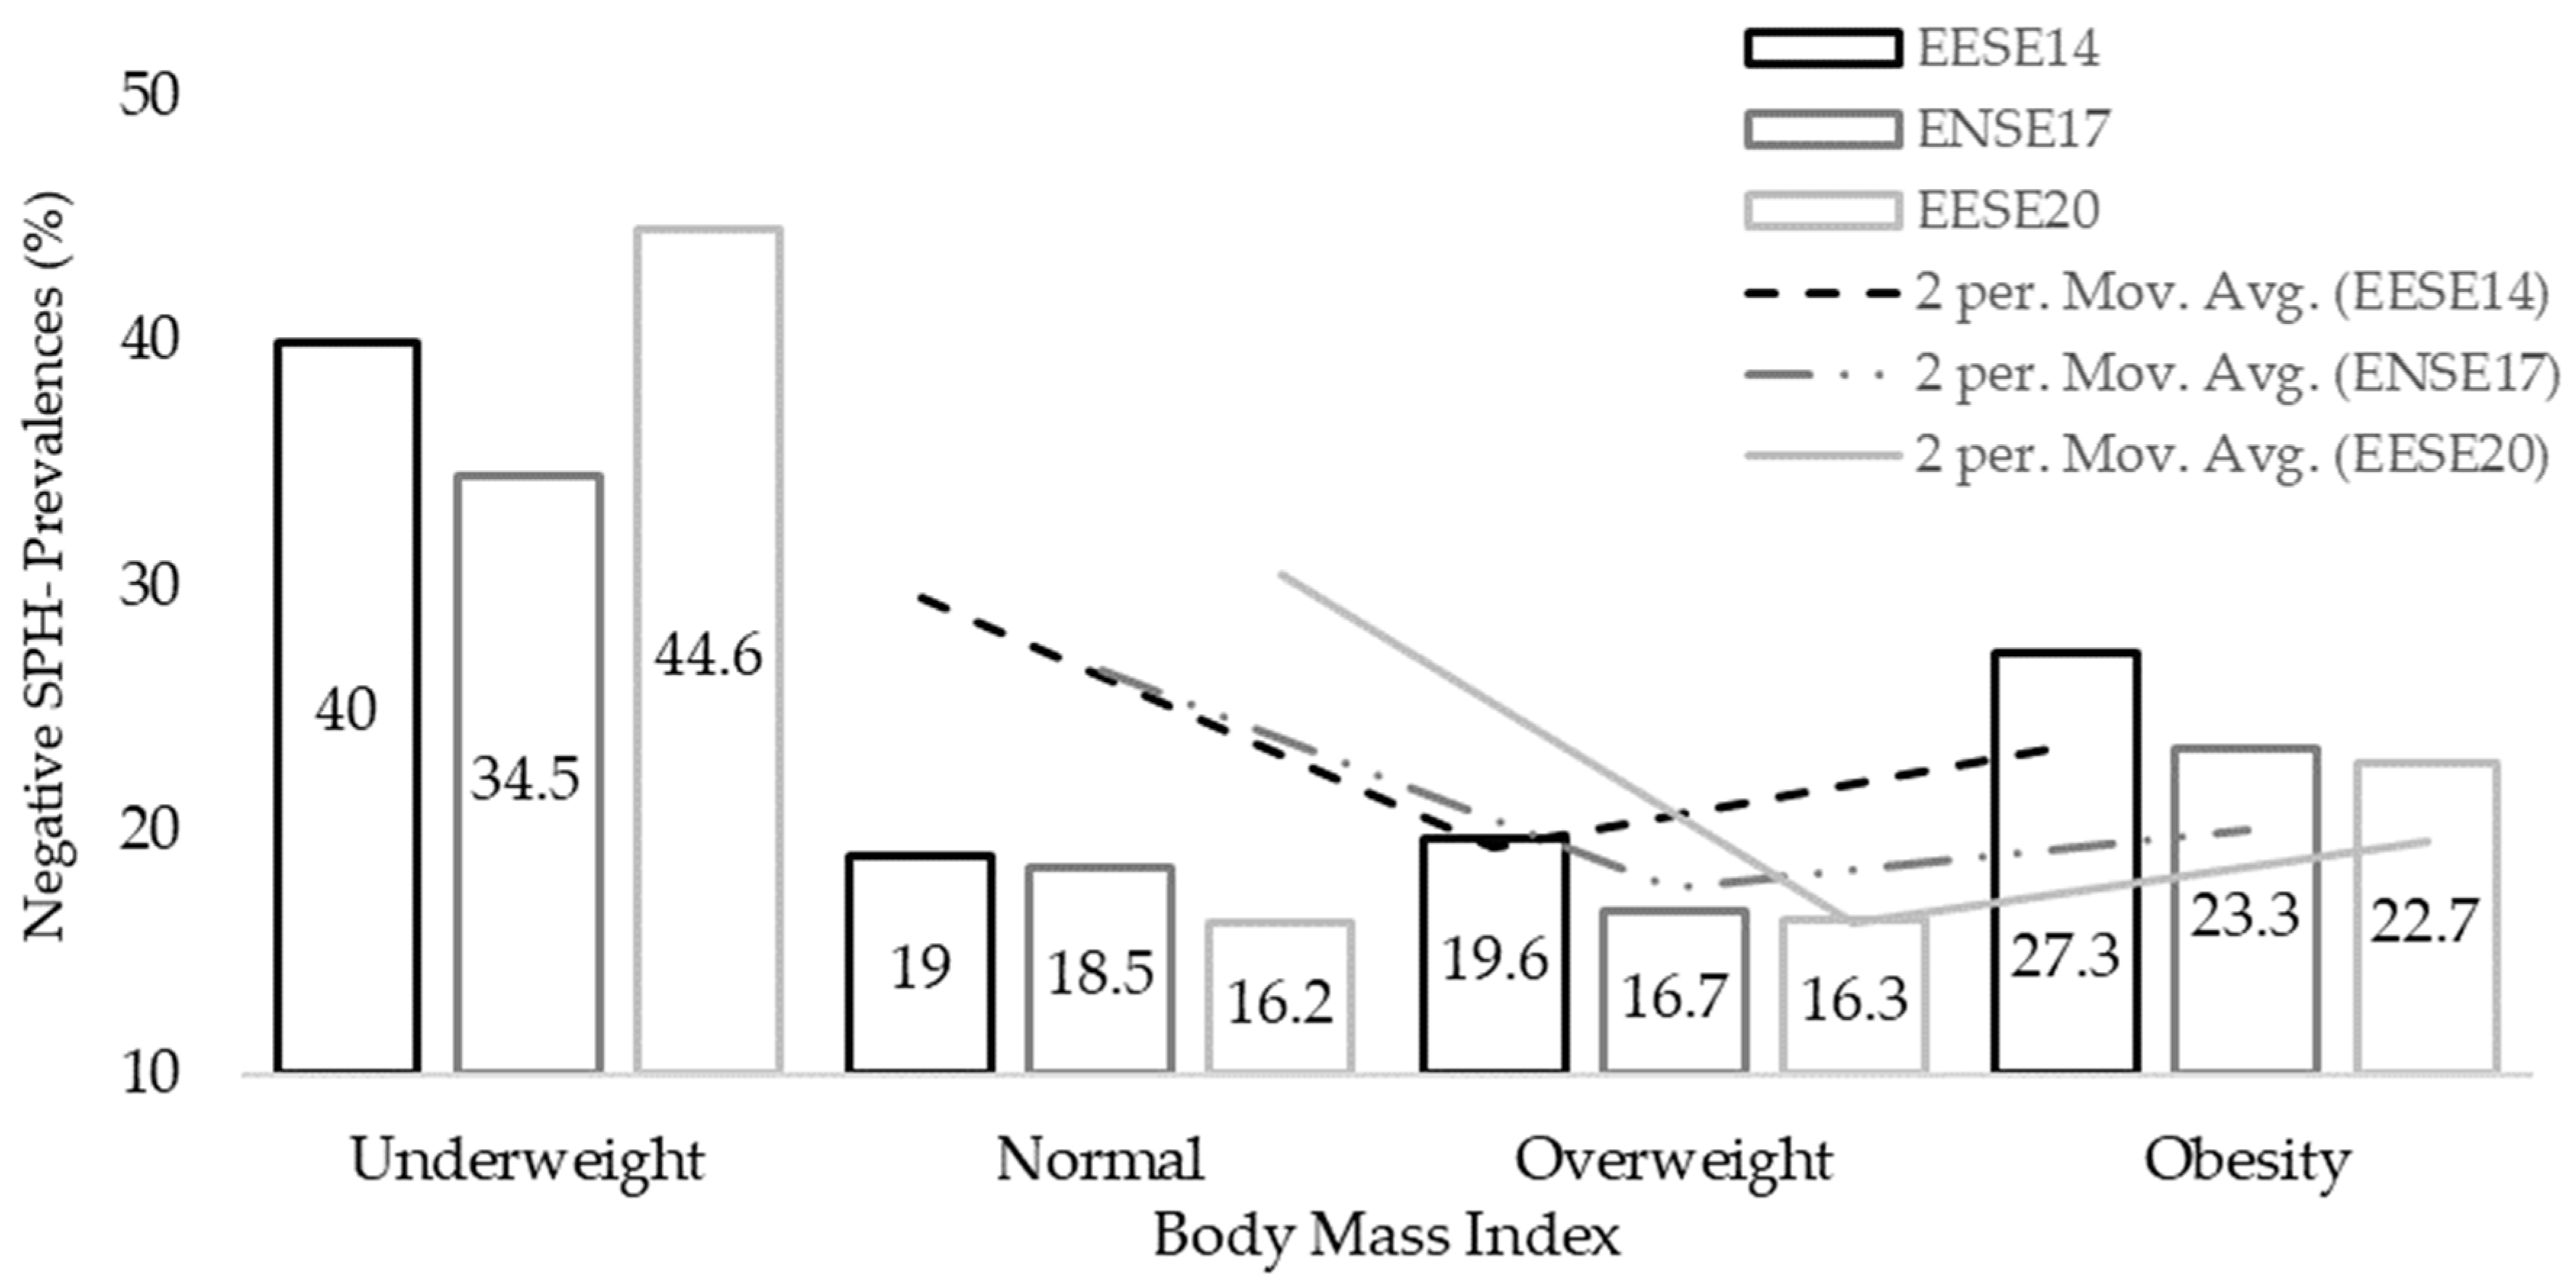
Figure 2 and Table S4 show the associations between BMI Group and SPH. In each of them, SPH was found to be related to the BMI Group (p < 0.001). In the three surveys, the highest Negative SPH prevalence was found in the Underweight group (40% EESE2014, 34.5% ENSE2017, and 44.6% EESE2020), with the lowest Negative SPH prevalence found in the Normal-weight groups (19.0%, 18.5%, and 16.2%) and Overweight (19.6%, 16.7%, and 16.3%) (Figure 2). In the three surveys, differences between the Negative SPH proportions in the Underweight and Normal-weight and overweight groups were observed (p < 0.05).
Figure 3 shows the Positive SPH prevalence in the BMI Group for the three surveys. Opposite to the Negative SPH data, it was lower in the Underweight than in Normal-weight and Overweight groups (p < 0.05) (Table S4).

3.2. Depression Status

The highest Depression prevalence was found in the Underweight group. Furthermore, a dependency relationship was observed between the Depression prevalence and the BMI group (EESE 2014 and EESE 2020, p < 0.001; ENSE 2017, p < 0.05). In all cases, the lowest prevalence was found in the Normal-weight and Overweight groups, with significant differences between proportions concerning Underweight and Obesity in some cases (p < 0.05) (Table S5). Figure 4 shows the Depression prevalence based on the BMI group.

3.3. Pain Degree

Dependence relationships were found between Pain Degree and the BMI Group (p < 0.001). Severe/Extreme Pain prevalence was greater in the Underweight and Obesity groups, both in the EESE2014-2020 and in the ENSE2017. Differences between proportions were found between the Normal-weight and Overweight groups (Table S6). Figure 5 shows the Severe/Extreme Pain prevalence regarding the BMI Group in the three surveys.
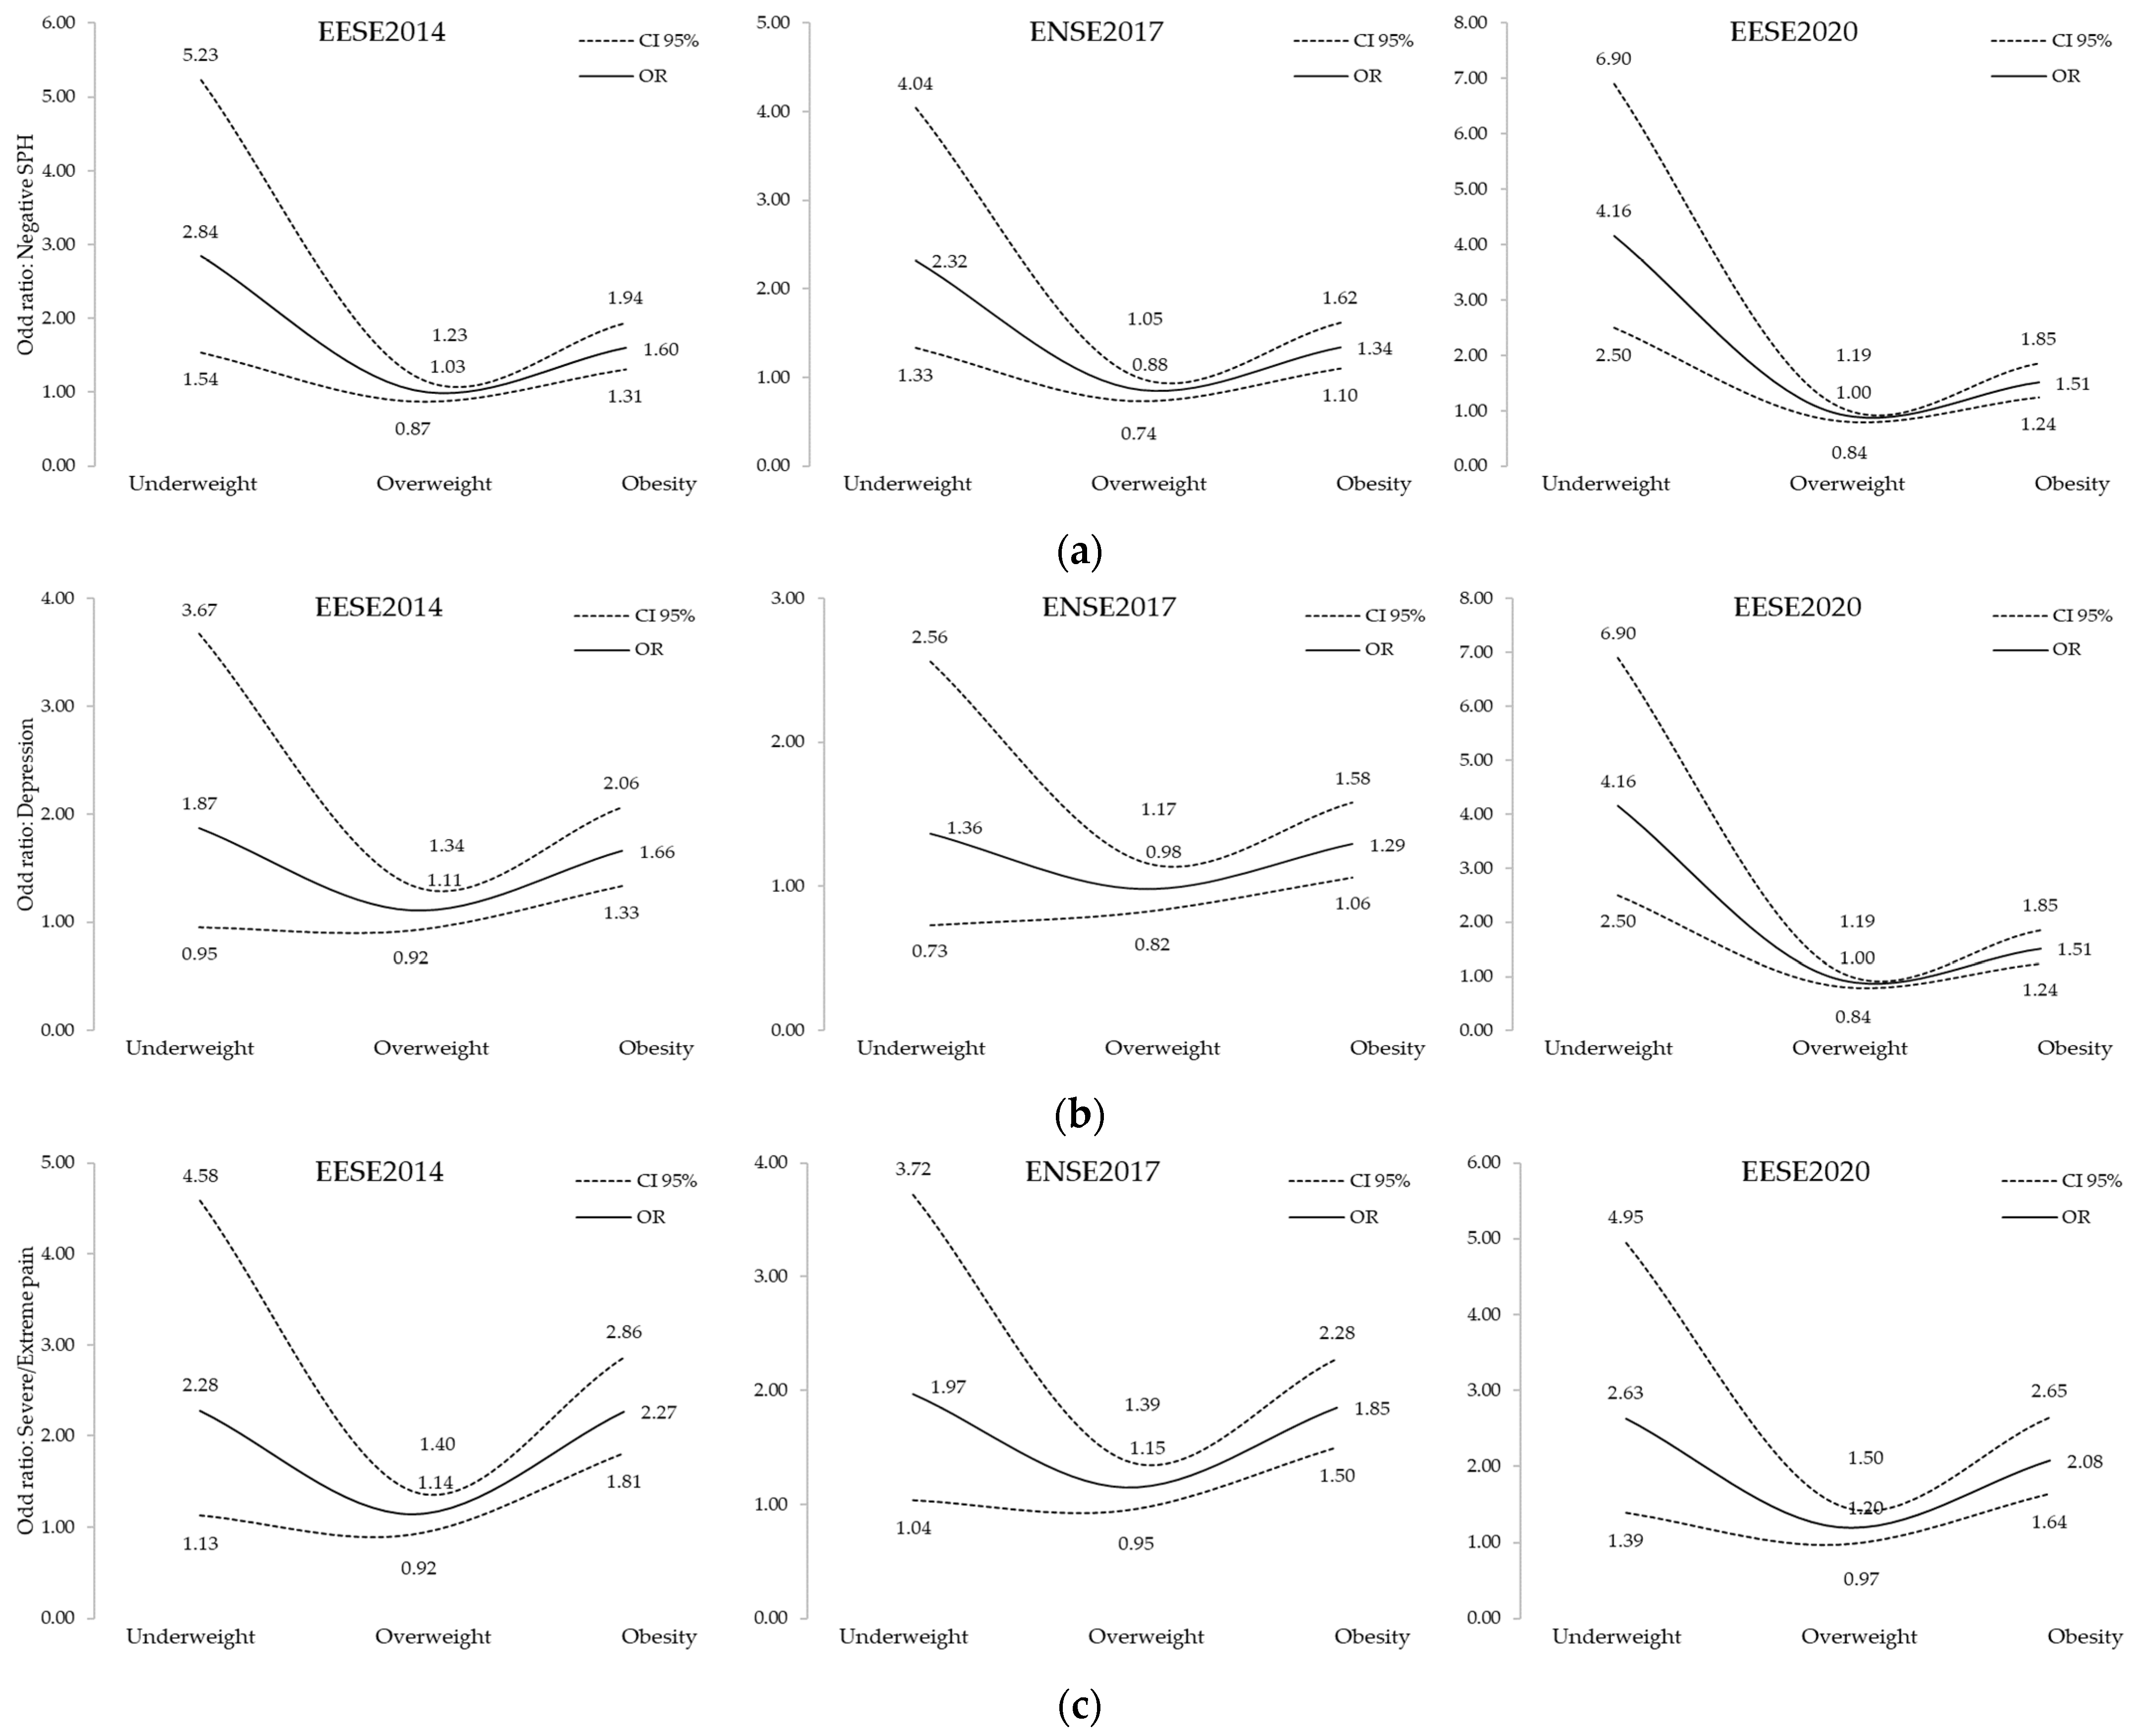
Figure 6a–c show the odds ratios for Negative SPH, Depression, and Severe or Extreme Pain in populations with a BMI different from the Normal-weight, which was used as a reference. High odds ratios of negative SPH were observed for people with Underweight compared to Normal-weight (Table S7).

4. Discussion

The main objective of this study was to analyse the associations between BMI and SPH, Depression Status, and Pain Degree in the Spanish population over 70 years. The initial hypotheses were that SPH, Depression, and Pain Degree would be associated with BMI in Spanish older people.
Specifically, older people with Normal Weight or Overweight would have a lower risk of Negative SPH, Depression, or High Pain Degree. Indeed, the findings of this study support that the highest Negative SPH prevalence was in the Underweight groups. In contrast, Normal Weight or Overweight groups were the least likely to report Negative SPH. Previous epidemiological studies have studied the association between BMI and mortality, having found U-shaped or J-shaped relationships [35,41,42,43]. In particular, in this U-shaped association, people with an Intermediate BMI tended to live more than people with a higher or lower BMI [42,44,45,46]. In recent years, the evidence appears to support that moderate obesity is associated with significantly lower all-cause mortality relative to having Normal-weight, whereas underweight people have been associated with increased all-cause mortality (strokes, heart diseases, malignant tumours, respiratory failures, others, or unknown) [37]. This phenomenon is known as the “obesity paradox” [42]. Although some studies have reported results that support this U-shaped relationship between BMI and mortality, it is still not well understood or controversial [41,42,43]. This debate about “The Obesity Paradox” can be due to the methodological limitations of the studies and to their heterogeneity (e.g., study population, confounding factors, control, and length of follow-up), which may contribute to a biased interpretation of this phenomenon or an incomplete understanding [34,36]. Among the various hypotheses that emerged, a lower BMI may be associated with lower nutritional status or weight loss due to clinical or sub-clinical disease [4,47]. In this sense, one of the most important age-related health problems is the loss of fat-free mass, i.e., sarcopenia, which causes functional impairment in older people and negative impacts on quality of life [36]. Sociodemographic and behavioural factors such as age, malnutrition, daily activities, underweight, and poor PA constitute risk factors for sarcopenia development [48]. Therefore, if underweight people also present sarcopenia, it could partially explain why a low BMI may be associated with a negative SPH found in the participants of this study. Furthermore, in this study, negative SPH risks were higher for the Underweight than for the Normal-weight participants. In this regard, authors argue that the health consequences of Underweight might be more severe in terms of mortality and quality of life, compared to Overweight [49,50,51]. Similarly, a study conducted on the Chinese population observed lower levels of Health-Related Quality of Life in the elderly with underweight compared to normal weight [52]. In contrast, the lowest Negative SPH prevalence was associated with people with Normal-weight and slightly increased BMI levels. In this study, obesity was associated with Negative SPH higher prevalence, again, with a higher risk in Normal-weight but less than in Underweight people. Similar results have been previously reported in Spanish and Brazilian populations, as the population with obesity or severe obesity (BMI > 35) has also shown worse quality of life and SPH compared to moderate obesity or normal weight [53,54]. Moreover, this inverse association between BIM and self-perceived health status was more pronounced in elderly people [54]. Although obesity is a well-recognised risk factor for impaired health-related quality of life, few studies have investigated the underlying mechanisms of this relationship [55]. A possible contributing factor is that in patients with obesity, there is also sarcopenia, so-called sarcopenic obesity [6]. In these cases, obesity might exacerbate sarcopenia, leading to increased disability, accelerated functional decline, frailty, morbidity, and mortality [6,36]. In summary, in this study, concerning SPH and age, an inverted J or U-shaped relationship is observed, with low and high BMI levels associated with a worse SPH, and a negative SPH with a higher risk in Underweight people.
A second objective was to test the associations between BMI, Depression Status, and Pain Degree in older Spanish adults. Similar results to those found between BMI and SPH were observed. The highest prevalence and risk of suffering from Depression and Severe/Extreme Pain occurred in Underweight people. Likewise, the lowest Depression and Severe Pain prevalence corresponded to the Normal-weight and Overweight groups. Moreover, Obesity presence again slightly increased the Depression or Severe/Extreme Pain risks compared to Normal-weight. In a previous study, a sample from 18 to 90 years old (N = 44,374 individuals) explored the association between BMI and Depression, showing results in the same line. Concretely, they showed a U-shaped association in which Obesity and Underweight were associated with higher Depression levels [56]. However, a previous longitudinal study observed that the risk of moving from a normal BMI to an underweight state increased by 62% among participants with depressive symptoms, so unhealthy weight loss could be a side-effect of depressive symptoms [57].
Concerning BMI and Pain Degree associations, another investigation [58] studied the chronic pain prevalence in older people aged 65+ with similar outcomes. The greatest chronic pain estimation was observed in Underweight individuals (24.6%), followed by Obese people (20.2%) and Overweight older adults (14.2%). Furthermore, several studies support that obesity is a risk factor for chronic pain. However, the current findings along with those reported in this study also support that Underweight people may exhibit the same risks as people with Obesity. In this context, some authors [59,60] suggest that pain associated with Underweight people tends to be generalised throughout the body and may also be linked with osteoporosis or other diseases. Based on our results and other authors’ statements, it seems that the relationship between BMI, Depression Status, and Pain Degree also presents a U-shaped relationship. Thus, health and educational professionals should consider these issues, so both people with Obesity and Underweight would be at risk of Depression and Pain [56,61]. Additionally, physical training professionals must include resistance training or multicomponent exercise interventions to optimise functional outcomes in older adults and adults with frailty [62,63,64].
Finally, physical inactivity, also a risk factor for sarcopenia, is, in general, more connected with Underweight and people with Obesity, which would contribute to this negative SPH, Depression Status, and Pain Degree [36,65]. In this respect, a growing body of work indicates that optimal PAL is significantly associated with a lower incidence of depressive and anxiety symptoms, reduced stress, and improved mood, which may translate into good SPH [66]; thus, PA or exercise may also be a therapeutic tool of choice to achieve optimal BMI in older people [65]. A tool to achieve an optimal BMI in older people is PA or exercise. Some authors suggest that in the elderly population, BMI recommendations should be higher (those categorised as Normal-weight and Overweight) [43]. Current evidence for the PA and exercise benefits in the prevention and treatment of many chronic diseases such as sarcopenia and Depression, among many others, is strong [67]. One of the priorities to improve body composition in this population would be increasing or preserving lean body mass levels and losing fat mass [36,65]. Several studies recommend that physical training professionals include resistance training or multicomponent exercise interventions to optimise functional outcomes in older adults and adults with frailty [65].
On the one hand, one of the strong points of this study is that it was carried out on a large sample of subjects, all of them over 70 years of age and residents of Spain. On the other hand, this study presents certain limitations. First, although BMI is a widely used screening measure used to assess body fat, several considerations must be made [68]. BMI neither differentiates between patients with sarcopenic obesity, low muscle mass, high fat mass, and normal healthy individuals with enough muscle mass and low fat mass nor identifies fat distribution [35,36,43]. Thus, it varies depending on sex, race, ethnicity, or age [68]. Several studies point out that changes in fat distribution with an increase in central fat and relative loss of fat-free mass may be relatively more important than the BMI in determining the health risk associated with obesity in older people [45]. Moreover, to better understand the associations between age, weight, SPH, Depression Status, and Pain Degree in older people, it is essential to deepen the knowledge of age-related changes in body composition and body fat distribution [69]. As a second limitation, and as with previous studies, the possibility of reverse causality cannot be ruled out. Furthermore, results concerning SPH, Depression status, Pain Degree, and BMI were obtained from self-reported data. In this regard, it is reported in the literature that older people (+65 years) tend to underestimate their weight and overestimate their height, thus underestimating their BMI values [70]. The authors, therefore, consider that the results should be interpreted with caution. Another limitation is not having adjusted the results for potential confounding factors, such as comorbidities presence, PAL, or the consumption of toxic habits. Future longitudinal and experimental studies are needed to explore possible explanations of the associations and the direction of causal relations between BMI, SPH, Depression, and Pain Degree. Additionally, on 17 March 2020, confinement was established in Spain, whereby a large part of the population had to remain confined to their homes, which may have affected the results analysed. From that moment on, the interviews changed from face-to-face to telephone interviews. Moreover, when clarifying the association with BMI, future research could include multivariate analysis. Finally, as the ENSE2017 did not include items referring to participants’ PA over 70 years of age, unknown variables could have affected the results, and that should be considered in future research.

5. Conclusions

Overweight was not linked with an increased risk of the conditions analysed compared to the Normal-weight groups in older people residents in Spain. The Underweight group presented the highest negative SPH prevalence, Depression, and Severe/Extreme Pain. Moreover, Obesity increased the negative SPH, Depression, and Pain Degree risks compared to the Normal-weight and Overweight groups in this population.

Supplementary Materials

The following supporting information can be downloaded at: https://www.mdpi.com/article/10.3390/app13010588/s1, Table S1: EESE 2014 descriptive analysis; Table S2: ENSE 2017 descriptive analysis; Table S3. EESE2020 descriptive analysis; Table S4. BMI and SPH in the Spanish older population; Table S5. BMI and Depression in the Spanish older population; Table S6. BMI and Pain Degree in the Spanish older population; Table S7. Risks of negative SPH, Depression and Severe/Extreme Pain according to the BMI in the Spanish older population.

Author Contributions

Conceptualization, Á.D.-Z., D.S.-G. and S.B.-F.; methodology, J.C.A. and D.C.-M.; formal analysis, Á.D.-Z. and J.C.-V.; writing—original draft preparation, Á.D.-Z., D.S.-G. and J.C.A.; writing—review and editing, D.C.-M. and P.R.O.; visualization, P.R.O. and J.C.-V. supervision, E.M.-N.; project administration, Á.D.-Z. and E.M.-N.; funding acquisition, S.B.-F. and J.C.-V. All authors have read and agreed to the published version of the manuscript.

Funding

The author Á.D.-Z. (FPU20/04201) was supported by a grant from the Spanish Ministry of Education, Culture and Sport, Grant FPU20/04201 funded by MCIN/AEI/10.13039/501100011033, and, as appropriate, by “European Social Fund Investing in your future” or by “European Union NextGenerationEU/PRTR”.

Institutional Review Board Statement

Not applicable.

Informed Consent Statement

Not applicable.

Data Availability Statement

Data are available under reasonable request to the corresponding author.

Conflicts of Interest

The authors declare no conflict of interest.

References

  1. United Nations. World Population Prospects The 2017 Revision Key Findings and Advance Tables; Department of Economic and Social Affairs Population Division, United Nations: New York, NY, USA, 2017. [Google Scholar]
  2. Campisi, J.; Kapahi, P.; Lithgow, G.J.; Melov, S.; Newman, J.C.; Verdin, E. From Discoveries in Ageing Research to Therapeutics for Healthy Ageing. Nature 2019, 571, 183–192. [Google Scholar] [CrossRef] [PubMed] [Green Version]
  3. Mijnarends, D.M.; Schols, J.M.G.A.; Meijers, J.M.M.; Tan, F.E.S.; Verlaan, S.; Luiking, Y.C.; Morley, J.E.; Halfens, R.J.G. Instruments to Assess Sarcopenia and Physical Frailty in Older People Living in a Community (Care) Setting: Similarities and Discrepancies. J. Am. Med. Dir. Assoc. 2015, 16, 301–308. [Google Scholar] [CrossRef] [PubMed]
  4. Prausmüller, S.; Heitzinger, G.; Pavo, N.; Spinka, G.; Goliasch, G.; Arfsten, H.; Gabler, C.; Strunk, G.; Hengstenberg, C.; Hülsmann, M.; et al. Malnutrition Outweighs the Effect of the Obesity Paradox. J. Cachexia Sarcopenia Muscle 2022, 13, 1477–1486. [Google Scholar] [CrossRef] [PubMed]
  5. Reijnierse, E.M.; Trappenburg, M.C.; Blauw, G.J.; Verlaan, S.; de van der Schueren, M.A.E.; Meskers, C.G.M.; Maier, A.B. Common Ground? The Concordance of Sarcopenia and Frailty Definitions. J. Am. Med. Dir. Assoc. 2016, 17, 371.e7–371.e12. [Google Scholar] [CrossRef] [PubMed]
  6. Batsis, J.A.; Villareal, D.T. Sarcopenic Obesity in Older Adults: Aetiology, Epidemiology and Treatment Strategies. Nat. Rev. Endocrinol. 2018, 14, 513–537. [Google Scholar] [CrossRef]
  7. Litchford, M.D. Counteracting the Trajectory of Frailty and Sarcopenia in Older Adults. Nutr. Clin. Pract. 2014, 29, 428–434. [Google Scholar] [CrossRef]
  8. Bray, G.A.; Kim, K.K.; Wilding, J.P.H.; World Obesity Federation. Obesity: A Chronic Relapsing Progressive Disease Process. A Position Statement of the World Obesity Federation. Obes. Rev. 2017, 18, 715–723. [Google Scholar] [CrossRef] [Green Version]
  9. Jaacks, L.M.; Vandevijvere, S.; Pan, A.; McGowan, C.J.; Wallace, C.; Imamura, F.; Mozaffarian, D.; Swinburn, B.; Ezzati, M. The Obesity Transition: Stages of the Global Epidemic. Lancet Diabetes Endocrinol. 2019, 7, 231–240. [Google Scholar] [CrossRef]
  10. Palacios-Ceña, D.; Alonso-Blanco, C.; Jiménez-Garcia, R.; Hernández-Barrera, V.; Carrasco-Garrido, P.; Pileño-Martinez, E.; Fernández-de-Las-Peñas, C. Time Trends in Leisure Time Physical Activity and Physical Fitness in Elderly People: 20 Year Follow-up of the Spanish Population National Health Survey (1987–2006). BMC Public Health 2011, 11, 799. [Google Scholar] [CrossRef] [Green Version]
  11. Hales, C.M.; Carroll, M.D.; Fryar, C.D.; Ogden, C.L. Prevalence of Obesity Among Adults and Youth: United States, 2015–2016. NCHS Data Brief. 2017, 288, 1–8. [Google Scholar]
  12. Payne, M.E.; Porter Starr, K.N.; Orenduff, M.; Mulder, H.S.; McDonald, S.R.; Spira, A.P.; Pieper, C.F.; Bales, C.W. Quality of Life and Mental Health in Older Adults with Obesity and Frailty: Associations with a Weight Loss Intervention. J. Nutr. Health Aging 2018, 22, 1259–1265. [Google Scholar] [CrossRef] [PubMed]
  13. Blüher, M. Obesity: Global Epidemiology and Pathogenesis. Nat. Rev. Endocrinol. 2019, 15, 288–298. [Google Scholar] [CrossRef] [PubMed]
  14. Adult Obesity Complications: Challenges and Clinical Impact—PMC. 2020. Available online: https://www.ncbi.nlm.nih.gov/pmc/articles/PMC7309384/ (accessed on 8 November 2022).
  15. Machón, M.; Vergara, I.; Dorronsoro, M.; Vrotsou, K.; Larrañaga, I. Self-Perceived Health in Functionally Independent Older People: Associated Factors. BMC Geriatr. 2016, 16, 66. [Google Scholar] [CrossRef] [PubMed] [Green Version]
  16. Pereira-de-Sousa, A.M.; López-Rodríguez, J.A. Salud autopercibida en ancianos jóvenes españoles y portugueses tras la recesión según la Encuesta Europea de Salud: Un estudio transversal. Aten. Primaria 2021, 53, 102064. [Google Scholar] [CrossRef] [PubMed]
  17. Dostálová, R.; Stillman, C.; Erickson, K.I.; Slepička, P.; Mudrák, J. The Relationship between Physical Activity, Self-Perceived Health, and Cognitive Function in Older Adults. Brain Sci. 2021, 11, 492. [Google Scholar] [CrossRef] [PubMed]
  18. Lera-López, F.; Garrues Irisarri, M.A.; Ollo-López, A.; Iriso, E.S.; Cabasés Hita, J.M.; Sánchez Santos, J.M. Actividad Física y Salud Autopercibida En Personas Mayores de 50 Años/Physical Activity and Self-Perceived Health among People Aged 50 and Over. Rev. Int. Med. Cienc. Act. Física Deporte 2017, 67, 559–571. [Google Scholar] [CrossRef]
  19. Casey, D.A. Depression in the Elderly: A Review and Update. Asia-Pac. Psychiatry 2012, 4, 160–167. [Google Scholar] [CrossRef]
  20. Blazer, D.G. Depression in Late Life: Review and Commentary. J. Gerontol. A. Biol. Sci. Med. Sci. 2003, 58, 249–265. [Google Scholar] [CrossRef] [Green Version]
  21. Simon, G.E.; Rohde, P.; Ludman, E.J.; Jeffery, R.W.; Linde, J.A.; Operskalski, B.H.; Arterburn, D. Association between Change in Depression and Change in Weight Among Women Enrolled in Weight Loss Treatment. Gen. Hosp. Psychiatry 2010, 32, 583–589. [Google Scholar] [CrossRef] [Green Version]
  22. Legenbauer, T.; De Zwaan, M.; Benecke, A.; Muhlhans, B.; Petrak, F.; Herpertz, S. Depression and Anxiety: Their Predictive Function for Weight Loss in Obese Individuals. Obes. Facts 2009, 2, 227–234. [Google Scholar] [CrossRef] [Green Version]
  23. Faulconbridge, L.F.; Wadden, T.A.; Berkowitz, R.I.; Sarwer, D.B.; Womble, L.G.; Hesson, L.A.; Stunkard, A.J.; Fabricatore, A.N. Changes in Symptoms of Depression with Weight Loss: Results of a Randomized Trial. Obes. Silver Spring Md. 2009, 17, 1009–1016. [Google Scholar] [CrossRef]
  24. Mazzeschi, C.; Pazzagli, C.; Buratta, L.; Reboldi, G.P.; Battistini, D.; Piana, N.; Pippi, R.; Fatone, C.; De Feo, P. Mutual Interactions between Depression/Quality of Life and Adherence to a Multidisciplinary Lifestyle Intervention in Obesity. J. Clin. Endocrinol. Metab. 2012, 97, E2261–E2265. [Google Scholar] [CrossRef] [Green Version]
  25. Lowry, K.A.; Vallejo, A.N.; Studenski, S.A. Successful Aging as a Continuum of Functional Independence: Lessons from Physical Disability Models of Aging. Aging Dis. 2012, 3, 5–15. [Google Scholar] [PubMed]
  26. Schofield, P.; Gibson, S. Fact Sheets, Pain in Older Adults; IASP: Washington, DC, USA, 2019. [Google Scholar]
  27. Wei, L.; Hu, Y.; Tao, Y.; Hu, R.; Zhang, L. The Effects of Physical Exercise on the Quality of Life of Healthy Older Adults in China: A Systematic Review. Front. Psychol. 2022, 13, 895373. [Google Scholar] [CrossRef] [PubMed]
  28. Atad, O.I.; Caspi, D. Exercise and Perceived Quality of Life among Frail Older Adults. Qual. Ageing Older Adults 2020, 21, 29–38. [Google Scholar] [CrossRef]
  29. Yen, H.-Y.; Lin, L.-J. Quality of Life in Older Adults: Benefits from the Productive Engagement in Physical Activity. J. Exerc. Sci. Fit. 2018, 16, 49–54. [Google Scholar] [CrossRef] [PubMed]
  30. Geneen, L.J.; Moore, R.A.; Clarke, C.; Martin, D.; Colvin, L.A.; Smith, B.H. Physical Activity and Exercise for Chronic Pain in Adults: An Overview of Cochrane Reviews. In Cochrane Database of Systematic Reviews; The Cochrane Collaboration, Ed.; John Wiley & Sons, Ltd.: Chichester, UK, 2017; p. CD011279.pub2. [Google Scholar]
  31. Melissas, J.; Kontakis, G.; Volakakis, E.; Tsepetis, T.; Alegakis, A.; Hadjipavlou, A. The Effect of Surgical Weight Reduction on Functional Status in Morbidly Obese Patients with Low Back Pain. Obes. Surg. 2005, 15, 378–381. [Google Scholar] [CrossRef]
  32. Bliddal, H.; Leeds, A.R.; Christensen, R. Osteoarthritis, Obesity and Weight Loss: Evidence, Hypotheses and Horizons—A Scoping Review. Obes. Rev. Off. J. Int. Assoc. Study Obes. 2014, 15, 578–586. [Google Scholar] [CrossRef] [PubMed] [Green Version]
  33. George, S.Z.; Dover, G.C.; Fillingim, R.B. Fear of Pain Influences Outcomes after Exercise-Induced Delayed Onset Muscle Soreness at the Shoulder. Clin. J. Pain 2007, 23, 76–84. [Google Scholar] [CrossRef]
  34. Donini, L.M.; Pinto, A.; Giusti, A.M.; Lenzi, A.; Poggiogalle, E. Obesity or BMI Paradox? Beneath the Tip of the Iceberg. Front. Nutr. 2020, 7, 53. [Google Scholar] [CrossRef]
  35. Lv, Y.-B.; Liu, S.; Yin, Z.-X.; Gao, X.; Kraus, V.B.; Mao, C.; Yuan, J.-Q.; Zhang, J.; Luo, J.-S.; Chen, H.-S.; et al. Associations of Body Mass Index and Waist Circumference with 3-Year All-Cause Mortality Among the Oldest Old: Evidence from a Chinese Community-Based Prospective Cohort Study. J. Am. Med. Dir. Assoc. 2018, 19, 672–678. [Google Scholar] [CrossRef] [PubMed]
  36. Bosello, O.; Vanzo, A. Obesity Paradox and Aging. Eat. Weight. Disord. EWD 2021, 26, 27–35. [Google Scholar] [CrossRef] [PubMed]
  37. Hu, F.; Cheng, J.; Yu, Y.; Wang, T.; Zhou, W.; Yu, C.; Zhu, L.; Bao, H.; Cheng, X. Association Between Body Mass Index and All-Cause Mortality in a Prospective Cohort of Southern Chinese Adults Without Morbid Obesity. Front. Physiol. 2022, 13, 857787. [Google Scholar] [CrossRef] [PubMed]
  38. Ministerio de Sanidad, Consumo y Bienestar Social Encuesta Europea de Salud En España 2014. 2014. Available online: https://www.sanidad.gob.es/estadEstudios/estadisticas/EncuestaEuropea/Enc_Eur_Salud_en_Esp_2014.htm (accessed on 8 November 2022).
  39. Ministerio de Sanidad, Consumo y Bienestar Social Encuesta Europea de Salud En España 2020. 2020. Available online: https://www.sanidad.gob.es/estadEstudios/estadisticas/EncuestaEuropea/Enc_Eur_Salud_en_Esp_2020.htm (accessed on 8 November 2022).
  40. Ministerio de Sanidad, Consumo y Bienestar Social Encuesta Nacional de Salud de España 2017. 2017. Available online: https://www.sanidad.gob.es/estadEstudios/estadisticas/encuestaNacional/encuesta2017.htm (accessed on 8 November 2022).
  41. Zhang, J.; Begley, A.; Jackson, R.; Harrison, M.; Pellicori, P.; Clark, A.L.; Cleland, J.G.F. Body Mass Index and All-Cause Mortality in Heart Failure Patients with Normal and Reduced Ventricular Ejection Fraction: A Dose-Response Meta-Analysis. Clin. Res. Cardiol. 2019, 108, 119–132. [Google Scholar] [CrossRef] [Green Version]
  42. Rozen, G.; Elbaz-Greener, G.; Margolis, G.; Marai, I.; Heist, E.K.; Ruskin, J.N.; Carasso, S.; Roguin, A.; Birati, E.Y.; Amir, O. The Obesity Paradox in Real-World Nation-Wide Cohort of Patients Admitted for a Stroke in the U.S. J. Clin. Med. 2022, 11, 1678. [Google Scholar] [CrossRef]
  43. Lv, Y.; Mao, C.; Gao, X.; Ji, J.S.; Kraus, V.B.; Yin, Z.; Yuan, J.; Chen, H.; Luo, J.; Zhou, J.; et al. The Obesity Paradox Is Mostly Driven by Decreased Noncardiovascular Disease Mortality in the Oldest Old in China: A 20-Year Prospective Cohort Study. Nat. Aging 2022, 2, 389–396. [Google Scholar] [CrossRef]
  44. Kim, P.-J.; Kim, C.; Lee, S.-H.; Shon, J.-H.; Kwon, Y.; Kim, J.-H.; Kim, D.-K.; Yu, H.; Ahn, H.-J.; Jeon, J.-P.; et al. Another Look at Obesity Paradox in Acute Ischemic Stroke: Association Rule Mining. J. Pers. Med. 2021, 12, 16. [Google Scholar] [CrossRef]
  45. Wang, L.; Yi, Z. Obesity Paradox and Aging: Visceral Adiposity Index and All-Cause Mortality in Older Individuals: A Prospective Cohort Study. Front. Endocrinol. 2022, 13, 975209. [Google Scholar] [CrossRef]
  46. Feng, X.; Zhang, C.; Jiang, L.; Xu, L.; Tian, J.; Zhao, X.; Wang, D.; Zhang, Y.; Sun, K.; Xu, B.; et al. Body Mass Index and Mortality in Patients with Severe Coronary Artery Diseases: A Cohort Study from China. Nutr. Metab. Cardiovasc. Dis. NMCD 2021, 31, 448–454. [Google Scholar] [CrossRef]
  47. Kvamme, J.-M.; Olsen, J.A.; Florholmen, J.; Jacobsen, B.K. Risk of Malnutrition and Health-Related Quality of Life in Community-Living Elderly Men and Women: The Tromsø Study. Qual. Life Res. Int. J. Qual. Life Asp. Treat. Care Rehabil. 2011, 20, 575–582. [Google Scholar] [CrossRef] [Green Version]
  48. Gao, Q.; Hu, K.; Yan, C.; Zhao, B.; Mei, F.; Chen, F.; Zhao, L.; Shang, Y.; Ma, Y.; Ma, B. Associated Factors of Sarcopenia in Community-Dwelling Older Adults: A Systematic Review and Meta-Analysis. Nutrients 2021, 13, 4291. [Google Scholar] [CrossRef] [PubMed]
  49. Bucholz, E.M.; Krumholz, H.A.; Krumholz, H.M. Underweight, Markers of Cachexia, and Mortality in Acute Myocardial Infarction: A Prospective Cohort Study of Elderly Medicare Beneficiaries. PLoS Med. 2016, 13, e1001998. [Google Scholar] [CrossRef] [PubMed]
  50. Warkentin, L.M.; Das, D.; Majumdar, S.R.; Johnson, J.A.; Padwal, R.S. The Effect of Weight Loss on Health-Related Quality of Life: Systematic Review and Meta-Analysis of Randomized Trials. Obes. Rev. Off. J. Int. Assoc. Study Obes. 2014, 15, 169–182. [Google Scholar] [CrossRef] [PubMed]
  51. Pan, A.; Kawachi, I.; Luo, N.; Manson, J.E.; Willett, W.C.; Hu, F.B.; Okereke, O.I. Changes in Body Weight and Health-Related Quality of Life: 2 Cohorts of US Women. Am. J. Epidemiol. 2014, 180, 254–262. [Google Scholar] [CrossRef] [Green Version]
  52. You, H.; Li, X.; Jing, K.; Li, Z.; Cao, H.; Wang, J.; Bai, L.; Gu, J.; Fan, X.; Gu, H. Association between Body Mass Index and Health-Related Quality of Life among Chinese Elderly—Evidence from a Community-Based Study. BMC Public Health 2018, 18, 1174. [Google Scholar] [CrossRef] [PubMed]
  53. Busutil, R.; Espallardo, O.; Torres, A.; Martínez-Galdeano, L.; Zozaya, N.; Hidalgo-Vega, Á. The Impact of Obesity on Health-Related Quality of Life in Spain. Health Qual. Life Outcomes 2017, 15, 197. [Google Scholar] [CrossRef]
  54. Oliva-Moreno, J.; Gil-Lacruz, A. Body Weight and Health-Related Quality of Life in Catalonia, Spain. Eur. J. Health Econ. HEPAC Health Econ. Prev. Care 2013, 14, 95–105. [Google Scholar] [CrossRef]
  55. Park, S. Pathways Linking Obesity to Health-Related Quality of Life. Qual. Life Res. Int. J. Qual. Life Asp. Treat. Care Rehabil. 2017, 26, 2209–2218. [Google Scholar] [CrossRef]
  56. de Wit, L.M.; van Straten, A.; van Herten, M.; Penninx, B.W.; Cuijpers, P. Depression and Body Mass Index, a u-Shaped Association. BMC Public Health 2009, 9, 14. [Google Scholar] [CrossRef] [Green Version]
  57. Pei, H.; Kang, N.; Guo, C.; Zhang, Y.; Chu, H.; Chen, G.; Zhang, L. Longitudinal Transition of Body Mass Index Status and Its Associated Factors among Chinese Middle-Aged and Older Adults in Markov Model. Front. Public Health 2022, 10, 973191. [Google Scholar] [CrossRef]
  58. Chen, C.; Winterstein, A.G.; Fillingim, R.B.; Wei, Y.-J. Body Weight, Frailty, and Chronic Pain in Older Adults: A Cross-Sectional Study. BMC Geriatr. 2019, 19, 143. [Google Scholar] [CrossRef] [PubMed]
  59. Wright, N.C.; Looker, A.C.; Saag, K.G.; Curtis, J.R.; Delzell, E.S.; Randall, S.; Dawson-Hughes, B. The Recent Prevalence of Osteoporosis and Low Bone Mass in the United States Based on Bone Mineral Density at the Femoral Neck or Lumbar Spine. J. Bone Miner. Res. 2014, 29, 2520–2526. [Google Scholar] [CrossRef] [PubMed] [Green Version]
  60. White, M.C.; Holman, D.M.; Boehm, J.E.; Peipins, L.A.; Grossman, M.; Henley, S.J. Age and Cancer Risk: A Potentially Modifiable Relationship. Am. J. Prev. Med. 2014, 46, S7–S15. [Google Scholar] [CrossRef] [Green Version]
  61. Chin, S.-H.; Huang, W.-L.; Akter, S.; Binks, M. Obesity and Pain: A Systematic Review. Int. J. Obes. 2020, 44, 969–979. [Google Scholar] [CrossRef] [PubMed]
  62. Lemos, E.C.W.M.; Guadagnin, E.C.; Mota, C.B. Influence of Strength Training and Multicomponent Training on the Functionality of Older Adults: Systematic Review and Meta-Analysis. Rev. Bras. Cineantropometria Desempenho Hum. 2020, 22, e60707. [Google Scholar] [CrossRef] [Green Version]
  63. Labata-Lezaun, N.; González-Rueda, V.; Llurda-Almuzara, L.; López-de-Celis, C.; Rodríguez-Sanz, J.; Bosch, J.; Vicente-Rodríguez, G.; Gorczakowska, D.; Araluze-Arizti, P.; Pérez-Bellmunt, A. Effectiveness of Multicomponent Training on Physical Performance in Older Adults: A Systematic Review and Meta-Analysis. Arch. Gerontol. Geriatr. 2023, 104, 104838. [Google Scholar] [CrossRef]
  64. Moreira, N.B.; Rodacki, A.L.F.; Costa, S.N.; Pitta, A.; Bento, P.C.B. Perceptive–Cognitive and Physical Function in Prefrail Older Adults: Exergaming Versus Traditional Multicomponent Training. Rejuvenation Res. 2021, 24, 28–36. [Google Scholar] [CrossRef]
  65. Izquierdo, M.; Merchant, R.A.; Morley, J.E.; Anker, S.D.; Aprahamian, I.; Arai, H.; Aubertin-Leheudre, M.; Bernabei, R.; Cadore, E.L.; Cesari, M.; et al. International Exercise Recommendations in Older Adults (ICFSR): Expert Consensus Guidelines. J. Nutr. Health Aging 2021, 25, 824–853. [Google Scholar] [CrossRef]
  66. Cho, J.; Jin, Y.; Kang, H. Weight Status, Physical Activity, and Depression in Korean Older Adults. J. Epidemiol. 2018, 28, 292–299. [Google Scholar] [CrossRef] [Green Version]
  67. Pedersen, B.K.; Saltin, B. Exercise as Medicine—Evidence for Prescribing Exercise as Therapy in 26 Different Chronic Diseases. Scand. J. Med. Sci. Sports 2015, 25, 1–72. [Google Scholar] [CrossRef] [Green Version]
  68. Buss, J. Limitations of Body Mass Index to Assess Body Fat. Work. Health Saf. 2014, 62, 264. [Google Scholar] [CrossRef] [PubMed]
  69. Ponti, F.; Santoro, A.; Mercatelli, D.; Gasperini, C.; Conte, M.; Martucci, M.; Sangiorgi, L.; Franceschi, C.; Bazzocchi, A. Aging and Imaging Assessment of Body Composition: From Fat to Facts. Front. Endocrinol. 2020, 10, 861. [Google Scholar] [CrossRef] [PubMed] [Green Version]
  70. Krul, A.J.; Daanen, H.A.M.; Choi, H. Self-Reported and Measured Weight, Height and Body Mass Index (BMI) in Italy, the Netherlands and North America. Eur. J. Public Health 2011, 21, 414–419. [Google Scholar] [CrossRef] [PubMed]
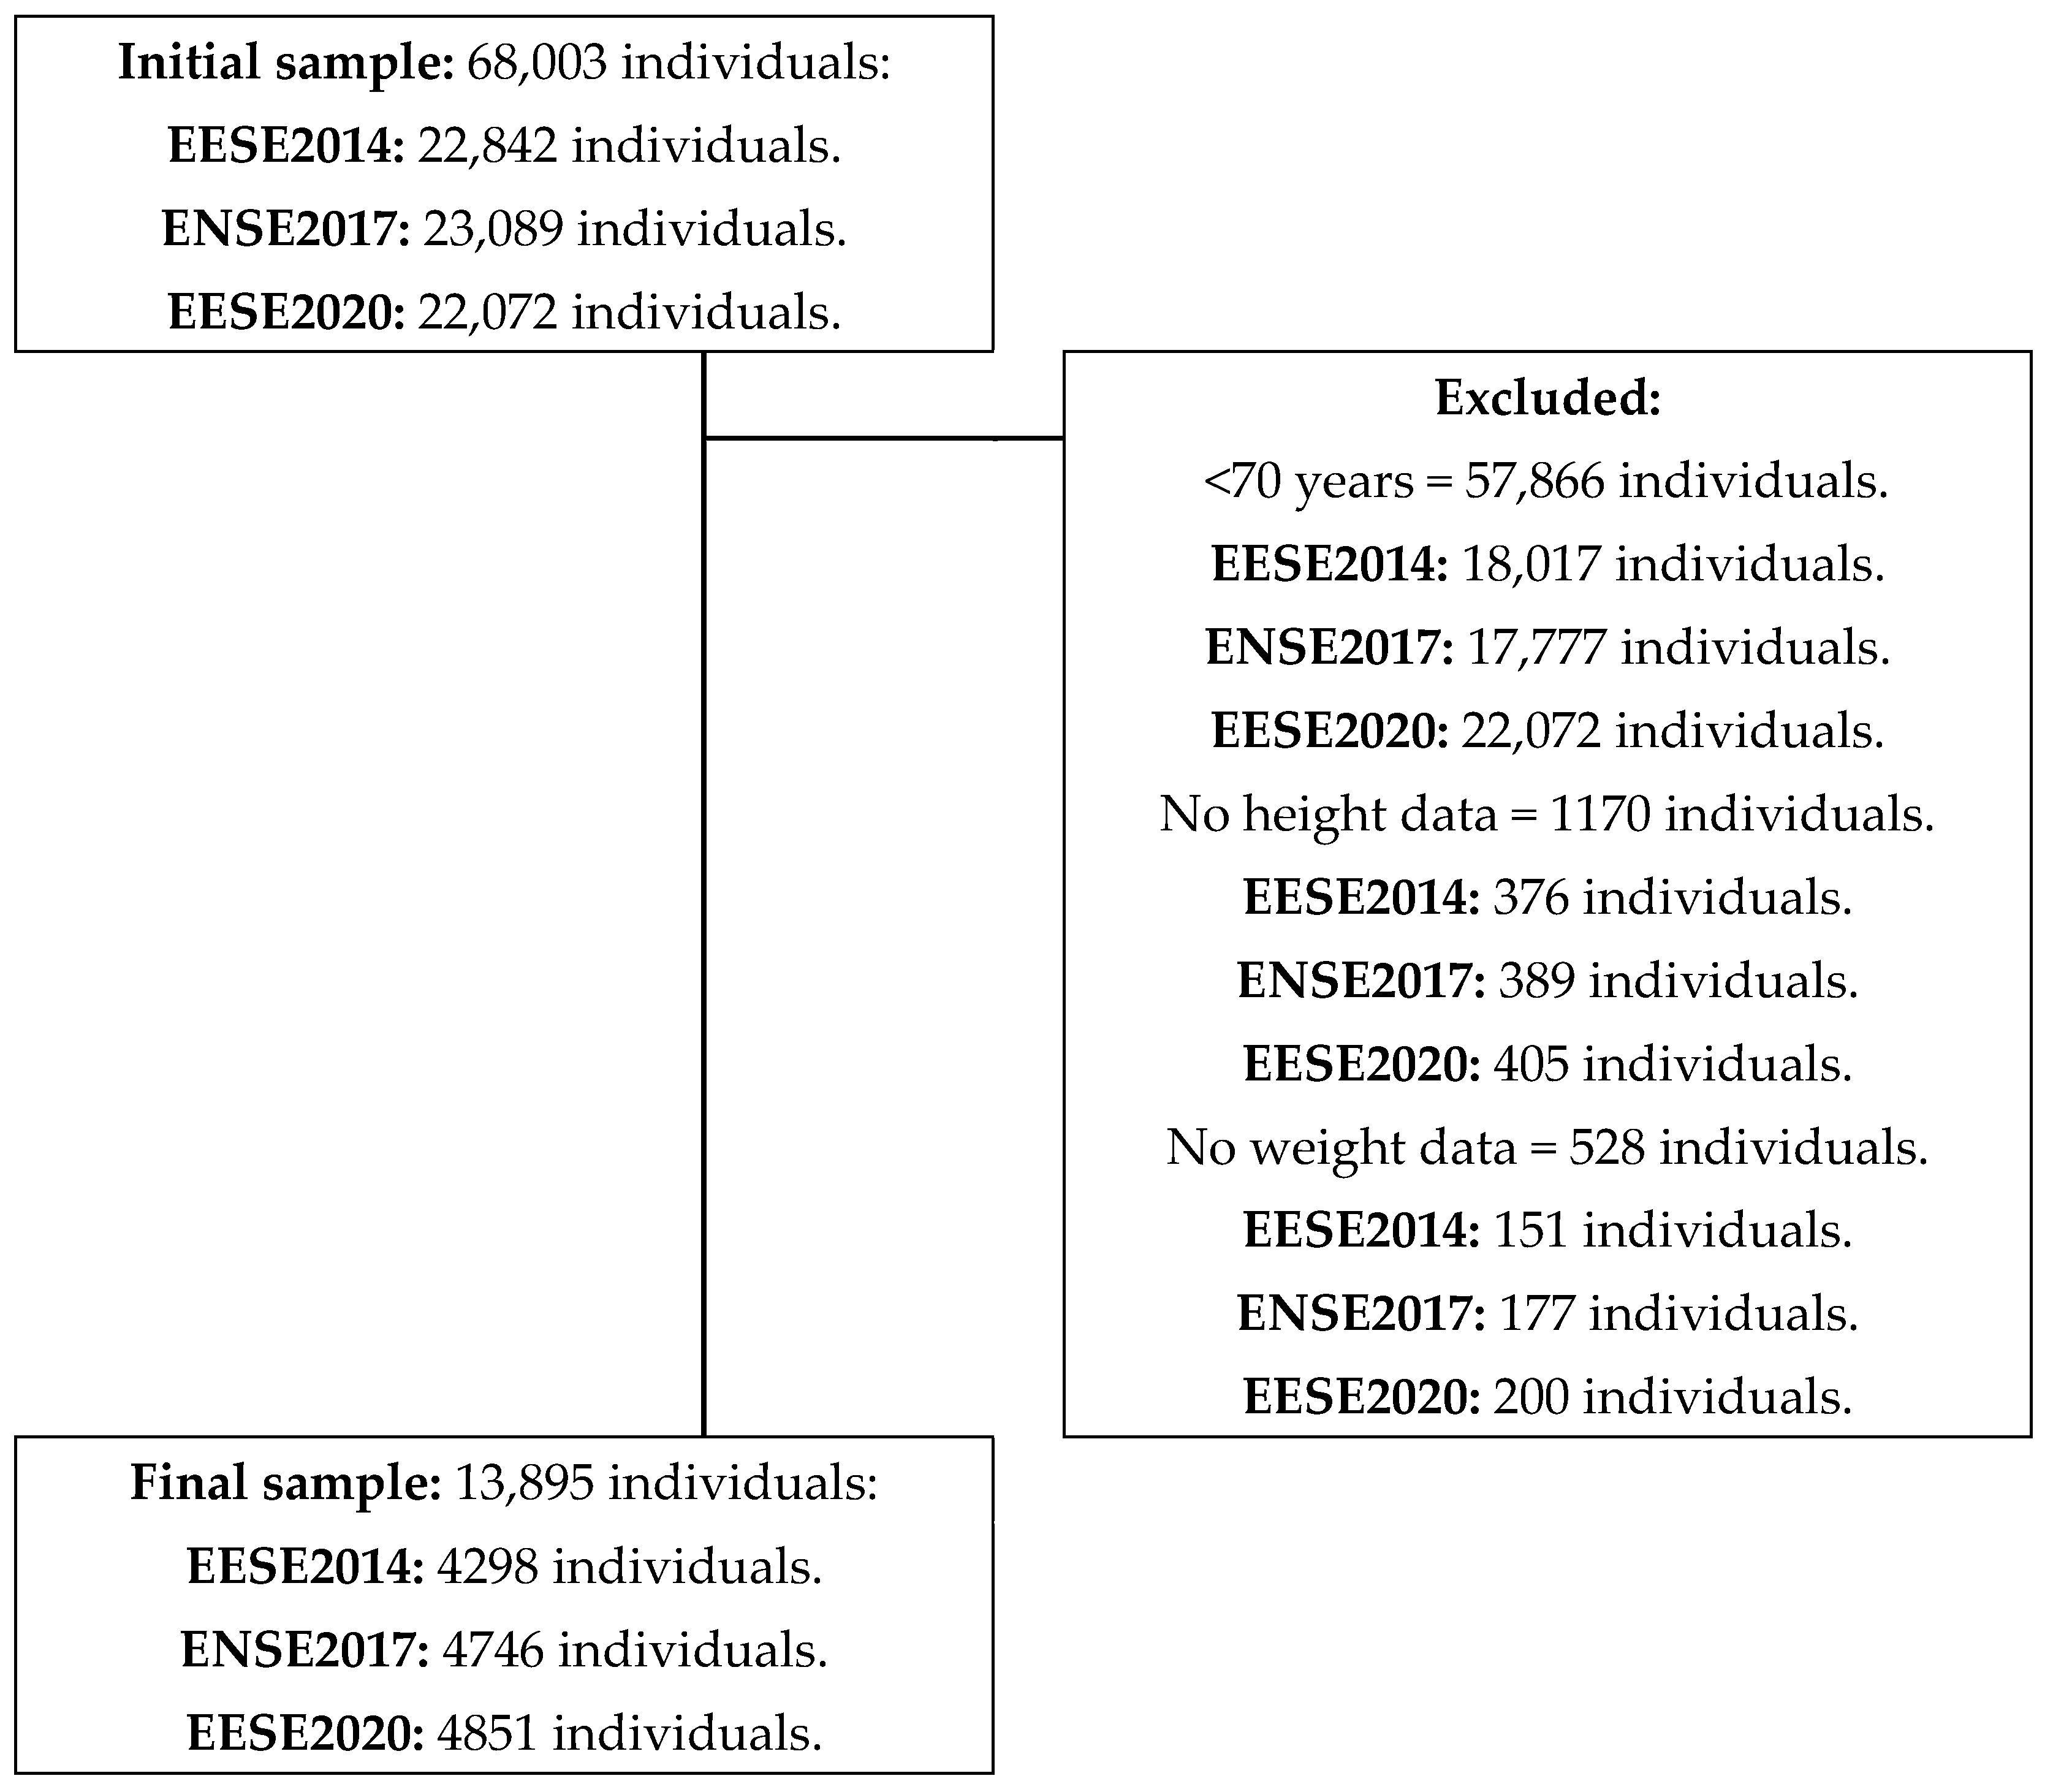
Figure 1. Flowchart outlining the study sample’s eligibility criteria.
Applsci 13 00588 g001
Figure 2. Negative Self-Perceived Health (SPH) prevalence according to the Body Mass Index (BMI) in the Spanish population in the three surveys EESE2014, ENSE2017, and EESE2020.
Applsci 13 00588 g002
Figure 3. Positive Self-Perceived Health (SPH) prevalence according to the Body Mass Index (BMI) in the Spanish population in the three surveys EESE2014, ENSE2017, and EESE2020.
Applsci 13 00588 g003
Figure 4. Depression prevalence according to the Body Mass Index Group in the Spanish population in the three surveys EESE2014, ENSE2017, and EESE2020.
Applsci 13 00588 g004
Figure 5. Severe/Extreme Pain Degree according to the Body Mass Index in the Spanish population in the three surveys EESE2014, ENSE2017, and EESE2020.
Applsci 13 00588 g005
Figure 6. (a) Odds ratio for Negative Self-Perceived Health; (b) Odds ratio for Depression; (c) Severe/Extreme Pain Degree according to the Body Mass Index in the Spanish population in the three surveys EESE2014, ENSE2017, and EESE2020.
Applsci 13 00588 g006
Disclaimer/Publisher’s Note: The statements, opinions and data contained in all publications are solely those of the individual author(s) and contributor(s) and not of MDPI and/or the editor(s). MDPI and/or the editor(s) disclaim responsibility for any injury to people or property resulting from any ideas, methods, instructions or products referred to in the content.