Article

Unconventional Arrays for 3D Electrical Resistivity and Induced Polarization Tomography to Detect Leachate Concentration in a Waste Landfill

by
Raffaele Martorana
1,*,
Patrizia Capizzi
1 and
Calogero Pirrera
2
1
Dipartimento di Scienze della Terra e del Mare, Università degli Studi di Palermo, 90123 Palermo, Italy
2
Independent Researcher, 90100 Palermo, Italy
*
Author to whom correspondence should be addressed.
Appl. Sci. 2023, 13(12), 7203; https://doi.org/10.3390/app13127203
Submission received: 20 April 2023 / Revised: 6 June 2023 / Accepted: 14 June 2023 / Published: 16 June 2023
(This article belongs to the Collection Advances in Theoretical and Applied Geophysics)

Abstract

:
In recent times, 3D electrical resistivity and induced polarization tomographies are being used more frequently. However, it is often not possible to have regular grids of electrodes due to irregular topography, difficulty accessing urbanized or industrialized places, and other environmental and health problems. In these cases, the use of unconventional arrays is necessary, arranging the electrodes around the inaccessible area according to one or more open or closed polygonal traces. In this work, three different perimeter arrangements of electrodes are considered, and, for each, three different electrode array configurations are tested by calculating their apparent resistivity and solving the inverse problem on a three-dimensional model with resistive and conductive blocks. The comparison of the results showed that the dataset that produces the most realistic inverse model consists of electrodes arranged in concentric squares and the use of the Full Range Gradient (FRG) Array. This combination was evaluated in the field on a waste landfill, in which electrical resistivity and induced polarization tomographies were carried out, exploiting the access paths to the various sectors of the landfill to arrange the electrodes on approximately concentric polygons. The 3D models of electrical resistivity and induced polarization allowed the detection of zones of high concentration of leachate, defining their extension, and monitoring the functioning of the waterproofing membrane at the bottom of the landfill. The results proved that when it is not possible to arrange a regular grid of electrodes, the use of perimeter disposals of electrode joined to the FRG array provide a sufficiently homogeneous resolution below the area to be investigated.

1. Introduction

In direct current electrical resistivity methods, an electric field is generated by applying an electromotive force to a pair of current electrodes planted on the ground and the intensity of the generated current is measured [1]. The difference in electric potential is measured between two other electrodes, thus obtaining a measure of apparent resistivity given by the ratio between the potential difference Δ V and the current intensity I multiplied by a geometric factor G, which depends on the electrode array.
The solution to the direct problem is based on the equations governing the current flow associated with an electric field generated by point sources of electric current. The subsoil is discretized into cells and the solution to the problem is calculated based on the finite difference method [2] or the finite element method [3]. The inverse problem is nonlinear and ill-posed and is commonly solved with damped least squares methods [4].
Contrasts in electrical resistivity are often caused by lithological changes [5] and variations in porosity or water content [6], but they can also be caused by the presence of clayey sediments [7], metallic material, pollutants, and leachate.
In these cases, the combined use of electrical resistivity tomography (ERT) and induced polarization tomography (IPT) is useful [8,9]. IPT investigates the capacitive properties of the subsoil [10] which are strongly linked to the presence of clay, sulfides, and metal salts in water solution, or leachate [11,12].
In the last two decades, the method of electrical resistivity tomography (ERT) has been developed rapidly and successfully [13] thanks to the emergence of automatic devices capable of simultaneously acquiring large quantities of potential measurements with the same current dipole [14]. At the same time, 2D and 3D inversion algorithms [15] have become increasingly efficient.
Conventional 3D electrical tomography investigation techniques involve the acquisition of grid-shaped distributed ERT-2D profiles, using roll-along techniques to acquire data in 3D [16]. In these cases, however, there is the risk of performing many current inputs and, consequently, spending too much time on data acquisition. To overcome this problem, different arrays and combinations of measures have been designed to reduce the number of observations while maintaining adequate resolution and data quality for a 3D inversion [17]. Loke and Barker [15] proposed the “cross diagonal survey” technique, based on the pole-to-pole array, in which the potential measurements are acquired by considering electrodes along the orthogonal and diagonal directions of the grid passing through the current electrode. Fiandaca et al. [18] proposed the “Maximum Yield Grid” array, based on potential dipoles aligned in correspondence with the direction of the maximum gradient of the electric field, to minimize the number of measurements, considering few current dipoles, and consequently the times of acquisition and the invasiveness.
However, when planning a 3D survey, it is not always possible to use a regular grid in which the electrode distances are the same in the two orthogonal directions. In these cases, if the difference is too large, the resolution decreases drastically. Gharibi and Bentley [19] demonstrated that to obtain a sufficient resolution of the inverse model, the maximum separation between the electrode arrays should not exceed twice the in-line distance between the electrodes.
Although many authors have obtained appreciable results by inverting together apparent resistivity data obtained by acquiring separate 2D ERTs [20] or by interpolating models obtained from 2D inversions [21], nevertheless these models suffer from a significant reduction in resolution compared to the corresponding 3D models.
Furthermore, in urban or particularly rough areas, the spaces in which it is possible to carry out parallel electrode laying are drastically reduced. Consequently, researchers are forced to use the spaces available between buildings, walls, roads, and paths. The separation between the available spaces can be much greater than the minimum recommended distance to design grids or almost 3D electrode arrangements. In addition, inserting the electrodes into the ground may be prohibited due to buried electricity cables, telephone lines, water, gas, and drainage pipes, or simply because the structure being studied is a historical monument.
To obviate these problems, unconventional arrangements have been proposed in the past to investigate beneath surfaces that cannot be reached directly by the electrode arrays. In the methods called “L’-array” [22] and “Corner array” [22], the electrodes are distributed to form an L, exploiting, for example, two perpendicular ways adjacent to a building. However, the tomographies obtained by these methods suffer from a low resolution in the center of the investigated area. A modified version of these arrays, called “L and Corner” array has been proposed by Tejero-Andrade et al. [23], considering among other modifications the possibility of extending the survey to a quadrilateral. However, the results show a low resolution when compared with those obtained from a regular grid of electrodes.
In this work, the resolution capability of unconventional arrays is studied in situations where it is not possible to distribute the electrodes for optimal coverage, due to logistical impediments that force placing the electrodes only in certain accessible areas. In these cases, in which it is not possible to arrange the electrodes according to a regular and homogeneous distribution, the only solution is to surround the area to be investigated with polygonal electrode arrangements [22,23]. The potential of areal electrode arrangements on one or more quadrilaterals, contiguous or concentric, is studied to counteract the low resolution afflicting the previously discussed electrode sequences. Furthermore, for these arrangements, the possibilities of choosing electrode array configurations are studied, based both on a low number of current dipoles, to exploit the potential of multi-channel resistivity meters, and on thresholds on the geometric factor, to limit the noise.
Apparent resistivity measurements are simulated for the chosen combinations on a three-dimensional model with resistive and conductive blocks and the results are discussed and compared. Finally, a field test is carried out on a waste landfill, characterized by the impossibility of setting up a regular grid of electrodes, for which the access paths to the various sectors of the landfill were exploited to arrange electrodes on approximately concentric paths. The apparent resistivity and induced polarization data were inverted to obtain 3D models, aimed at defining the presence and geometry of any areas with a high concentration of leachate.

2. Materials and Methods

When it is not possible to arrange a regular grid of electrodes to guarantee homogeneous coverage of the investigated area, one is forced to adapt by arranging the electrodes in the only accessible areas to attempt a 3D reconstruction of the electrical properties of the subsoil even below the inaccessible areas. One approach to the problem is to arrange the electrodes around the inaccessible area according to one or more open or closed polygonal traces. However, in order for this choice to prove effective, it is important to use arrays that allow obtaining sufficient resolution even in the volumes below the surfaces without electrodes so as to guarantee the detectability of anomalous structures even below these areas. The effectiveness of the investigation, therefore, depends on both the electrode areal arrangement and the electrode array configuration chosen. Among the possible combinations, some that can better represent the possible choices in such situations are proposed and studied here.

2.1. Electrode Areal Arrangements in Square Surfaces

Considering the typical multi-channel instruments on the market today, the availability of an instrument with 96 channels, i.e., capable of acquiring up to 96 measurements simultaneously, was hypothesized.
In a square surface with a side equal to 120 m, three different areal electrode arrangements were considered, each having a total number of 96 electrodes (Figure 1). The first simulated electrode arrangement consisted of positioning the electrodes on the perimeter of the square that surrounds the investigated area, with a minimum electrode spacing a = 5 m (electrode arrangement A, Figure 1A). The second consisted of two concentric squares: the external square with a side of 120 m in which 48 electrodes are placed with a minimum spacing of 10 m, and the internal square with a side of 60 m, in which the other 48 electrodes are placed with minimum electrode spacing a = 5 m (electrode arrangement B, Figure 1B). The third electrode arrangement considered the same external square, cut in four by a cross (with a minimum electrode spacing a = 5 m) to simulate four contiguous areas (electrode arrangement C, Figure 1C).

2.2. Choice of the Electrode Array Configurations

The choices of the electrode arrays for the acquisition sequences were dictated by the need to limit the number of current dipoles used, trying in the same way to keep the symmetricity and the regularity of the pseudosection. In consideration of this, among all the possible electrode configurations, three configurations were chosen. The first configuration, here called α , provides arrays with external current electrodes and internal potential electrodes in which the two dipoles have the same midpoint. This corresponds to the Wenner array if the electrodes are aligned. The second configuration, indicated by β , is made by dipole–dipole arrays in which the current dipole and the potential dipole have the same length. Finally, the γ combination includes the measurements performed with the Full Range Gradient (FRG) array [24]. This latter is obtained by modifying the multiple gradient array [25], including in the sequence ofpotential dipoles that are external to the current dipole, also taking into account the Linear Grid array proposed by Martorana et al. [26]. The FRG array produces a pseudosection with extended lateral coverage, a much smaller geometric factor, and less noise contamination than the dipole–dipole array.
For each areal electrode arrangement shown in Figure 1 the configurations α , β , and γ were calculated. To limit the data noise, the measurements with a geometric factor G > 3000 m and, among the dipole–dipole measurements, those with a dipole length greater than 30 m were excluded. In this way, inverse models with low misfit and at the same time an adequate depth of investigation should be obtained. Table 1 summarizes the proposed electrode sequences, specifying the total number of measurements, the number of current dipoles, and the average number of potential measurements per current dipole.
Concerning the electrode array configurations, the γ configuration is the one that allows us to acquire a greater average number of potential measures for each current dipole. This is certainly an advantage if multi-channel resistivity meters are used, capable of carrying out several potential measurements at the same time. Ultimately, among the nine possible combinations of electrode areal arrangement/electrode array configuration, the combination between B and γ is the choice that presents the best compromise since its number of total measurements is quite high and, at the same time, it shows the largest average number of potential measures for the current dipole (69). In this way, this combination should be the fastest while ensuring a good resolution.

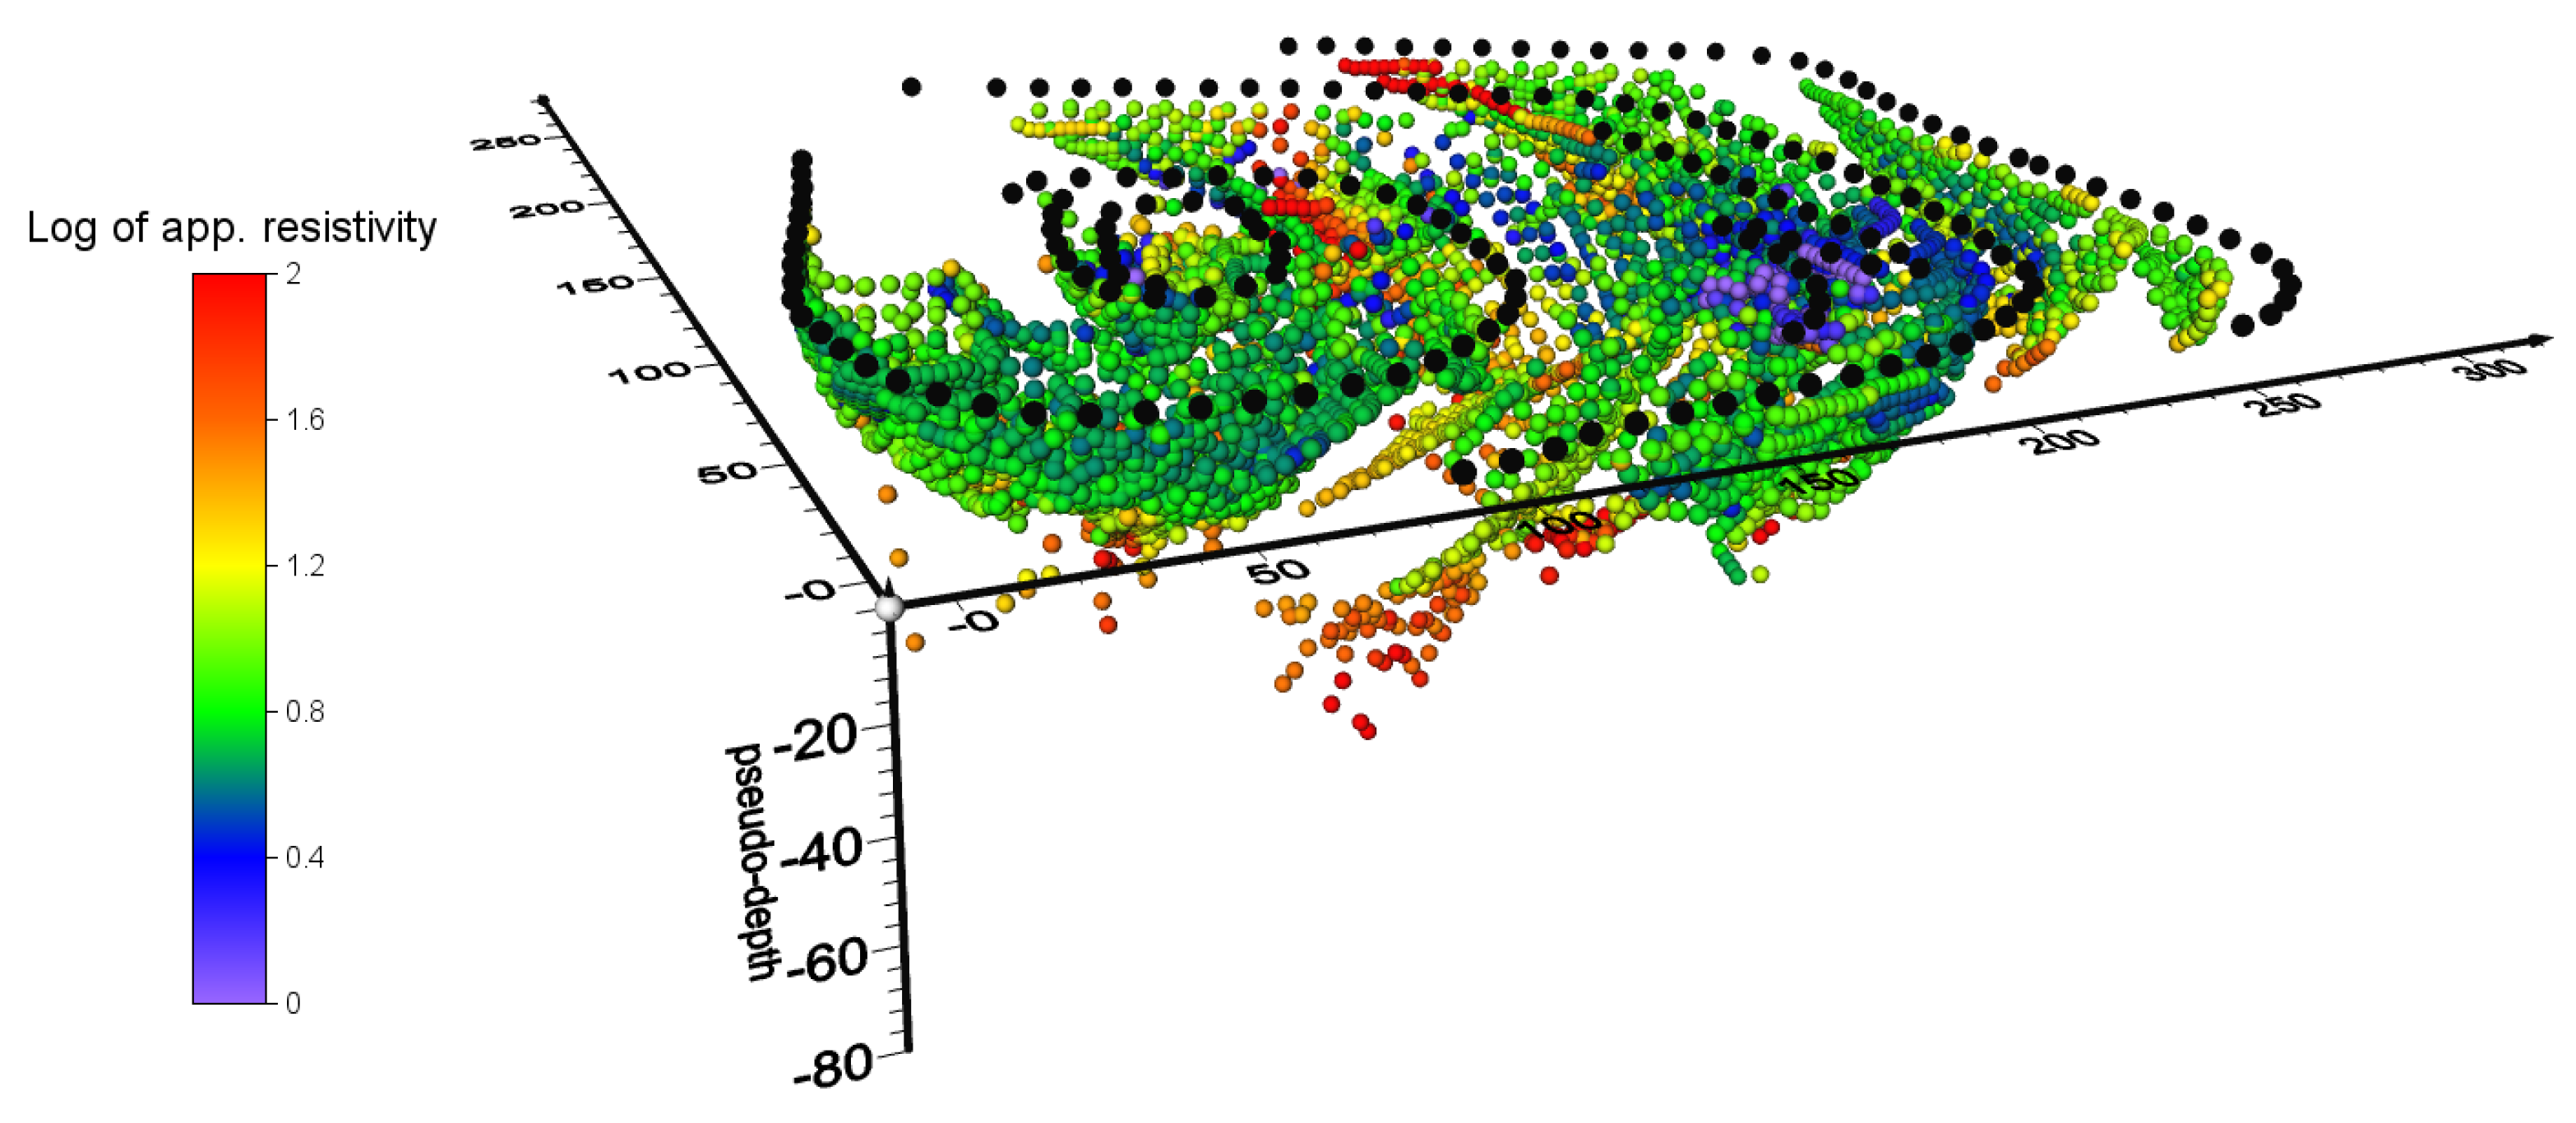
2.3. Apparent Resistivity Data Calculation
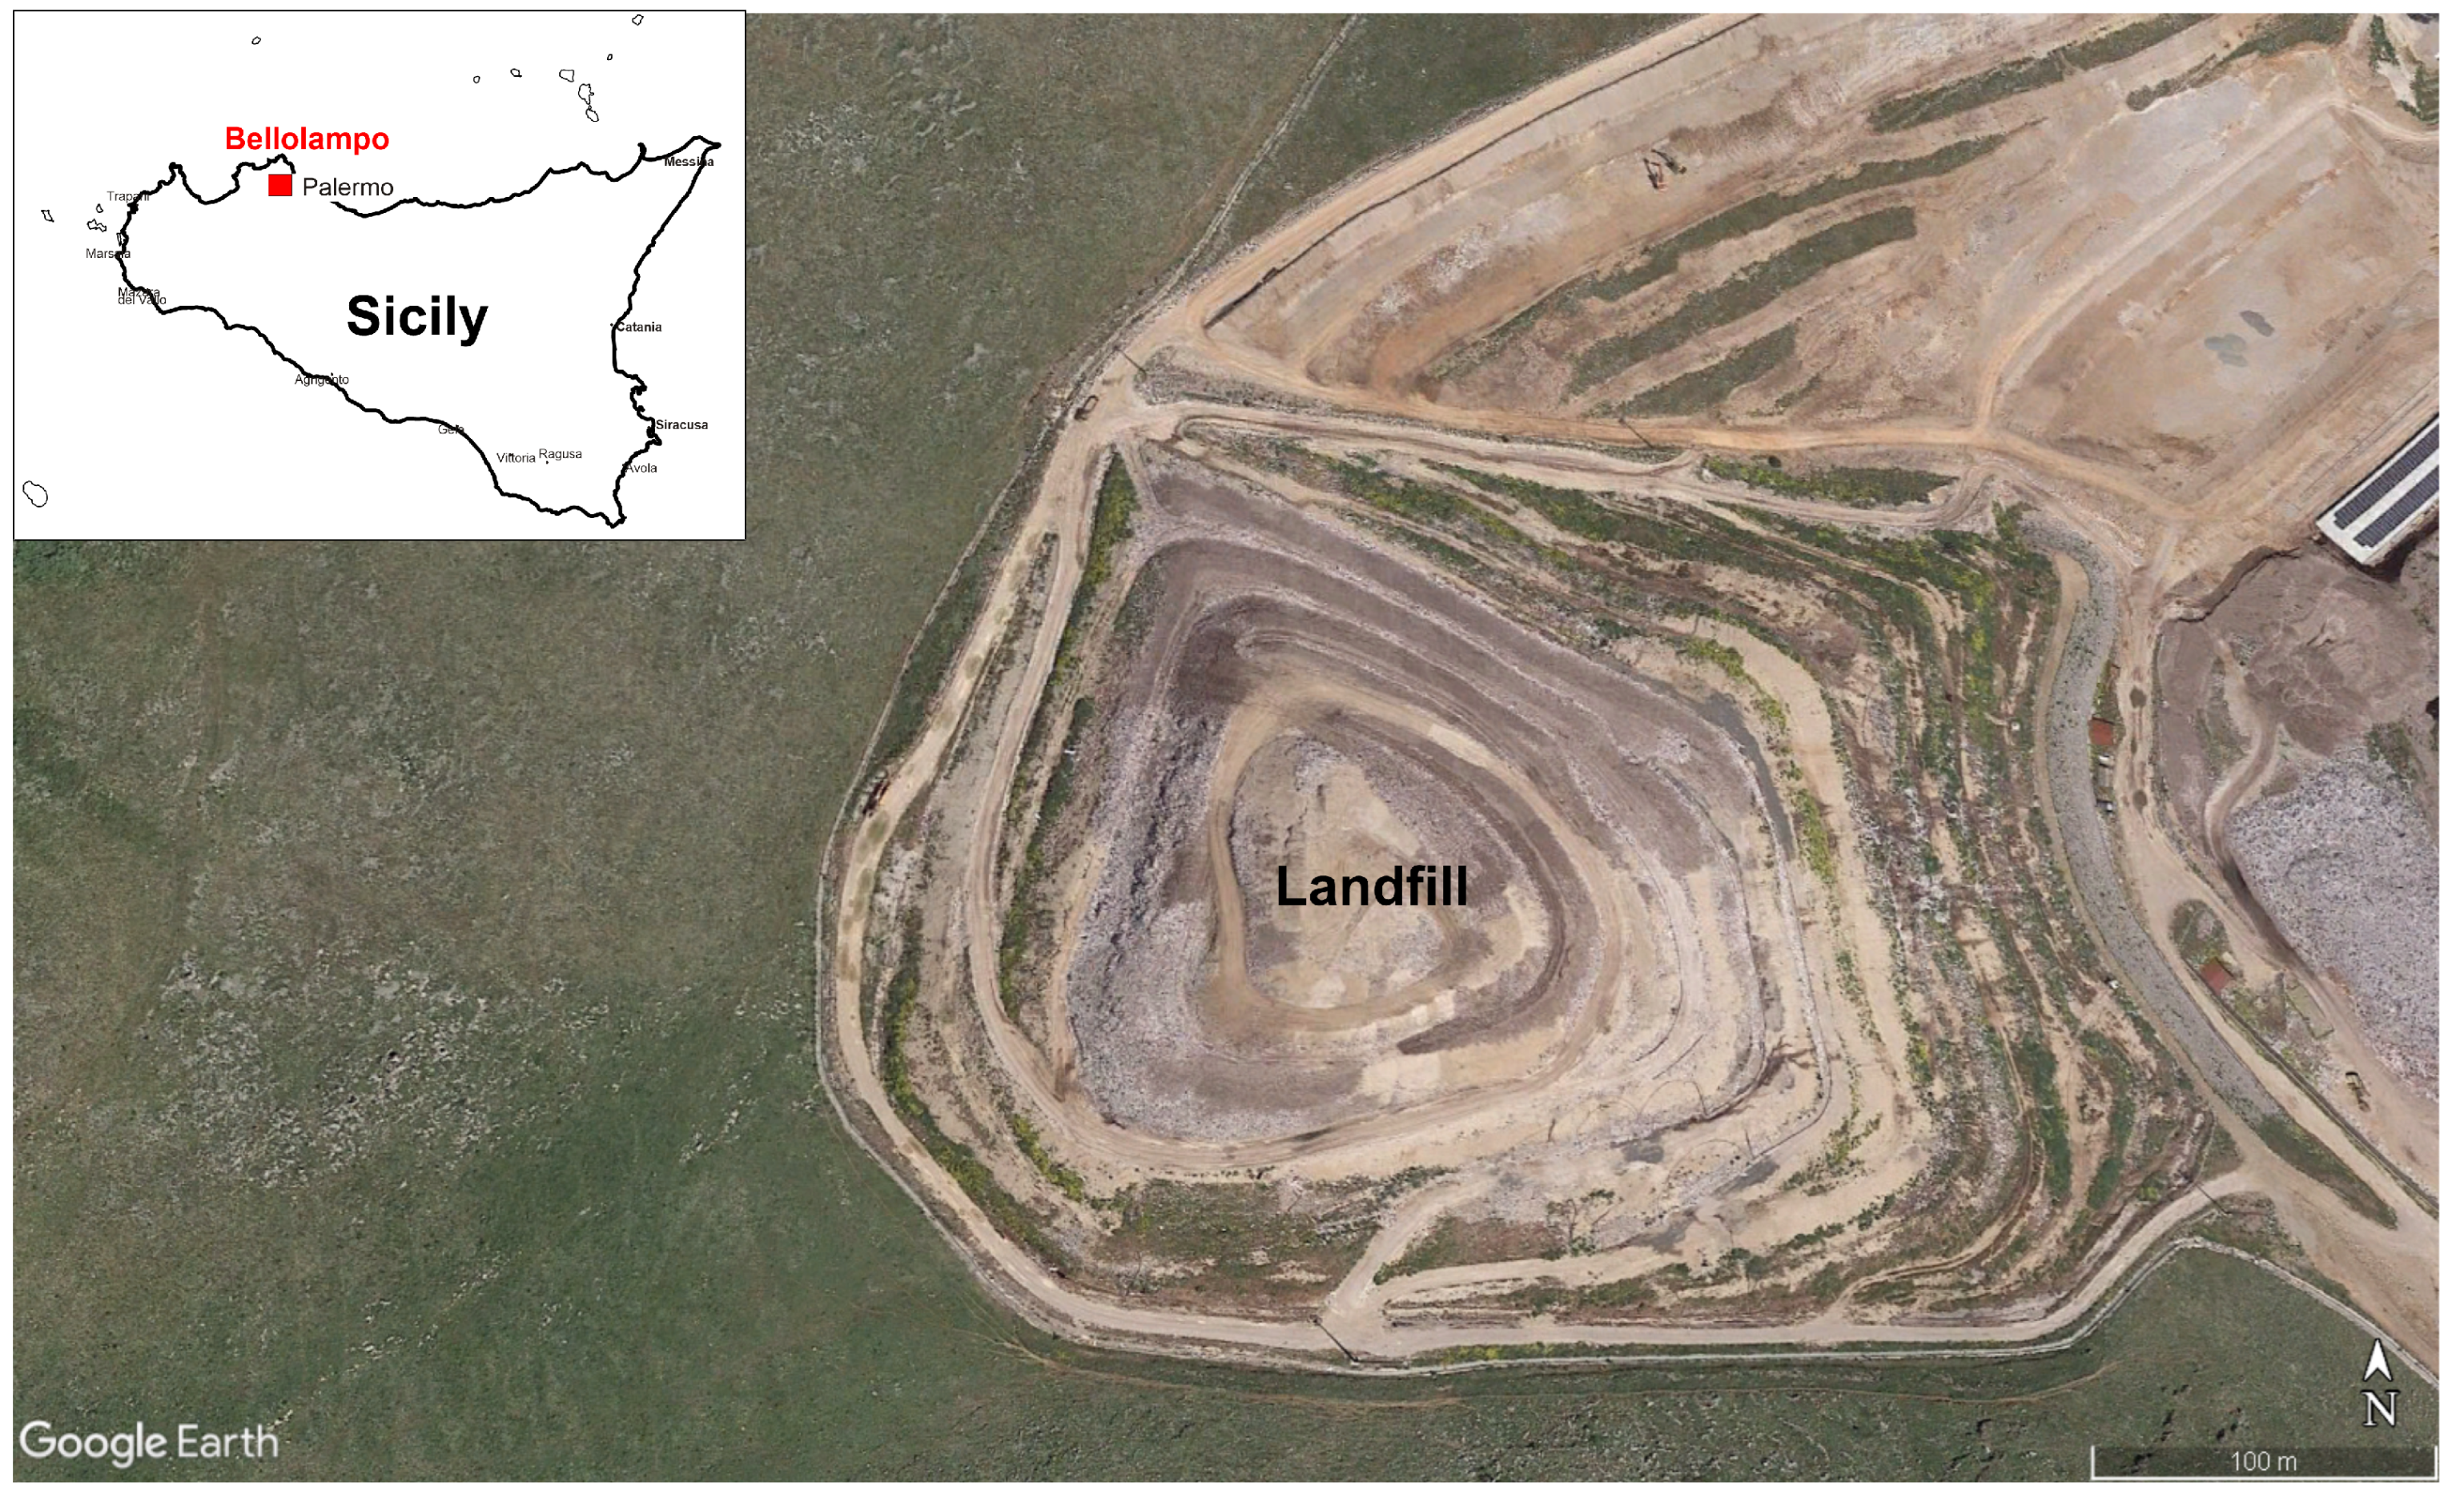
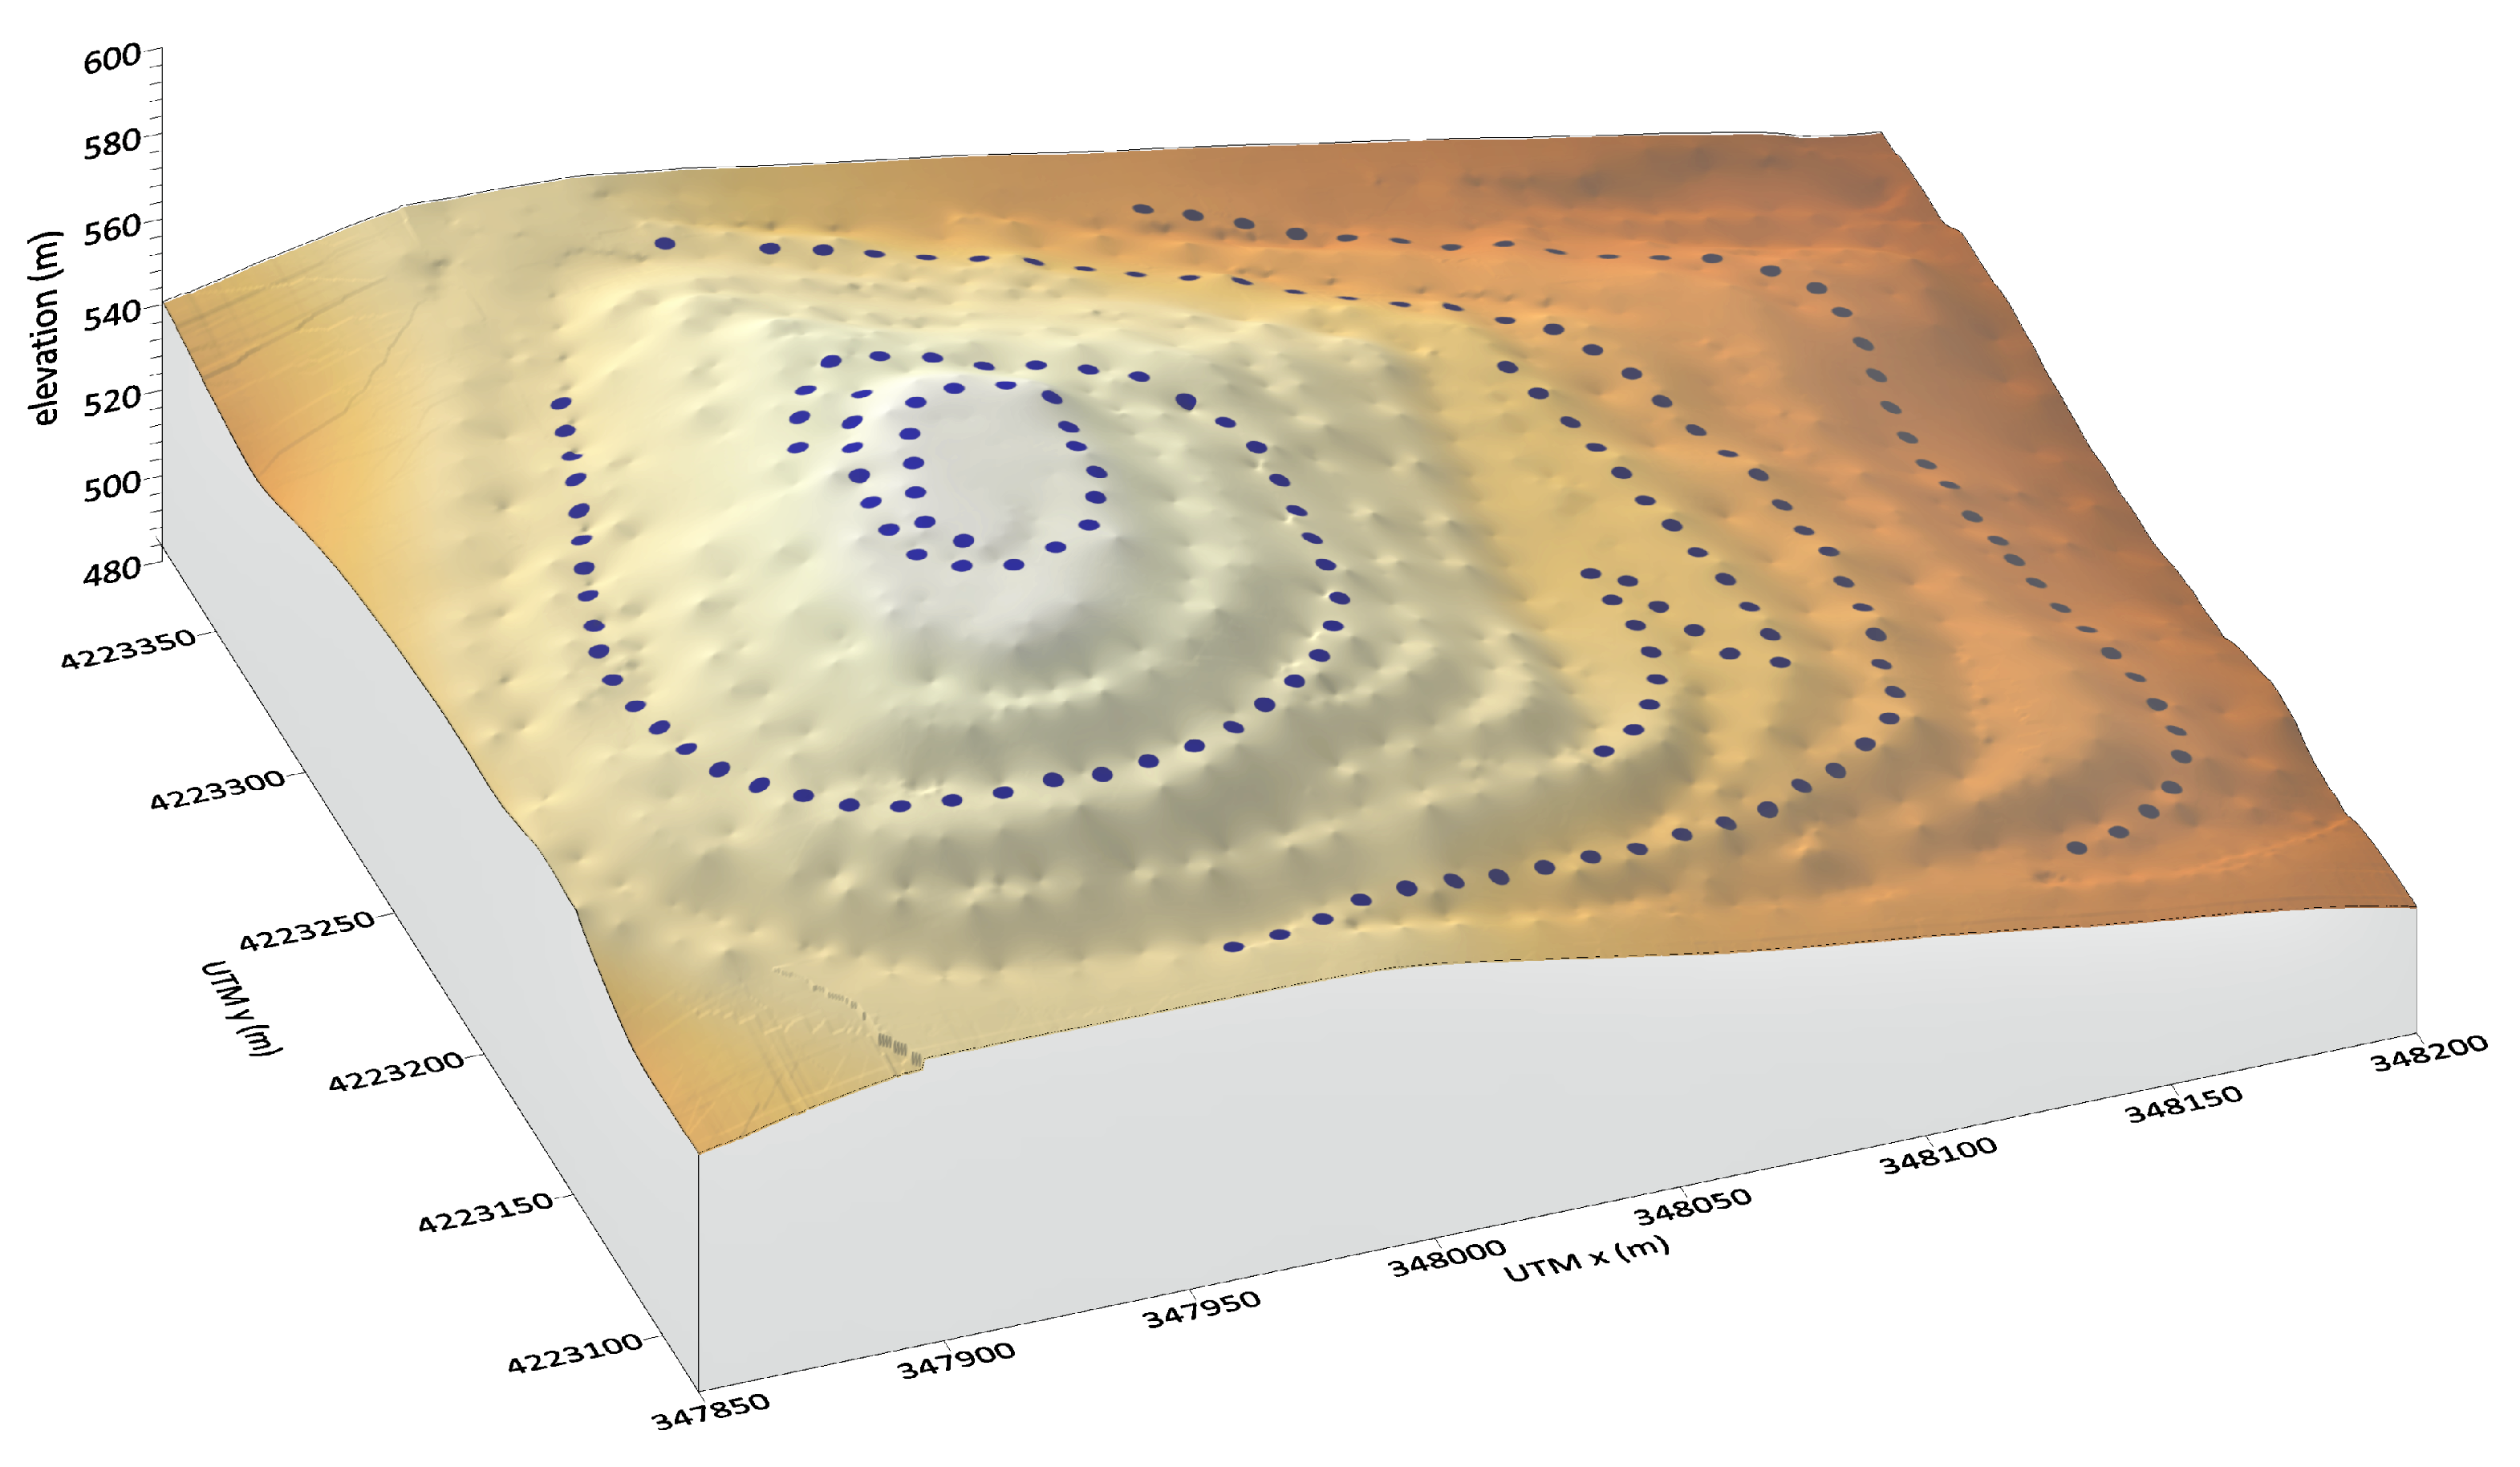
Apparent resistivity data were calculated using RES3DMODx64 v. 3.06 software [27] by simulating 3D electrical tomographies on a simple model of resistive (200 Ω m) and conductive (10 Ω m) prisms [28], considering a square surface of 120 m × 120 m (Figure 2). The top of the prisms is at a depth of 10 m. The heights of the prisms are equal to 10 m, the widths are 20 m, and the length is 80 m for the resistive ones and 40 m for the conductive one. The background resistivity is 50 Ω m. A noise of 2% was added to the calculated electric potential, considering an average spontaneous potential equal to 20 mV.
The spatial distributions of the apparent resistivity measurements are shown in Figure 3. In these, the horizontal location of the data point is placed at the mid-point of the set of electrodes used to make that measurement, whereas the vertical position is the median depth of investigation [29], or pseudo-depth, of the electrode array used. This pseudo-depth value is based on the sensitivity values or Frechet derivative for a homogeneous half-space. This spatial distribution changes considerably for each of the combinations of electrode areal arrangement and array configuration. Observing the electrode arrangement A, for this α and γ arrays show a much more regular data distribution versus β array. This trend is observable, albeit with a lesser effect, also for the electrode arrangements B and C.

2.4. The Test Site

A field test was carried out to validate the choice of the FRG array in combination with electrode arrangements on concentric quadrilaterals. The test site was a landfill of the Bellolampo dump site in the municipal area of Palermo, Sicily (Italy).
For the purposes of regular monitoring of the environmental impact of a landfill, minimizing the risk of contamination, it was important to precisely locate and characterize the sources of contamination, in terms of lateral extension, depth, leakage of contaminants, and type of waste (metal, hypersaline fluids, leachate, debris, etc.). Unfortunately, the landfill area of Bellolampo (Figure 4) is at high environmental risk since it is quite close to urban areas and was built on a substratum of fractured limestones. The site is located northwest of the city of Palermo and is characterized by the slopes of a mountain relief in which a natural watershed is found, the Celona Valley, which has extremely steep slopes, relict river karst valleys and canyons, sub-horizontal surfaces, and karst depressions [30].
In the area, calcareous and dolomitic limestones outcrops are characterized mainly by cracking-type permeability. The infiltration waters in the rock can reach the saturated zones on the slopes of the hills surrounding the Palermo plain [31].
Landfill no. 6, which is currently in operation, is divided into four sectors. The sealing of the bottom of the landfill was performed with two HDPE sheets with the intercalation of a clayey layer and another layer of drainage material with pipes for the leachate collection network.
In waste landfills, the resistivity and chargeability variations are very abrupt and can be correlated with the characteristics of the waste. These physical properties depend on the presence of the leachate and its mobility and saturation [32,33]. Furthermore, the gas content, the compaction density of the waste, and its variability affect the geoelectrical parameters. Consequently, the 2D ERT and IPT are frequently used tools for landfill surveys [34,35,36,37,38,39,40]. The high heterogeneity of waste repositories leads to a preference for 3D acquisitions [41,42,43,44] and the combined use of ERT and IPT [45].
The 3D electrical tomography was acquired using the MAE X612-EM resistivity meter. The instrumentation can use up to 96 electrodes simultaneously, allowing a high measurement speed when optimized sequences are used, such as the multiple gradient array [25] or, even better, the FRG array [24].
The features of the landfill and the steep slopes did not allow the electrodes to be arranged according to a regular grid. Due to the considerations made in Section 2.2, an electrode areal arrangement similar to B was therefore opted for, arranging the electrodes on a series of approximately concentric perimeters along the access routes for waste disposal in the various sectors of the landfill with an electrode spacing equal to 5 m. In this way, an irregular layout of 180 electrodes was obtained (Figure 5). The electrode locations were geo-referenced, using as a topographical basis a Digital Elevation Model with a resolution of 0.5 m provided by the managers of the wasteland and obtained thanks to a detailed topographical survey.
The γ electrode array configuration was used, involving the use of the FRG array [24] which was optimized for multi-channel instrumentation, to allow a high number of potential dipoles for each current dipole. In this way, enough measurements to guarantee a good resolution of the inverse model can be acquired in a short time. The goal of this combined choice was to obtain results comparable to those obtained with the arrays frequently used for 3D electrical resistivity and induced polarization tomographies when a regular electrode grid disposal is possible.
A total of 12,217 apparent resistivity data and the same number of apparent charge-ability data were acquired. The areal distribution of the measurement points is shown in Figure 6, where x and y are the coordinates of the array center and z is the pseudo-depth calculated according to Edwards [29]. It shows that this choice can allow a sufficiently homogeneous coverage of the landfill material and consequently a good resolution of most of the volume of the landfill.

2.5. Data Processing and Inversion

The data processing and inversion relating to both the simulations on the synthetic models and to the landfill survey were performed using the RES3DINVx64 v3.13 of Geotomo Software [46].
The discretization of the inverse models was carried out considering the horizontal dimensions of the cells equal to half of the minimum electrode spacing to obtain the adequate resolution allowed by the high amount of data.
Unlike the apparent resistivity data simulated starting from the block model, the dataset acquired at the landfill included values with a standard deviation greater than 20%, which were discarded. Furthermore, some outliers caused by high contact resistance or by insufficient current intensity were eliminated. As a result, the dataset was heavily reduced to 6093 processable measures, which is, however, an amount sufficient to obtain a high-resolution model.
For the discretization of the landfill inverse model, a grid of 32 × 28 nodes, equidistant 10 m, was chosen to cover a rectangular area of 310 m by 270 m, which included the positions of all the electrodes used. The inverse model is thus composed of 31 × 27 × 13 = 10,881 cells.
The topographic correction was made using a Digital Elevation Model provided by the landfill managing body. Considering the resolution of the inverse model, the resolution of the DEM was lowered to 5 m. Furthermore, the inversion was constrained by using the position of the waterproofing membrane placed at the base of the landfill which, due to its insulating characteristics, should not allow the crossing of the current flow, forcing the current to flow almost entirely inside the basin. In this way, the transition from conductive materials (waste and leachate) to the much more resistive limestone rock is forced to take place in correspondence with the bottom membrane [45].
The inversion process was stopped when the misfit changes fell below 2%, obtaining an RMS misfit between observed and predicted data equal to 7.7% on the apparent resistivity and 23.9% on the apparent chargeability. The dimensions of the cells of the rendered volume of the Voxler 3D models are 5 m × 5 m × 2 m.

3. Results

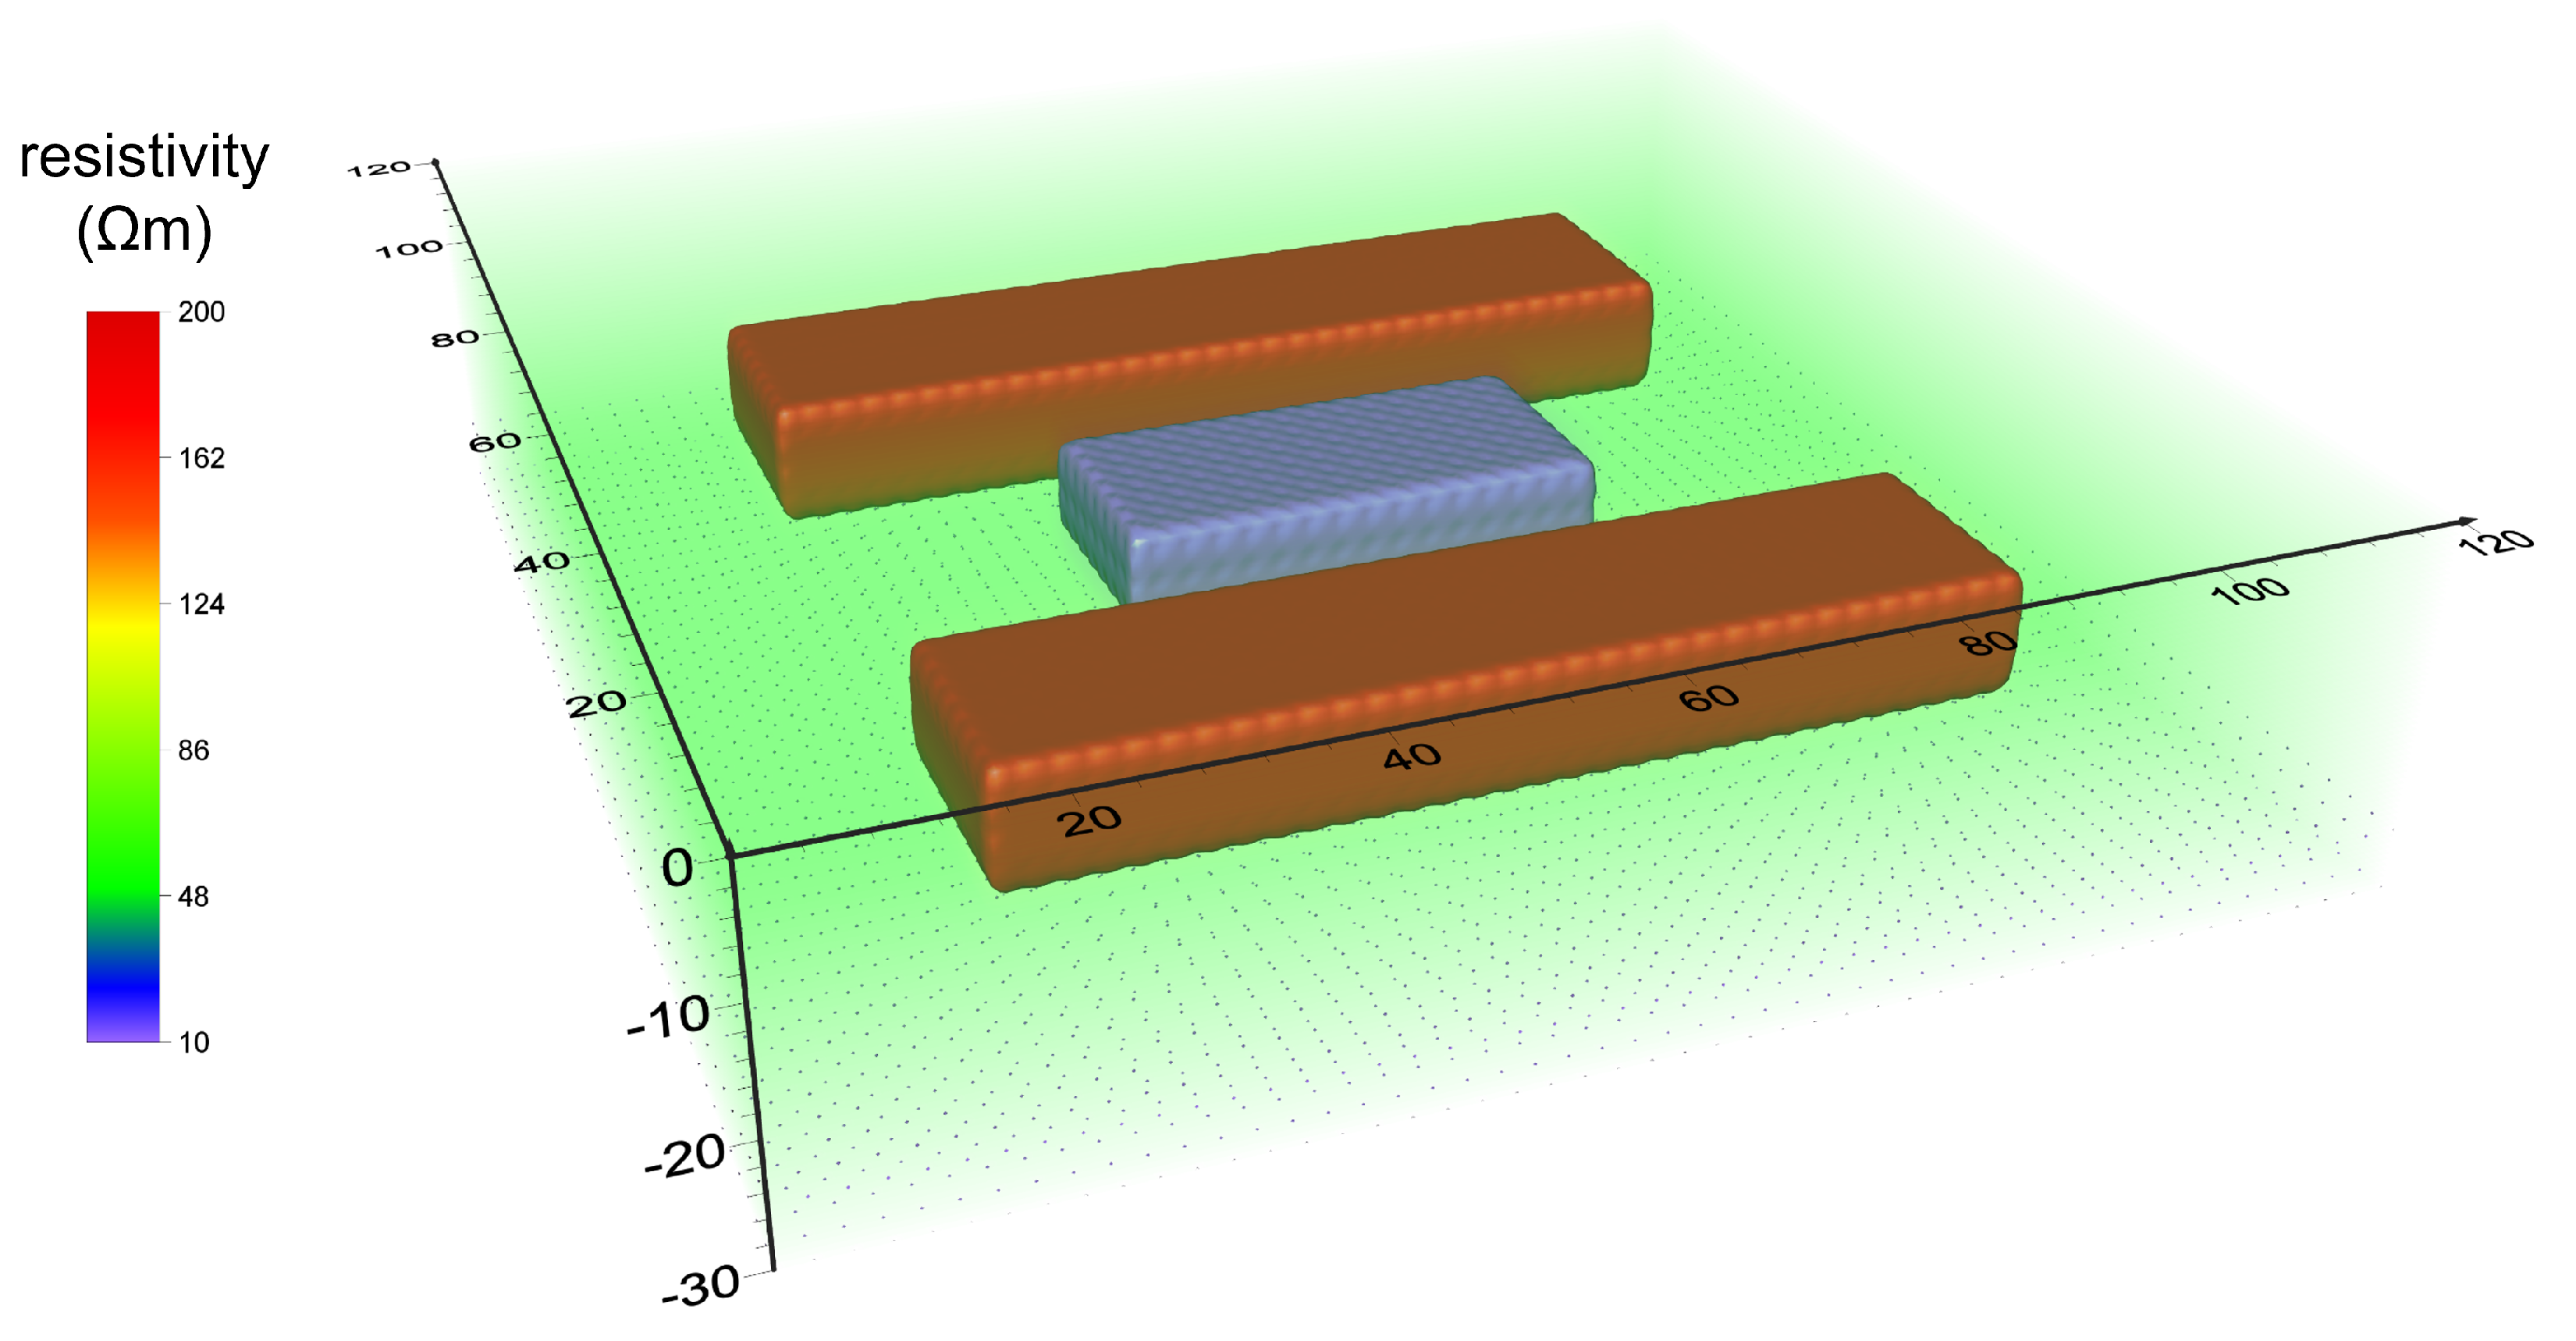
3.1. Inverse Models from the Simulated Data

The inverse models obtained from the simulated data are shown in Figure 7, for each of the nine combinations between electrode areal arrangement and array configuration. In the volume rendering of the electrical resistivity distribution, isosurfaces of 30 Ω m and 70 Ω m highlight, respectively, the conductive anomalous zones and the resistive ones. The choice of these values, identical for all the inversions, was made after a careful analysis of the anomalous shapes. The shapes and sizes of the original prisms are represented by red and blue polygons in order to enhance the degree of correspondence between the anomalies resulting from the inversions and the prisms of the original model. As a quantitative indicator of the effectiveness of the inversions, we calculated the percentage of the volume enclosed by the anomalies with respect to the volume of the conductive or resistive prisms. The results are shown in Table 2.
The inverse models relating to the electrode areal arrangement A, in which the electrodes are equally spaced along the perimeter of a square, do not give satisfactory results, as none of them manages to identify the two resistive blocks. Only the α and γ arrays somehow show conductive anomalies located below the center of the area, but with resistivity values always higher than 30 Ω m and therefore very far from the real value. The electrode areal arrangement B, having the electrodes equally spaced on the perimeters of two concentric squares, undoubtedly gives better results. For this arrangement, of the three array configurations tested, the γ array is the one that outlines the three blocks of anomalous resistivity with greater resolution and detail. In fact, the anomalies show lengths very close to the true ones and their volumes are quite close to the real ones, with a not excessive overestimation. Finally, the electrode areal arrangement C, with four contiguous squares, provides satisfactory results even if qualitatively inferior to those of B. In fact, in the latter models, the lengths of the resistive block are strongly underestimated, probably due to insufficient resolving power in the marginal zones of the investigated area. Conversely, the conductive block, in the center of the square and, above all, below the electrodes arranged in a cross, is well identified, both in size and shape. The results of the synthetic tests, therefore, confirm that the best compromise is to choose the electrode areal arrangement B, together with the γ array.

3.2. Results of 3D ERT and IP on the Waste Landfill

The areal electrode arrangement in approximately concentric polygons together with the use of the FRG array made it possible to obtain almost complete coverage of the entire landfill, although obviously the greatest resolution is obtained in the zones close to the electrodes. This can be deduced from Figure 8 which shows the spatial distribution of the normalized value of the cell sensitivity in the inverse model, limited down by the water-proofing membrane. The model is also cut into two vertical sections to highlight that the sensitivity decreases with depth but remains sufficient down to the insulating membrane.
Figure 9 shows the volume rendering of the ERT and IPT inverse models of the landfill, limited downward by the HDPE waterproofing membrane. The pattern of the apparent resistivity (Figure 9a) appears very heterogeneous, with values ranging from a minimum of about 0.3 Ω m to a maximum of about 300 Ω m. The resistive zones are close to the external surface, whereas the conductive ones are more concentrated and extend from the near-surface zones to the bottom of the landfill. This is evident in Figure 9b, where the model is cut vertically to highlight how the resistivity varies with depth inside the landfill.
The chargeability values inside the landfill are also highly heterogeneous, varying from a minimum of 0 ms to a maximum of 600 ms (Figure 9c). The zones with greater chargeability are however concentrated in the center and extend to the bottom of the landfill, as can be seen from the sectioned model in Figure 9d.
Finally, the 3D resistivity and induced polarization models were elaborated for the bedrock zone below the landfill to evaluate the tightness of the impermeable layer. This part of the 3D inverse models is shown in Figure 10. The electrical resistivity has a homogeneous trend (Figure 10a,b), with values greater than 100 Ω m. The electrical chargeability has generally low values (Figure 10c) except for a central zone (Figure 10d) in which it assumes higher values, up to 450 ms.

4. Discussion and Conclusions

The results obtained from the simulated data on the blocky model show that the volumetric distribution of the inverse model resolution changes considerably depending on the chosen electrode areal arrangement. With the same number of electrodes, their arrangement on a single polygon does not allow an adequate resolution of the zones inside the polygon. In fact, the resistive or conductive blocks are not identified with sufficient accuracy by the inverse models. The choice, if possible, to arrange electrodes along two concentric or contiguous polygons significantly improves the resolution in the center of the investigated area, while maintaining an acceptable detail also in the peripheral areas. However, arrangement B with concentric squares allows obtaining models in which the lengths of the two non-centered prisms are identified more accurately, probably because this arrangement guarantees a more homogeneous coverage than arrangement C.
Considering the same electrode areal arrangement, the choice of the electrode array configuration also affects the quality and reliability of the inverse model, albeit to a lesser extent. In this context, the β and γ arrays give inverse models that are more similar to the starting model than that obtained by the α array. However, the γ array is preferable because it allows for a shorter measurement time for about the same amount of data acquired, thanks to the high value of potential measurements that can be carried out for each current dipole.
The test carried out on the Bellolampo landfill (Palermo, Italy) allowed the results obtained through the simulations to be validated in the field. The choice of a landfill site was suggested by the need to obtain a highly detailed three-dimensional representation of the electrical resistivity and chargeability in an area with high criticality regarding access and operability, also in consideration of carrying out the measurements in the shortest time possible for health and safety reasons. In a landfill, it is not possible to arrange the electrodes regularly, but field operations are limited by the access paths to the various sectors. In this context, the choice of arranging the electrodes along summarily concentric polygons appeared to be the only practicable one. Furthermore, the choice of the FRG array allowed us to carry out the measurements in the shortest possible time while guaranteeing adequate coverage and good resolution, at least in the landfill area above the water-proofing membrane.
In the 3D ERT results, the resistive zones, close to the external surface, indicate a dry waste material, not permeated by leachate. By highlighting the volumes with very low resistivity and/or very high chargeability values (Figure 11), it is possible to delimit the zones where the leachate accumulates inside the landfill and to identify the areas where the leachate could potentially spill below the waterproofing membrane. The zones with resistivity lower than 3 Ω m are highlighted inside the waste (Figure 11a) and in the rock bottom under the membrane (Figure 11b). These conductive zones, more localized and extended further down, are an indication of a high concentration of leachate which, due to gravitational effects, tends to accumulate at the bottom of the landfill.
Similarly, the zones with chargeability greater than 300 ms are shown inside the waste (Figure 11c), and below the waterproofing membrane (Figure 11d).
The accumulation of leachate within the waste is even better highlighted in the IPT by volumes with high electrical chargeability because it is characterized by a high concentration of metallic salts in the solution. The high chargeability values below the landfill could be caused by a sewage spill, resulting from a non-perfect seal of the membrane. However, it must be specified that the membrane, due to its very high electrical resistivity, acts as an insulator for the electric field, considerably reducing the resolution of the inverse models below it.
The combined use of the electrode arrangement on concentric polygons and the FRG array, optimized for fast acquisitions with multi-channel resistivity meters, allowed us to identify and define the zones of high leachate concentration inside the landfill and monitor any leaks below it, thus achieving the pre-established objective, in a particularly critical environment in which full access to the area is limited and it is not advisable to stay for a long time.

Author Contributions

Conceptualization, R.M. and P.C.; methodology, R.M. and P.C.; software, R.M. and P.C.; validation, R.M.; formal analysis, R.M. and P.C.; investigation, P.C. and C.P.; resources, P.C. and C.P.; data curation, R.M.; writing—original draft preparation, R.M.; writing—review and editing, R.M. and P.C.; visualization, R.M. and P.C. All authors have read and agreed to the published version of the manuscript.

Funding

This research received no external funding.

Institutional Review Board Statement

Not applicable.

Informed Consent Statement

Not applicable.

Data Availability Statement

Data can be obtained upon request from the corresponding author.

Conflicts of Interest

The authors declare no conflict of interest.

References

  1. Koefoed, O. Resistivity Sounding measurements. Geosound. Princ. 1979, 1, 19–27. [Google Scholar]
  2. Dey, A.; Morrison, H. Resistivity modelling for arbitrarily shaped two-dimensional structures. Geophys. Prospect. 1979, 27, 106–136. [Google Scholar] [CrossRef]
  3. Coggon, J. Electromagnetic and electrical modeling by the finite element method. Geophysics 1971, 36, 132–155. [Google Scholar] [CrossRef]
  4. Inman, J.R. Resistivity inversion with ridge regression. Geophysics 1975, 40, 798–817. [Google Scholar] [CrossRef]
  5. Lapenna, V.; Lorenzo, P.; Perrone, A.; Piscitelli, S.; Sdao, F.; Rizzo, E. High-resolution geoelectrical tomographies in the study of Giarrossa landslide (southern Italy). Bull. Eng. Geol. Environ. 2003, 62, 259–268. [Google Scholar] [CrossRef]
  6. Lehmann, P.; Gambazzi, F.; Suski, B.; Baron, L.; Askarinejad, A.; Springman, S.M.; Holliger, K.; Or, D. Evolution of soil wetting patterns preceding a hydrologically induced landslide inferred from electrical resistivity survey and point measurements of volumetric water content and pore water pressure. Water Resour. Res. 2013, 49, 7992–8004. [Google Scholar] [CrossRef]
  7. Revil, A.; Glover, P. Nature of surface electrical conductivity in natural sands, sandstones, and clays. Geophys. Res. Lett. 1998, 25, 691–694. [Google Scholar] [CrossRef]
  8. Chirindja, F.; Dahlin, T.; Juizo, D.; Steinbruch, F. Reconstructing the formation of a costal aquifer in Nampula province, Mozambique, from ERT and IP methods for water prospection. Environ. Earth Sci. 2017, 76, 1–13. [Google Scholar] [CrossRef] [Green Version]
  9. Gonzales Amaya, A.; Dahlin, T.; Barmen, G.; Rosberg, J.E. Electrical resistivity tomography and induced polarization for mapping the subsurface of alluvial fans: A case study in Punata (Bolivia). Geosciences 2016, 6, 51. [Google Scholar] [CrossRef] [Green Version]
  10. Kemna, A.; Binley, A.; Cassiani, G.; Niederleithinger, E.; Revil, A.; Slater, L.; Williams, K.H.; Orozco, A.F.; Haegel, F.H.; Hördt, A.; et al. An overview of the spectral induced polarization method for near-surface applications. Near Surf. Geophys. 2012, 10, 453–468. [Google Scholar] [CrossRef] [Green Version]
  11. Merritt, A.; Chambers, J.; Murphy, W.; Wilkinson, P.; West, L.; Gunn, D.; Meldrum, P.; Kirkham, M.; Dixon, N. 3D ground model development for an active landslide in Lias mudrocks using geophysical, remote sensing and geotechnical methods. Landslides 2014, 11, 537–550. [Google Scholar] [CrossRef] [Green Version]
  12. Okay, G.; Leroy, P.; Ghorbani, A.; Cosenza, P.; Camerlynck, C.; Cabrera, J.; Florsch, N.; Revil, A. Spectral induced polarization of clay-sand mixtures: Experiments and modelingPolarization of clay-sand mixtures. Geophysics 2014, 79, E353–E375. [Google Scholar] [CrossRef] [Green Version]
  13. Loke, M.; Chambers, J.; Rucker, D.; Kuras, O.; Wilkinson, P. Recent developments in the direct-current geoelectrical imaging method. J. Appl. Geophys. 2013, 95, 135–156. [Google Scholar] [CrossRef]
  14. Griffiths, D.; Turnbull, J. A multi-electrode array for resistivity surveying. First Break 1985, 3, 7. [Google Scholar] [CrossRef]
  15. Loke, M.; Barker, R. Practical techniques for 3D resistivity surveys and data inversion1. Geophys. Prospect. 1996, 44, 499–523. [Google Scholar] [CrossRef]
  16. Dahlin, T.; Bernstone, C. A roll-along technique for 3D resistivity data acquisition with multi-electrode arrays. In Proceedings of the 10th EEGS Symposium on the Application of Geophysics to Engineering and Environmental Problems. European Association of Geoscientists & Engineers, Nashville, TN, USA, 25–29 March 1997; p. 204. [Google Scholar]
  17. Martorana, R.; Capizzi, P.; D’Alessandro, A.; Luzio, D. Comparison of different sets of array configurations for multichannel 2D ERT acquisition. J. Appl. Geophys. 2017, 137, 34–48. [Google Scholar] [CrossRef]
  18. Fiandaca, G.; Martorana, R.; Messina, P.; Cosentino, P. The MYG methodology to carry out 3D electrical resistivity tomography on media covered by vulnerable surfaces of artistic value. Nuovo Cim. B 2010, 125, 711–718. [Google Scholar]
  19. Gharibi, M.; Bentley, L.R. Resolution of 3-D electrical resistivity images from inversions of 2-D orthogonal lines. J. Environ. Eng. Geophys. 2005, 10, 339–349. [Google Scholar] [CrossRef] [Green Version]
  20. Chambers, J.; Wilkinson, P.; Penn, S.; Meldrum, P.; Kuras, O.; Loke, M.; Gunn, D. River terrace sand and gravel deposit reserve estimation using three-dimensional electrical resistivity tomography for bedrock surface detection. J. Appl. Geophys. 2013, 93, 25–32. [Google Scholar] [CrossRef] [Green Version]
  21. Capizzi, P.; Martorana, R. Integration of constrained electrical and seismic tomographies to study the landslide affecting the cathedral of Agrigento. J. Geophys. Eng. 2014, 11, 045009. [Google Scholar] [CrossRef]
  22. Chávez, G.; Tejero, A.; Alcantara, M.; Chavez, R. The ‘L-Array’, a tool to characterize a fracture pattern in an urban zone: Extended Abstracts of the 2011 Near Surface Geophysics meeting. In Proceedings of the European Section Meeting, Hull, UK, 17–22 July 2011. [Google Scholar]
  23. Tejero-Andrade, A.; Cifuentes, G.; Chávez, R.E.; López-González, A.E.; Delgado-Solórzano, C. L-and CORNER-arrays for 3D electric resistivity tomography: An alternative for geophysical surveys in urban zones. Near Surf. Geophys. 2015, 13, 355–368. [Google Scholar] [CrossRef] [Green Version]
  24. Zhou, B.; Bouzidi, Y.; Ullah, S.; Asim, M. A full-range gradient survey for 2D electrical resistivity tomography. Near Surf. Geophys. 2020, 18, 609–626. [Google Scholar] [CrossRef]
  25. Dahlin, T.; Zhou, B. Multiple-gradient array measurements for multichannel 2D resistivity imaging. Near Surf. Geophys. 2006, 4, 113–123. [Google Scholar] [CrossRef] [Green Version]
  26. Martorana, R.; Fiandaca, G.; Casas Ponsati, A.; Cosentino, P. Comparative tests on different multi-electrode arrays using models in near-surface geophysics. J. Geophys. Eng. 2009, 6, 1–20. [Google Scholar] [CrossRef] [Green Version]
  27. Loke, M. 3-D Resistivity and Ip forward Modeling Using the Finite-Difference and Finite-Element Methods. Instruction Manual for RES3DMOD Ver. 2.14 and RES3DMODx64 Ver. 3.04; Geotomosoft Solutions: Kuala Lumpur, Malaysia, 2017. [Google Scholar]
  28. Abdullah, F.M.; Loke, M.H.; Nawawi, M.; Abdullah, K. Improving the resolution of 3-D resistivity surveys along the perimeter of a confined area using optimized arrays. Pure Appl. Geophys. 2019, 176, 1701–1715. [Google Scholar] [CrossRef]
  29. Edwards, L. A modified pseudosection for resistivity and IP. Geophysics 1977, 42, 1020–1036. [Google Scholar] [CrossRef]
  30. Catalano, R.; Basilone, L.; Di Maggio, C.; Gasparo Morticelli, M.; Agate, M.; Avellone, G. Note Illustrative della Carta Geologica d’Italia alla Scala 1: 50.000 del Foglio 594–585 “Partinico-Mondello”; ISPRA—Servizio Geologico d’Italia: Rome, Italy, 2013.
  31. Contino, A.; Cusimano, G.; Frias Forcada, A. Modello idrogeologico dei Monti di Palermo. In Proceedings of the Atti del 79 Congresso Nazionale della Società Geologica Italiana, Palermo, Italy, 21–23 September 1998; pp. 21–23. [Google Scholar]
  32. Costanzo, A.; Pisciotta, A.; Pannaccione Apa, M.I.; Bongiovanni, S.; Capizzi, P.; D’Alessandro, A.; Falcone, S.; La Piana, C.; Martorana, R. Integrated use of unmanned aerial vehicle photogrammetry and terrestrial laser scanning to support archaeological analysis: The Acropolis of Selinunte case (Sicily, Italy). Archaeol. Prospect. 2021, 28, 153–165. [Google Scholar] [CrossRef]
  33. Rani, P.; Cassiani, G. Tracking contaminant transport using time-lapse geophysics: A review on applications of electrical methods. Water Secur. 2022, 17, 100127. [Google Scholar] [CrossRef]
  34. Bernstone, C.; Dahlin, T. DC resistivity mapping of old landfills: Two case studies. Eur. J. Environ. Eng. Geophys. 1997, 2, 121–136. [Google Scholar]
  35. Aristodemou, E.; Thomas-Betts, A. DC resistivity and induced polarisation investigations at a waste disposal site and its environments. J. Appl. Geophys. 2000, 44, 275–302. [Google Scholar] [CrossRef]
  36. Bernstone, C.; Dahlin, T.; Ohlsson, T.; Hogland, H. DC-resistivity mapping of internal landfill structures: Two pre-excavation surveys. Environ. Geol. 2000, 39, 360–371. [Google Scholar] [CrossRef] [Green Version]
  37. Guérin, R.; Munoz, M.L.; Aran, C.; Laperrelle, C.; Hidra, M.; Drouart, E.; Grellier, S. Leachate recirculation: Moisture content assessment by means of a geophysical technique. Waste Manag. 2004, 24, 785–794. [Google Scholar] [CrossRef] [PubMed]
  38. Chambers, J.E.; Kuras, O.; Meldrum, P.I.; Ogilvy, R.D.; Hollands, J. Electrical resistivity tomography applied to geologic, hydrogeologic, and engineering investigations at a former waste-disposal site. Geophysics 2006, 71, B231–B239. [Google Scholar] [CrossRef] [Green Version]
  39. De Carlo, L.; Perri, M.T.; Caputo, M.C.; Deiana, R.; Vurro, M.; Cassiani, G. Characterization of a dismissed landfill via electrical resistivity tomography and mise-à-la-masse method. J. Appl. Geophys. 2013, 98, 1–10. [Google Scholar] [CrossRef]
  40. Guinea, A.; Bicknell, J.; Cox, N.; Swan, H.; Simmons, N. Characterization of legacy landfills with electrical resistivity tomography; a comparative study. J. Appl. Geophys. 2022, 203, 104716. [Google Scholar] [CrossRef]
  41. Chambers, J.; Meldrum, P.; Ogilvy, R.; Wilkinson, P. Characterisation of a NAPL-contaminated former quarry site using electrical impedance tomography. Near Surf. Geophys. 2005, 3, 81–92. [Google Scholar] [CrossRef]
  42. Dahlin, T.; Bernstone, C.; Loke, M.H. A 3-D resistivity investigation of a contaminated site at Lernacken, Sweden. Geophysics 2002, 67, 1692–1700. [Google Scholar] [CrossRef] [Green Version]
  43. Clément, R.; Descloitres, M.; Günther, T.; Oxarango, L.; Morra, C.; Laurent, J.P.; Gourc, J.P. Improvement of electrical resistivity tomography for leachate injection monitoring. Waste Manag. 2010, 30, 452–464. [Google Scholar] [CrossRef]
  44. Maurya, P.; Rønde, V.; Fiandaca, G.; Balbarini, N.; Auken, E.; Bjerg, P.L.; Christiansen, A. Detailed landfill leachate plume mapping using 2D and 3D electrical resistivity tomography-with correlation to ionic strength measured in screens. J. Appl. Geophys. 2017, 138, 1–8. [Google Scholar] [CrossRef] [Green Version]
  45. Martorana, R.; Capizzi, P.; D’Alessandro, A.; Luzio, D. Electrical resistivity and induced polarization tomographies to test the efficiency and safety of the new landfill of Bellolampo (Palermo, Italy). Boll. Geofis. Teor. Appl. 2016, 57, 313–327. [Google Scholar]
  46. Loke, M. Rapid 3-D Resistivity and IP Inversion Using the Least-Squares Method. Instruction Manual for RES3DINVx64 Ver. 3.13; Geotomosoft Solutions: Kuala Lumpur, Malaysia, 2017. [Google Scholar]
Figure 1. Three possible areal arrangements with 96 electrodes on a square area with a side of 120 m in conditions of limited accessibility.
Applsci 13 07203 g001
Figure 2. Three-dimensional electrical resistivity model characterized by a conductive prism in the center and two lateral resistive prisms, simulated with the RES3DMODx64 v. 3.06 software [27].
Applsci 13 07203 g002
Figure 3. For each of the nine combinations of electrode areal arrangement and array configuration of Table 1, the pseudospatial distribution (x, y, z) of apparent resistivity data is shown, where x and y are the coordinates of the surface center of each electrode array and z is the pseudo-depth calculated according to Edwards [29]. The black points show the electrode positions.
Applsci 13 07203 g003
Figure 4. A Google Earth view of landfill no. 6 in Bellolampo, Palermo (Sicily, Italy).
Applsci 13 07203 g004
Figure 5. Electrode array arrangement on the upper surface of the Bellolampo landfill (Palermo, Italy). The electrode locations are indicated by the blue circles. The DEM has a resolution of 0.5 m and was provided by the managers of the wasteland.
Applsci 13 07203 g005
Figure 6. Pseudospatial distribution (x, y, z) of the logarithm of apparent resistivity data, where x and y are the coordinates of the surface center of each electrode array and z is the pseudo-depth calculated according to Edwards [29]. The black dots show the electrode positions.
Applsci 13 07203 g006
Figure 7. Inverse models obtained starting from the model shown in Figure 2 and the nine combinations of electrode areal arrangement and array configuration in Table 1. The black circles shows the electrode positions. The shapes and sizes of the original prisms are represented by red and blue polygons.
Applsci 13 07203 g007
Figure 8. Landfill of Bellolampo: spatial distribution of the normalized sensitivity pattern of the inverse resistivity model. The logarithms of the values are represented. The display is limited to the contents of the landfill.
Applsci 13 07203 g008
Figure 9. Landfill of Bellolampo: 3D rendering of the inverse models of electrical resistivity and induced polarization, limited downward to the landfill contents by the bottom waterproof membrane: (a) log (resistivity) model; (b) log (resistivity) model cut by vertical sections; (c) chargeability model; (d) chargeability model cut by vertical sections.
Applsci 13 07203 g009
Figure 10. Landfill of Bellolampo: 3D rendering of the inverse models of electrical resistivity and induced polarization, limited upward by the waterproof membrane and relating to the bedrock below the landfill: (a) log (resistivity) model; (b) log (resistivity) model cut by vertical sections; (c) chargeability model; (d) chargeability model cut by vertical sections.
Applsci 13 07203 g010
Figure 11. Landfill of Bellolampo: volumes in which the resistivity is less than 3 Ω m, respectively, above (a) and below (b) the waterproofing membrane indicated by the gray grid; volumes in which the chargeability is greater than 300 ms, respectively, above (c) and below (d) the waterproofing membrane.
Applsci 13 07203 g011
Table 1. For each of the nine combinations of electrode areal arrangement and array configuration, the amount of data, the number of current dipoles, and the average amount of potential measurements per current dipole are shown.
Electrode Areal ArrangementElectrode Array ConfigurationAmount of DataNumber of Current DipolesAverage Number of Potential Measures per Current Dipole
A α 72557939
β 858452416
γ 732616046
B α 21,24098021
β 876648018
γ 13,11439069
C α 21,61898222
β 12,73059021
γ 830329328
Table 2. For each of the nine combinations of electrode areal arrangement and array configuration, the volume of resistive and conductive anomalies and their percentage with respect to the original volume of the prisms are shown.
Electrode Areal ArrangementElectrode Array ConfigurationVolume of Resistive Anomalies (m 3 )% of Volume of the Resistive PrismsVolume of Conductive Anomalies (m 3 )% of Volume of the Conductive Prisms
A α 0000
β 0000
γ 0000
B α 11,94037404151
β 76,5812399536119
γ 57,68418010,933137
C α 20,92065616177
β 26,809848916111
γ 43,49213610,125127
Disclaimer/Publisher’s Note: The statements, opinions and data contained in all publications are solely those of the individual author(s) and contributor(s) and not of MDPI and/or the editor(s). MDPI and/or the editor(s) disclaim responsibility for any injury to people or property resulting from any ideas, methods, instructions or products referred to in the content.

