
Research on a Ship Deflection Anti-Collision Method Based on a Water-Jet Interference Flow Field


1
Chongqing Bridge Navigation Safety and Striking Prevention Engineering Technology Research Center, Chongqing Jiaotong University, Chongqing 400074, China
2
National Engineering Technology Research Center for Inland Waterway Improvement, Chongqing Jiaotong University, Chongqing 400074, China
*
Author to whom correspondence should be addressed.
Appl. Sci. 2023, 13(13), 7354; https://doi.org/10.3390/app13137354
Submission received: 24 April 2023
/
Revised: 25 May 2023
/
Accepted: 30 May 2023
/
Published: 21 June 2023
(This article belongs to the Topic AI Enhanced Civil Infrastructure Safety)
Abstract
:Currently, water jets are mainly used in the fields of mechanical processing and mining collection. This paper creatively introduces them to the field of safety assurance for inland navigation. Compared with the traditional bridge anti-striking methods such as intelligent early warning and passive anti-striking, this method can form an “interference zone” by changing the water flow conditions in the local bridge water areas, causing the yawing moment of the yaw ship to change, thereby causing the ship’s course to change, and thus guiding the ship to move away from the bridge pier to realize active anti-striking of the ship. In this paper, a combination of generalized model testing and numerical simulation was used to study the effects of different nozzle pressures and different ship pier distances of the water-jet generator on the trajectory and drift angle of the stalled ship. The results showed that the numerical simulation was in good agreement with the model test results. Within the interference zone, the distance between the ship and the pier increased rapidly after the action of the disturbance zone to 9.1, 5.8, and 6.2 times the ship’s width, respectively, reaching a safe distance. During the process of being affected by the interference zone, the maximum drift angle of the yaw ship was less than 20°, the course of the ship was generally stable, and the drift angle comparison error was a maximum of 10.6%, a minimum of 3.5%, and an average error of 6.7%. A negative peak and a positive peak of four times the absolute value of the negative peak occurred in the yaw-moment ephemeral curve during the ship’s passage through the interference area. The method had a notable effect on the anti-striking of stalled ships and two invention patents applied for in the course of research.
1. Introduction
With the development of the economy, the number and tonnage of inland navigation ships have increased over the years, and striking accidents of ships and bridges have frequently occurred. It has been pointed out by some scholars previously that at least one major ship-bridge striking accident with serious consequences occurred each year on average in the past [1,2,3,4]. Since the major striking accident at the Sunshine Bridge in the United States in 1980 that attracted the attention of the world, bridge-striking prevention has developed rapidly [5]. However, there is still no striking prevention method that can actively intervene in the case of runaway ships to achieve the purpose of reducing and avoiding such traffic accidents. The existing bridge anti-striking measures are passive anti-striking devices and intelligent early warning systems [6]. Passive anti-striking devices reduce the impact force of the ship on the bridge through deformation and energy absorption. They mainly include anti-striking piles, artificial islands, rubber fenders, and anti-striking steel sleeves [7,8,9,10]. As research becomes more advanced, more and more scholars are proposing the use of new materials to increase the crashworthiness of striking avoidance devices and improve their effectiveness. The new prefabricated ultra-high-performance-concrete anti-striking device [11], rubberized concrete [12], fiber-reinforced polymer [13,14,15,16,17,18], and the flexible and composite anti-striking devices [19,20] are too costly, and their durability and application value need to be further explored. This kind of passive anti-striking device has a long construction period, and once a strike occurs, the maintenance and replacement cost is high, which also affects the navigation of the waterway and increases unnecessary risks and losses. For example, on 9 June 2020, a 3000-ton cargo ship hit the No. 18 main pier anti-striking buoy while passing through the Xijiang Bridge in Fengkai, Guangdong, causing damage to the anti-striking buoy, damage to the ship, and large economic losses as shown in Figure 1. By contrast, intelligent early warning systems find the ship’s yaw through monitoring equipment and then warn dangerous ships through whistles, LEDs, or other warning methods [21,22,23]. Du (2018) explored a forward-looking infrared video surveillance system and investigated a ship safety navigation system based on GPS and wireless networking [24]. However, such “powerless” devices can only serve as a warning, cannot actively intervene in the case of out-of-control ships, and ultimately, they still need passive anti-striking devices to protect the bridge. It is necessary to actively intervene in out-of-control ships to avoid striking to fundamentally solve the problem of damage and replacement and maintenance of anti-striking devices, realize lossless protection of ship bridges, and improve bridge anti-striking systems.
In this paper, an anti-striking method based on a water-jet interference flow field is proposed to actively intervene in the course of out-of-control ships to achieve the purpose of anti-striking as shown in Figure 2. This method divides the channel in the bridge area into a “warning area”, an “early warning area”, and an “interference zone” as shown in Figure 3 according to the water flow conditions and channel level of the bridge water areas where the bridge pier is located. A water-jet generator is installed in the interference zone, and a high-precision detector and water flow interference linkage system are deployed on the bridge to monitor the movement tracks in the bridge water areas through the detector. When a yaw ship enters the warning area, the yaw ship is warned by radio, whistle, and other means, and if the ship fails to adjust its course in time and enters the early warning area after the warning and still yaws, the water-jet generator is activated to change the flow of bridge water areas to form an interference zone. A yaw ship entering the interference zone is subject to actions that will change its course, thus achieving anti-striking, reducing risk and loss, and improving the safety of the bridge in the navigable river section. The working principle diagram of the water-jet generator is as follows.
This paper adopts the method of combining generalized model testing and numerical simulation. We conduct 1:100 generalized model tests and two-dimensional numerical simulations of the bridge water areas to study the effects of different nozzle pressures and different ship pier distances of the water-jet generator on the trajectory and drift angle of the stalled ship. The effectiveness of the ship deflection and anti-striking method based on the water-jet interference flow field is demonstrated. By analyzing the change of the ship’s yaw moment, the motion law of the ship under the action of this method is obtained. The research results can provide a basis for the development of safe, efficient, and sustainable ship-bridge striking avoidance technology and equipment.
2. Generalized Model Experiments
2.1. Project Overview
The span of the bridge is 1458 m, and the No. 6 main pier is a double-walled pier, which wades year-round and has the greatest risk of ship striking as shown in Figure 4 [25]. Therefore, for the No. 6 main pier, on the basis of the original passive anti-striking device, a ship deflection and anti-striking method based on a water-jet interference flow field are provided for anti-striking fortification. The bridge elevation, pier type, and anti-striking devices and their dimensions are as follows.
2.2. Generalized Model Test Scale
The geometric scale of this generalized model test is 1:100, and the test-related models are designed according to the orthogonal model, which meets the gravity similarity and geometric similarity criteria to ensure the reliability of the test data. The scale of the physical quantities related to the test is shown in Table 1.
2.3. Model Design
In accordance with the size of the typical navigable ships in the river section [7], a 1000-ton class bulk carrier (full load displacement of about 1500 tons) was selected as the research object. The size of the test ship model (length × width × molded depth) is shown in Figure 5, with a counterweight of 1.5 kg as shown in Figure 6. The water flow conditions of the test are shown in Table 2. The model of the anti-striking device and the pier are made according to the project overview and the test scale, as shown in Figure 7.
The water-jet generator nozzle model consists of 16 nozzles with a diameter of 0.006 m and length of 0.01 m and a main body with a diameter of 0.0075 m and length of 0.266 m. The generator as a whole is composed of a 370-W constant pressure variable frequency supercharger, a water pump, a PVC pipe, and a PVC tee, as shown in Figure 8. Its working principle is that the supercharger absorbs water from the channel downstream of the pier and sends it to the nozzle through the supercharger to spray out.
2.4. Test Model
The generalized model test was carried out in the rectangular section trough of the 30 m × 2 m × 0.9 m sink bottom ratio reduced by 2% in the outdoor test hall of the Chongqing Bridge Navigation Safety and Anti-striking Engineering Technology Research Center. The test area was 6 m long, and the test equipment included a ship model, a pier, an anti-striking device, a water-jet generator, an HD-4B flow velocity meter (range 0.02–6 m/s, ±1.0% ± 1 cm/s), an ultrasonic level meter (range 5 m, blind spot < 0.3 m, ±0.25% FS), a high-pressure pump, and a high-definition camera.
In order to eliminate the impact of waves on the test, a rectifying wall and a wave suppression plate were arranged at the water inlet section. In order to eliminate the impact of shallow water effect on the test [26], the test water depth was controlled to be greater than 0.3 m. In order to eliminate the impact of the bank effects on the ship, the test piers and passive anti-striking devices were arranged at a vertical distance of 0.5 m from the side wall [27]. The water-jet generator was arranged parallel to the side wall of the tank along the direction of water flow, the vertical distance from the side wall was 0.4 m, and the horizontal distance from the bridge pier was 1.5 m. The ultrasonic liquid level gauge was used to monitor the test water depth, the HD-4B non-constant flow rotary slurry flowmeter was used to monitor the flow velocity, and the high-definition cameras were arranged directly above the pier in the test area to record videos of the ship’s trajectory. The plane layout is shown in Figure 9.
2.5. Test Conditions
A ship pier distance of less than or equal to 1.5 D (D is the width of the pier) [28] is a dangerous navigation condition, and it is more dangerous when the ship is launched [29]. Therefore, we chose to simulate the stalled and yawed ship in the case of launching the ship with a ship pier distance of 0.5 D–1.5 D. The test conditions are listed in Table 3.
2.6. Numerical Simulation
In using the Fluent overset grid technology, a two-dimensional numerical simulation was carried out on the motion process of the stalled ship passing through the interference zone after the water-jet generator was turned on, and the ship’s track line and maximum drift angle were compared with the results of the generalized model test.
2.7. Overset Grid Technology
In computational fluid dynamics, the surrounding flow around moving objects introduces significant challenges to the calculations [30]. The method to deal with such problems is mainly the overset grid method. Overset grid technology consists of dividing some objects into grids separately and then nesting them into a set of large grids. Each grid area oversets in space but does not have a connected relationship and exists independently of other grid areas. The difference value is established through pre-processing to transfer the flow field calculation information and establish the connection relationship. Its biggest advantage is that it is beneficial to the grid generation of the relatively moving parts, and it can easily adjust the relative position of the grid and help carry out parametric research [31,32,33,34].
In the calculation iteration process, the local reconstruction method is used to update the unstructured overset grid to ensure the accuracy of the results and to prevent the displacement of the ship motion from being much larger than the grid size during the simulation of the ship motion. The mesh is constantly deformed, resulting in mesh degradation and even negative volume. A double-precision solver is used in the solution process to ensure interpolation accuracy and reduce computer rounding errors.
2.8. Renormalization Group (RNG) k-ε Turbulence Model
As different turbulence models use different assumptions and derivations, they have their own scope of application. In order to obtain more accurate simulation results, the standard k-ε turbulence model does not reflect this flow well because of the high anisotropy of the jet. Yakhot and Orszag [35,36] introduced the Renormalization Group approach to turbulence studies and developed a new turbulence model, the RNG k-ε turbulence model, which, compared to the standard k-ε turbulence model, corrects the turbulent dynamic viscosity coefficients, takes into account the effect of eddies on turbulence as well as rotational and rotational flows in the mean flow, which helps the model to make better predictions of the effects of transient flows and streamline bending, and improves the accuracy of eddies [37,38] and the accuracy of high-speed flow calculations. The flow control equations and the RNG k-ε turbulence model are as follows:
Continuity equation
where: is the time in s; is the velocity of the water in ; is the density of the water in .
Momentum equation
where: is the pressure in Pa, is the molecular dynamics viscosity coefficient, is turbulent viscosity coefficient, , .
The turbulence model RNG k-ε equations are shown below:
where: is turbulent kinetic energy,
where: is the turbulent dissipation rate, ,
2.9. Numerical Simulation Pre-Processing
In Fluent-DM, a calculation domain was established to simulate the test area. The bridge pier is positioned 50 m from the side wall and 300 m from the left boundary of the test area. The water-jet generator is positioned 40 m from the side wall and 180 m from the left boundary. The X-axis is the direction of the main flow, and the ship position is 80 m from the water-jet generator to start the generator. The layout is the same as the generalized model test as shown in Figure 10, and the simulation conditions are shown in Table 4. The detailed parameters of the numerical model ship are shown in Table 5.
2.10. Grid-Independence and Time-Independence Verification
The number of grids was chosen as the validation group of about 4.69 million, 5.57 million, 6.42 million, and 7.39 million. When the number of grids in the whole area was around 4.69 million, there was a significant difference from the peak yaw moment data for the other groups. However, when the number of grids in the whole area was more than about 5.57 million, the peak data of drift angle made little difference. Therefore, in this paper, a grid number of 5.57 million was chosen to verify the time independence of the selected grid numbers according to the time steps of 0.01 s, 0.001 s and 0.0001 s. The main objective of this study is to verify the effect of a water-jet device on a yawing ship. At this grid number, the time step has little effect on the motion track line, and 0.01 s is chosen as the numerical simulation time step in order to save calculation time.
2.11. Boundary Conditions and Meshing
We describe the refining of the peripheral mesh of the nozzle of the water-jet generator. The velocity boundary condition was used at the entrance of the flume, the pressure boundary condition was used at the water-jet nozzle, and the no-slip boundary condition was used at the solid wall boundary. We set the area as one times the width of the ship around the ship as the foreground grid and set the grid growth rate as 1.2 to 20 layers, with a total of 1.28 million grids. The total number of background grids was 4.29 million, and the number of global grids was 5.57 million. The grid division of the test area is shown in the Figure 11.
3. Comparative Studies
3.1. Comparison of Ship Deflection Effects
The generalized model test’s T1 condition was selected, and the numerical simulation T10 condition was compared with the three groups of time when the ship passes through the interference zone. The comparison interval was chosen to be the period of travel between the deflection of the ship by the action of the interference zone and the creation of a sufficiently safe distance between the bridge pier, as shown in Figure 12. At time 1, the ship approaches the interference zone. At time 2, the ship as whole moves away from the pier through the interference zone, At time 3, the ship’s course returns to normal.
3.2. Tracks Line
3.2.1. Model Test Tracks Line
We used the background difference method to collect the ship tracks line. In each condition, the ship conducted five tests with the same initial conditions. After processing the video data of each working condition, the image was exported, and the pixels of the bow and stern were read and converted into a natural coordinate system by taking the mean value of the five experiments and drawing it into a graph. The ship tracks line diagrams under the nine groups of conditions are shown in Figure 13, Figure 14 and Figure 15.
3.2.2. Model Experiments and Numerical Simulation of the Trace Line Comparison
After the calculation result of Fluent was post-processed, the exported image was scaled to be similar to the pixel size of the model test model and converted into a natural coordinate system to draw a graph. The results show that the deflection law of the ship passing the interference zone was basically similar. Here, only the comparison of the trajectories under the three nozzle pressures under the most dangerous working condition with a pier distance of 0.5 D is shown (Figure 16, Figure 17 and Figure 18).
Comparison of the ship track lines shows that the effective sideways movement of the yaw ship by the action of the intervention zone is 9.1 times, 5.8 times, and 6.2 times the width of the ship. The maximum error in the initial deflection position of the ship is 16.5% in the horizontal coordinates and 4.4% in the vertical coordinates; the maximum error in the farthest deflection position is 15.8% in the horizontal coordinates and 8.3% in the vertical coordinates.
3.3. Maximum Drift Angle of the Ship
The maximum drift angle of a ship can reflect the response attitude of the ship under the action of the interference zone of different intensities. It is used to measure whether the ship’s navigation status is safe [39]. The maximum drift angle of the ship in each group of conditions was the average value of five tests.
3.4. Generalized Model Test
In the generalized model test, the maximum drift angle range of 6.8°–19.6° under the nine conditions of the ship was less than 20°, and the drift angle of the ship was the largest in the T3 working conditions, as shown in the Figure 19.
3.5. Comparison of Maximum Drift Angle between the Model Test and Numerical Simulation
The maximum drift angle range of 5.3°–18.9° in the numerical simulation of the nine working conditions was less than 20°, and the drift angle of the ship was the largest in the T12 working conditions. The comparison chart is as shown in the Figure 20.
From the above comparison graph of the maximum drift angle of the ship from the model test and numerical simulation, it can be observed that the working condition comparison groups with the largest error are T4 and T14, with a maximum error of 10.6%, the working condition comparison groups with the smallest error are T3 and T12 with a minimum error of 3.5%, and the drift angle errors for the remaining comparison groups are all below 10%, with an average error of 6.7%.
3.6. Yaw Moment
During the Fluent simulation process, the moment monitor was turned on to monitor the yaw moment of the ship, and the total simulation time was 100 s. We imported the obtained data into the Origin software and processed it with the FFT filter. The variation of the yaw moment along the journey was compared with the same ship pier distance and different nozzle pressure conditions, as shown in Figure 21, Figure 22 and Figure 23 below.
4. Results and Simulation
The error caused by the pixel scale of the picture, the deflection position, and the maximum drift angle of the ship by the interference zone in the generalized model test and the numerical simulation were not the same, but the agreement was high. Analysis of the ship’s yaw-moment ephemeral curve showed that the ship was deflected to the generator nozzle by the negative pressure zone of the generator nozzle, and the yaw moment produced a negative peak. Then, the ship was rapidly displaced away from the bridge pier by the interference zone, and the yaw moment had a positive peak, similar to the results of [40,41]. The movement of a yaw ship through the interference zone is divided into four main stages, and three groups of examples are shown in Figure 24, Figure 25 and Figure 26.
- Stage 1: The ship is close to the interference zone and influenced by the difference of the velocity and negative pressure zone in the boundary layer of the interference zone, resulting in a negative yaw moment in the clockwise direction and a small deflection of the ship toward the nozzle of the water-jet generator as shown in Figure 24a, Figure 25a and Figure 26a, respectively.
- Stage 2: The stage where the deflection force of the ship away from the pier is generated. At this stage, the ship is subjected to the interference zone to generate a positive yaw moment in the counterclockwise direction, the yaw moment from the negative peak rapidly increases, and the ship deflects away from the pier as shown in Figure 24b, Figure 25b and Figure 26b, respectively.
- Stage 3: In the supplementary stage of the deflection force of the ship away from the pier, the ship is affected by the interference zone and the inertia of the second stage, and the overall hull drifts away from the pier. During this process, the ship’s yaw moment reaches a positive peak and then decreases rapidly as shown in Figure 24c, Figure 25c and Figure 26c, respectively.
- Stage 4: In this stage of the ship attitude’s adjustment, affected by the energy attenuation of the interference zone, the difference in the deflection moment between the yaw and stern makes the ship’s drift angle decrease, and its course gradually returns to normal. At this time, the ship has moved away from the pier as shown in Figure 24d, Figure 25d and Figure 26d, respectively.
5. Conclusions
The ship track lines and the ship’s maximum drift angle in the numerical simulation and the generalized model test were in good agreement.
The effect of the interference zone on the yaw ship produces an effective lateral shift distance of 9.1, 5.8, and 6.2 times the ship’s width, respectively. The maximum error in the ship’s initial offset position is 16.5% in horizontal coordinates and 4.4% in vertical coordinates, and the maximum error in the maximum offset position is 15.8% in horizontal coordinates and 8.3% in vertical coordinates.
During the process of being affected by the interference zone, the maximum drift angle of the yaw ship was less than 20°, the course of the ship was generally stable, and the drift angle comparison error was a maximum of 10.6%, a minimum of 3.5% and an average error of 6.7%. During the movement of the stalled ship through the interference zone, a negative peak and a positive peak appeared in the ephemeral curve of the ship’s yaw moment, and the absolute value of the positive peak was about four times the absolute value of the negative peak. The ship was affected by the negative pressure area of the generator nozzle was the main source of the negative peak. The interference zone’s effect of displacement of the ship away from the pier was the main source of the positive peak.
The ship deflection anti-striking method based on the water-jet interference flow field had a significant impact on the ship’s motion state, and the distance between the stalled ship and the pier rapidly increased to a safe distance within the interference zone of anti-striking.
We verified the results by numerical simulation and generalized model testing. The method can substantially reduce the risk and loss of ships colliding with bridges and improve the safety level of ship bridges in navigable river sections. The results can provide a basis for the development of safe, efficient, and sustainable ship bridge non-destructive anti-striking technology and equipment and improve bridge anti-striking systems.
6. Patents
A three-in-one method for preventing boat collisions on wading pier (CN114934481A). A bridge active anti-ship collision method (CN114973771A).
Author Contributions
Conceptualization, H.W. and K.Y.; Methodology, H.W. and K.Y.; Software, H.W. and B.P.; Validation, H.W.; Formal analysis, H.W. and X.L.; Investigation, K.Y.; Writing and original draft preparation, H.W. and X.L.; Writing—review and editing, H.W. and B.P. All authors have read and agreed to the published version of the manuscript.
Funding
Chongqing Talent Program Innovation and Entrepreneurship Demonstration Team (CQYC201903204). National Natural Science Foundation of China (51708068). Chongqing Postgraduate Mentoring Team Construction Project (JDDSTD2022009).
Institutional Review Board Statement
Not applicable.
Informed Consent Statement
Informed consent was obtained from all subjects involved in the study.
Data Availability Statement
Data are contained within the article.
Conflicts of Interest
The authors declare no conflict of interest.
References
- Perera, L.P.; Soares, C.G. Striking risk detection and quantification in ship navigation with integrated bridge systems. Ocean Eng. 2005, 109, 344–354. [Google Scholar] [CrossRef]
- Manen, S.E.; Frandsen, A.G. Ship collision with bridges, review of accidents. In Ship Striking Analysis; Gluver, H., Olsen, D., Eds.; Balkema: Rotterdam, The Netherlands, 1998; pp. 3–11. [Google Scholar]
- Larsen, O.D. Ship Collision with Bridges, the Interaction between Vessel Traffic and Bridge Structures; IABSE: Zuerich, Switzerland, 1993. [Google Scholar]
- Jiang, H.; Chorzepa, M.G. Case Study: Evaluation of a Floating Steel Fender System for Bridge Pier Protection against Vessel Collision. J. Bridge Eng. 2016, 21, 05016008. [Google Scholar] [CrossRef]
- Yu, G.; Gan, W. Study on the probability model of ship-bridge collision. IOP Conf. Series Earth Environ. Sci. 2021, 783, 012157. [Google Scholar] [CrossRef]
- Shen, Z. A review of the research progress of bridge anti-ship collision measures. Transp. Sci. Technol. 2015, 270, 73–76. [Google Scholar]
- Simonsen, B.C.; Ottesen-Hansen, N. Protection of Marine Structures by Artificial Islands. In Ship Collision Analysis—Proceedings of the International Symposium on Advances in Ship Collision Analysis, Copenhagen, Denmark, 10–13 May 1998; Routledge: London, UK, 1998; pp. 201–215. [Google Scholar]
- Svensson, H. Protection of bridge piers against ship collision. Steel Constr. 2009, 2, 21–32. [Google Scholar] [CrossRef]
- Li, R. Analysis of the current situation of the research on the main collision prevention measures of bridges. Sichuan Cem. 2021, 294, 242–243. [Google Scholar]
- AASHTO. Guide Specifications and Commentary for Vessel Collision Design of Highway Bridges, 2nd ed.; AASHTO: Washington, DC, USA, 2009. [Google Scholar]
- Zhou, L.; Li, H.; Wei, J.; Pu, X.; Mahunon, A.D.; Jiang, L. Design and simulation analysis of a new type of assembled UHPC collision avoidance. Appl. Sci. 2020, 10, 4555. [Google Scholar] [CrossRef]
- Liu, B.; Yang, S.; Li, W.; Zhang, M. Damping dissipation properties of rubberized concrete and its application in anti-collision of bridge piers. Constr. Build. Mater. 2020, 236, 117286. [Google Scholar] [CrossRef]
- Voyiadjis, G.Z.; El-Tawil, S.; Kocke, P.J. Feasibility of Tubular Fender Units for Pier Protection against Vessel Collision; Louisiana Transportation Research Center: Baton Rouge, LA, USA, 2008. Available online: https://rosap.ntl.bts.gov/view/dot/22324 (accessed on 1 August 2008).
- Hollaway, L.C. A review of the present and future utilisation of FRP composites in the civil infrastructure with reference to their important in-service properties. Constr. Build Mater 2010, 24, 2419–2445. [Google Scholar] [CrossRef]
- Fang, H.; Sun, H.; Liu, W.; Wang, L.; Bai, Y.; Hui, D. Mechanical performance of innovative GFRP-bamboo-wood sandwich beams: Experimental and modelling investigation. Compos. B Eng. 2015, 79, 182–196. [Google Scholar] [CrossRef]
- Bakis, C.E.; Bank Lawrence, C.; Brown, V.L.; Cosenza, E.; Davalos, J.F.; Lesko, J.J.; Machida, A.; Rizkalla, S.H.; Triantafillou, T.C. Fiber reinforced polymer composites for Construction—State-of-the-Art review. J. Compos. Construct. 2002, 6, 73–87. [Google Scholar] [CrossRef] [Green Version]
- Kafodya, I.; Xian, G.; Li, H. Durability study of pultruded CFRP plates immersed in water and seawater under sustained bending: Water uptake and effects on the mechanical properties. Compos. B Eng. 2015, 70, 138–148. [Google Scholar] [CrossRef]
- Sha, Y.; Hao, H. Laboratory tests and numerical simulations of CFRP strengthened RC pier subjected to barge impact load. Int. J. Struct. Stab. Dyn. 2015, 15, 1450037. [Google Scholar] [CrossRef]
- Jiang, P.-F.; Wang, P.-F.; Cao, H.-F.; Wang, F. Research on new flexible bridge pier anti-collision technology. IOP Conf. Ser. Earth Environ. Sci. 2020, 565, 012091. [Google Scholar] [CrossRef]
- Zhu, L.; Liu, W.; Fang, H.; Chen, J.; Zhuang, Y.; Han, J. Design and simulation of innovative foam-filled Lattice Composite Bumper System for bridge protection in ship collision. Compos. B. Eng. 2019, 157, 24–35. [Google Scholar] [CrossRef]
- Sanna, A.; Lamberti, F. Advances in target detection and tracking in Forward-Looking InfraRed (FLIR) imagery. Sensors 2014, 14, 20297–20303. [Google Scholar] [CrossRef] [Green Version]
- Wang, S.; Ren, H.; Yun, X.; Yan, X.-F.; Dan, D.-H. Active anti-collision system for navigable bridges and its performance analysis. China J. Highw. 2012, 25, 94–100. [Google Scholar]
- Hu, C.; Cui, W. A review of ship collision mechanism and crashworthy structure design. Ship Mech. 2005, 2, 131–142. [Google Scholar]
- Du, D. Study on the bridge-waters area ship safety collision avoidance navigation system. In Proceedings of the 2018 Chinese Control And Decision Conference (CCDC), Shenyang, China, 9–11 June 2018; pp. 3603–3606. [Google Scholar] [CrossRef]
- Mao, D. Research on the Effect of Anti-Ship Collision Device on Ship Navigation in Mountainous Curved River Section. Master’s Thesis, Chongqing Jiaotong University, Chongqing, China, 2021. [Google Scholar]
- Raven, H.C. Shallow-water effects in ship model testing and at full scale. Ocean Eng. 2021, 189, 106343. [Google Scholar] [CrossRef]
- Yao, J. Numerical Study on Bank Effects for a Ship Sailing along a Bank. Master’s Thesis, Shanghai Jiaotong University, Shanghai, China, 2010. [Google Scholar]
- Tan, Z.; Wang, Y.; Wang, H.; Wang, Z.; Chen, B. Quantitative analysis of the effect of bridge pier turbulence on ship bow rocking moment. J. Wuhan Univ. Technol. 2022, 46, 371–376. [Google Scholar]
- Razgallah, I.; Kaidi, S.; Smaoui, H.; Sergent, P. The impact of free surface modelling on hydrodynamic forces for ship navigating in inland waterways: Water depth, drift angle, and ship speed effect. J. Mar. Sci. Technol. 2019, 24, 620–641. [Google Scholar] [CrossRef]
- Chan, W.M. Overset grid technology development at NASA Ames Research Center. Comput. Fluids 2009, 38, 496–503. [Google Scholar] [CrossRef]
- Salim, S.M.; Buccolieri, R.; Chan, A.; Di Sabatino, S. Numerical simulation of atmospheric pollutant dispersion in an urban street canyon: Comparison between RANS and LES. J. Wind Eng. Ind. Aerodyn. 2011, 99, 103–113. [Google Scholar] [CrossRef]
- Shen, Z. Numerical Method Study of Overlapping Mesh Technique for Ship Paddle-Rudder Interaction. Ph.D. Thesis, Shanghai Jiaotong University, Shanghai, China, 2014. [Google Scholar]
- van Hooff, T.; Blocken, B.; Tominaga, Y. On the accuracy of CFD simulations of cross-ventilation flows for a generic isolated building: Comparison of RANS, LES and experiments. Build. Environ. 2017, 114, 148–165. [Google Scholar] [CrossRef]
- Wang, J.; Wan, D.-C. Numerical simulation of pure rocking head motion of a ship based on overlapping mesh technique. Hydrodynam. Res. Prog. 2016, 31, 567–574. [Google Scholar]
- Shi, Z.; Jin, S. Numerical Investigation of Hydrodynamics in a U-Shaped Open Channel Confluence Flow with Partially Emergent Rigid Vegetation. Water 2022, 14, 4027. [Google Scholar] [CrossRef]
- Yu, S.; Dai, H.; Zhai, Y.; Liu, M.; Huai, W. A Comparative Study on 2D CFD Simulation of Flow Structure in an Open Channel with an Emerged Vegetation Patch Based on Different RANS Turbulence Models. Water 2022, 14, 2873. [Google Scholar] [CrossRef]
- Yakhot, V.; Smith, L.M. The renormalization group, the ɛ-expansion and derivation of turbulence models. J. Sci. Comput. 1992, 7, 35–61. [Google Scholar] [CrossRef]
- Yakhot, V.; Orszag, S.A.; Thangam, S.; Gatski, T.B.; Speziale, C.G. Development of turbulence models for shear flows by a double expansion technique. Phys. Fluids A Fluid Dyn. 1992, 4, 1510–1520. [Google Scholar] [CrossRef] [Green Version]
- Sun, Y. Ship Maneuverability; Harbin Engineering University Press: Harbin, China, 2019. [Google Scholar]
- Ke, X. Study on the Impact of Water Flow Navigation in the Bridge Section of the Navigation Channel. Master’s Thesis, Southeast University, Chongqing, China, 2019. [Google Scholar]
- Qian, D. Study on the Interaction Mechanism between Water Flow Structure around Bridge Piers and Ships. Master’s Thesis, Changsha University of Technology, Changsha, China, 2013. [Google Scholar]
Figure 1.
Scene of the ship striking accident at the Fengkai Bridge.
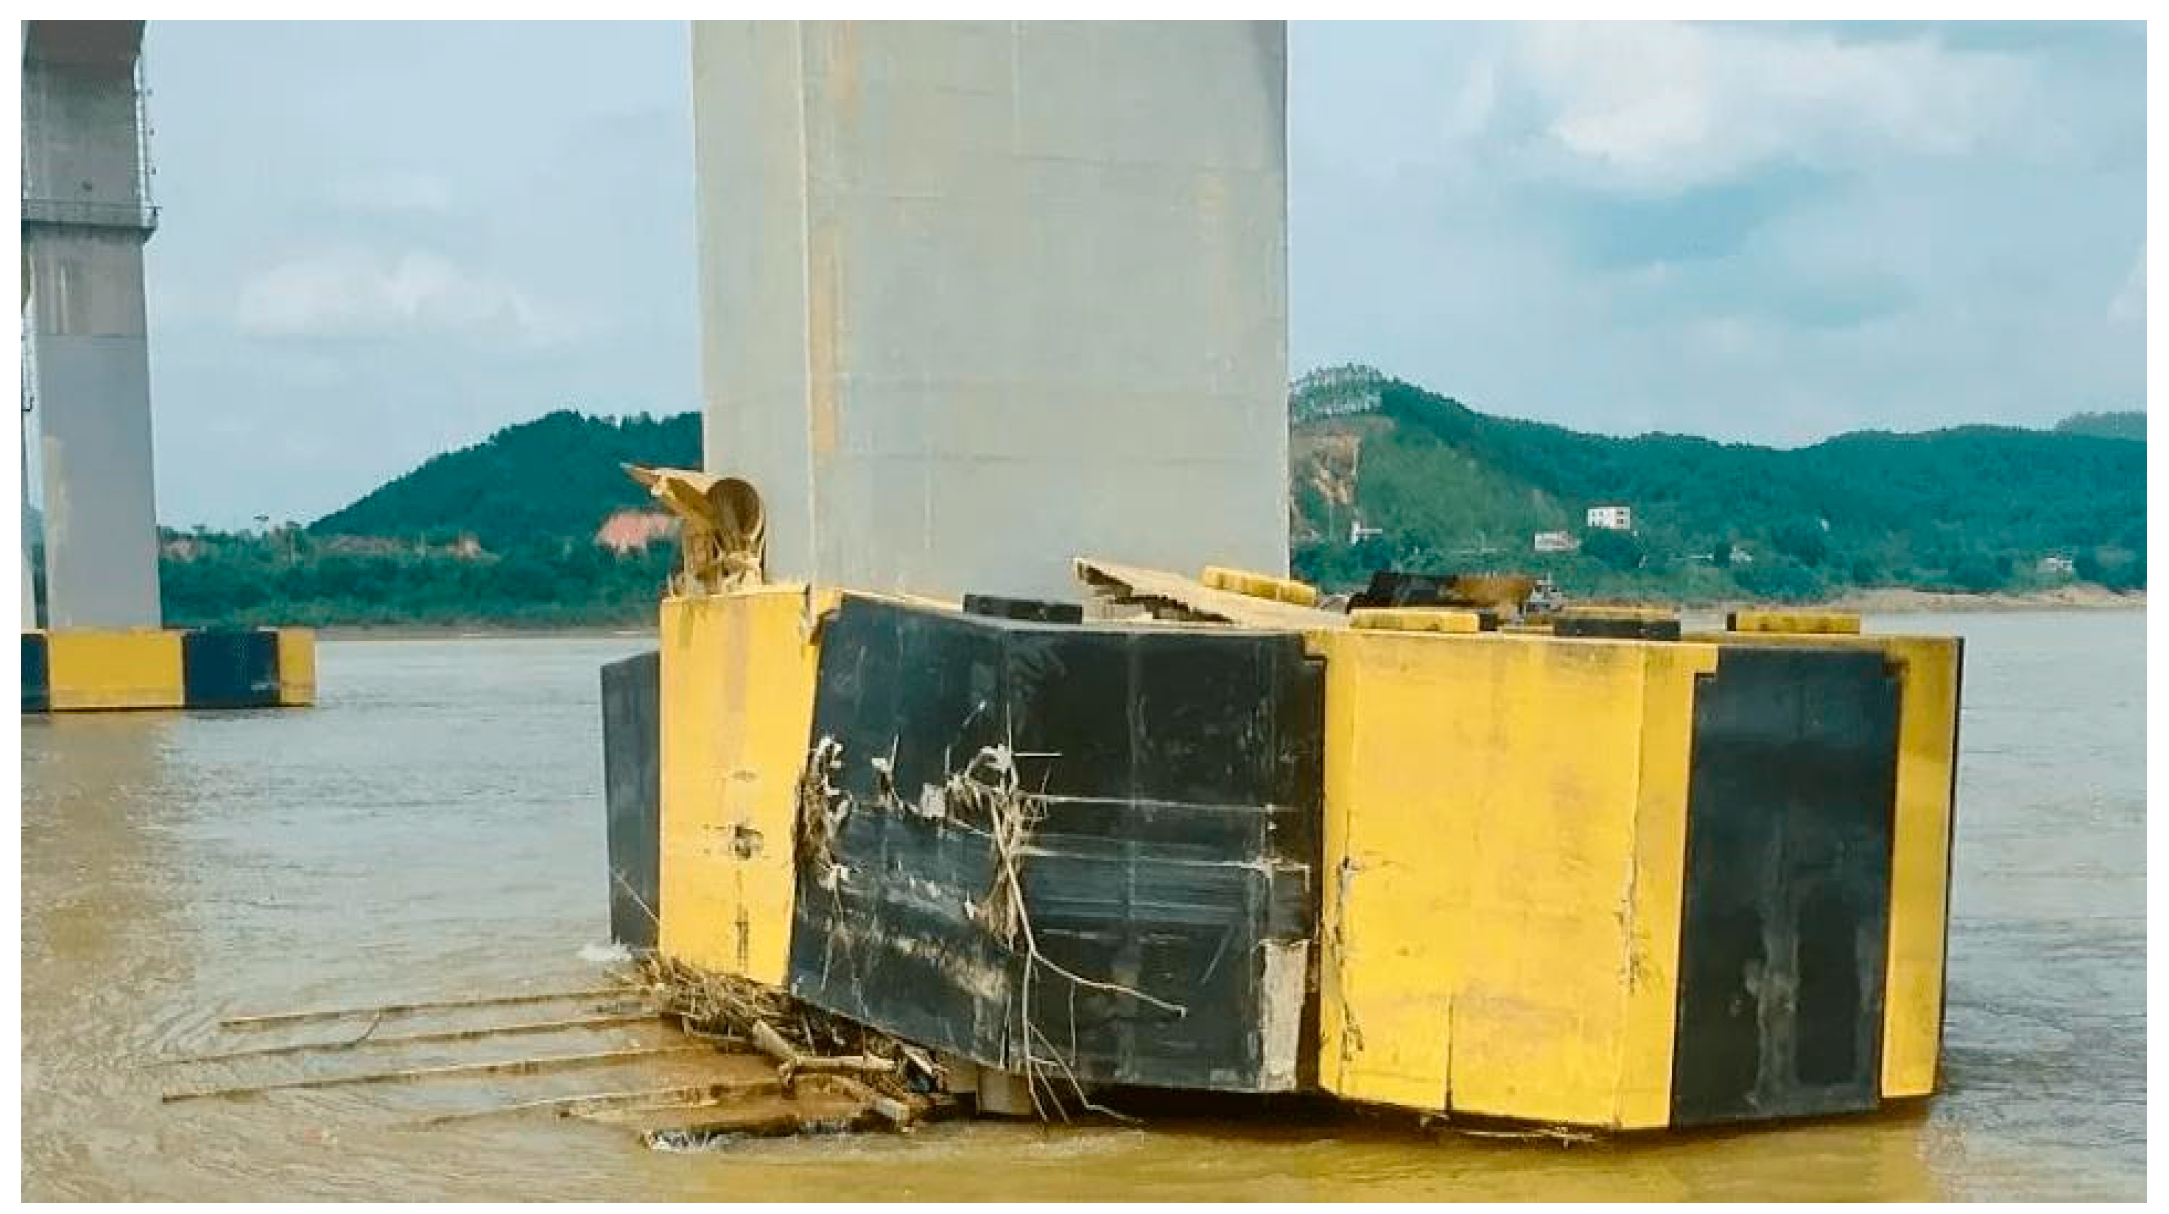
Figure 2.
Working principle of the water-jet generator.
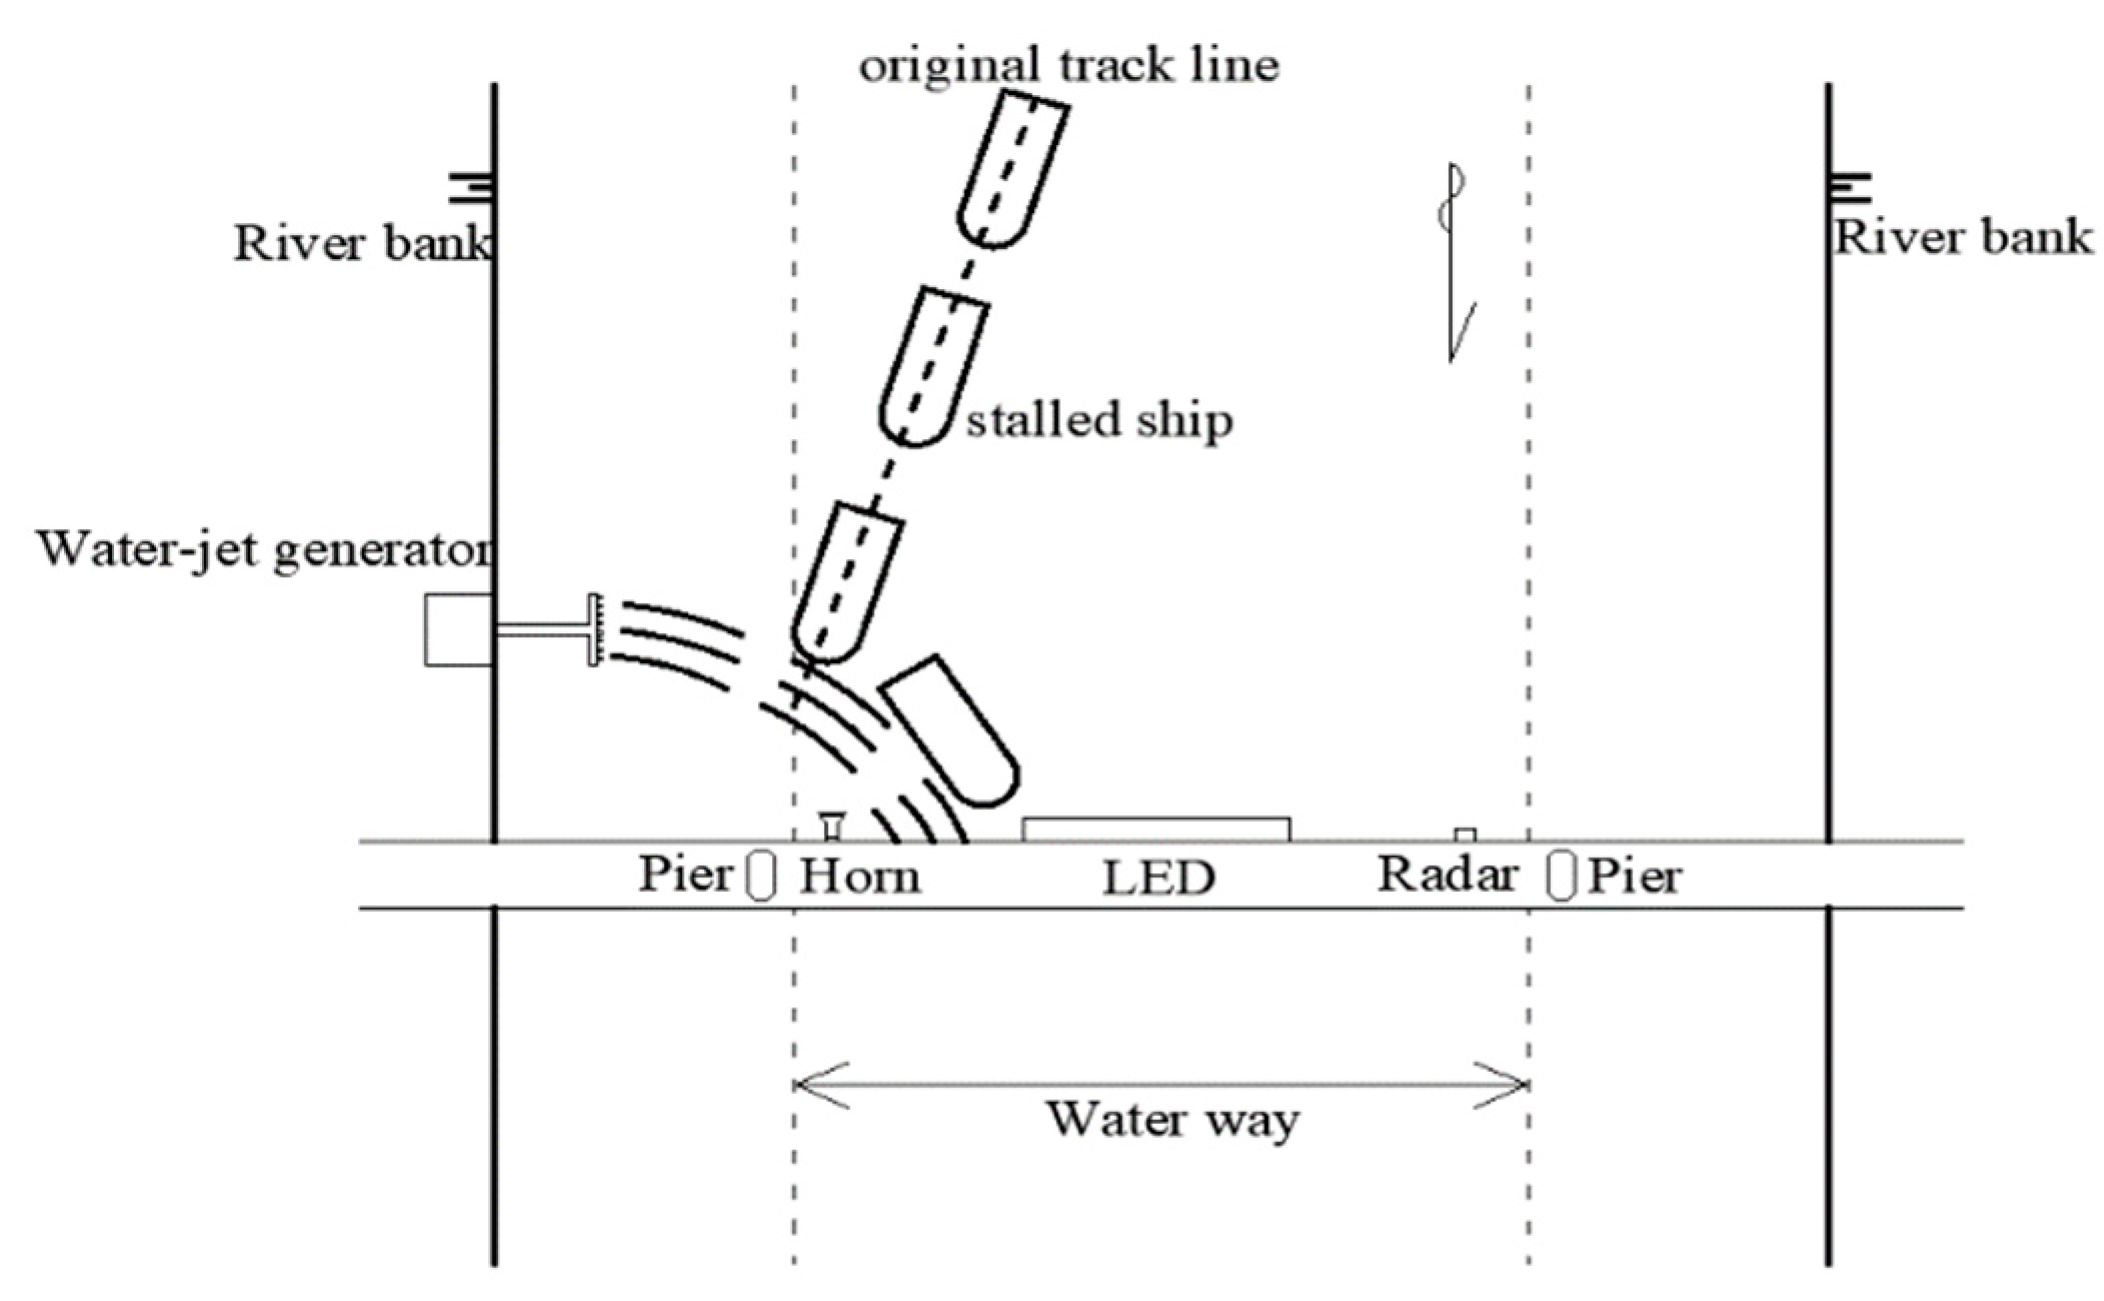
Figure 3.
Regional division.

Figure 4.
Elevation of the bridge.
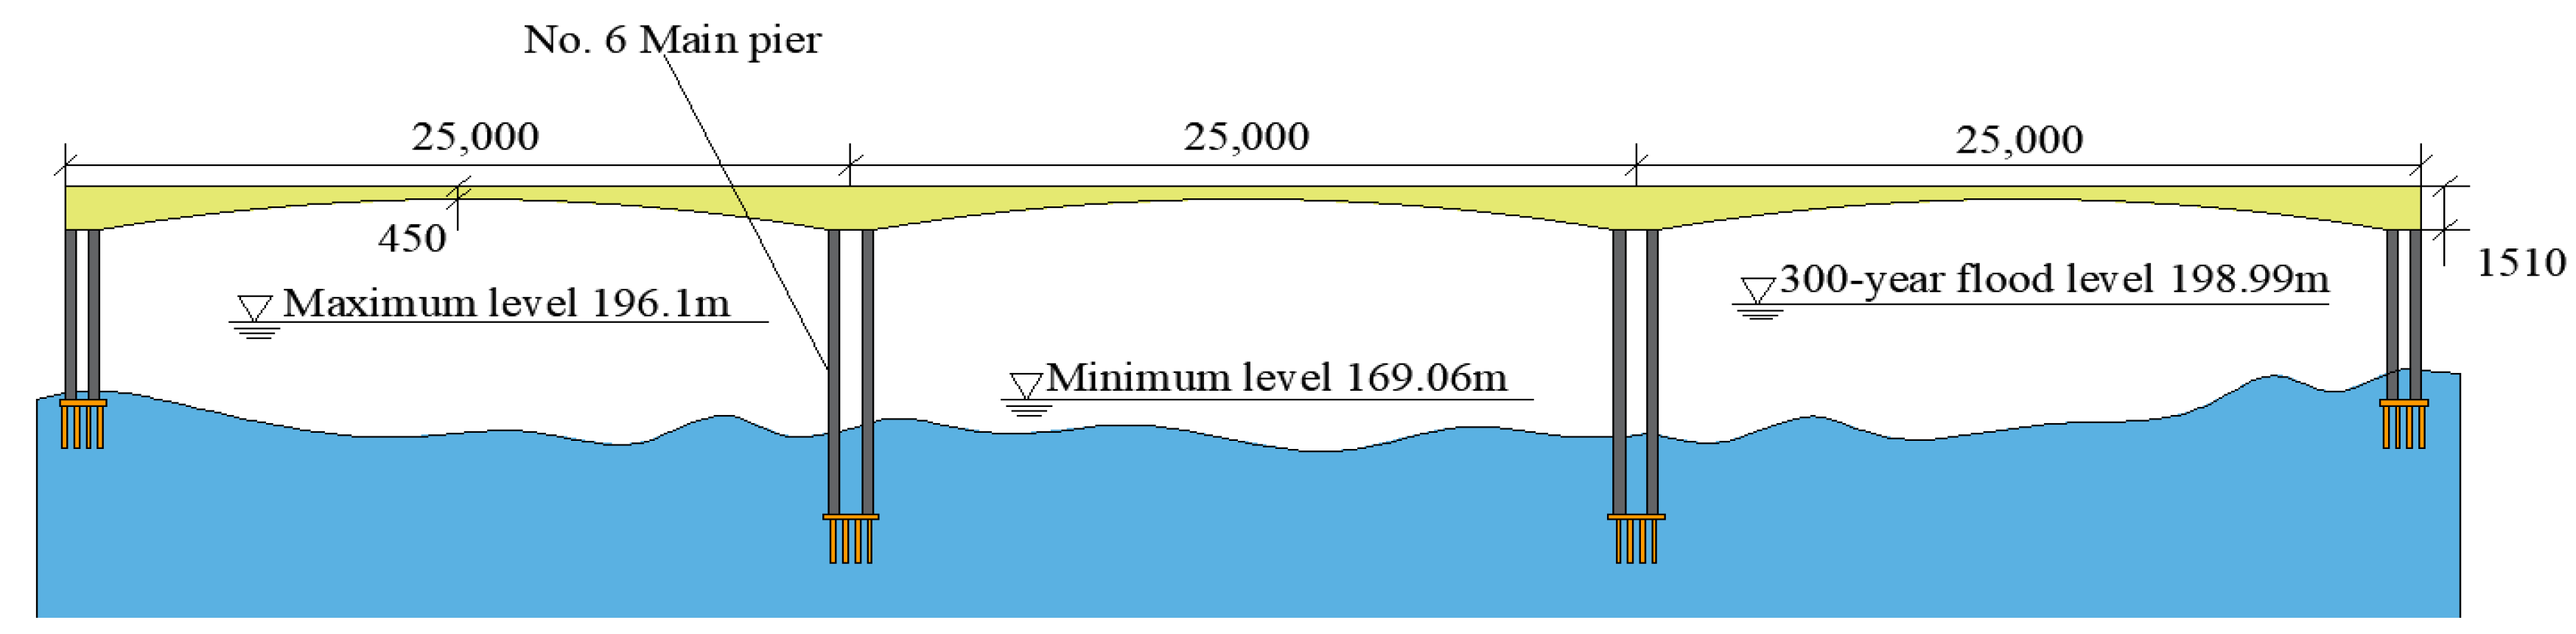
Figure 5.
Bridge piers scale.

Figure 6.
Test ship model.
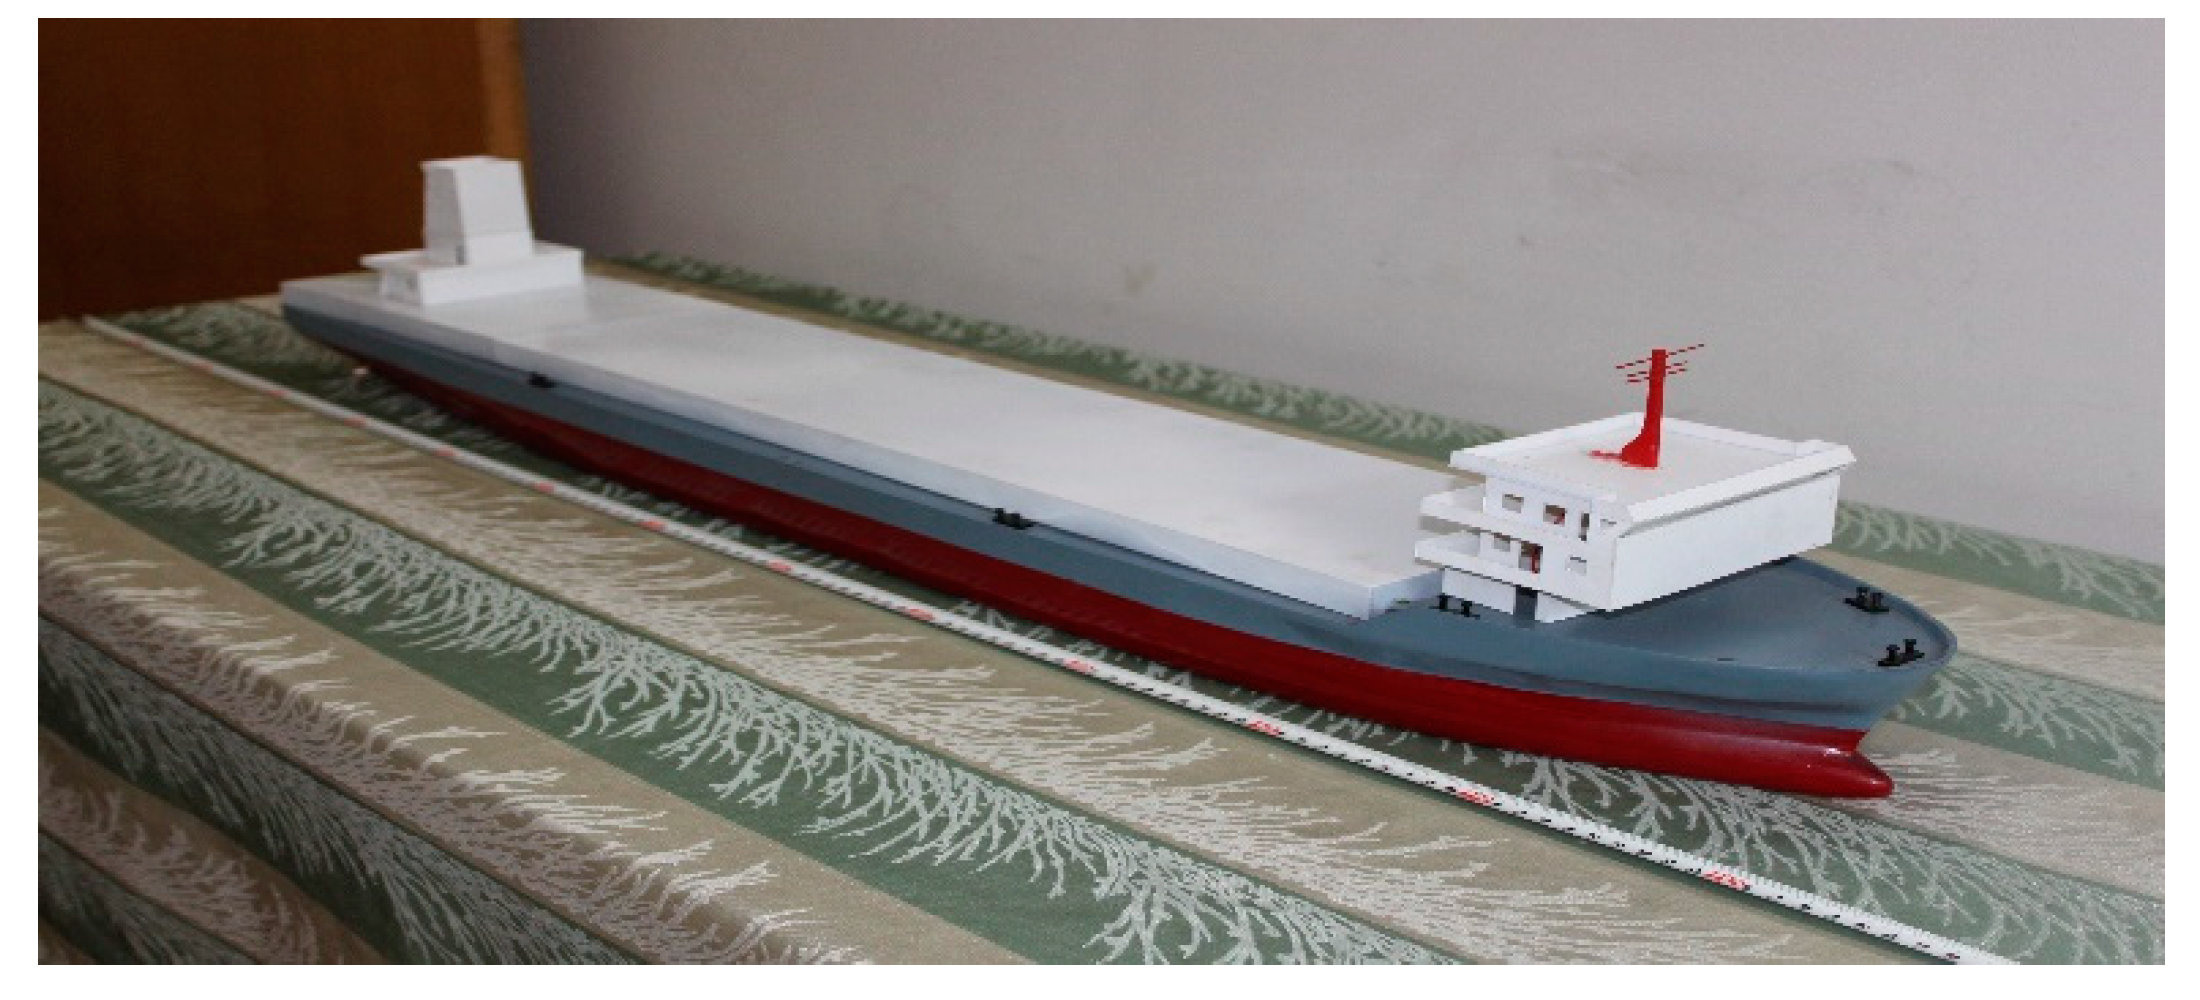
Figure 7.
Model of bridge piers and anti-striking devices: (a) Model drawing of the anti-striking device; (b) Bridge pier model drawing.
Figure 7.
Model of bridge piers and anti-striking devices: (a) Model drawing of the anti-striking device; (b) Bridge pier model drawing.
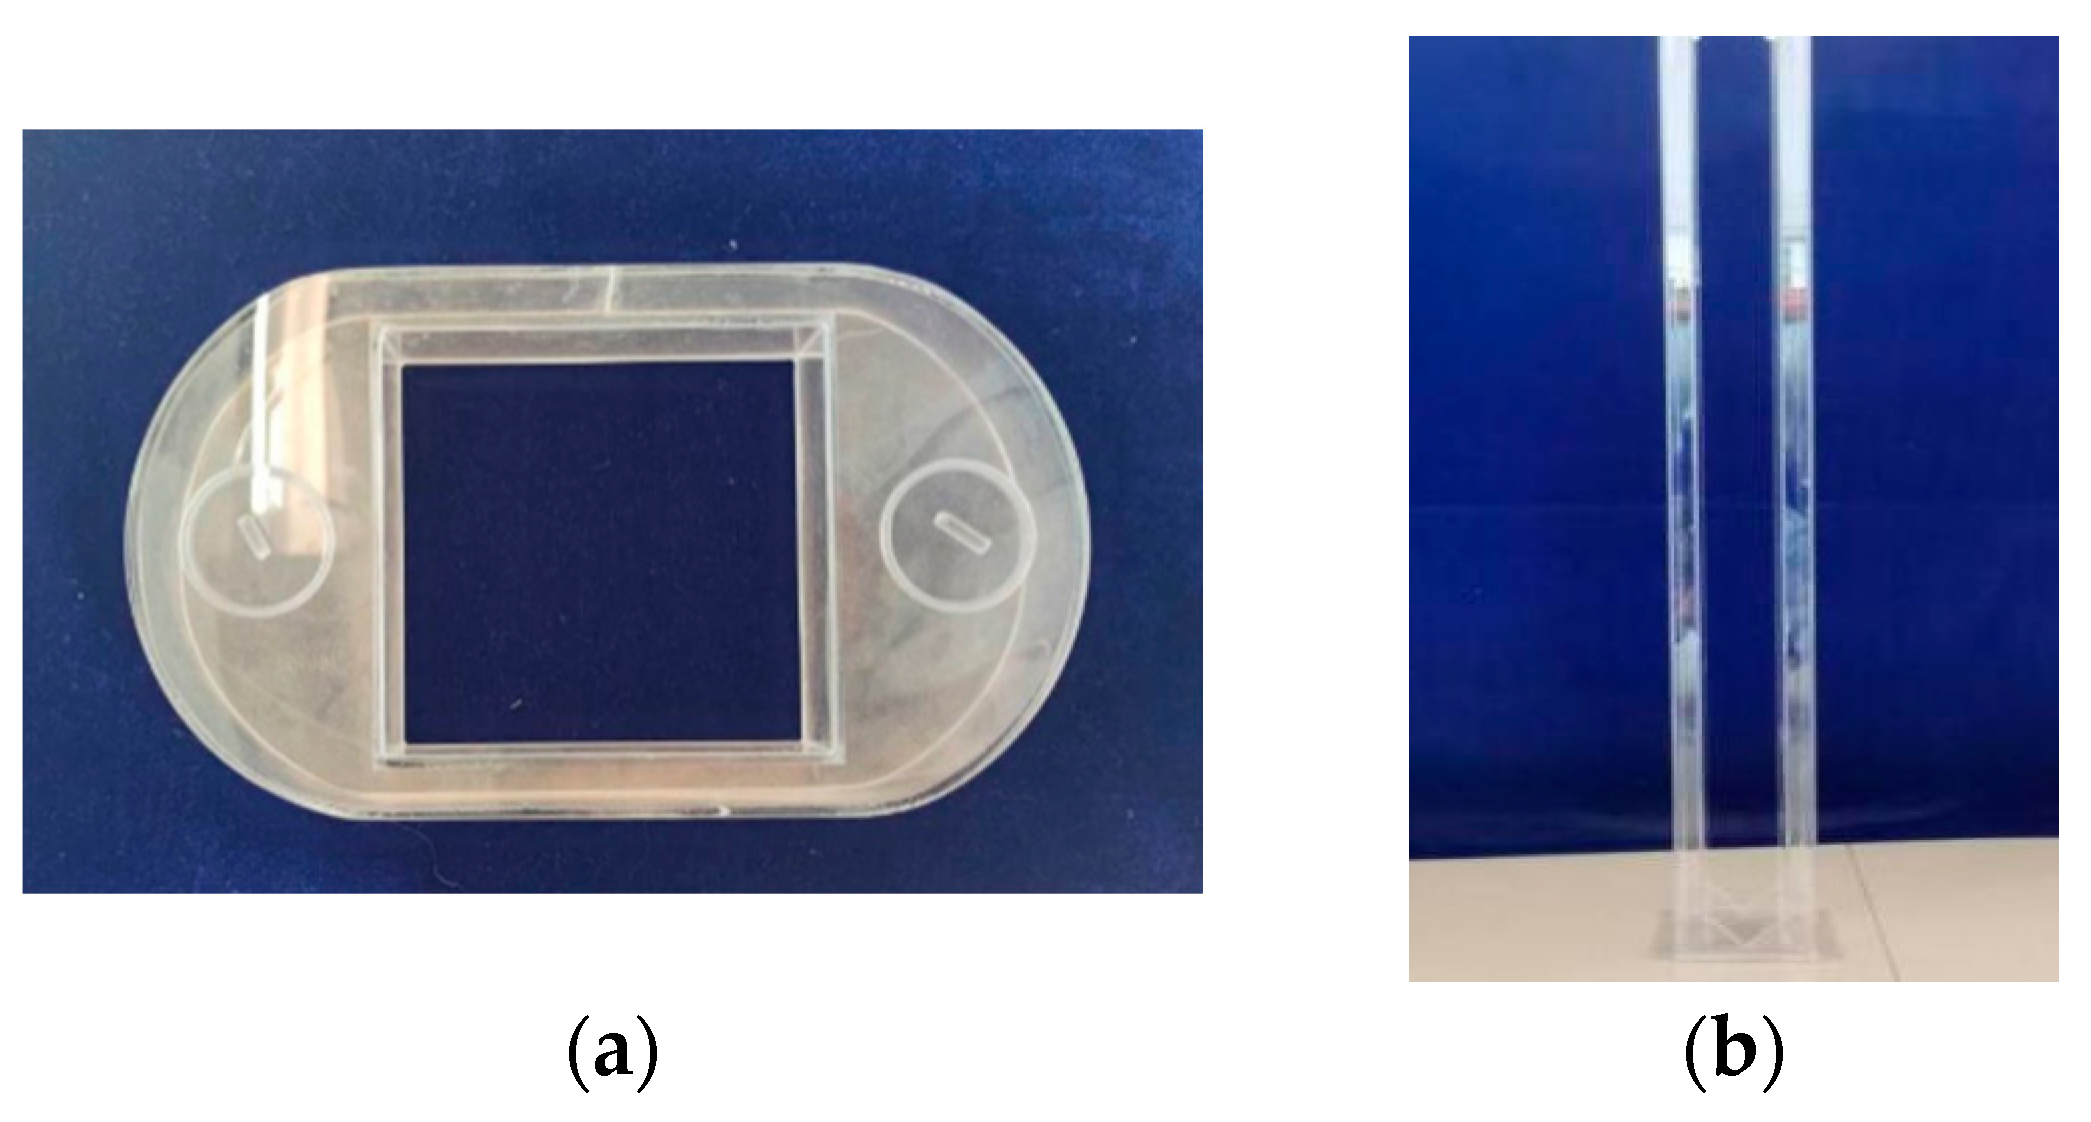
Figure 8.
The overall structure of the water-jet generator.

Figure 9.
Generalized model test layout.
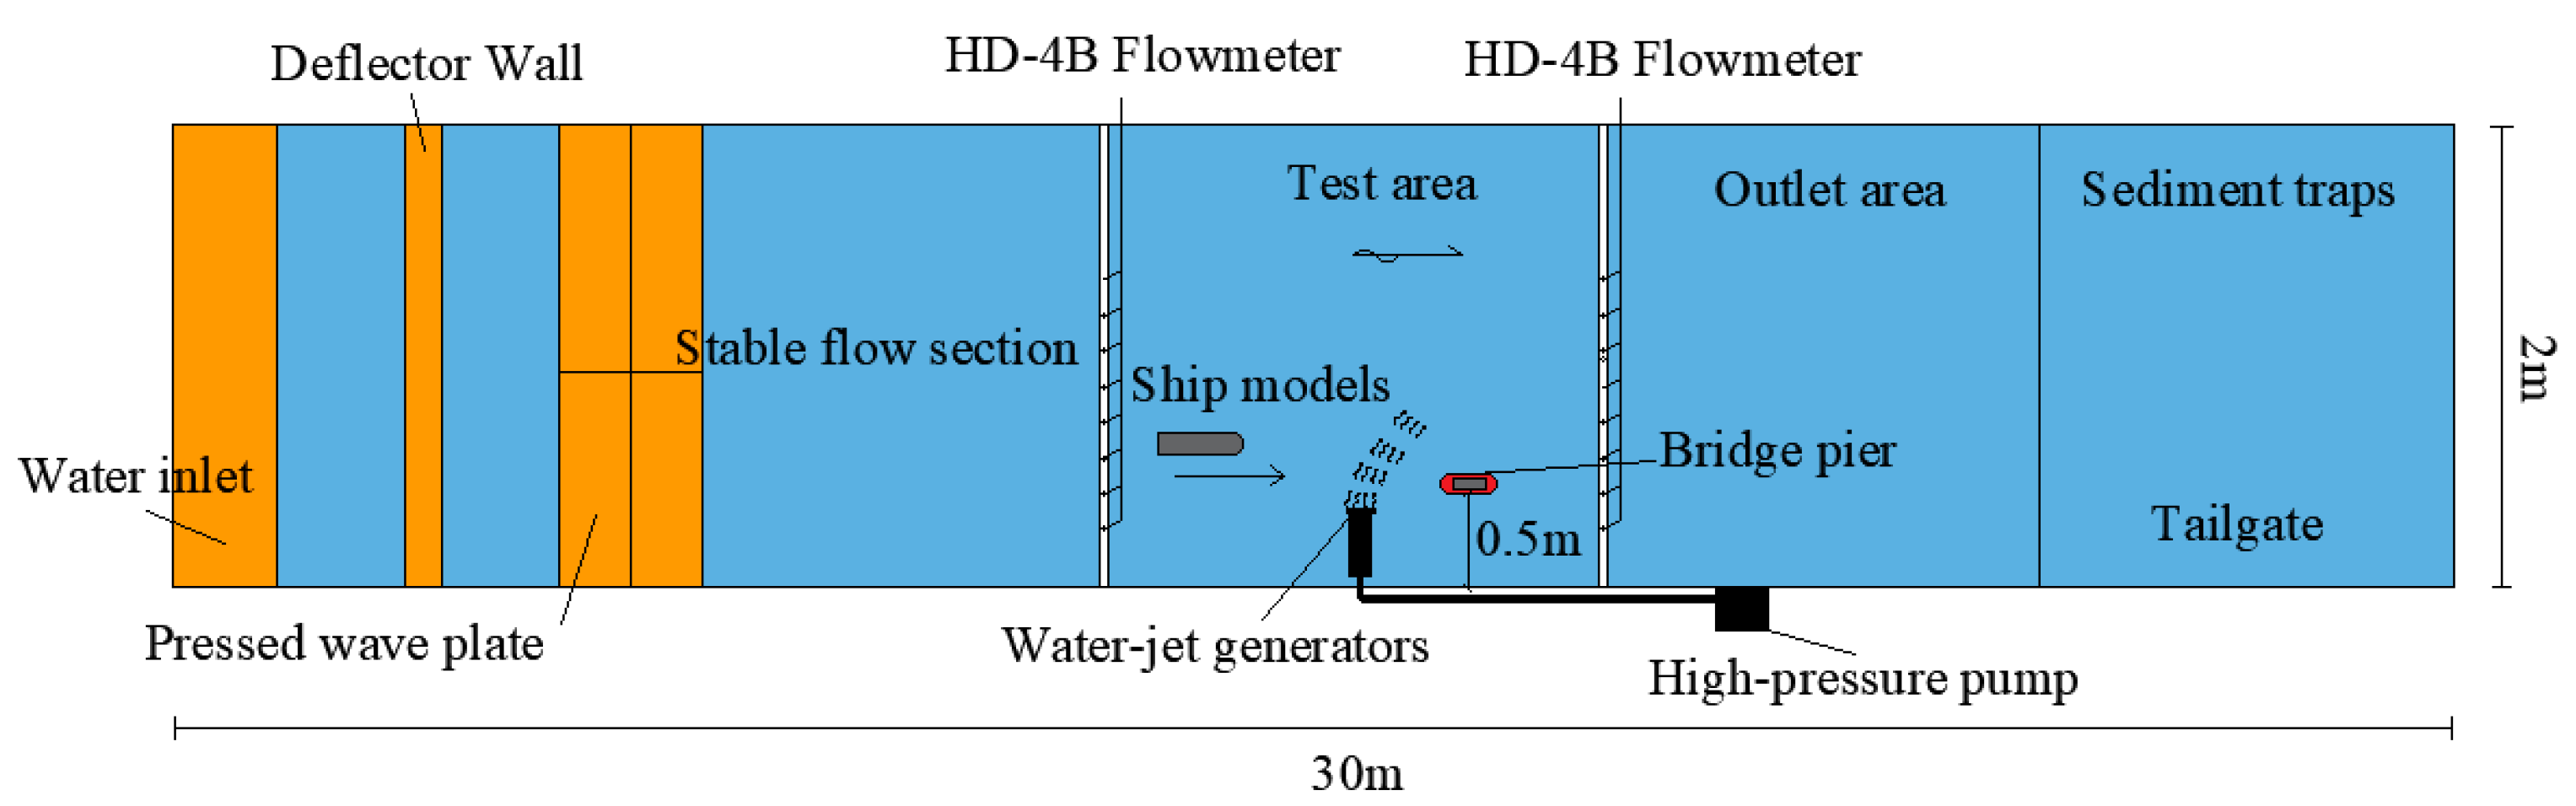
Figure 10.
Calculate domain layout.
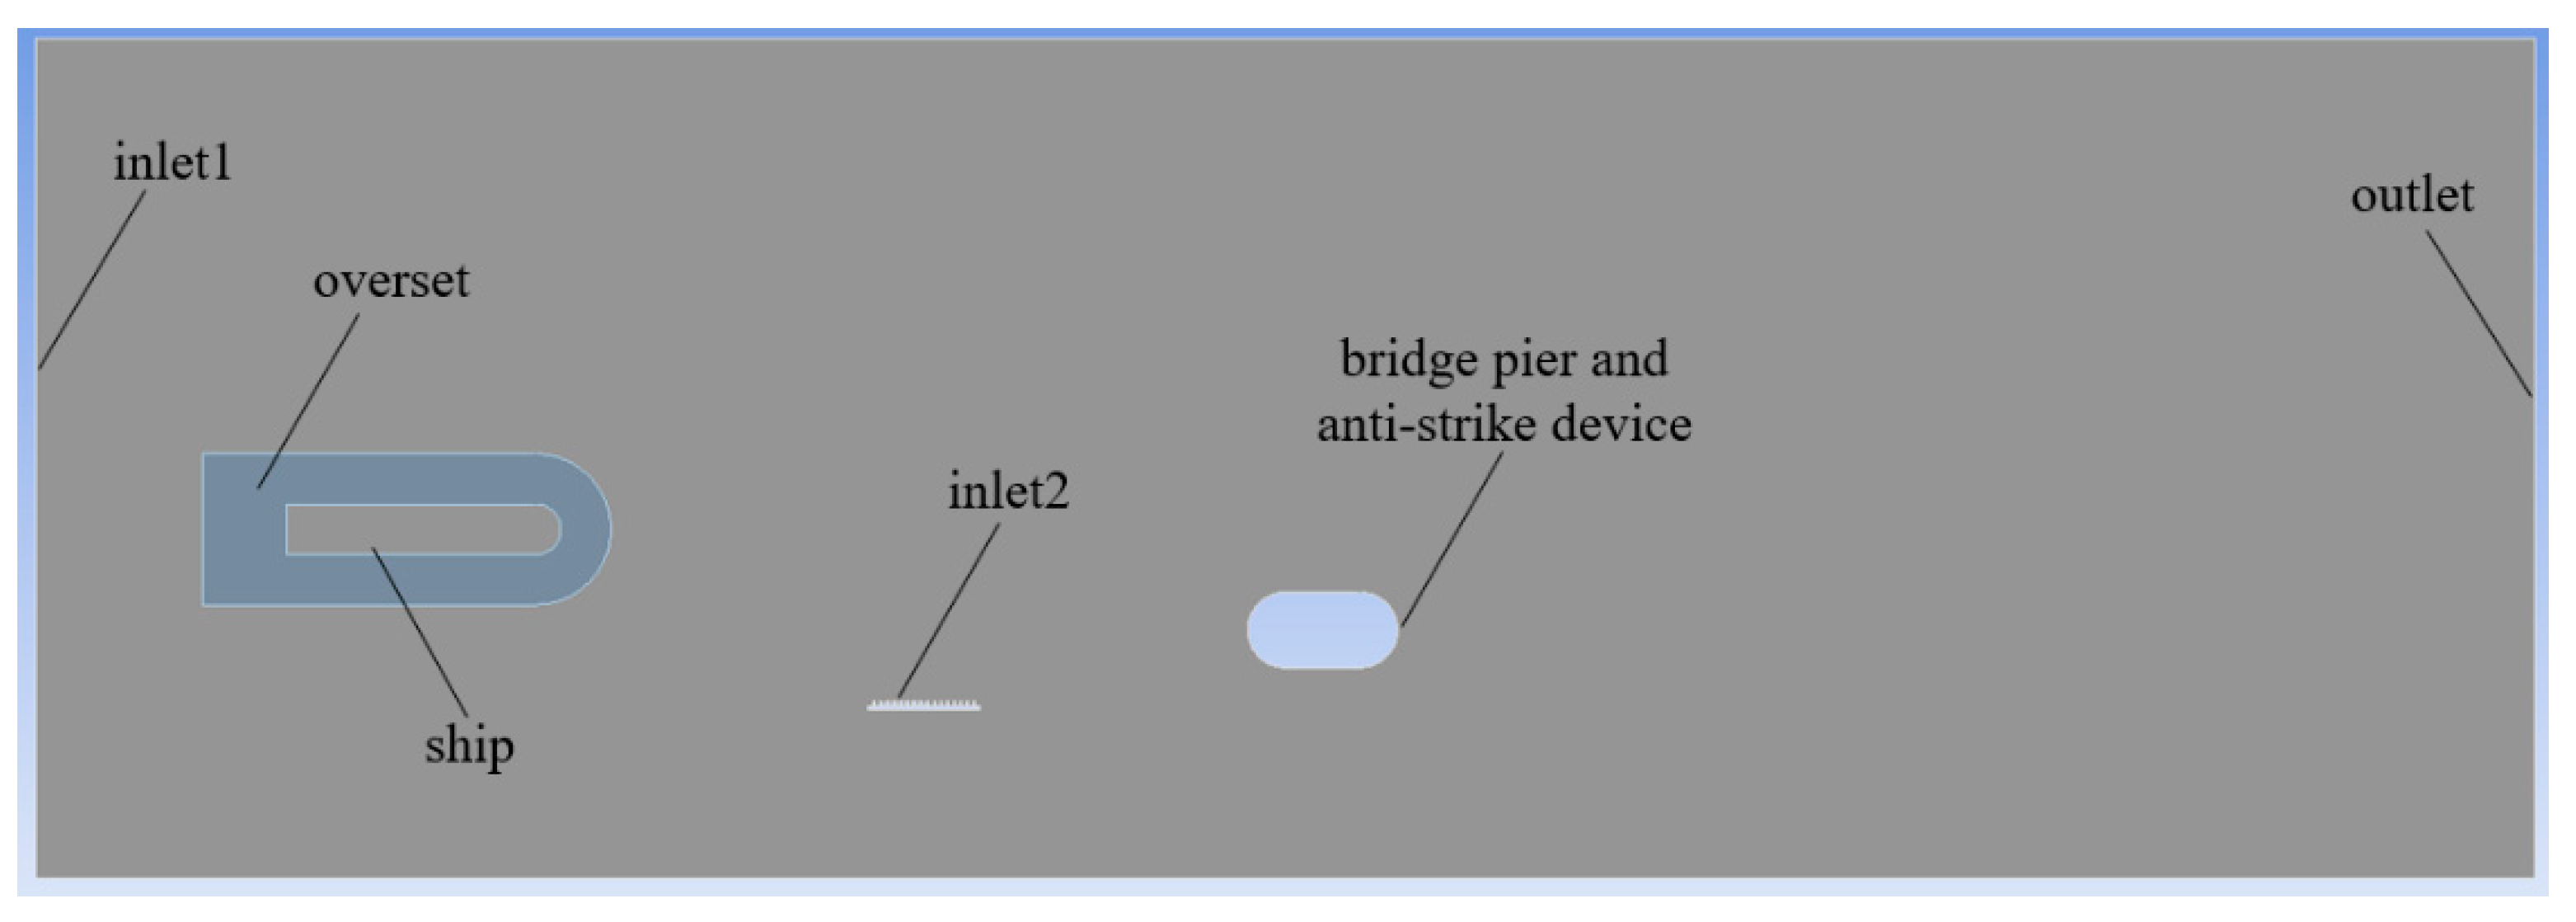
Figure 11.
Grid of the test area.

Figure 12.
Comparison of ship deflection effects: (a) Comparison of the deflection effects in moment one; (b) Comparison of the deflection effects in moment two; (c) Comparison of the deflection effects in moment three.
Figure 12.
Comparison of ship deflection effects: (a) Comparison of the deflection effects in moment one; (b) Comparison of the deflection effects in moment two; (c) Comparison of the deflection effects in moment three.

Figure 13.
Pressure of 0.005 MPa test tracks line.
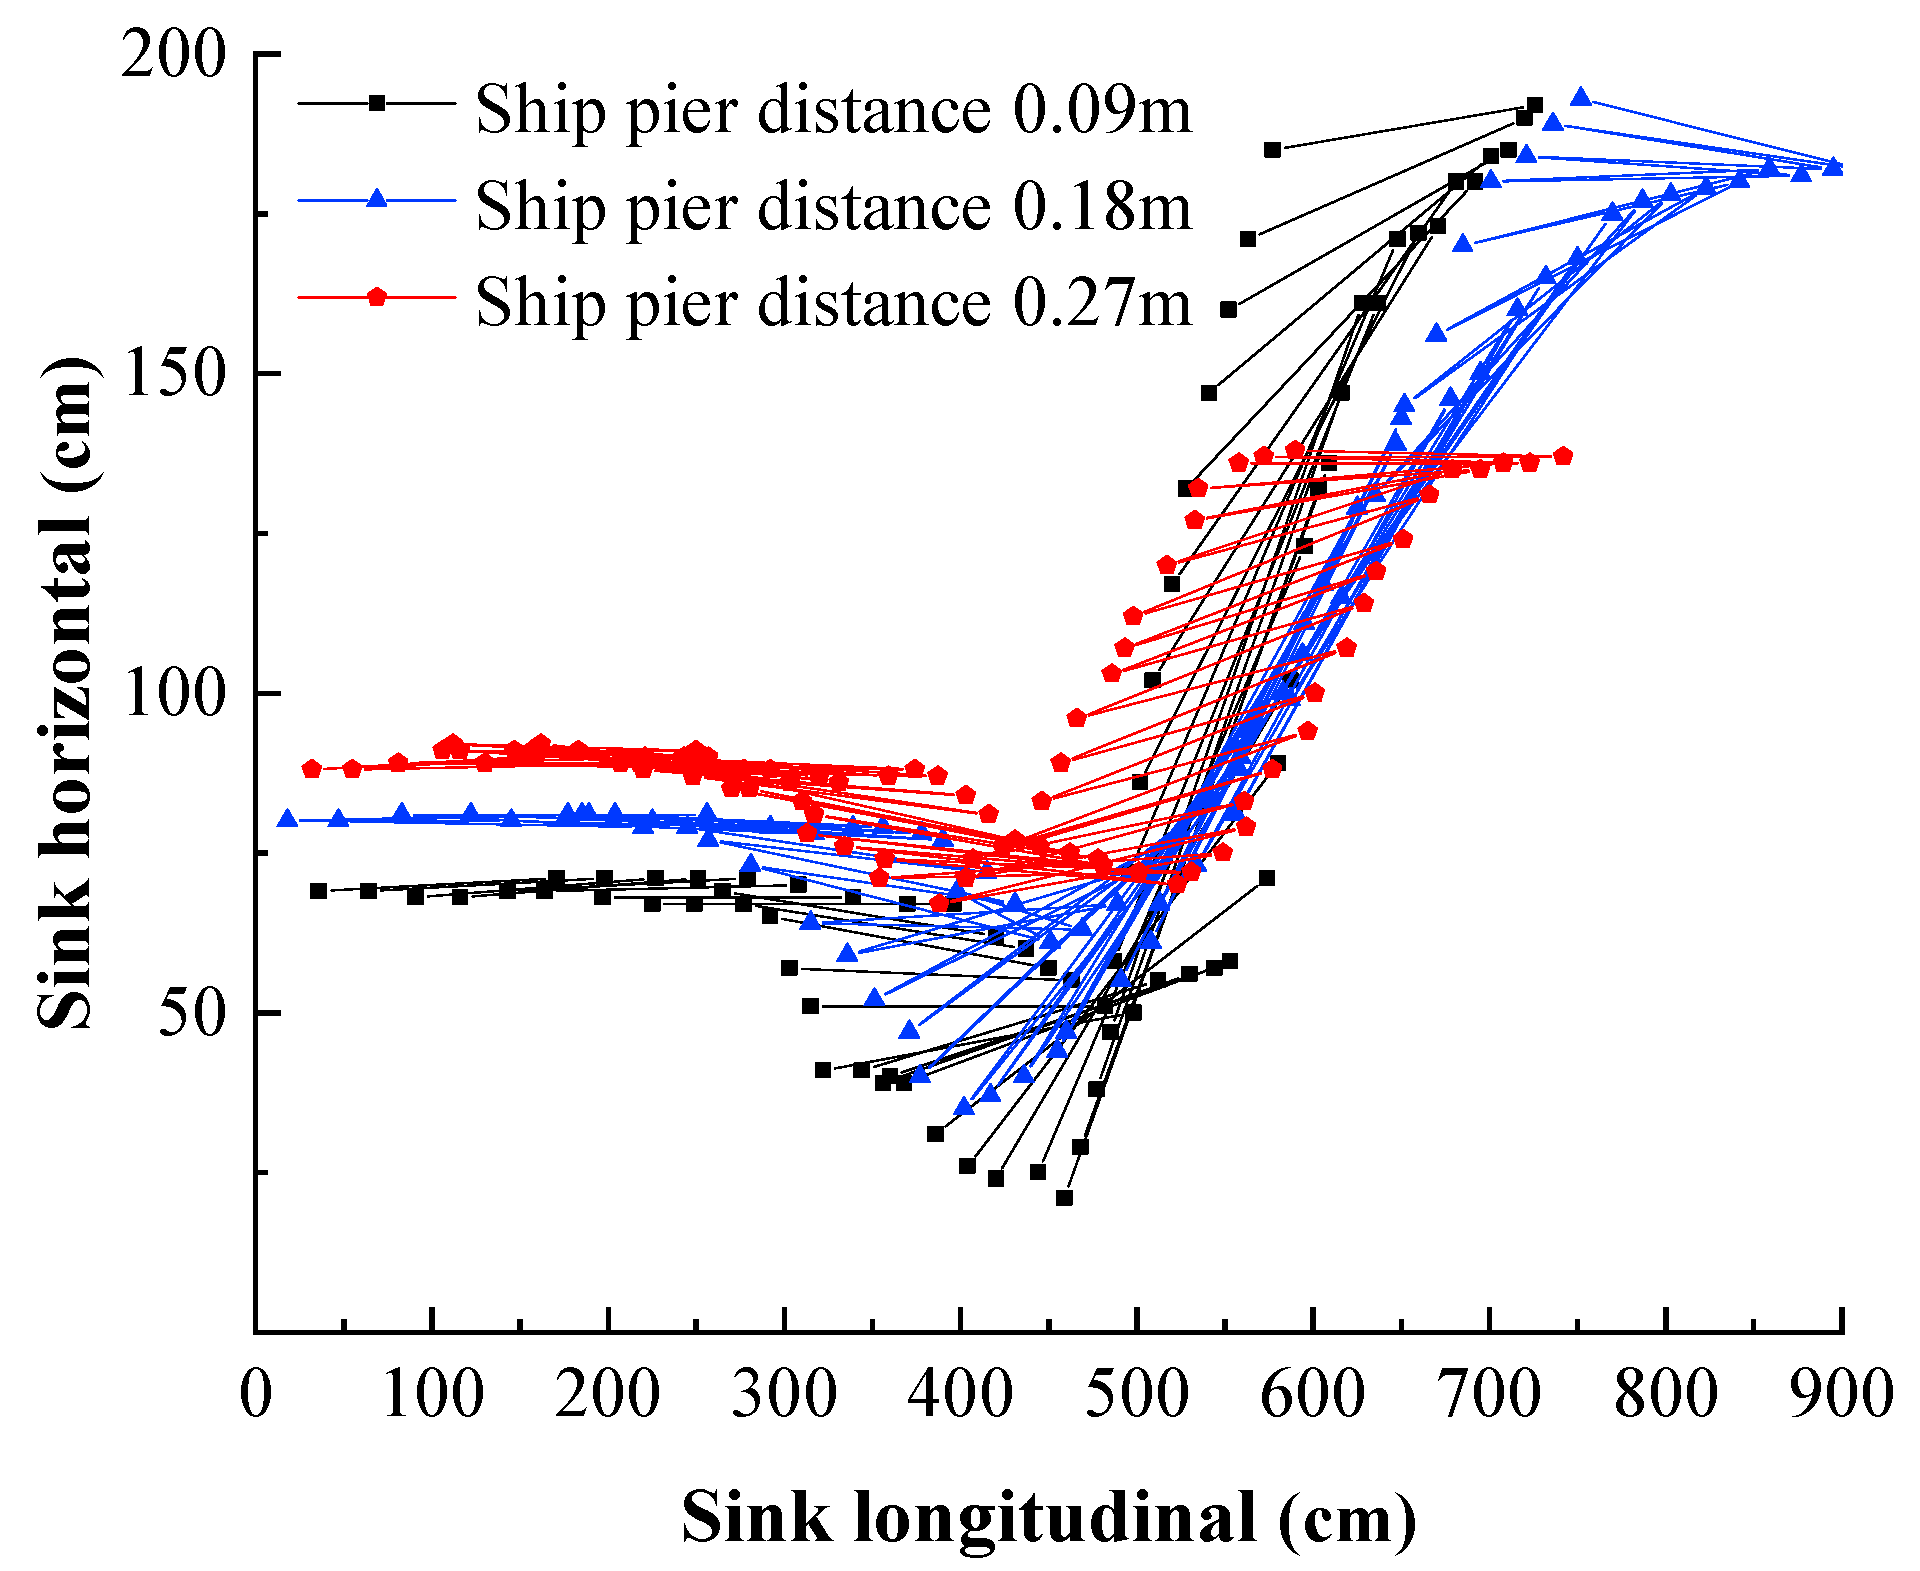
Figure 14.
Pressure of 0.010 MPa test tracks line.
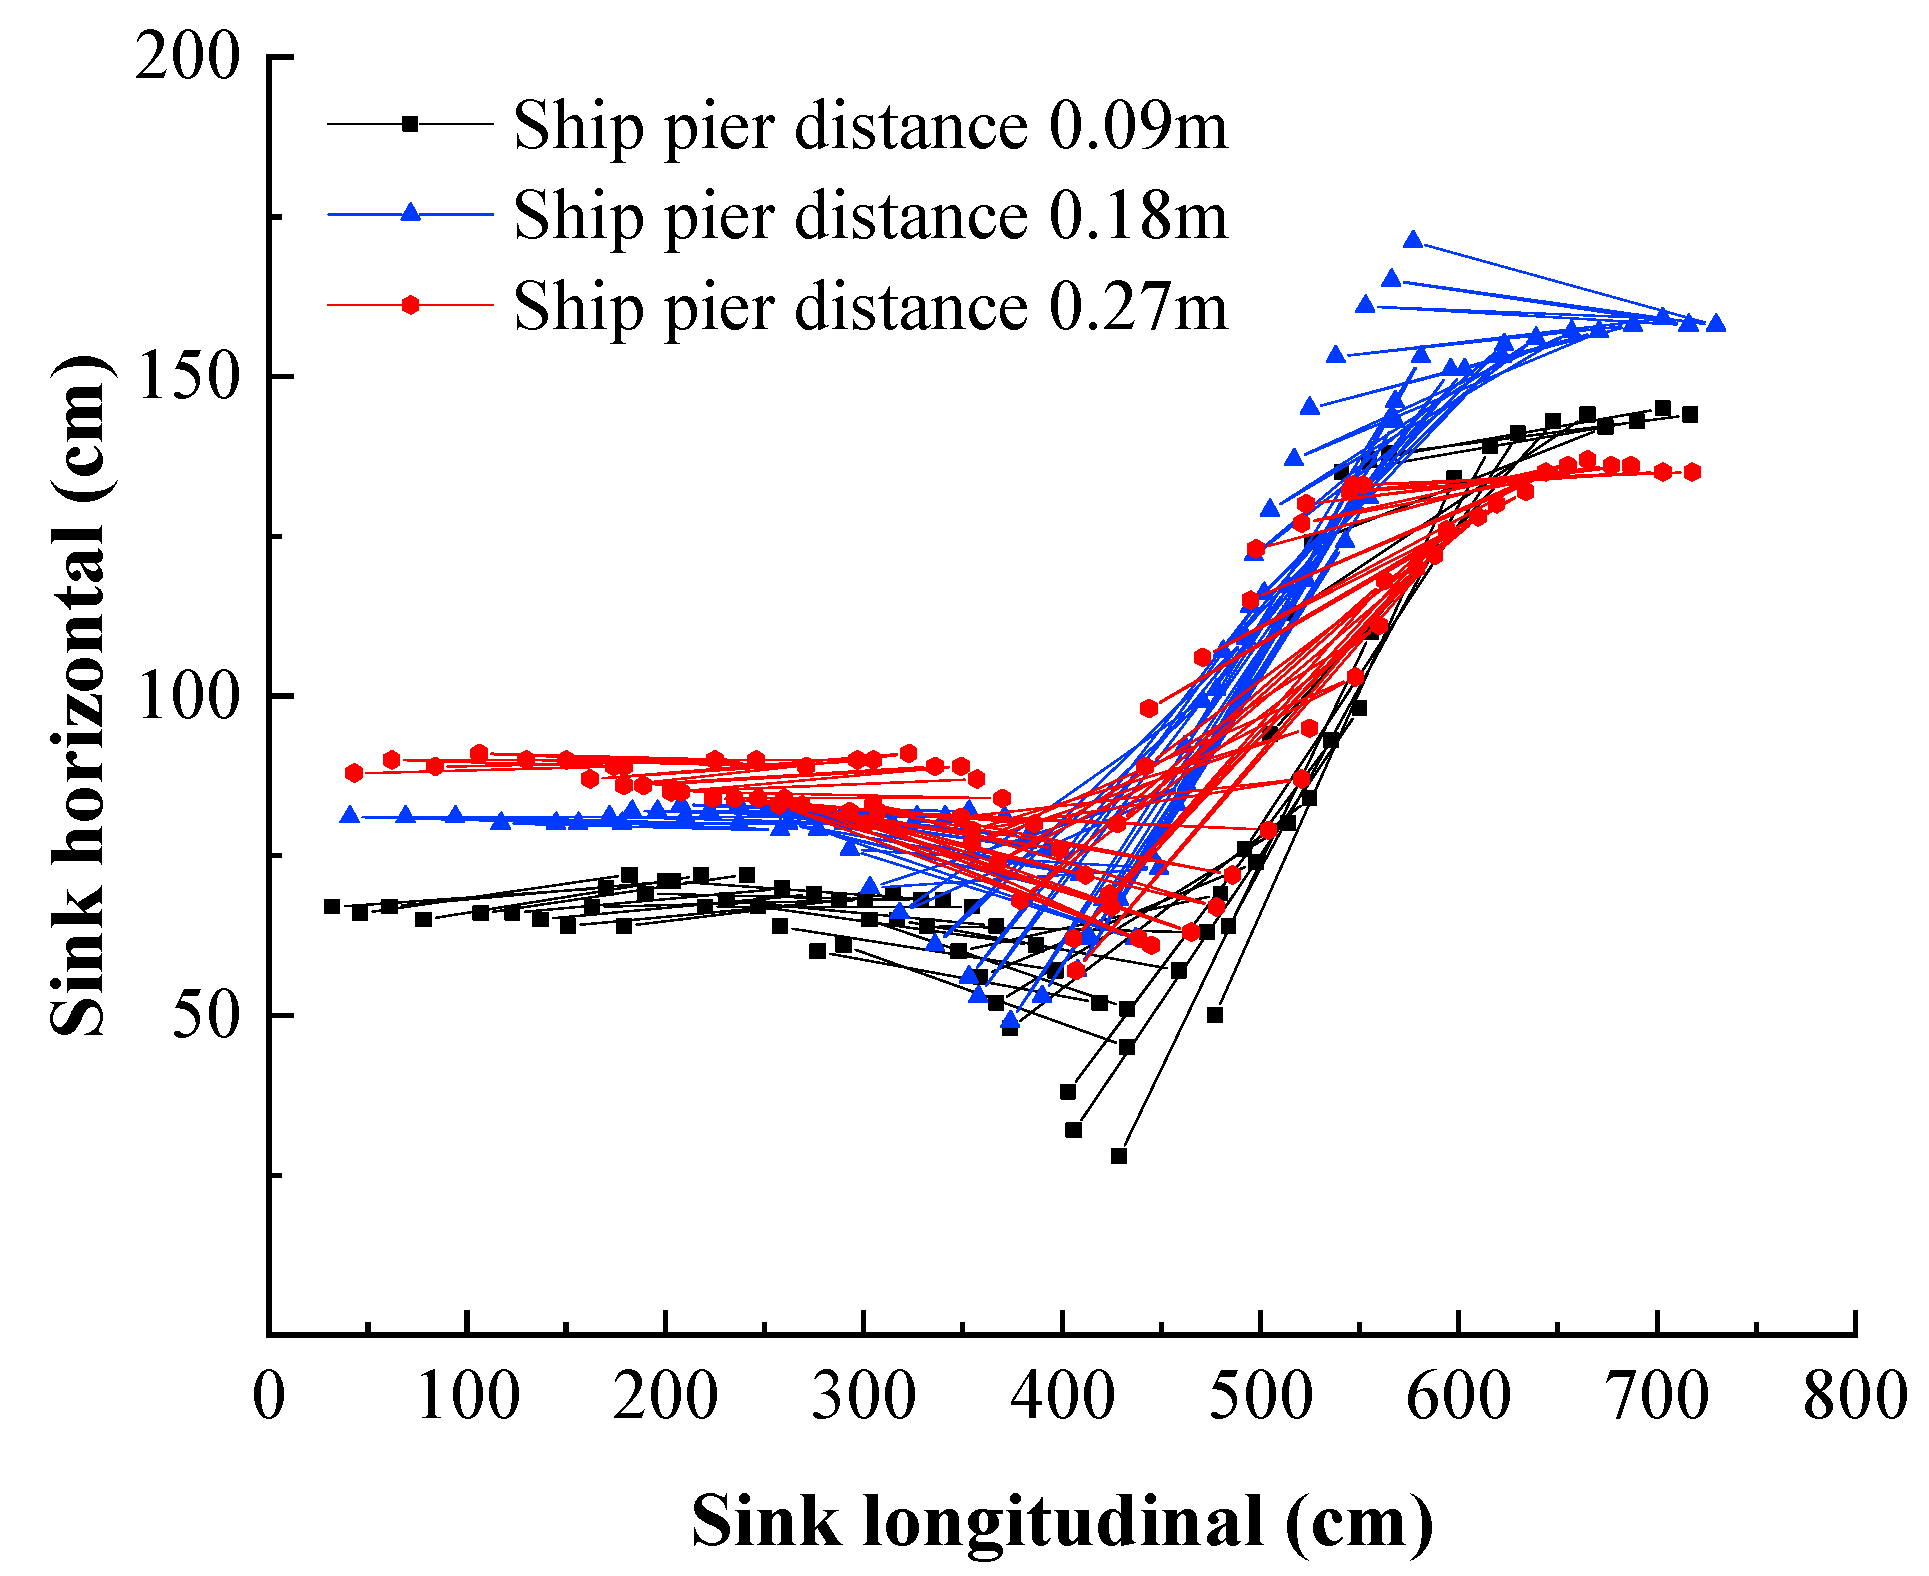
Figure 15.
Pressure of 0.015 MPa test tracks line.
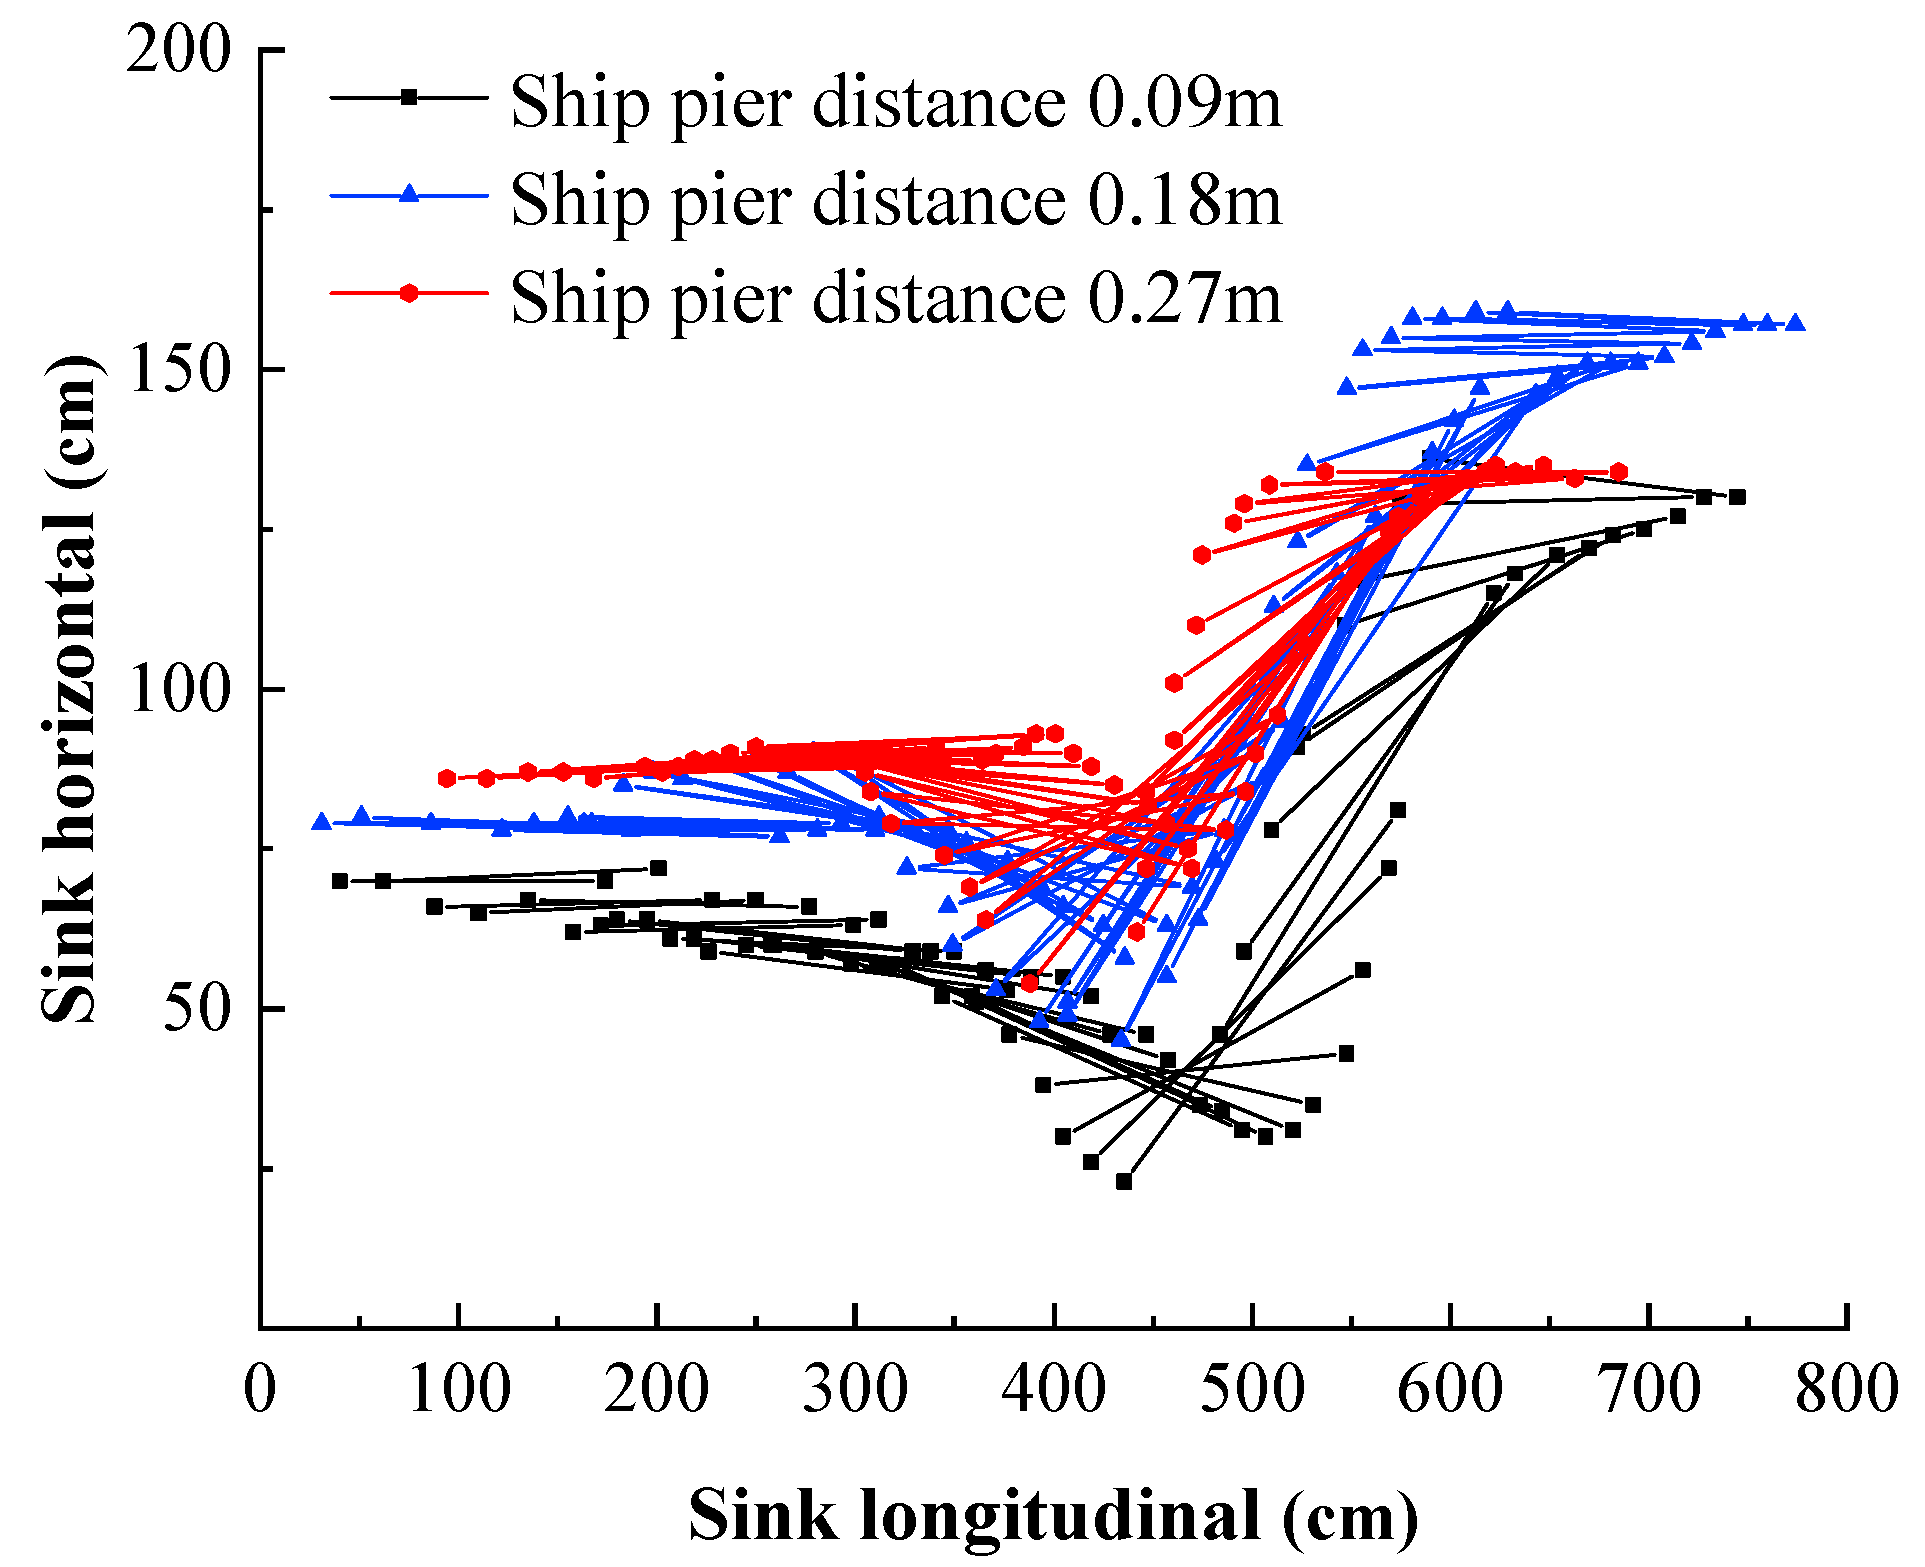
Figure 16.
Comparison of T1 and T10 tracks line.
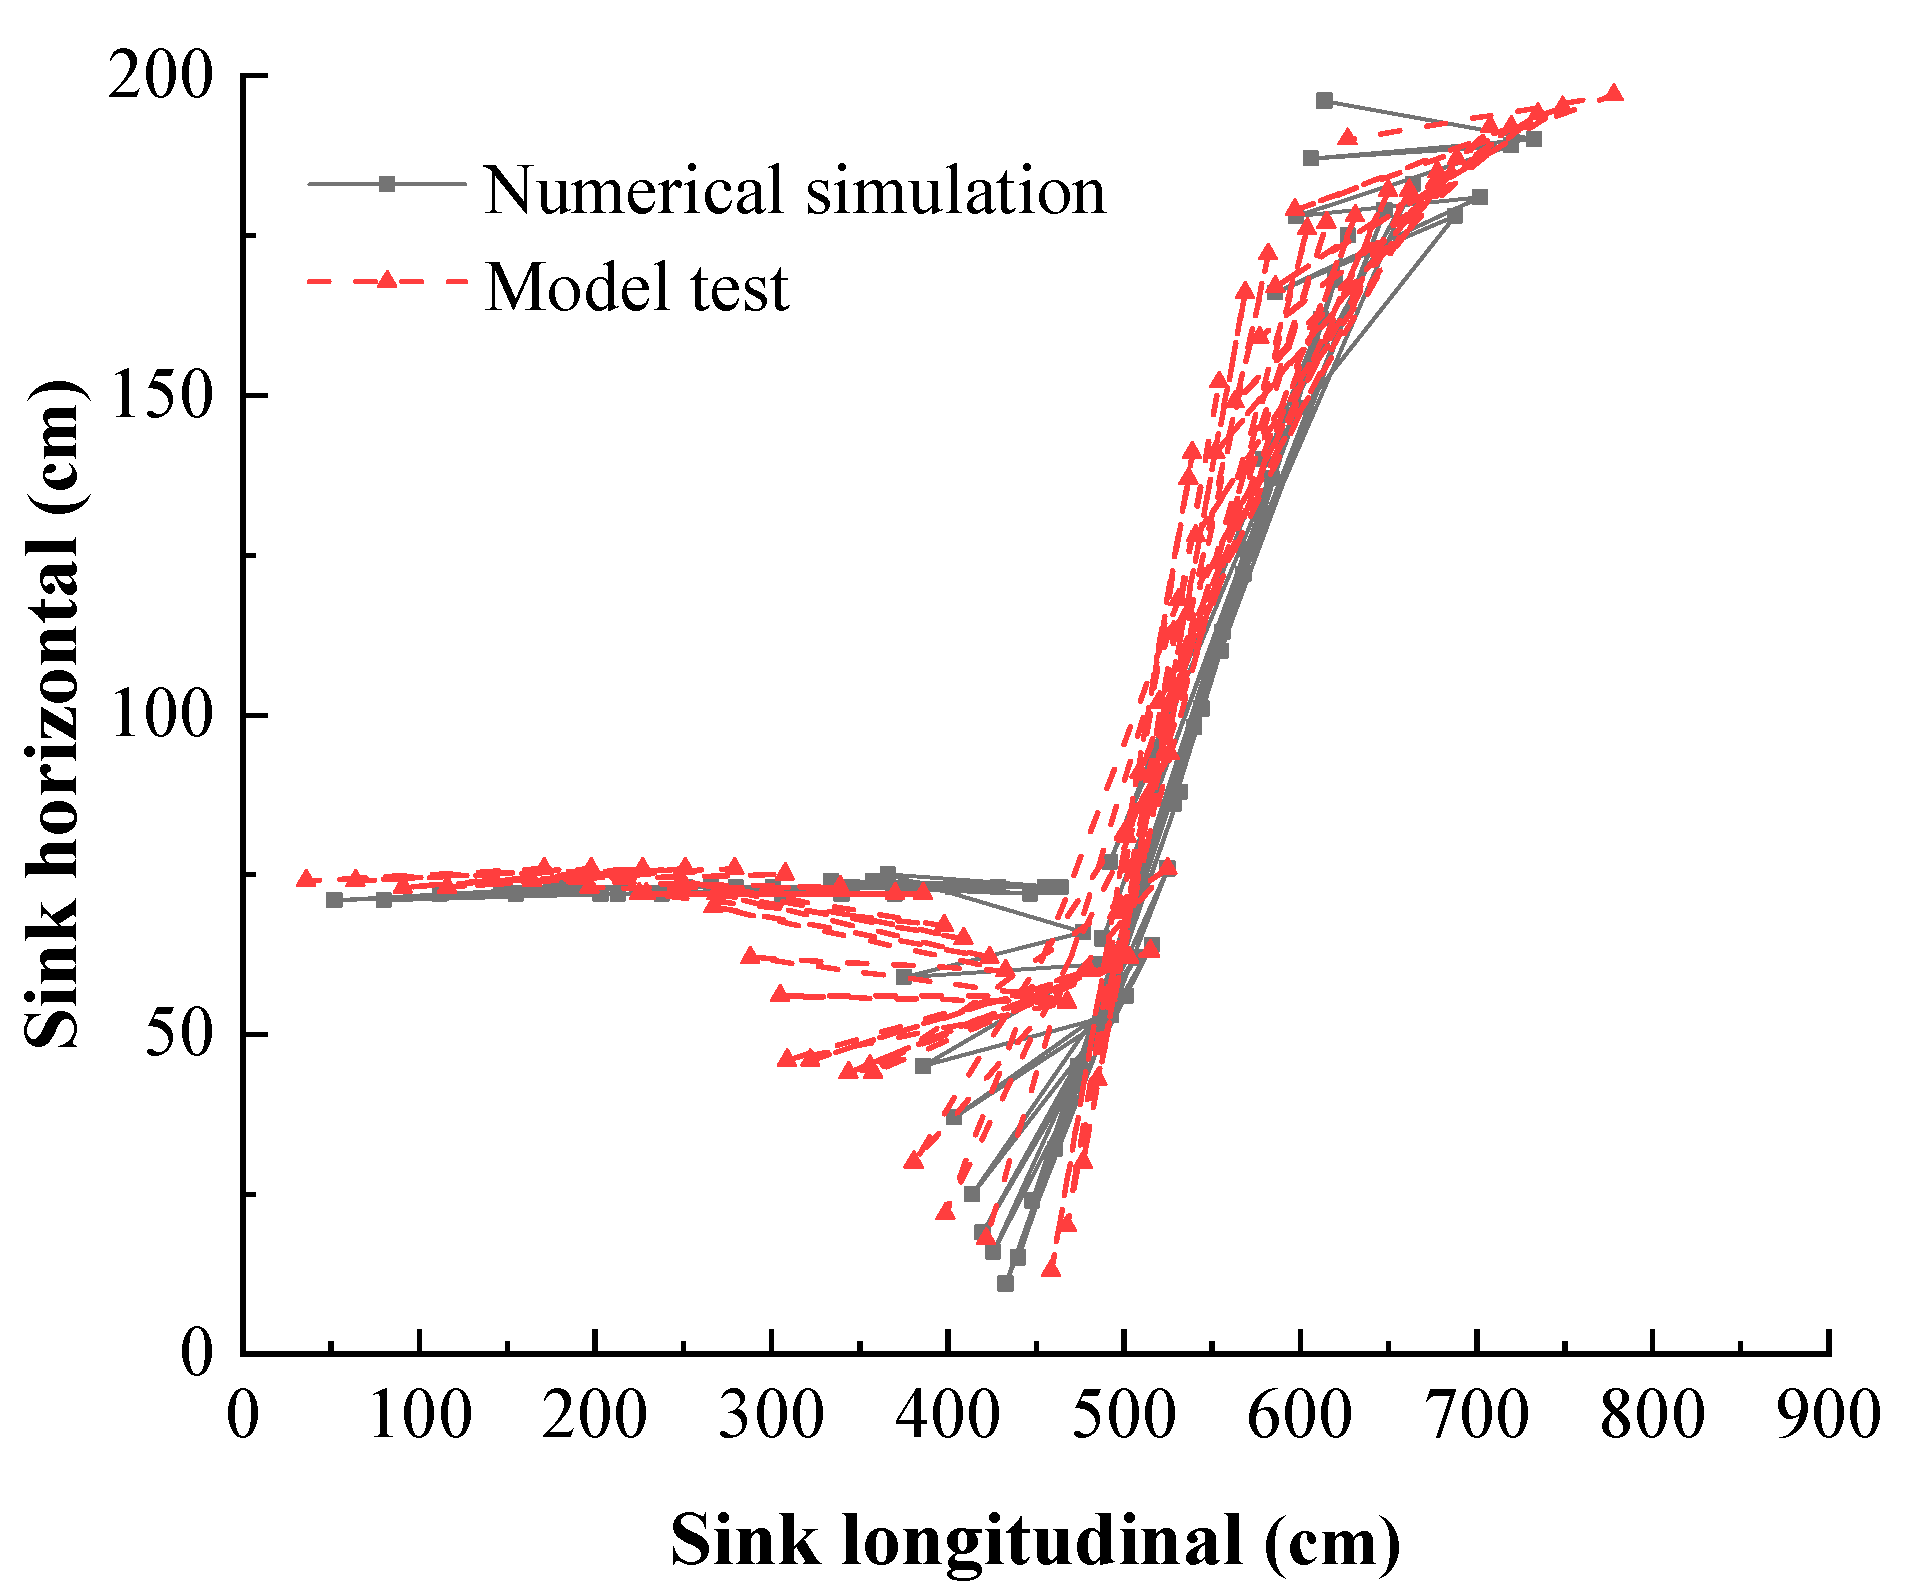
Figure 17.
Comparison of T2 and T11 tracks line.

Figure 18.
Comparison of T3 and T12 tracks line.
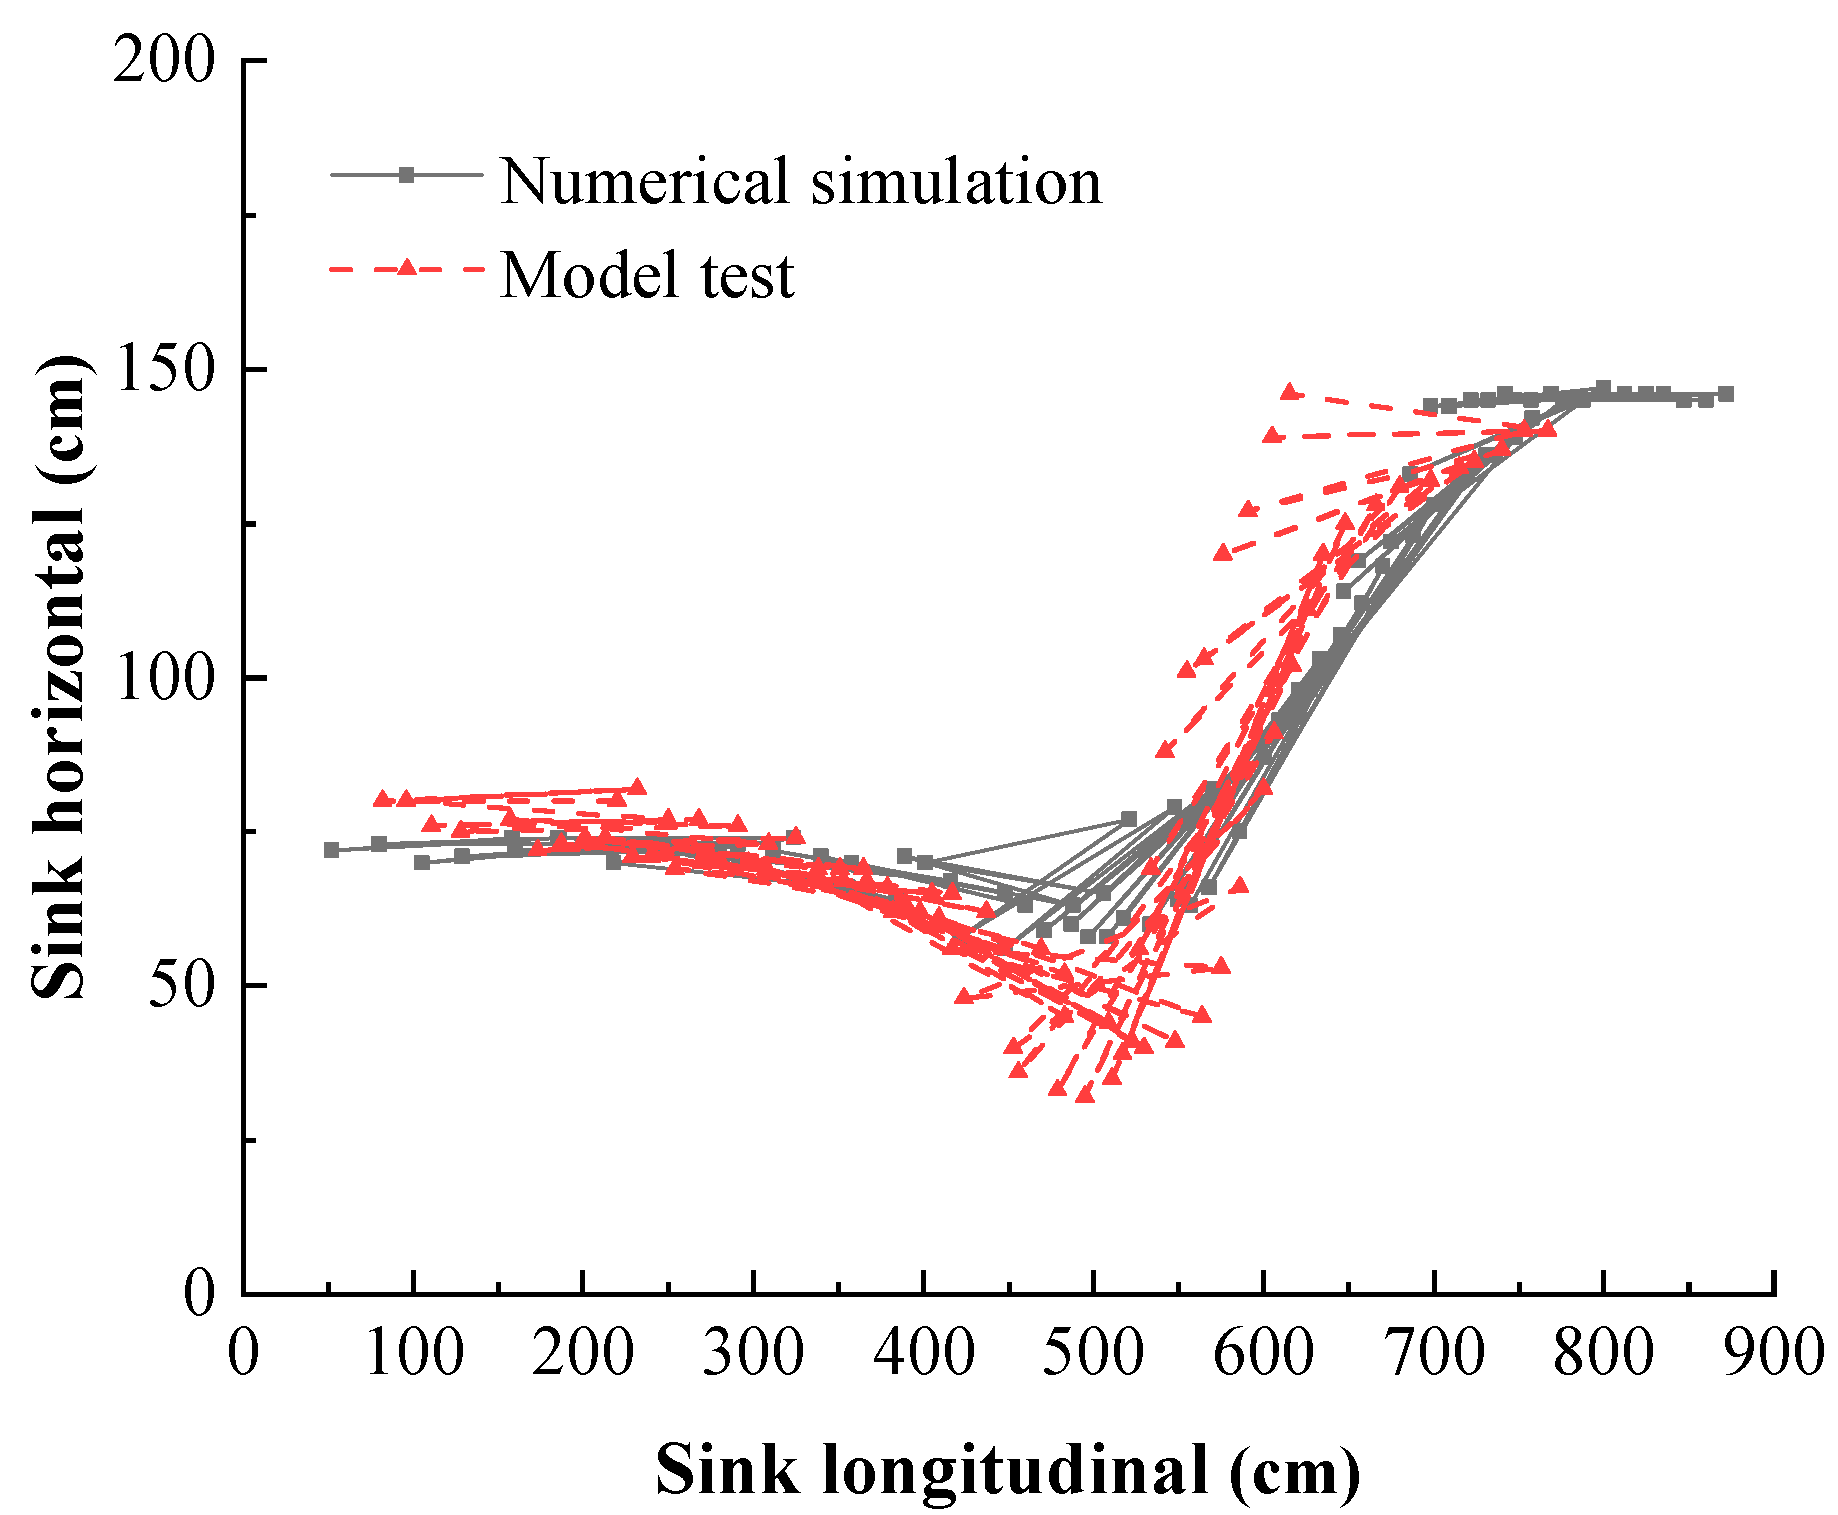
Figure 19.
Model test track line maximum drift angle.
Figure 20.
Comparison of the maximum drift angles.
Figure 21.
Comparison of T10, T11, and T12 ship yaw moment.
Figure 22.
Comparison of T13, T14, and T15 ship yaw moment.

Figure 23.
Comparison of T16, T17, and T18 ship yaw moment.
Figure 24.
Example 1: Four stages in the process of moving from a dangerous yawing course to a safe course when a ship is subject to the action of the interference zone. (a) Stage 1; (b) Stage 2; (c) Stage 3; (d) Stage 4.
Figure 24.
Example 1: Four stages in the process of moving from a dangerous yawing course to a safe course when a ship is subject to the action of the interference zone. (a) Stage 1; (b) Stage 2; (c) Stage 3; (d) Stage 4.
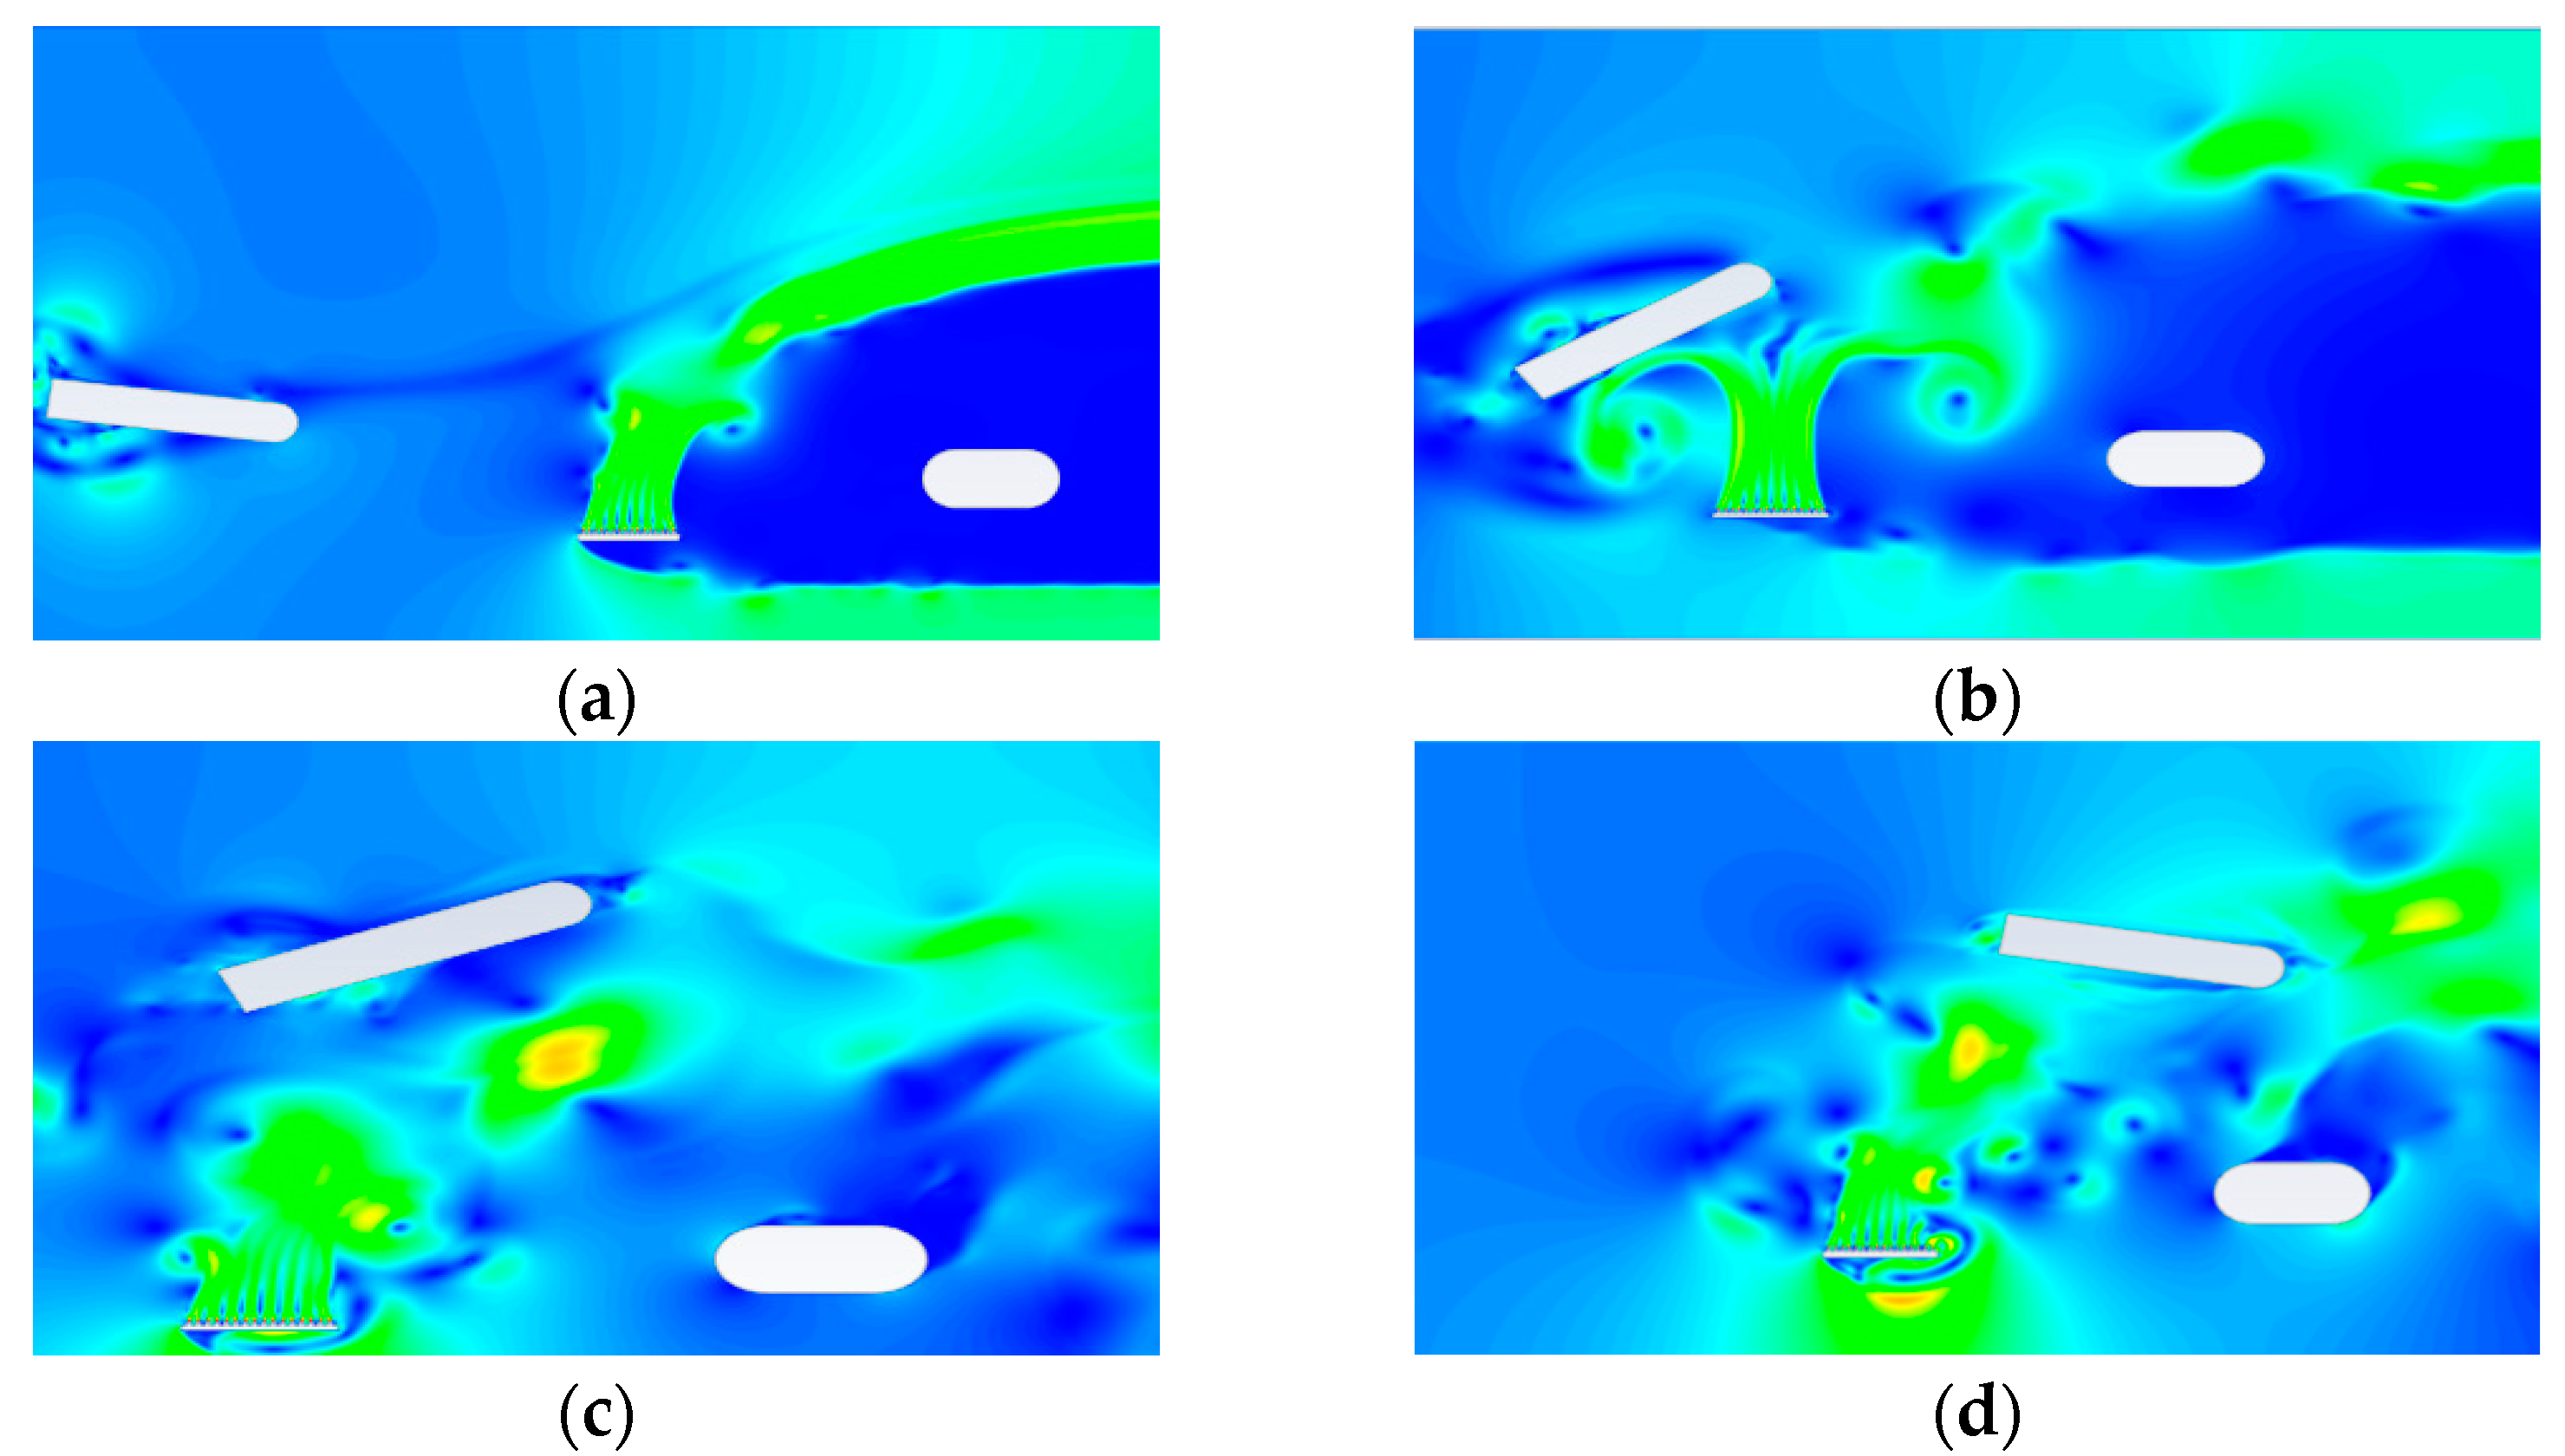
Figure 25.
Example 2: Four stages in the process of moving from a dangerous yawing course to a safe course when a ship is subject to the action of the interference zone. (a) Stage 1; (b) Stage 2; (c) Stage 3; (d) Stage 4.
Figure 25.
Example 2: Four stages in the process of moving from a dangerous yawing course to a safe course when a ship is subject to the action of the interference zone. (a) Stage 1; (b) Stage 2; (c) Stage 3; (d) Stage 4.

Figure 26.
Example 3: Four stages in the process of moving from a dangerous yawing course to a safe course when a ship is subject to the action of the interference zone. (a) Stage 1; (b) Stage 2; (c) Stage 3; (d) Stage 4.
Figure 26.
Example 3: Four stages in the process of moving from a dangerous yawing course to a safe course when a ship is subject to the action of the interference zone. (a) Stage 1; (b) Stage 2; (c) Stage 3; (d) Stage 4.


Table 1.
Scale of relevant physical quantities.
| Item | Geometric Scale | Flow Rate Scale | Pressure Scale |
|---|---|---|---|
| Scale | 100 | 10 | 100 |
| Calculation basis |
Table 2.
Model test water flow conditions.
| Project | Prototype Flow | Test Sink Flow | Prototype Water Velocity | Test Water Velocity |
|---|---|---|---|---|
| Data | 1.93–2.73 m/s |
Table 3.
Test conditions.
| Ship Pier Distance | Water-Jet Generator Nozzle Pressure | ||
|---|---|---|---|
| 0.005 MPa | 0.010 MPa | 0.015 MPa | |
| 0.5 D | T1 | T2 | T3 |
| 1.0 D | T4 | T5 | T6 |
| 1.5 D | T7 | T8 | T9 |
Table 4.
Numerical simulation conditions.
| Ship Pier Distance | Water-Jet Generator Nozzle Pressure | ||
|---|---|---|---|
| 0.5 MPa | 1.0 MPa | 1.5 MPa | |
| 0.5 D | T10 | T11 | T12 |
| 1.0 D | T13 | T14 | T15 |
| 1.5 D | T16 | T17 | T18 |
Table 5.
Detailed parameters of the numerical simulation ship.
| Parameter | Value | Parameter | Value |
|---|---|---|---|
| Length (m) | 64.5 | Izz () | |
| Width (m) | 12 | Load displacement (kg) |
Disclaimer/Publisher’s Note: The statements, opinions and data contained in all publications are solely those of the individual author(s) and contributor(s) and not of MDPI and/or the editor(s). MDPI and/or the editor(s) disclaim responsibility for any injury to people or property resulting from any ideas, methods, instructions or products referred to in the content. |
© 2023 by the authors. Licensee MDPI, Basel, Switzerland. This article is an open access article distributed under the terms and conditions of the Creative Commons Attribution (CC BY) license (https://creativecommons.org/licenses/by/4.0/).
Share and Cite
MDPI and ACS Style
Yu, K.; Wang, H.; Liu, X.; Peng, B. Research on a Ship Deflection Anti-Collision Method Based on a Water-Jet Interference Flow Field. Appl. Sci. 2023, 13, 7354. https://doi.org/10.3390/app13137354
AMA Style
Yu K, Wang H, Liu X, Peng B. Research on a Ship Deflection Anti-Collision Method Based on a Water-Jet Interference Flow Field. Applied Sciences. 2023; 13(13):7354. https://doi.org/10.3390/app13137354
Chicago/Turabian StyleYu, Kui, Hongming Wang, Xianqing Liu, and Bingli Peng. 2023. "Research on a Ship Deflection Anti-Collision Method Based on a Water-Jet Interference Flow Field" Applied Sciences 13, no. 13: 7354. https://doi.org/10.3390/app13137354
Note that from the first issue of 2016, this journal uses article numbers instead of page numbers. See further details here.