Article

Influence of Spherical Caverns on the Failure Characteristics of Neighboring Tunnels under True Triaxial Conditions: Insights from an Experimental Test and Discrete Element Simulation

1
School of Civil and Resource Engineering, University of Science and Technology Beijing, Beijing 100083, China
2
Zijin School of Geology and Mining, Fuzhou University, Fuzhou 350108, China
*
Author to whom correspondence should be addressed.
Appl. Sci. 2023, 13(13), 7688; https://doi.org/10.3390/app13137688
Submission received: 6 June 2023 / Revised: 20 June 2023 / Accepted: 28 June 2023 / Published: 29 June 2023
(This article belongs to the Special Issue Advances in Tunneling and Underground Engineering)

Abstract

:
Caverns are generally formed by a combination of regional geological action and groundwater, and their improper treatment will inevitably lead to dangerous conditions in underground works. To detect the specific failure mechanism of tunnel-surrounding rock induced by invisible caverns, a true triaxial compression test is conducted, accompanied by acoustic emission technology and an internal borehole camera, for monitoring the acoustic response and visible secondary cracks, and a corresponding DEM simulation is carried out to reveal the meso-mechanism. The results indicate the following: (1) The invisible cavern demonstrates a negative influence on the stability of the tunnel and leads to a 25.82% reduction in the peak z-axis load of the specimens. (2) The acoustic emission results show that the relatively severe dominant failures mainly occur near the peak stress in all types of specimens, and the speed and intensity of the cavern-existing specimen is significantly greater than that of the cavern-free specimen. (3) The cavity-free tunnel shows mirror-symmetric splitting failure on the left and right sidewalls, while the secondary cracks appear earlier and show asymmetrical distribution in the cavern-existing specimen, and the volume of broken rock blocks near the free surface is larger. (4) The cavern directly changes the failure process of the tunnel-surrounding rock (intermediate rock failure occurs earlier than splitting failure), the distribution of principal stress, and the corresponding mechanism of secondary failures. (5) Application of the displacement and velocity trend fields helped to reveal accurate failure procedures in the true triaxial test.

1. Introduction

Splitting failure usually occurs in tunnels and other underground structures, and many previous experimental, numerical, and theoretical results proved that the occurrence, distribution, and scale of the failure regions are mainly controlled by in situ stresses and the section shape [1,2,3,4,5]. Furthermore, researchers have paid attention to the splitting failure procedure and rock-burst characteristic of tunnel-surrounding rock under true triaxial compression conditions, and the true triaxial compression test provided powerful support to the related academic and practical achievements.
Gong et al. [6,7] carried out experimental tests on cubic rock samples containing circle- and D-shaped tunnels, and simulated the progressive splitting failures under biaxial or triaxial conditions. Si et al. [8] studied the failure characteristics of cube granite containing a circle hole through a true 3D triaxial compression test, and separated the failure process into four typical stages (calm period, rock debris ejection, splitting failure forming, and rock burst). Zhang et al. [9] monitored the development of visible secondary cracks, strain field, and AE signals in sandstone with a circle hole under biaxial compression conditions, and tensile cracks were initiated at the arched position and then two V-shaped failure faces were formed. Li et al. [10] focused on the splitting failure and rock burst shown in a red sandstone sample under dynamic true 3D compression conditions, which proved that the dynamic loading contributed to faster rock ejection, deeper V-shaped failure, and mixed tensile–shear failures. Luo et al. [11] tried to find the transformation characteristics of secondary failures (from splitting failure to rock burst) by changing the length of the tunnel sidewall in the true 3D triaxial compression test. As the sidewall length decreased, the distribution area of the V-shaped splitting failure shrank, while the rock burst became more active. Gong et al. [12] carried out a tunnel excavation (internal unloading) test under biaxial compression conditions, and the ‘High initial stress & Internal unloading & Stress adjustment’ simulation path is closer to the actual engineering conditions. Compared with the traditional test (prefabricated circular hole, high initial stress and stress adjustment), the internal unloading test contributed to a smaller initial failure strength and more severe splitting failure in the tunnel sidewall.
In addition to the experimental method, the numerical analysis method is a good tool for simulating the mesoscopic failure behavior in rocks. Based on discrete element theory, the Particle Flaw Code (PFC) has been applied to simulate the fracture behavior of rocks, and the displacement vector field has been utilized to estimate an accurate mode of secondary cracks [13,14,15,16,17,18,19,20,21,22]. Rock samples containing prefabricated holes and flaws were usually selected as objects in previous studies. Liu et al. [23] studied the crack development characteristics in a rock-like sample containing twin cavities. The particle displacement trend was applied to analyze the failure mechanism at the mesoscale, and cluster analysis was used to identify the dominant secondary failures in the sample. Yang et al. [24] conducted experimental and numerical studies on a cube rock sample with a central circular hole and parallel non-persistent flaws. The PFC2D simulation results indicated that the tensile cracks played the dominant role in the failure coalescence, and the slipping failure in the sidewalls was mainly formed by the shear cracks.
Although the experimental and numerical methods for the true triaxial compression test have matured, a special condition is rarely mentioned in previous studies: the potential influence of neighboring caverns on the safety of tunnel-surrounding rock. Caverns commonly appear in the geological body when fracture structures are widely distributed and groundwater shows strong power in the local region. Natural caverns usually hide in rock and contribute to complicated in situ stress fields in the neighboring rock.
Therefore, in addition to the existing true triaxial studies of splitting failure and rock burst in tunnel-surrounding rock, the potential influence of invisible caverns on tunnel stability should be taken seriously. Samples containing prefabricated tunnels are prepared in this study, and a set of controlled tests (cavern-free condition and cavern-existing condition) are conducted through experimental and numerical methods. Acoustic emission technology and an internal borehole camera are applied in the true triaxial compression test for monitoring the acoustic response and visible secondary cracks. The DEM simulation is carried out based on the experimental results. By analyzing the video, acoustical, and mechanical data obtained in the experimental tests, and crack distribution, particle displacement, and the velocity vector field in the DEM simulations, it is possible to find the key information for predicting the macroscopic secondary damage.

2. Test Design

2.1. Material Selection and Property

In order to activate the splitting failure in the rock-like sample, a brittle gypsum rock-like sample was selected in this work [25,26] which shows good brittleness and homogeneity. The gypsum rock-like sample mainly consists of gypsum powder and water (the weight ratio of solid to liquid is 5 to 2). Based on the ISRM-recommended testing methods, the standard cylinder sample and Brazilian splitting specimen were prepared in order to measure the uniaxial compressive strength (UCS) and tensile strength (TS) of the material; the UCS and TS of the gypsum sample were 26.63 MPa and 1.13 MPa, respectively, and the ratio of UCS to TS was over 23; the corresponding value of traditional brittle rock (like marble, granite, sandstone) is generally greater than 10 [27,28,29], and the rock-like sample thus belonged to the brittle materials. Moreover, the invisible spherical cavern was formed by the volume loss method [25]. The detailed parameters of the rock-like material are shown in Table 1.

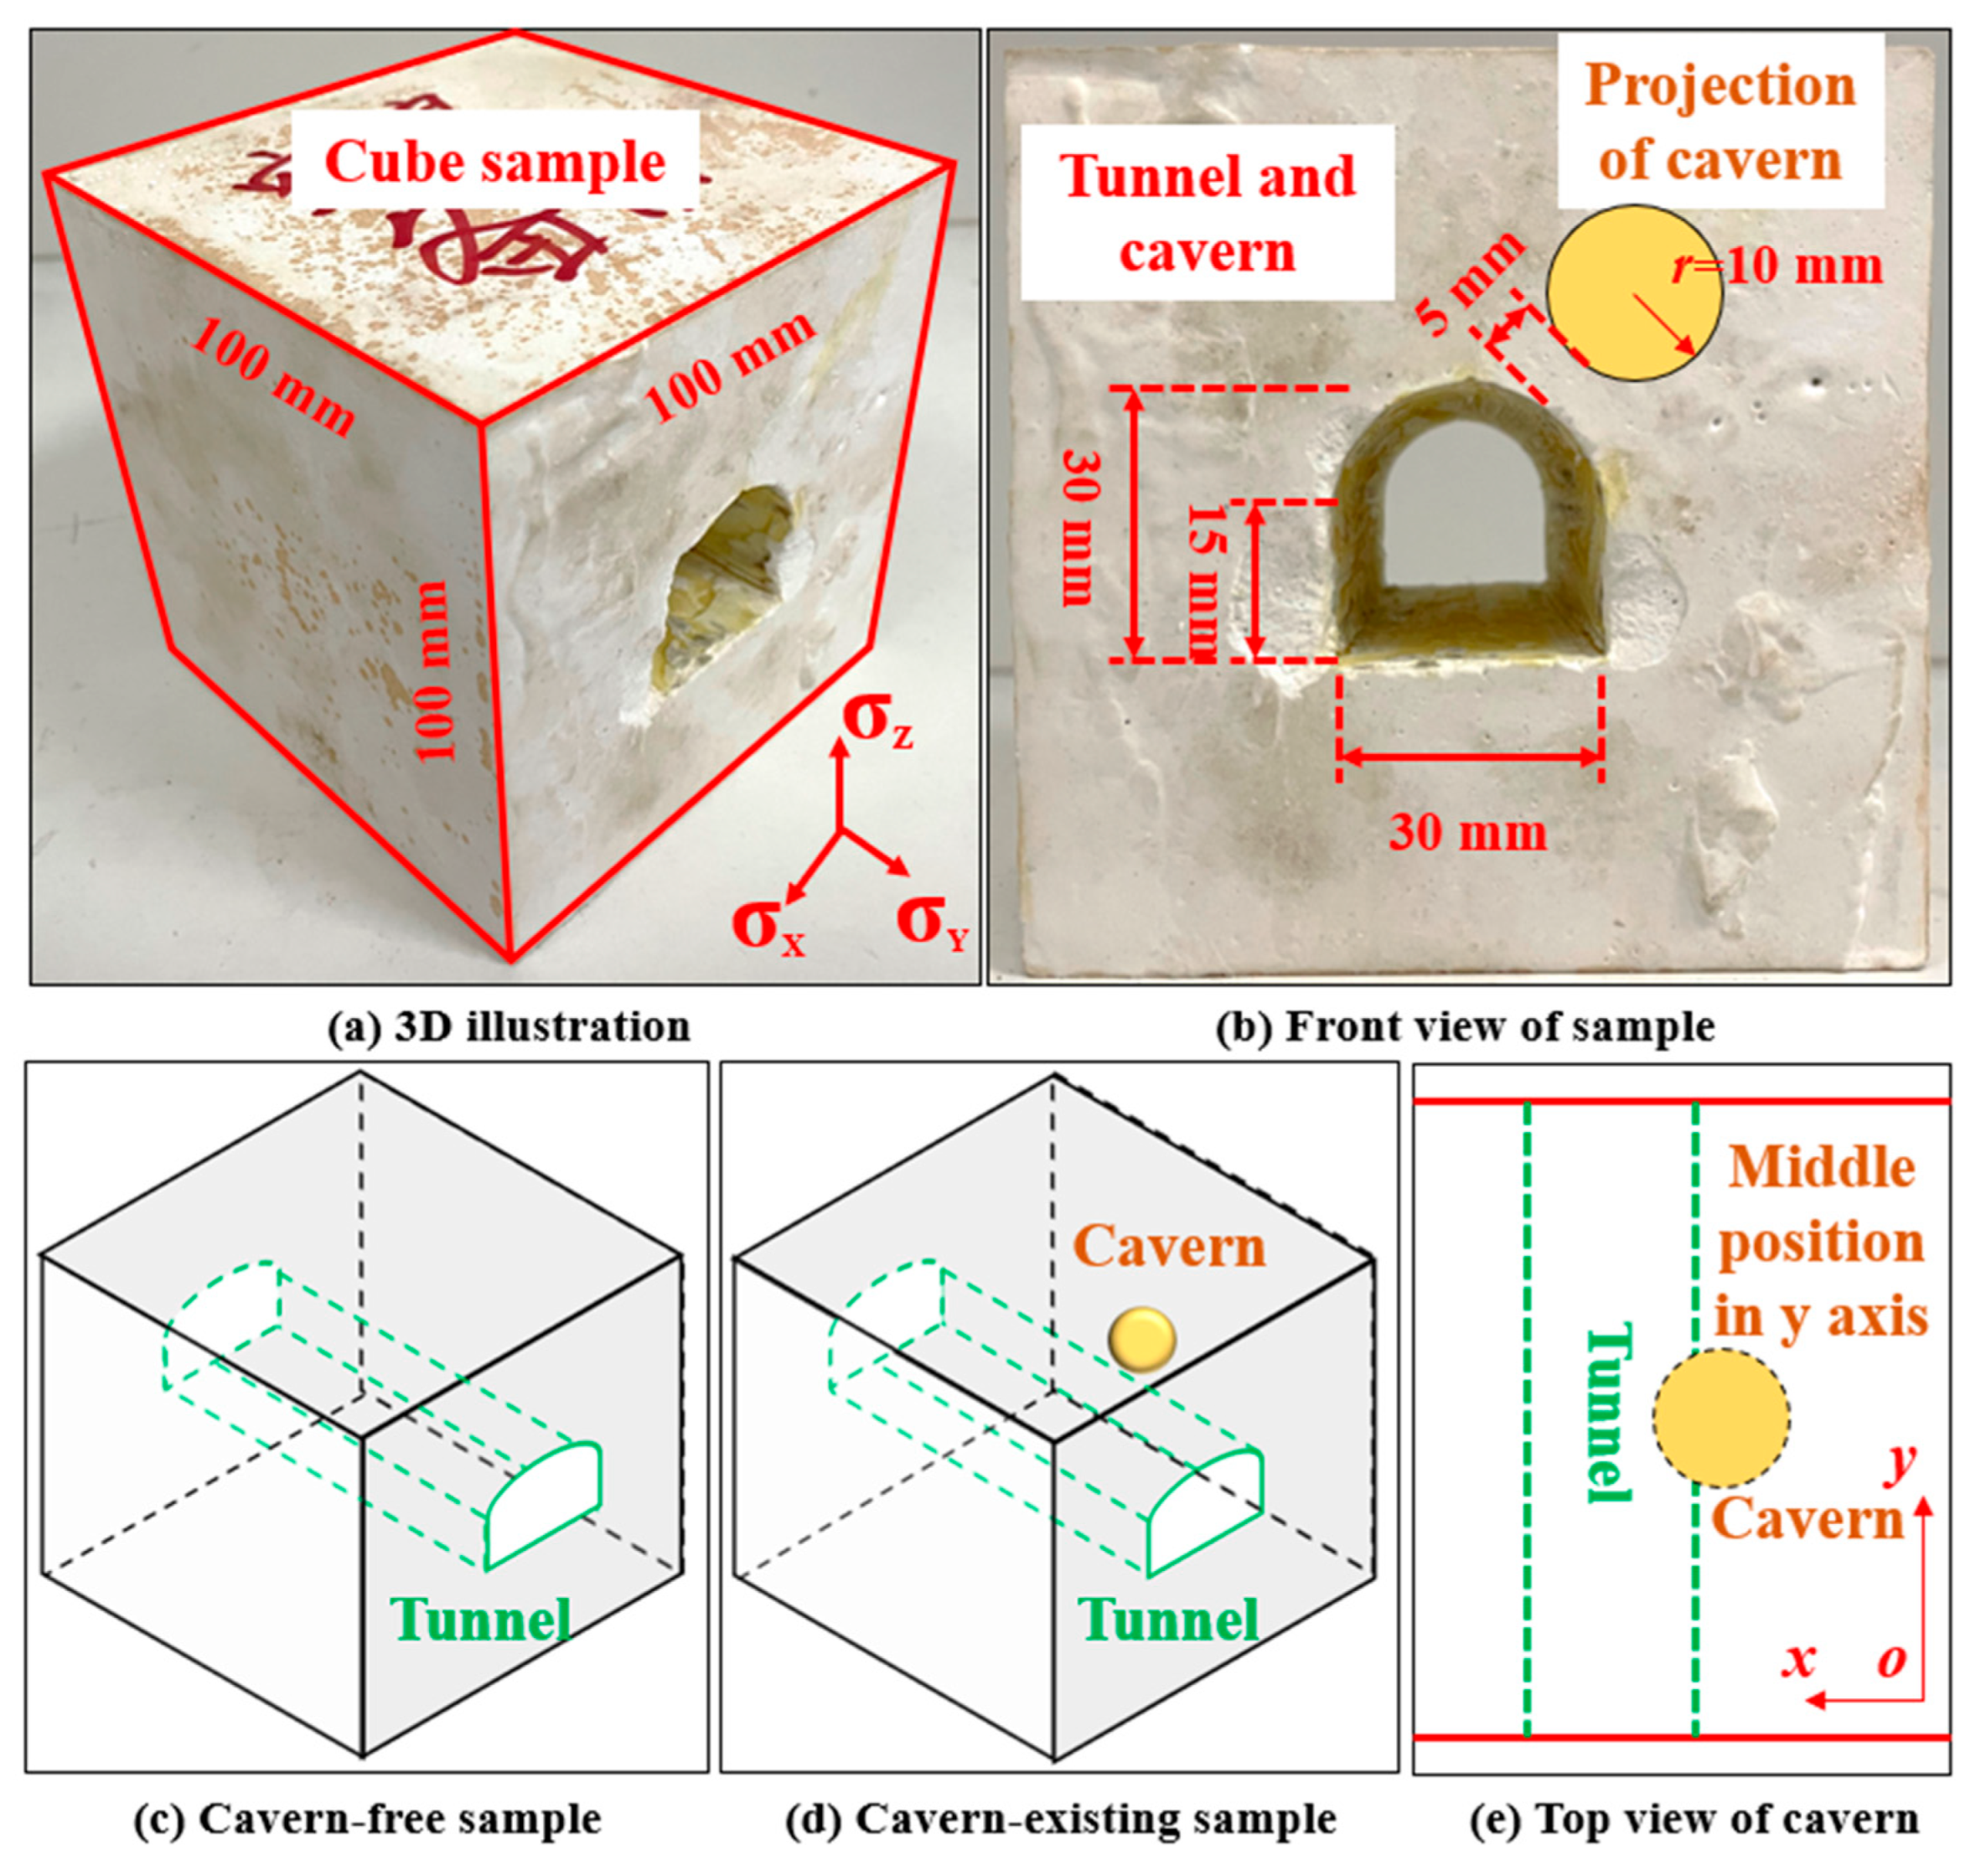
2.2. Controlled Samples’ Design

The engineering background for this work is the Bojitian #1 gold mine of the Zijin Mining Group (in Guizhou province). The arc arch tunnel is used in underground mining engineering. In addition, this area belongs to typical Karst Plateau stratum, and the karst phenomenon is extremely developed (forms many original caverns in rock mass).
There were two types of samples in the controlled test: the cavern-free sample and the cavern-containing sample. Figure 1 illustrates the basic geometric design of the samples; the cubic specimen was applied to conduct the true triaxial compression test, where the arc arch tunnel was built in the center of the specimen (the geometric similarity ratio of the simulated and real tunnel section is 1:1000). The tunnel was formed by the ‘Embedded extraction method’: the steel tunnel model was inserted into the uncured gypsum slurry and pulled out after the initial setting of the gypsum.
In order to obtain more ideal experimental results (the prefabricated cavern shows strong influence on the top vault and sidewall of tunnel), the invisible cavern (radius is 10 mm) was placed on the right side of the tunnel vault (in the x-o-z plane) and the minimum distance between the cavern and tunnel was 5 mm; the prefabricated cavern distributes at the central position in the y direction. The position of prefabricated cavern (polymer model) was fixed by a thin fish wire, the x and z coordinates were located by the fixed point of the wire on the model mold, and the y coordinate was controlled by the length of wire.
To ensure the reliability of the experimental results, each group of experiments contained three identical test blocks. The cavern diameter was controlled by the polymer ball (three sets of diameter errors not exceeding 1%).

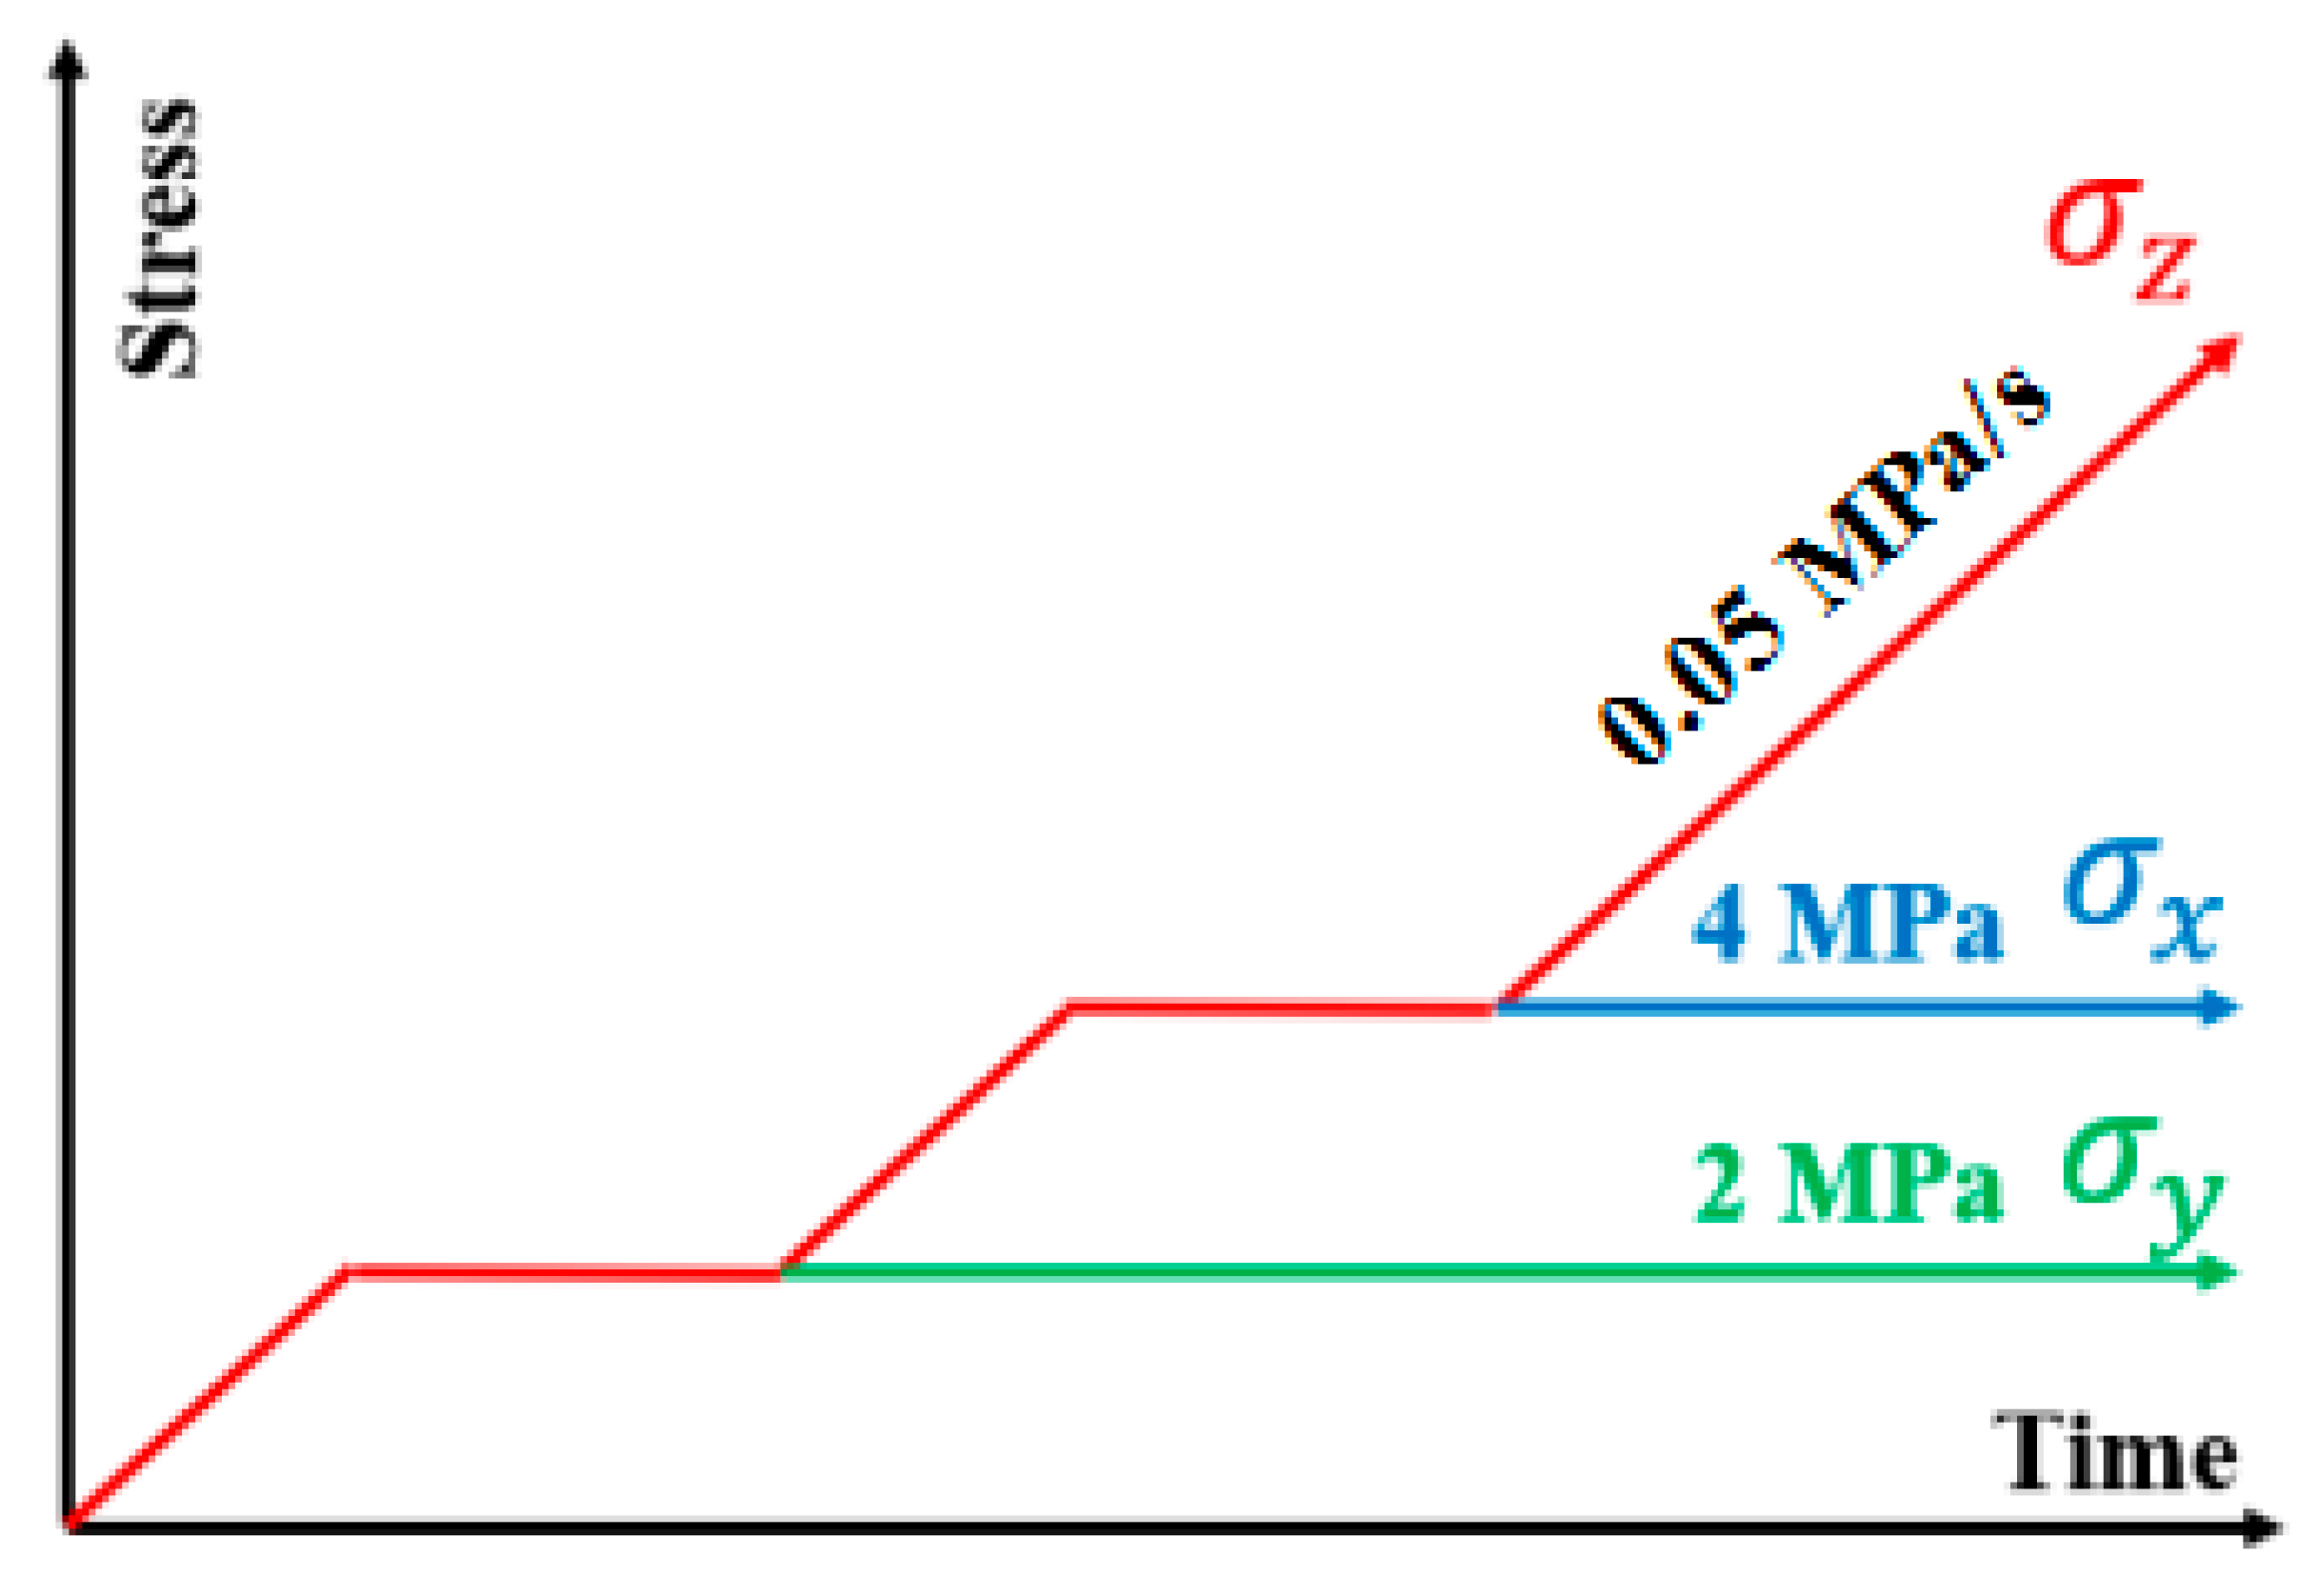
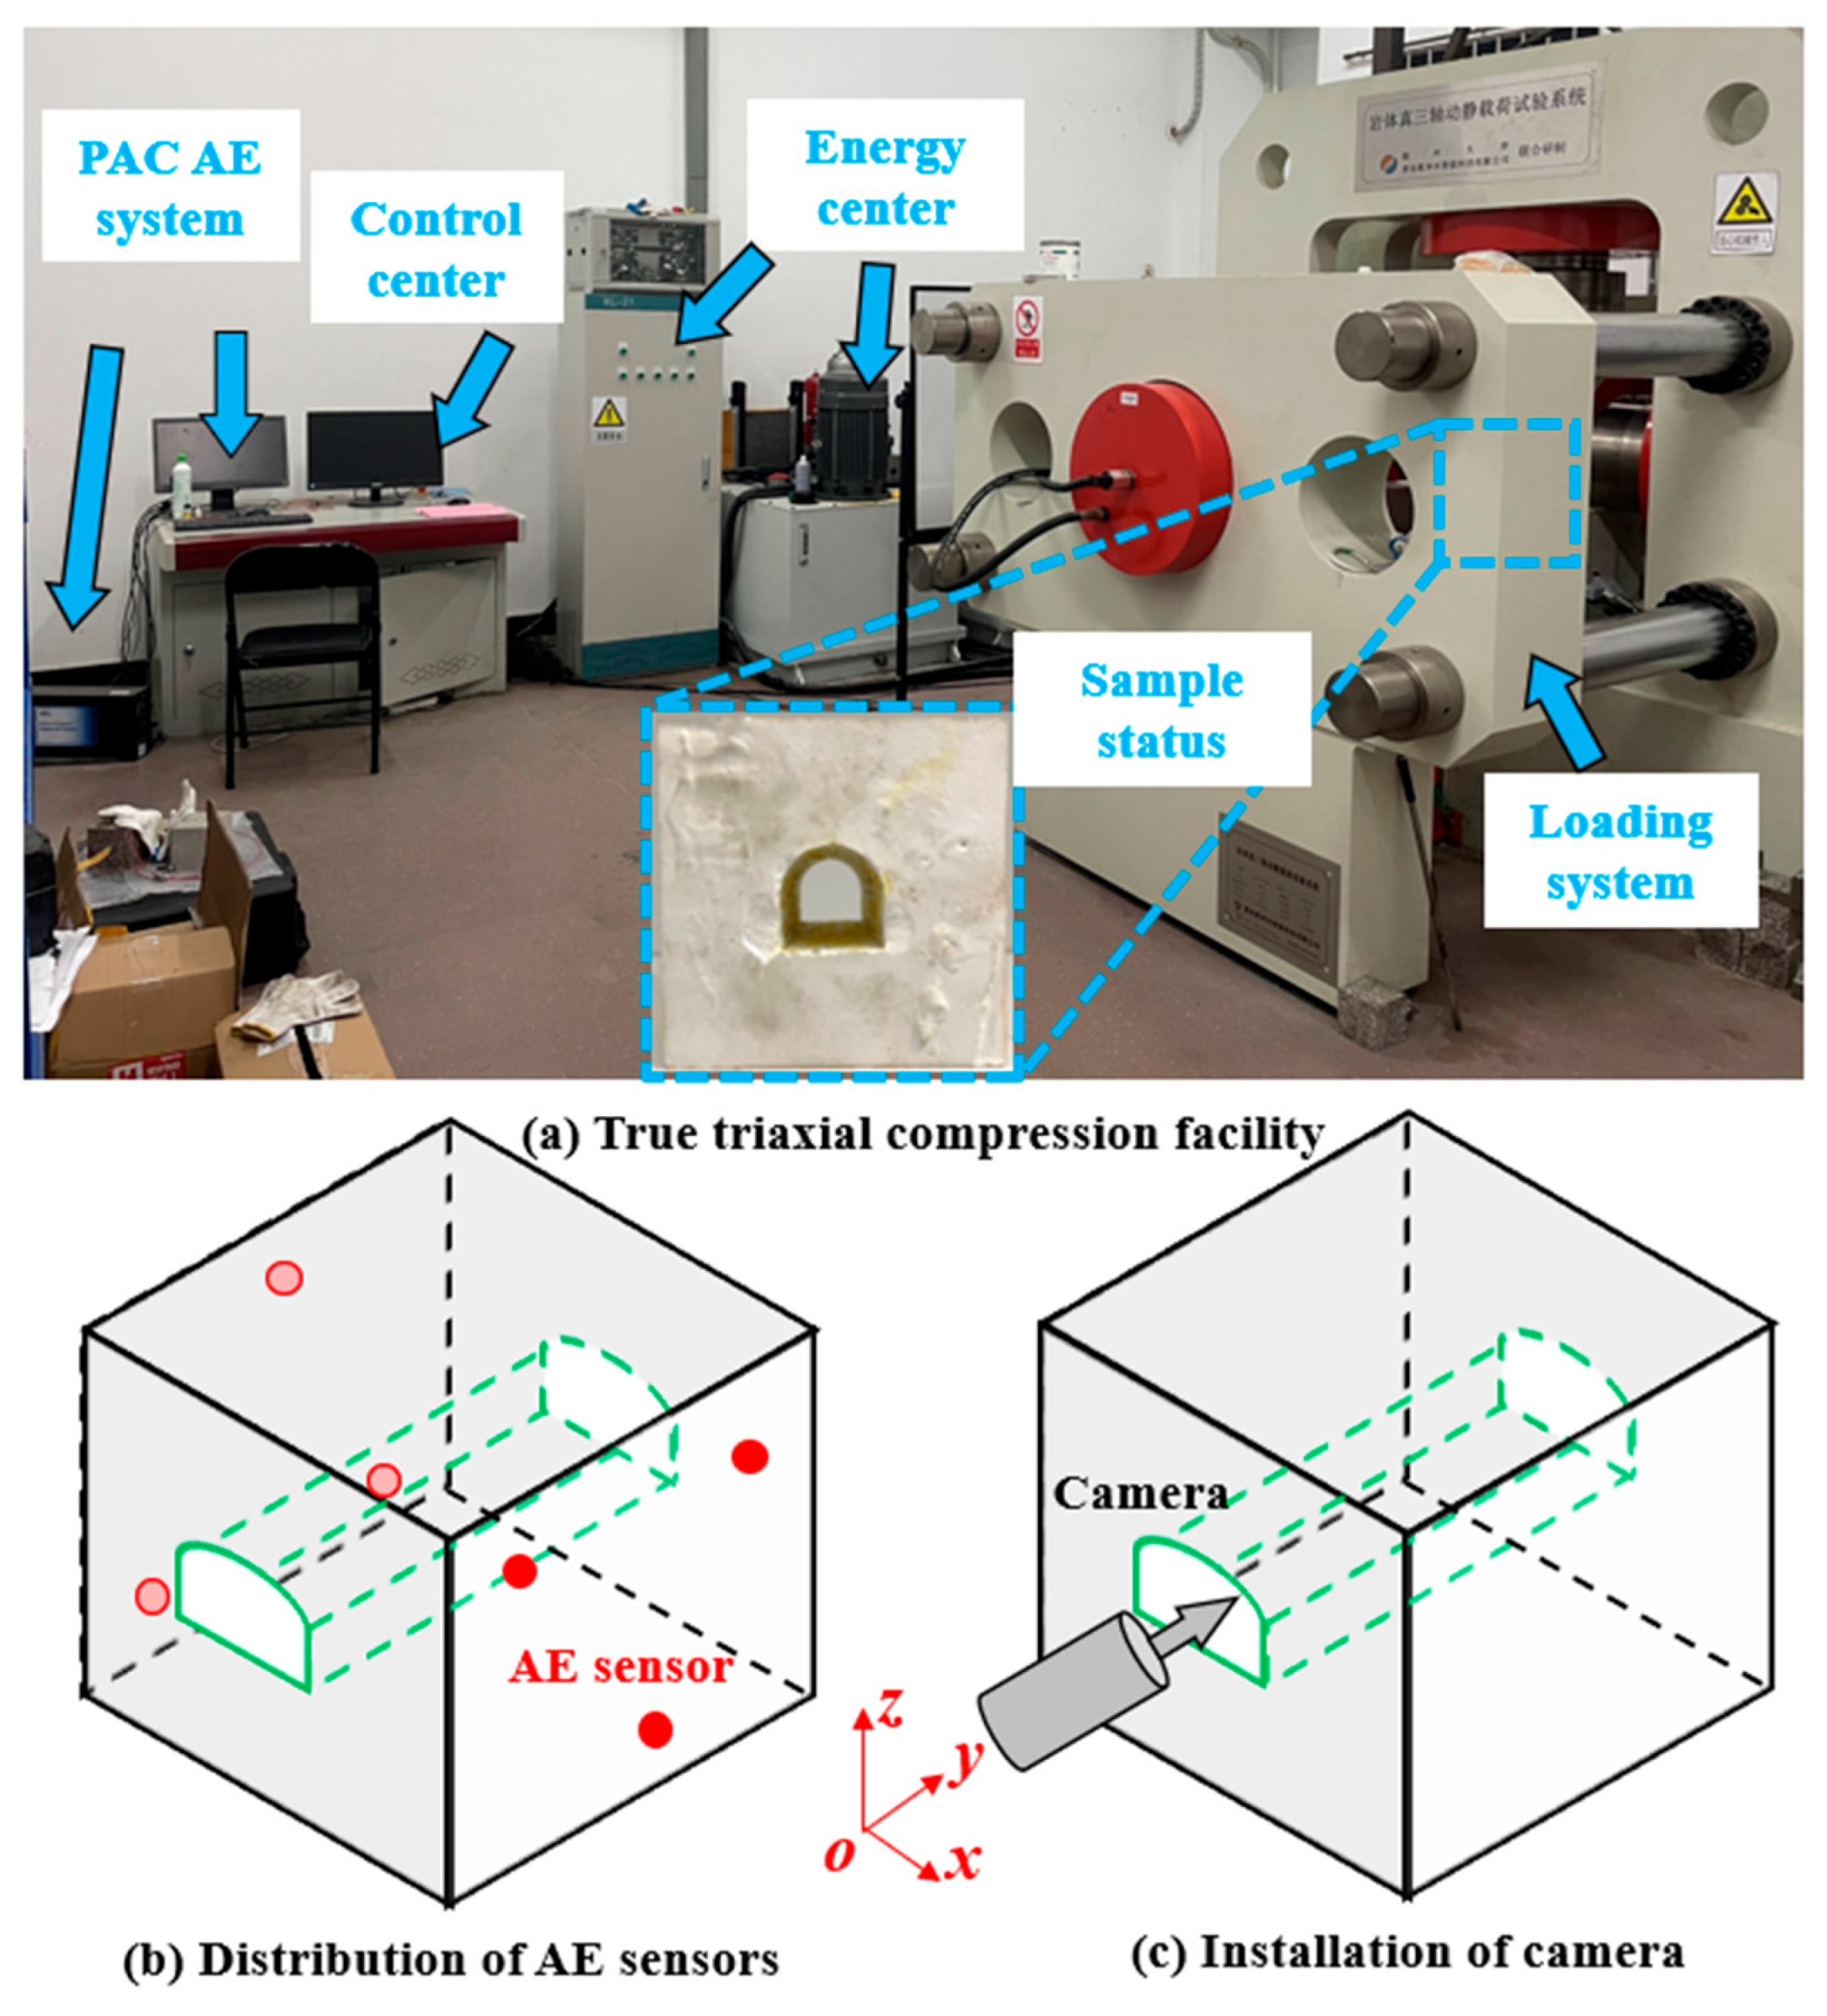
2.3. True Triaxial Compression Test and Monitoring Facilities

The above cube rock-like sample was applied in the true triaxial compression test, and the loading path is shown in Figure 2; the loading rate in three directions was 0.05 MPa/s. In order to ensure that there was no obvious secondary failure in the sample during the pre-stressed loading stage (no visible cracks and no high-energy AE events appearing in this period), the horizontal predetermined loads were set as 2 MPa (y direction) and 4 MPa (x direction) through several pre-experiments. Commonly, controlling the loading rate with force can lead to rapid and severe failure of the specimen after the UCS state, and thus the peak and pre-peak periods were involved in this work, which provide clear destruction development and controlled deformation. Furthermore, to fully capture the failure-related data during the test, the acoustic emission technology (PCI-2 AE system) was applied to monitor the internal secondary failure of the sample, and the internal borehole camera (4K, 60 frames per second) was installed along the y direction to picture the visible secondary crack on the tunnel-surrounding rock; a detailed design of the experimental test is shown in Figure 3.

3. Test Results

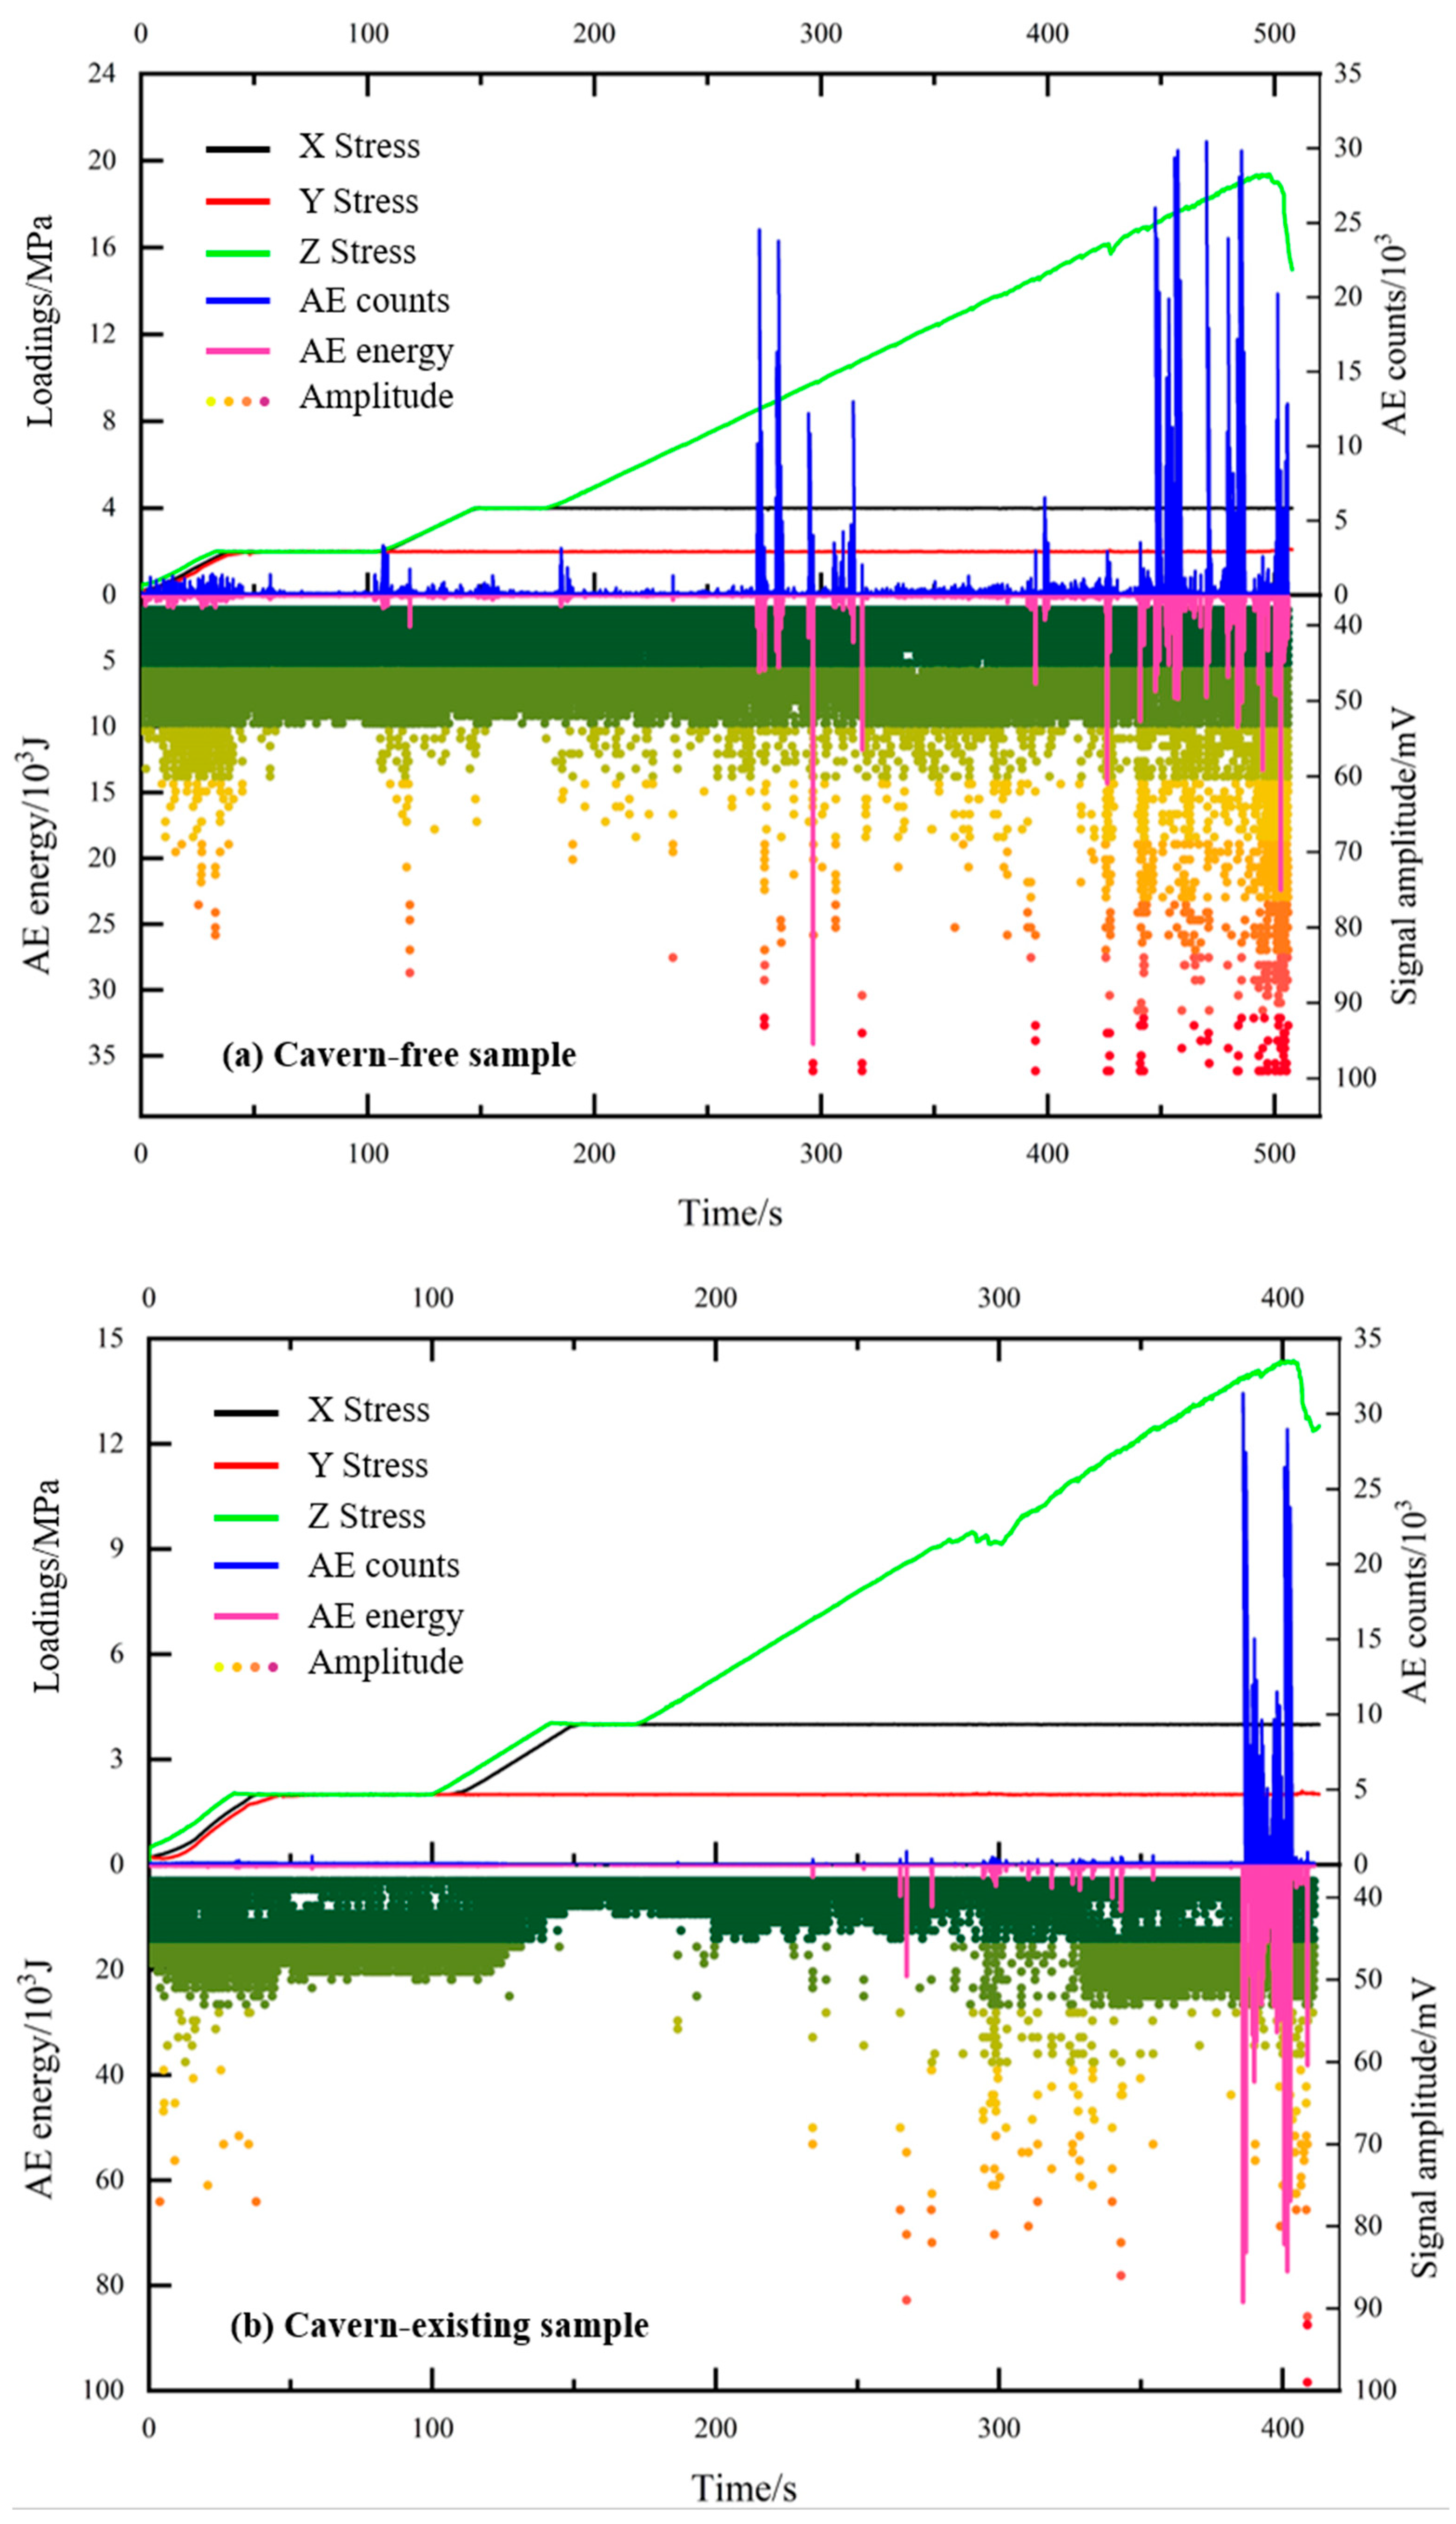
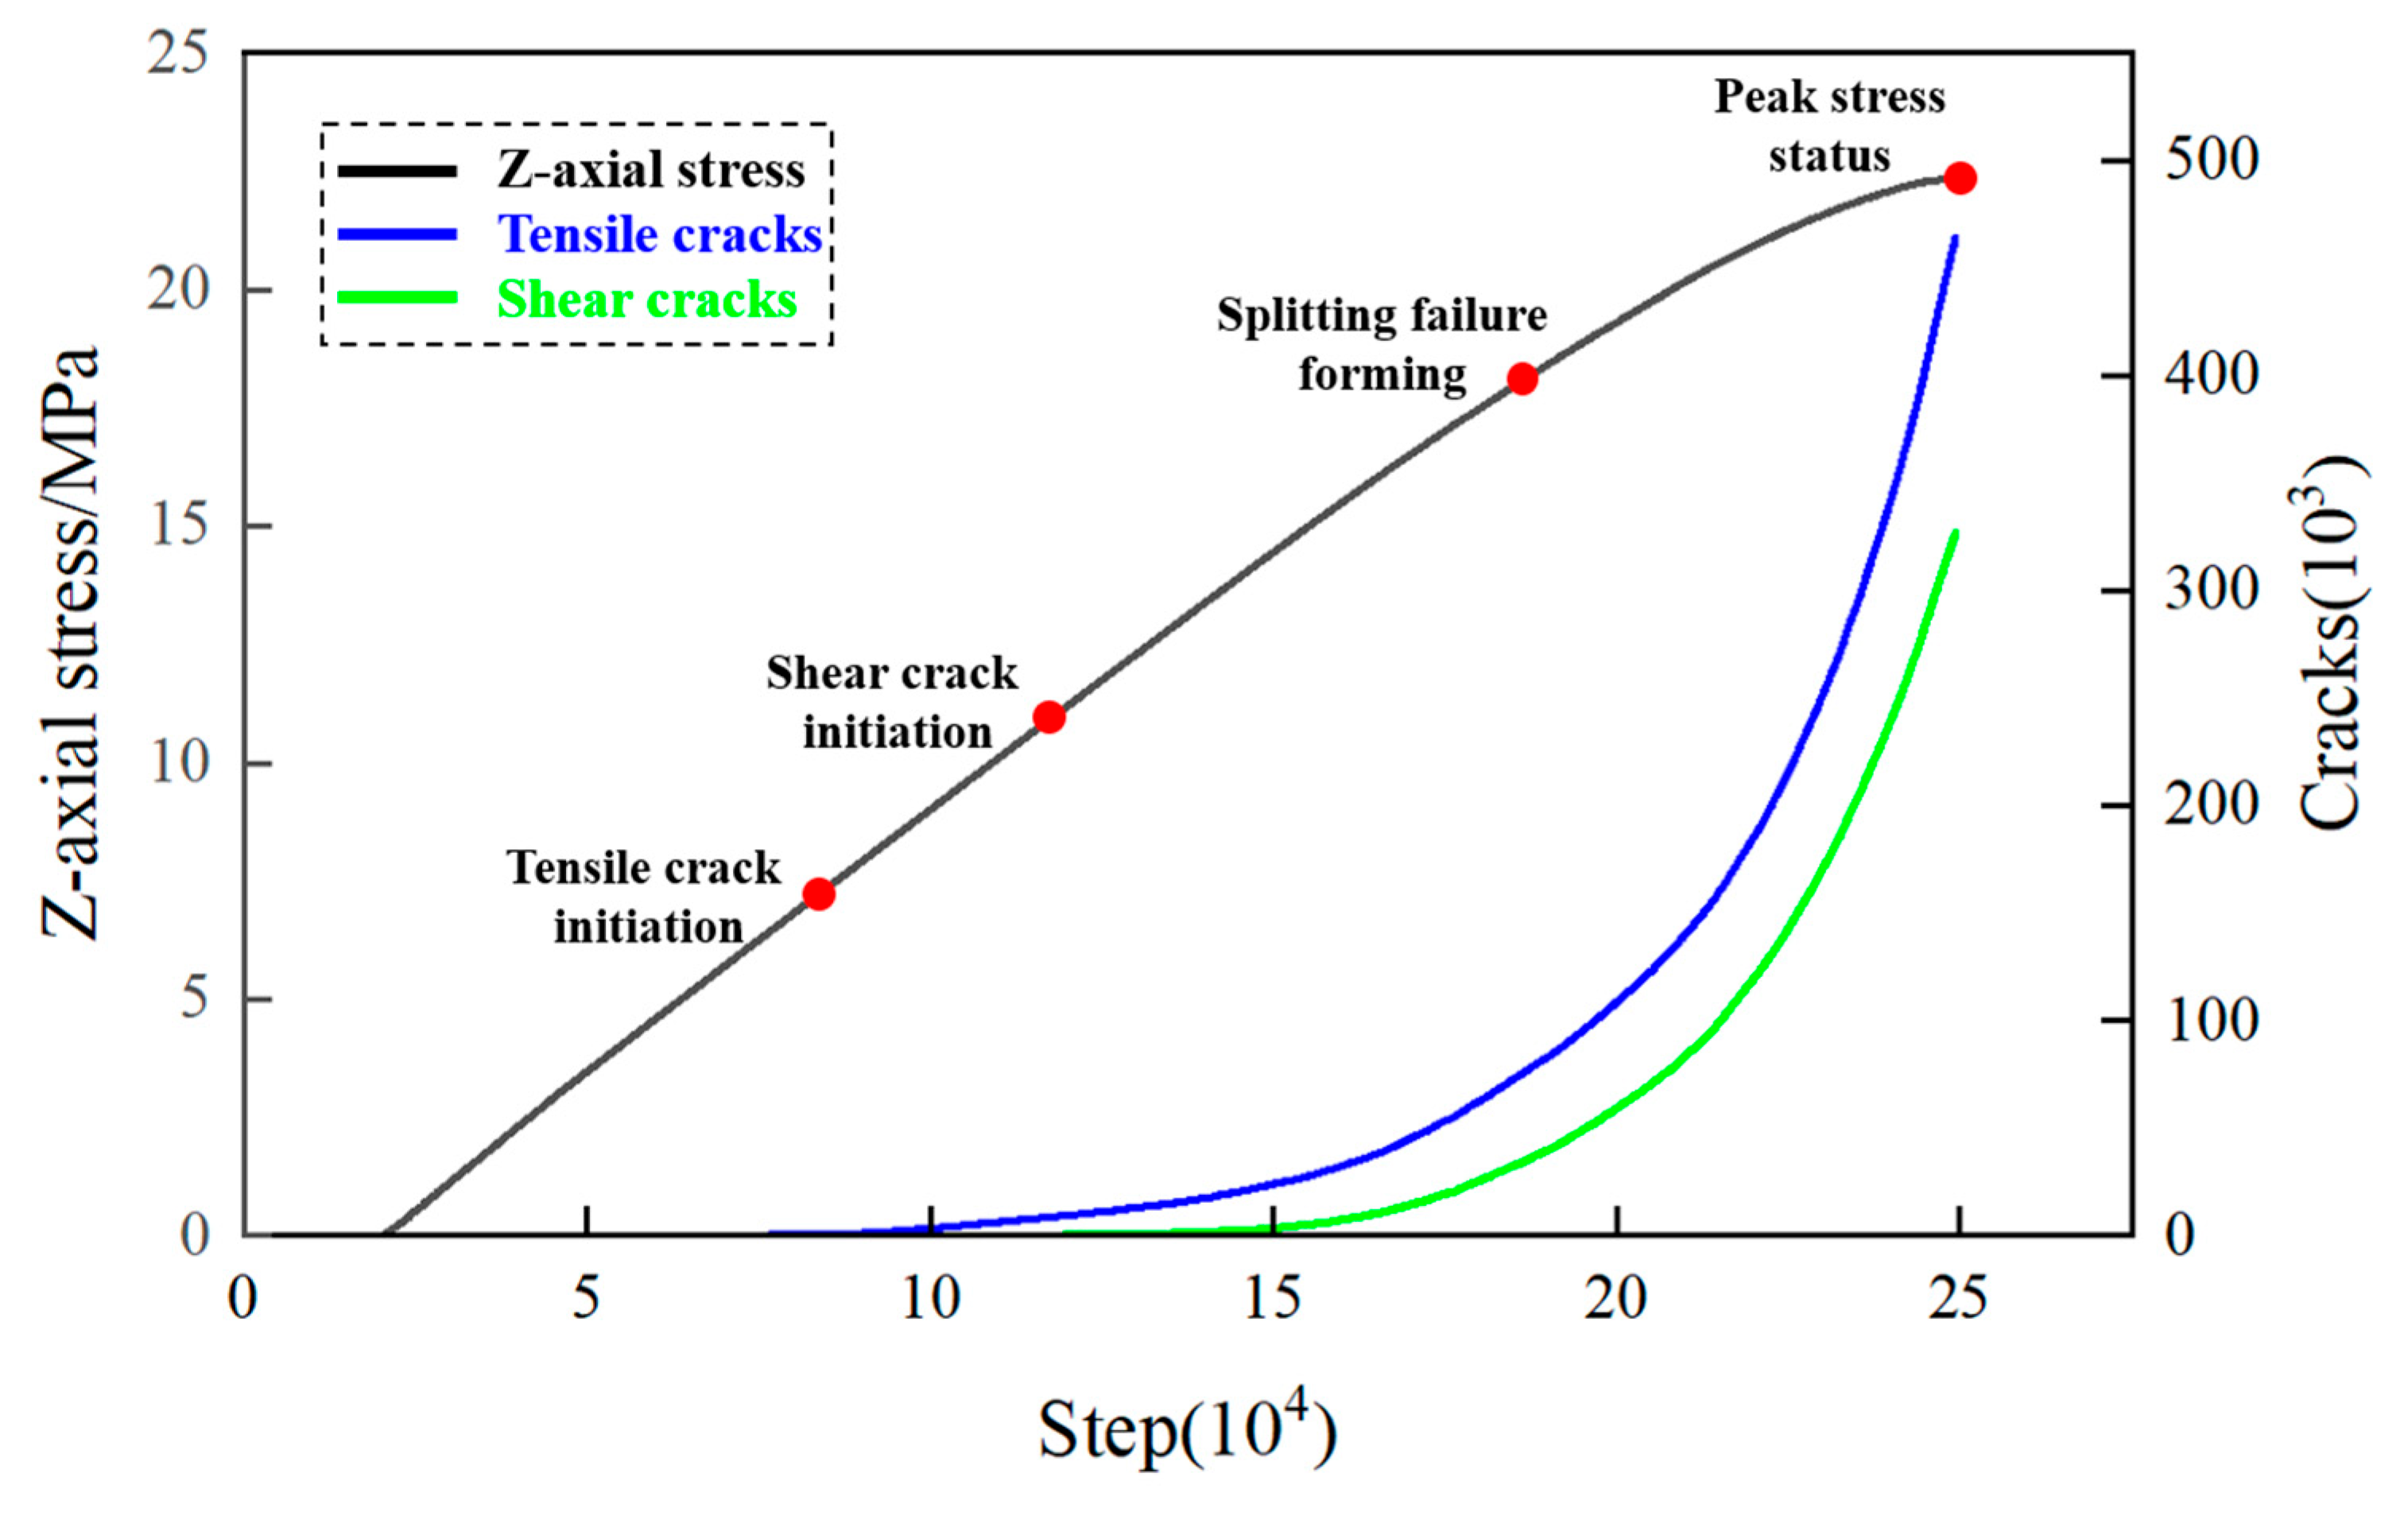
3.1. Mechanical Characteristics and Acoustic Response

Figure 4 shows the time–stress–AE curves of two kinds of samples, and the AE data include AE count, signal amplitude, and energy. The main results are as follows:
(1) Compared to the cavern-free sample (peak strength 19.38 MPa), the cavern-existing sample shows a smaller peak strength (14.38 MPa, 25.82% reduction). The invisible cavern illustrates a strong negative impact on the strength of the tunnel-surrounding rock.
(2) The AE events densely occur at 275~315 s in the cavern-free sample, the maximum AE count during this period approaches 25,000, and the corresponding peak signal energy is over 103 J; the above evidence proves that the typical local failures appear in the rock. AE events maintain a calm period in the following 80 s. The high-energy-intensive AE events occur again from 400 s and continue until the test end; the highest AE signal amplitude (almost 99 mV) is obtained in this period, and the average amplitude is over 50 mV. Therefore, the initiation of local failure is calibrated at about 275 s (z-axis loading is about 8 MPa), and the dominant secondary failure starts at about 400 s (z-axis loading is about 15.5 MPa).
(3) The relatively high-energy AE events (peak energy exceeding 20× 10³ J) start at 267 s in the cavern-existing sample; the obvious stress fluctuation appears at 280~310 s, the signal amplitudes are relatively high, while the AE counts and signal energy remain low. The above evidence indicates that the typical secondary failure appears in the rock, which can be recognized as a local failure because the loading curve keeps a stable increase in the following period. The maximum AE count occurs at 386 s (31,372 events), and the second peak count occurs at 401.6 s (28,974 events), accompanied by the peak z-axis loading; the dominant secondary failure thus starts at 386 s and continues until the test end. In addition, the AE signal amplitudes show gradual decrease during the second round of preloading (125~150 s); the relatively low AE amplitude remain stable until the stress fluctuation appears; the above phenomena may cause by the asymmetric distribution of prefabricated cavern, which lead to the different levels of compactions on both sides of tunnel surrounding rock; therefore, the stable low-frequency signals did not appear in this sample.
(4) Comparing the mechanical characteristics of two kinds of samples, the start time of local failure is almost the same and the initiation time of secondary failure is mainly controlled by the triaxial loading status and the material properties. The major difference between the two kinds of samples is the development speed of the dominant failure. The cavern-free sample takes about 75 s from the first stress fluctuation to the peak stress status, and several rounds of AE bursts (relatively high AE counts, energy, and amplitude) appear in this period. On the other hand, the dominant secondary failure lasts about 20 s in the cavern-existing sample, and the corresponding failure intensity is larger than that of the cavern-free sample. Subsequently, the fast-developing secondary failures induced by the adjacent cavern definitely present a non-negligible negative influence on the tunnel construction.

3.2. Development of Secondary Cracks on the Tunnel-Surrounding Rock

By separating the internal video into individual frames, the deformation and failure characteristics of the tunnel-surrounding rock are captured. The most important results are as follows (shown in Figure 5):
(1) Cavern-free sample: The internal surrounding rock keeps a stable status and no visible secondary failure appears in the majority of tests. As the loading reaches 447 s, the typical local failure initiates at the bottom of sidewalls, and some thin rock debris is ejected. Cracks that develop along the strike direction of the tunnel start at 499 s, and a large range of failures appear in both sidewalls. Splitting failures quickly develop when the z-axis loading reaches the maximum value (507 s), and cracks on both sidewalls present a mirror-symmetric distribution.
(2) Cavern-existing sample: The occurrence of visible secondary failure (about 262 s) is earlier than that in the cavern-free sample; the local failure in the left sidewall only distributes at the bottom position, while the secondary failures occur in the right sidewall bottom and right arc waist (neighboring the prefabricated cavern). The rock block ejected from the right sidewall moves about 2 mm at 300 s, and the secondary failure at the left sidewall remains stable. When the z-axis loading reaches the peak value at 402 s, the destruction degree of the left and right sidewalls is obviously different, and the volume of the rock block at the right sidewall (near the invisible cavern) is significantly larger than the other locations, which means that the cavern has an obvious influence on the distribution of local secondary failure.
(3) Comparing the above results with the mechanical–acoustical data in Figure 4, the initiation and extension periods of the visible secondary cracks in the cavern-free sample are highly consistent with the AE bursts (from 447 s). In addition, the first appearance of visible cracks (262 s) and rock block movement (300 s) in the cavern-existing sample activate typical AE bursts; the AE data reflect that the destruction intensity of the first local failure is more intensive (high AE events and energy) than the following rock block movement. Accordingly, the AE data are important evidence for identifying the development of secondary failures.

3.3. Splitting Failure of the Tunnel-Surrounding Rock

To accurately estimate the splitting failure condition of the tunnel-surrounding rock, the specimen wreckage and rock chips were collected (shown in Figure 6).
Figure 6a shows the results of the cavern-free sample. The splitting failures on both sidewalls present the same distribution when the sample only contains a prefabricated tunnel, and there is no rock ejection or large secondary crack in the top vault. The maximum thickness of rock blocks is about 3 mm, and the corresponding length is about 5~15 mm; the relatively larger rock blocks distribute near the tunnel free face (rock blocks are placed independently on the left bottom). On the other hand, small-size rock debris occurs at the inside rock, and the corresponding length is about 1~3 mm (rock debris is placed independently on the right bottom).
Some special results are obtained from the cavern-existing sample (Figure 6b). The left and right sidewalls show different failure patterns after the true triaxial test, and the secondary failure starts to locate at the tunnel vault. The left sidewall (no cavern) suffers relatively mild destruction, and many of the broken rock blocks are still attached to the sidewall; the corresponding length is less than 5 mm, and the thickness is less than 2 mm. Because the prefabricate cavern is located outside the right arch, rock blocks near the cavern present a relatively large volume; the average length of the rock blocks is bigger than 5 mm, and the corresponding thickness is 2~4 mm. In addition, the most intensive failure distributes near the cavern because the three largest-sized fragments appear at the middle position of the right sidewall.

4. Numerical Simulation

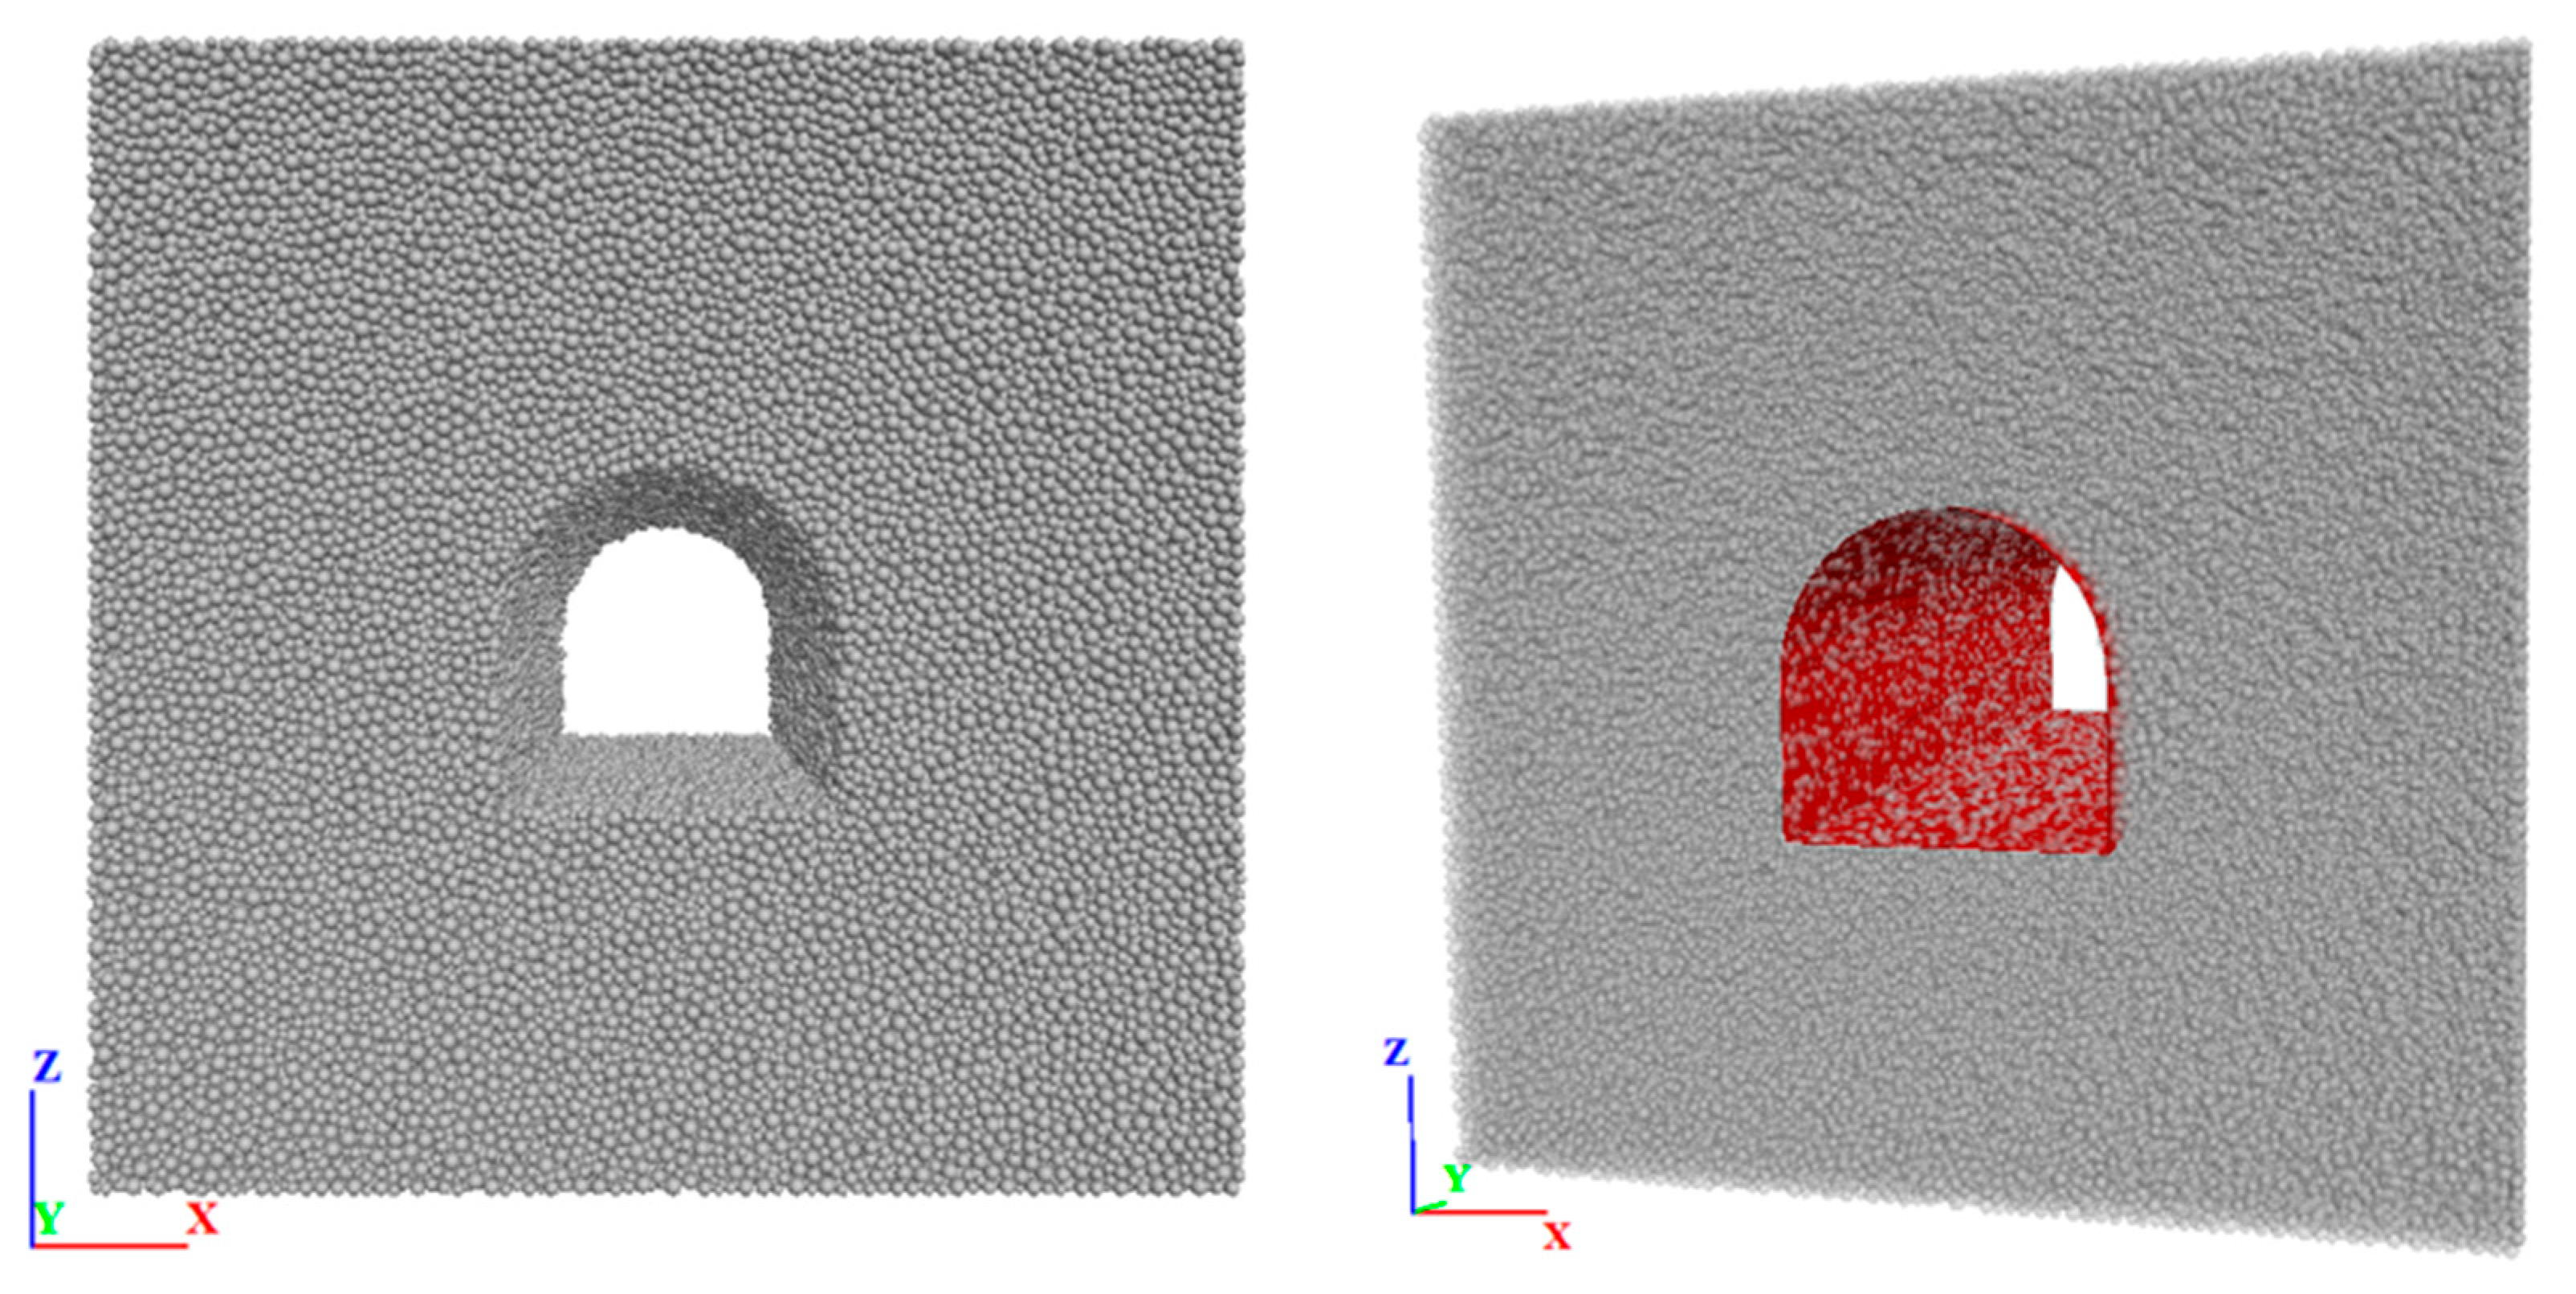
4.1. Numerical Model and the Related Parameters

The cubic numerical model was established in the PFC3D software (PFC3D 6.0), and the FJM3D (flat-jointed model) constitutive model was chosen (Figure 7). Because the macro-physical and micro-physical parameters of the PFC3D model do not show a linear relationship, the model parameters were defined by the trial-and-error method; the parameter calibration was based on uniaxial and tensile test data. Table 2 lists the related mechanical properties of the numerical model, and the experimental and numerical results present good coincidence. The loading rate for the numerical model was set to 0.01 to reflect the experimental loading rate (0.01 MPa/s).
Commonly, the smaller the average particle size of the model, the more accurate the corresponding results. Previous numerical works prove that particle size shows a slight influence on a sample’s compressive strength when the particle size is small enough [30,31]. To balance the calculation efficiency and model precision, the minimum and maximum particle diameters were set as 1 mm and 1.66 mm, respectively. The ratio of maximum particle diameter to the cavern diameter was 8.3% (good model precision), and the total particle number was almost 1,100,000 (this quantity of particles only needs to occupy the workstation for 3–4 weeks).

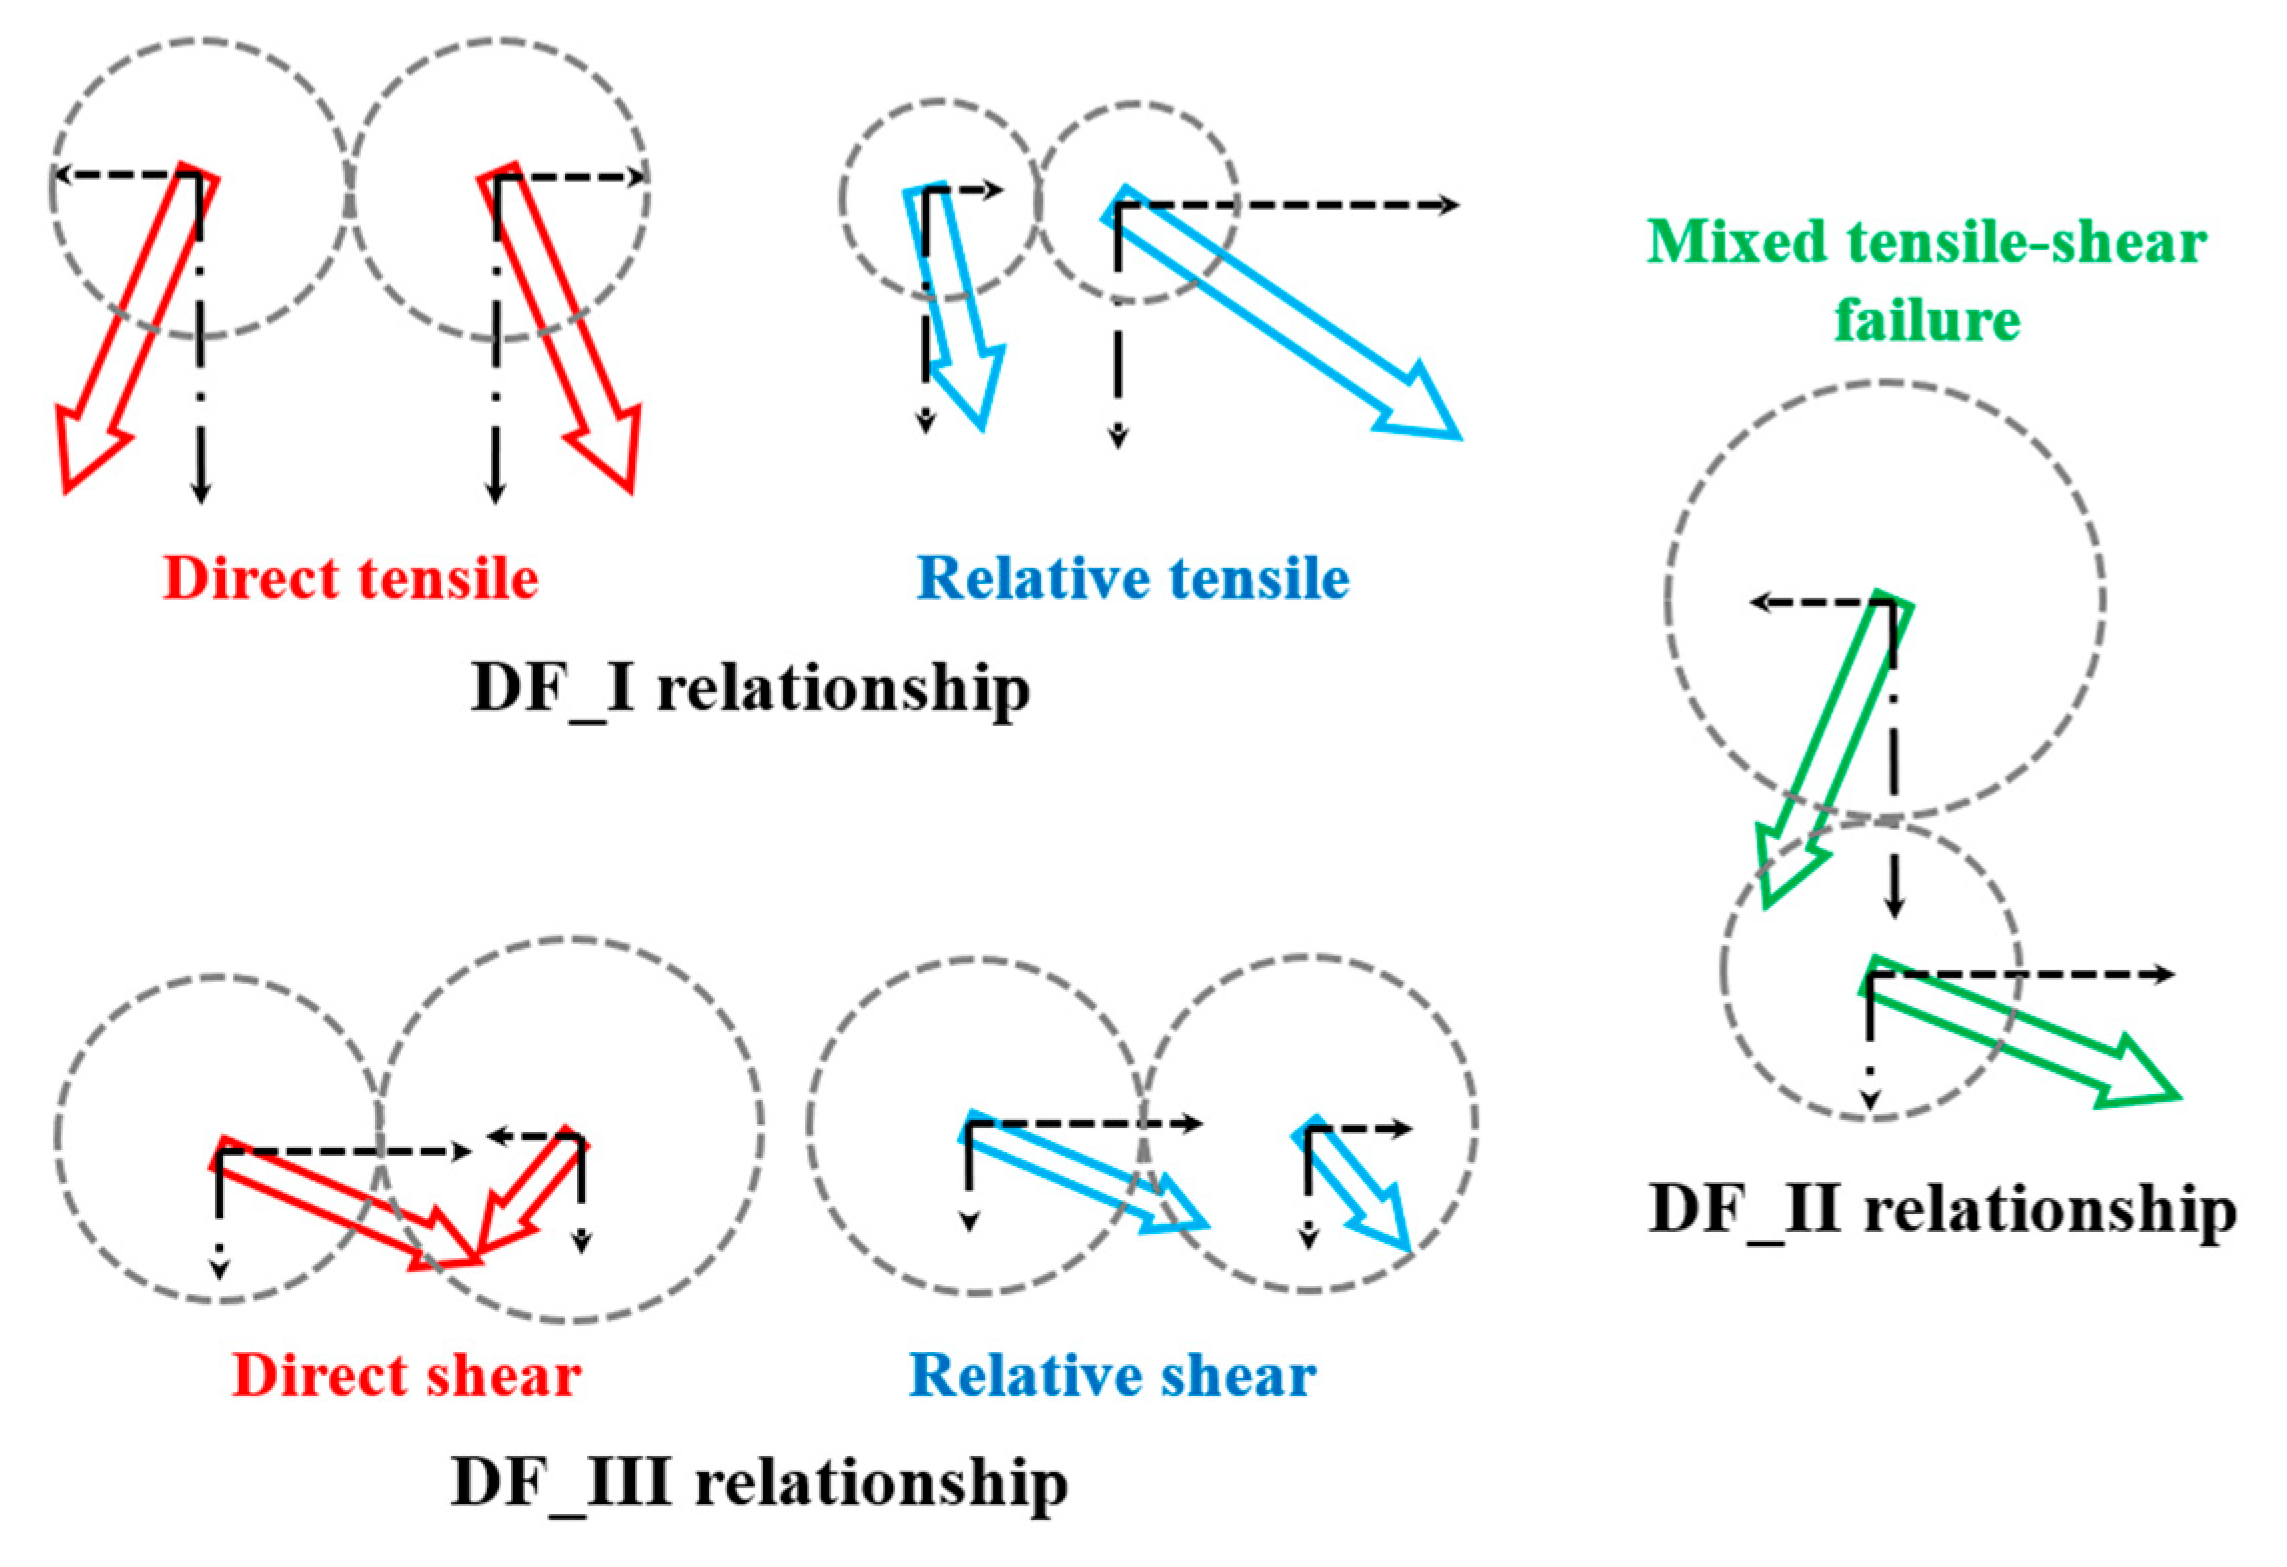
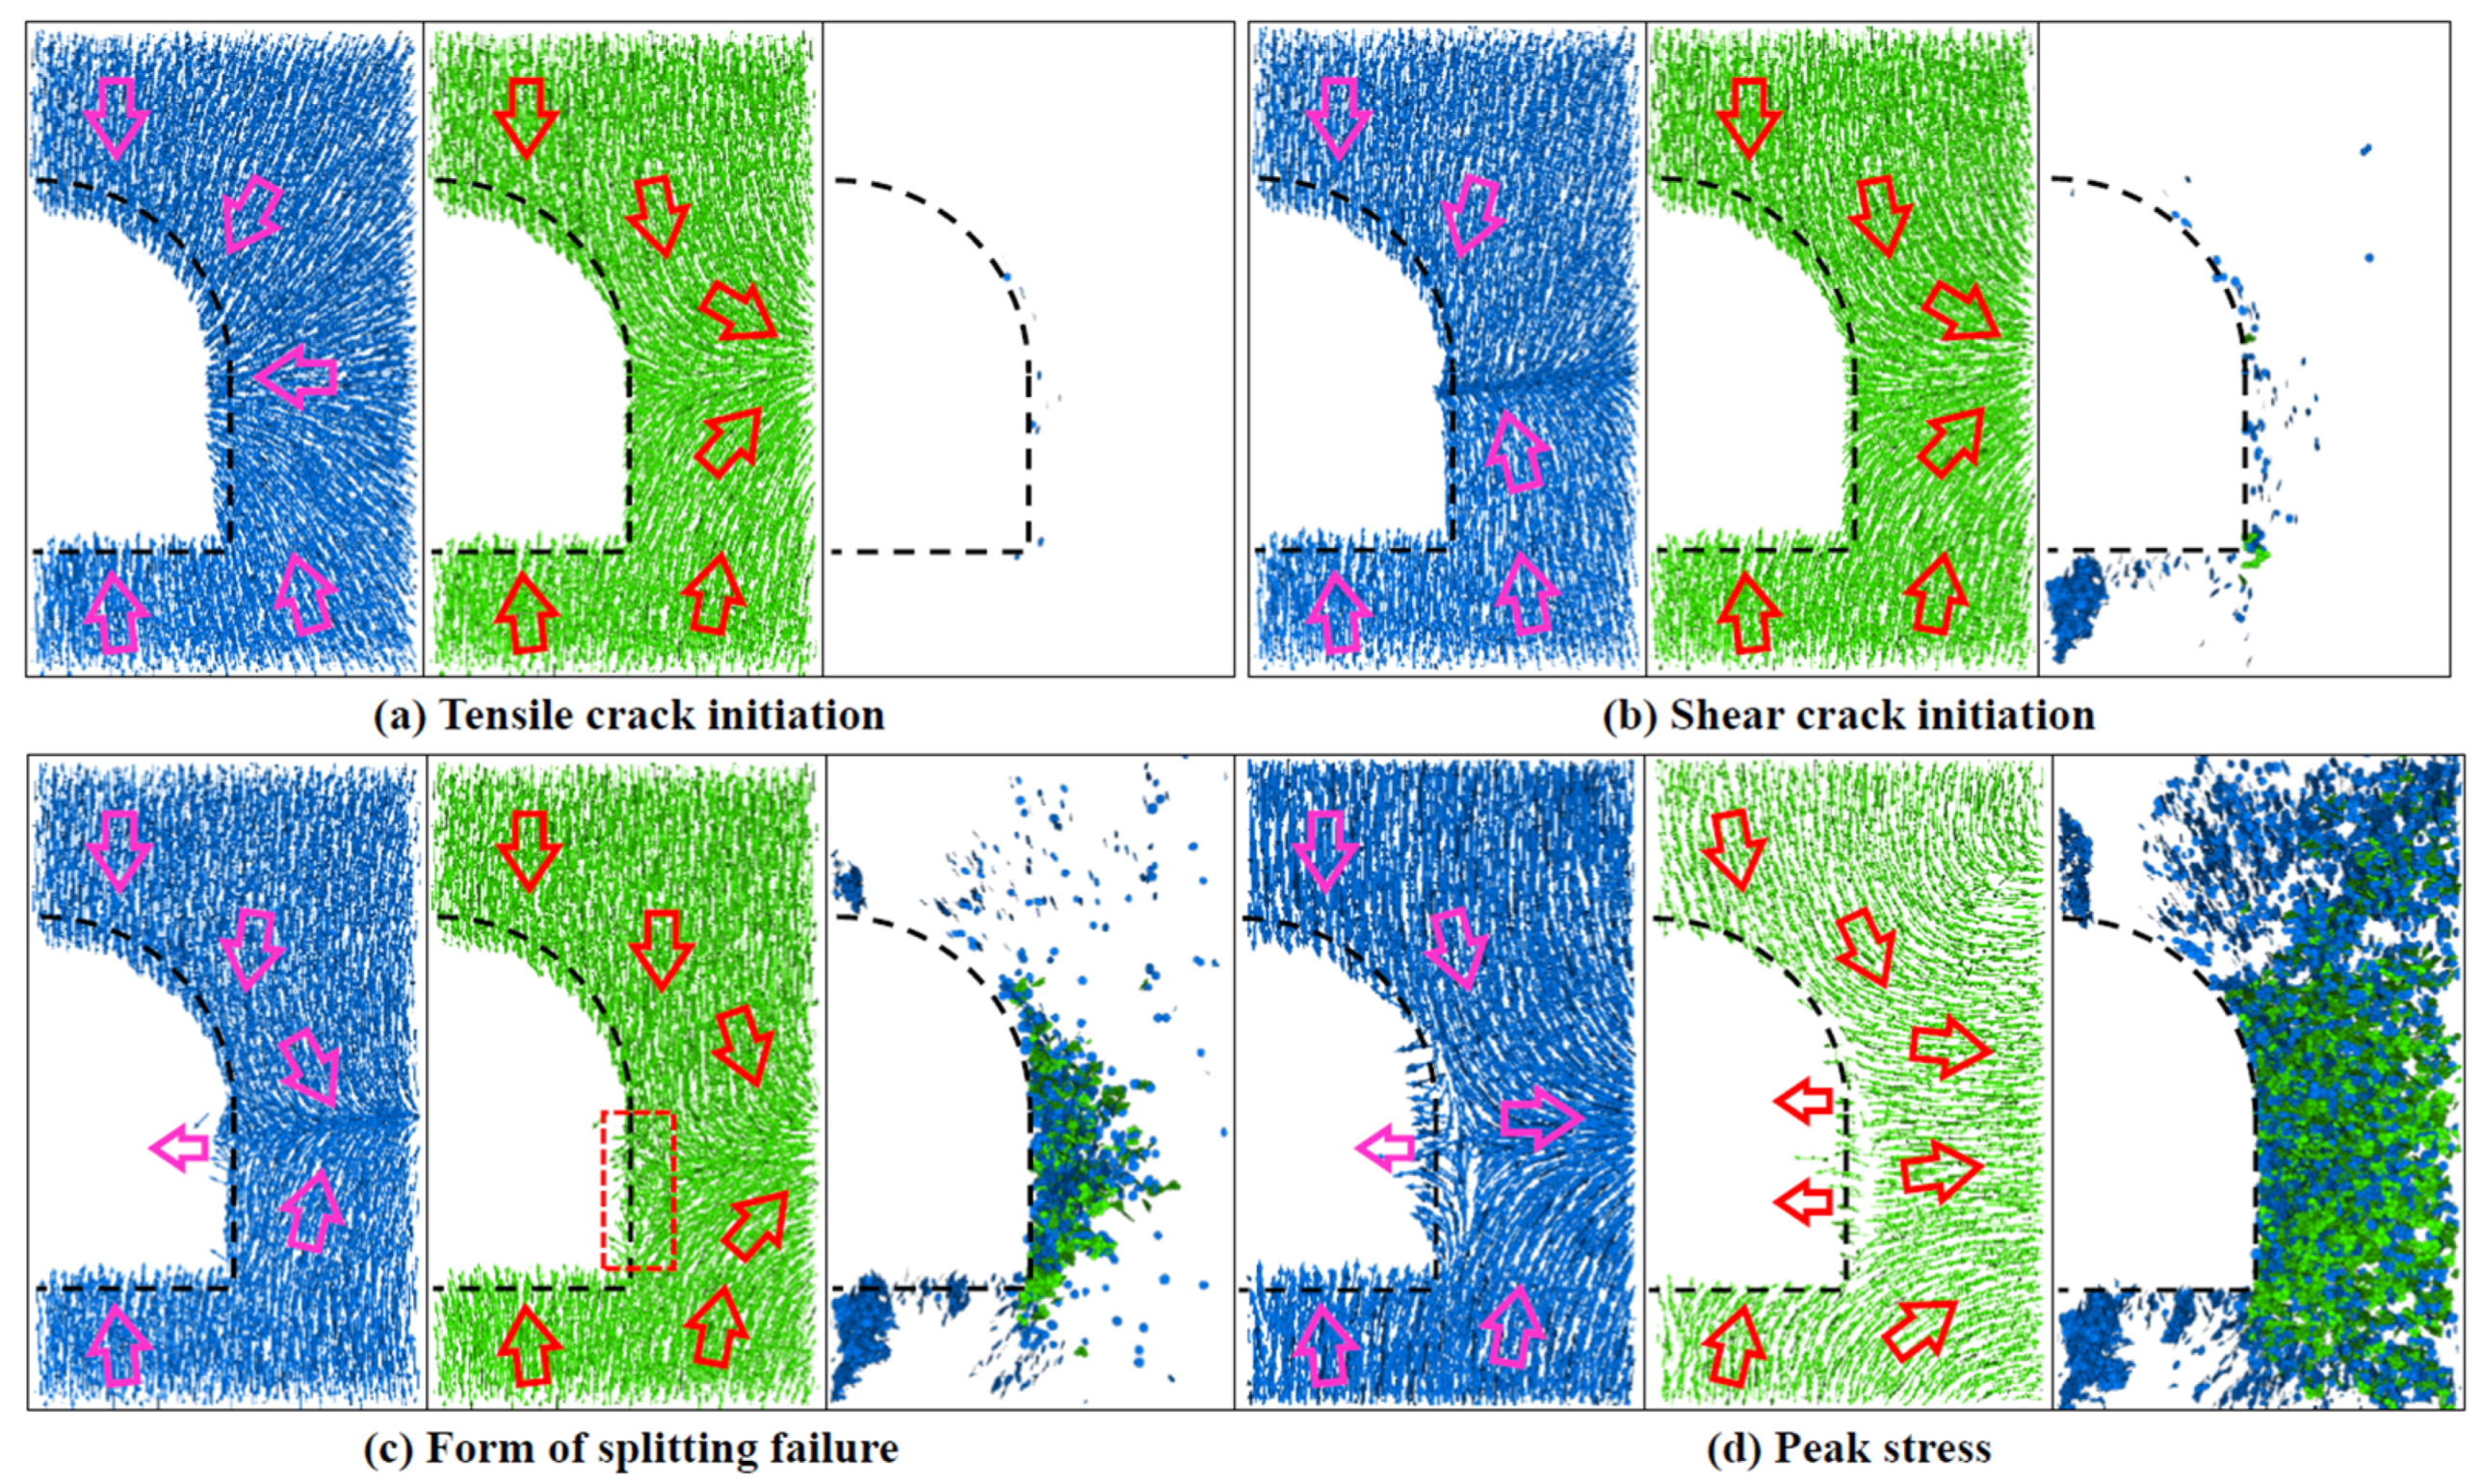
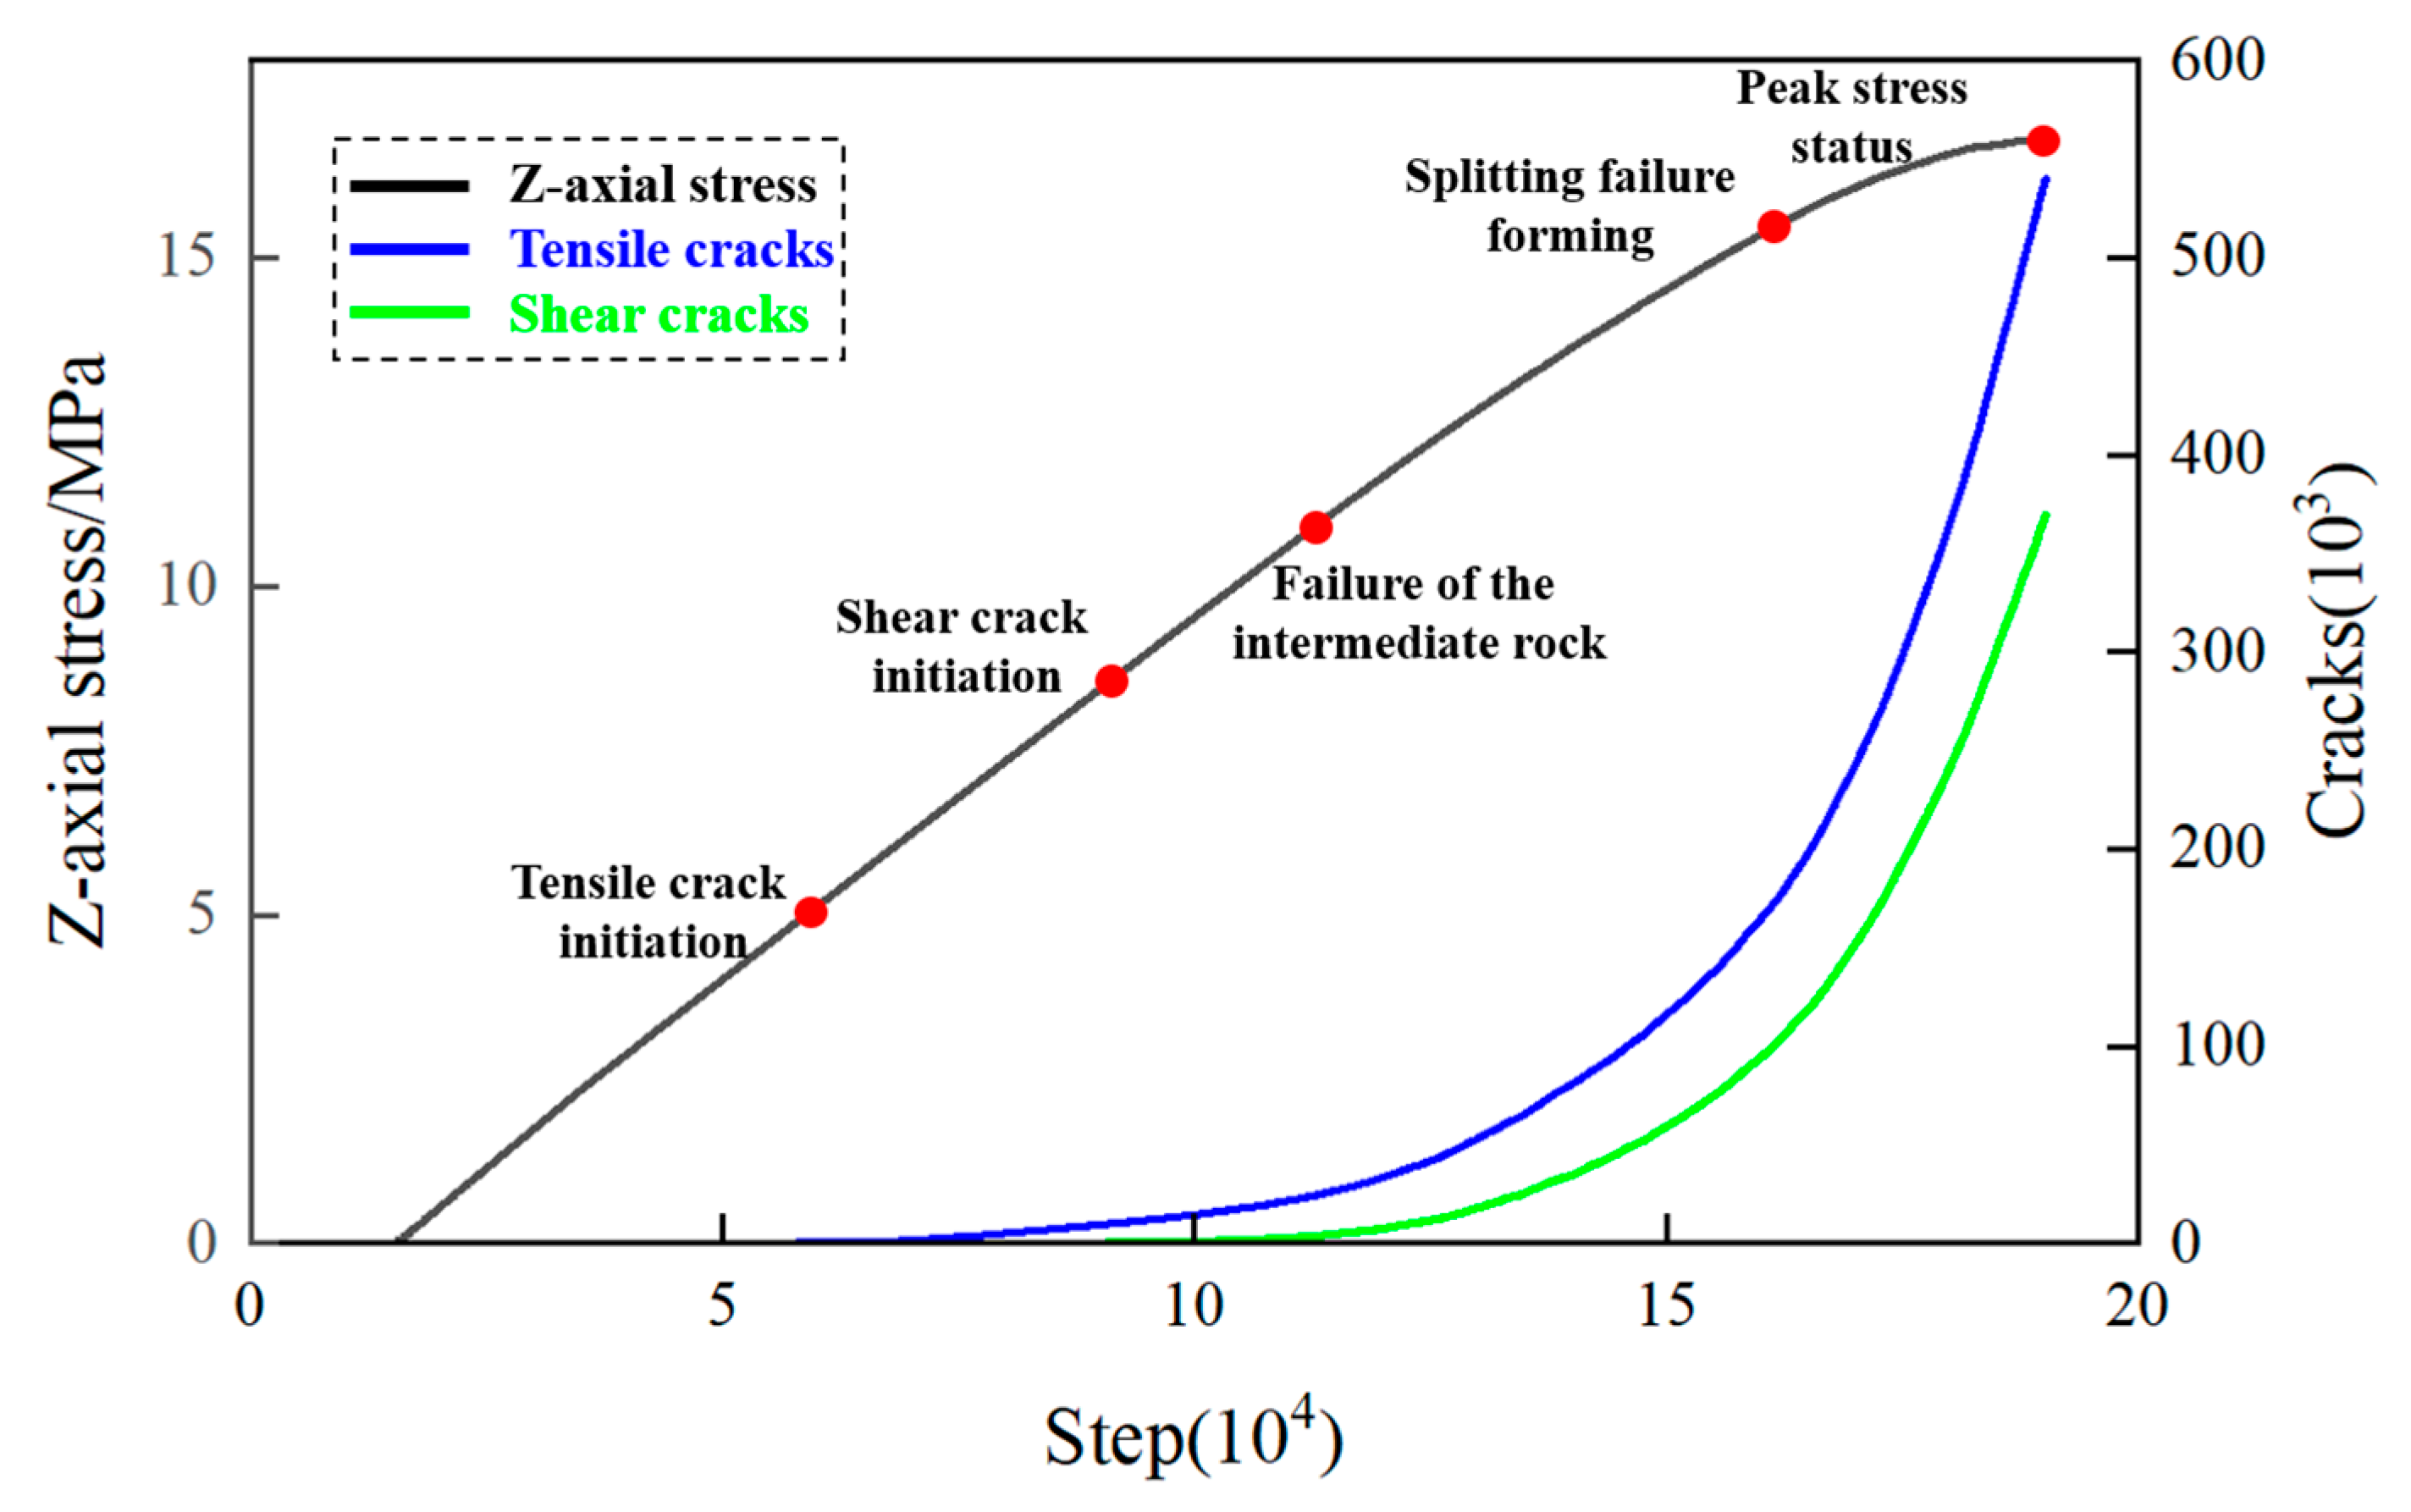
4.2. Cracking Mechanism Analysis

The particle displacement trend method was applied for analyzing the mode of secondary failures. According to the relative movement relationship of neighboring particle clusters (Figure 8), three kinds of typical relationships were devised: (1) DF_I represents the direct and relative tensile failure, (2) DF_II indicates the mixed tensile and shear failure, and (3) DF_III reflects the direct and relative shear failure. However, secondary cracks may open and then close during the true triaxial compression test (the final displacement trend field may not reflect the real failure mode), while the cracks would not close in the traditional uniaxial compression test (because there is no horizontal restriction, so particles move freely in the x and y directions); we thus apply both displacement and velocity trend fields in the following chapter to verify whether the velocity field or the displacement field is more suitable for true triaxial testing.

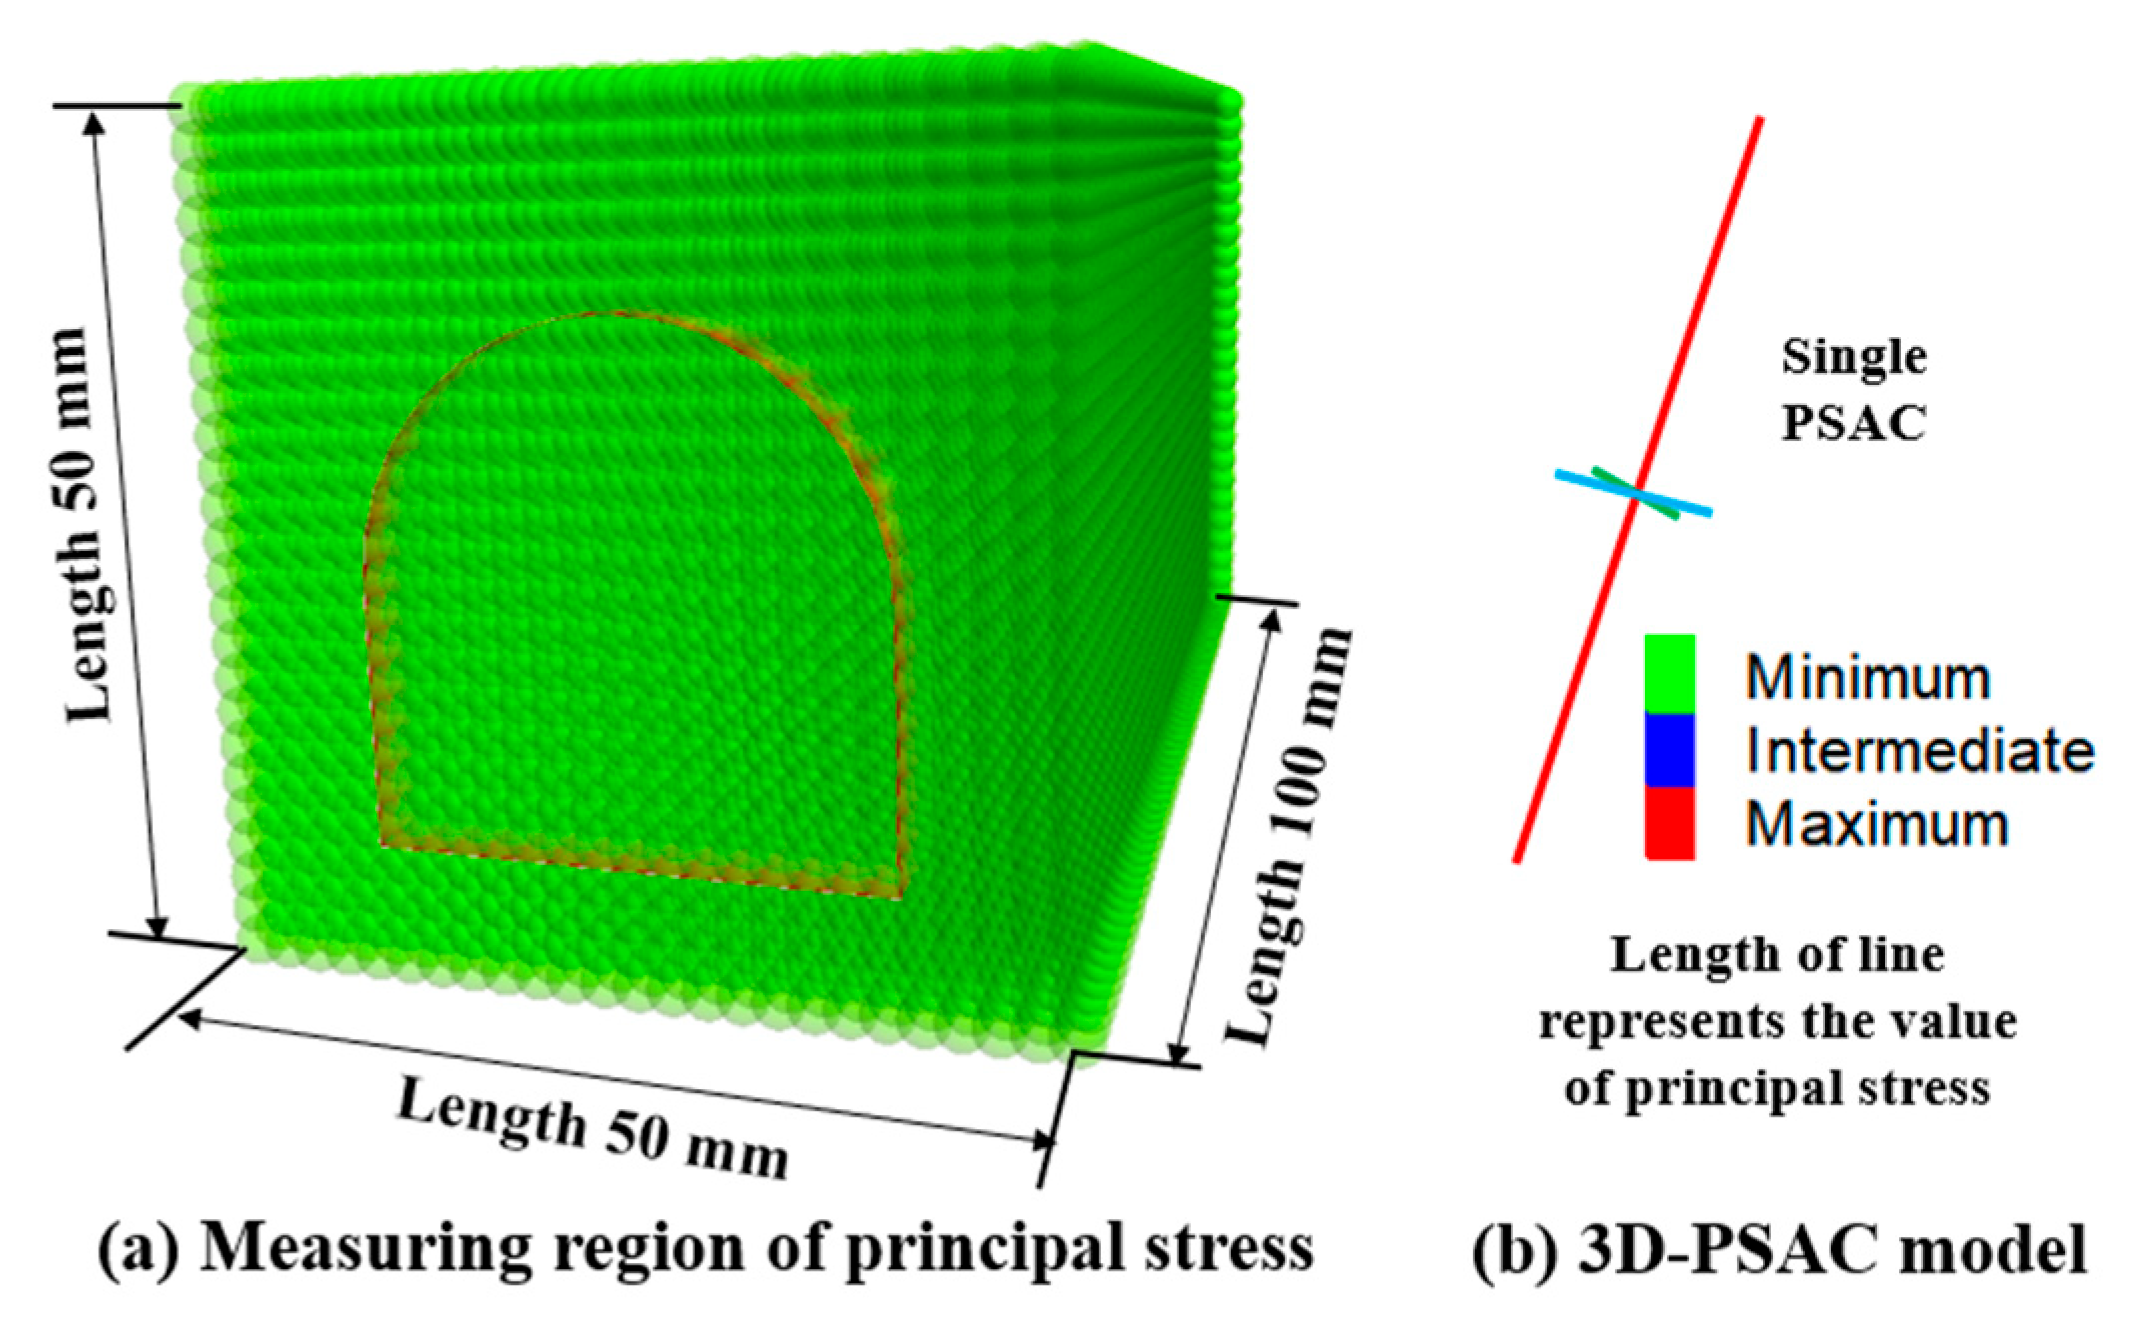
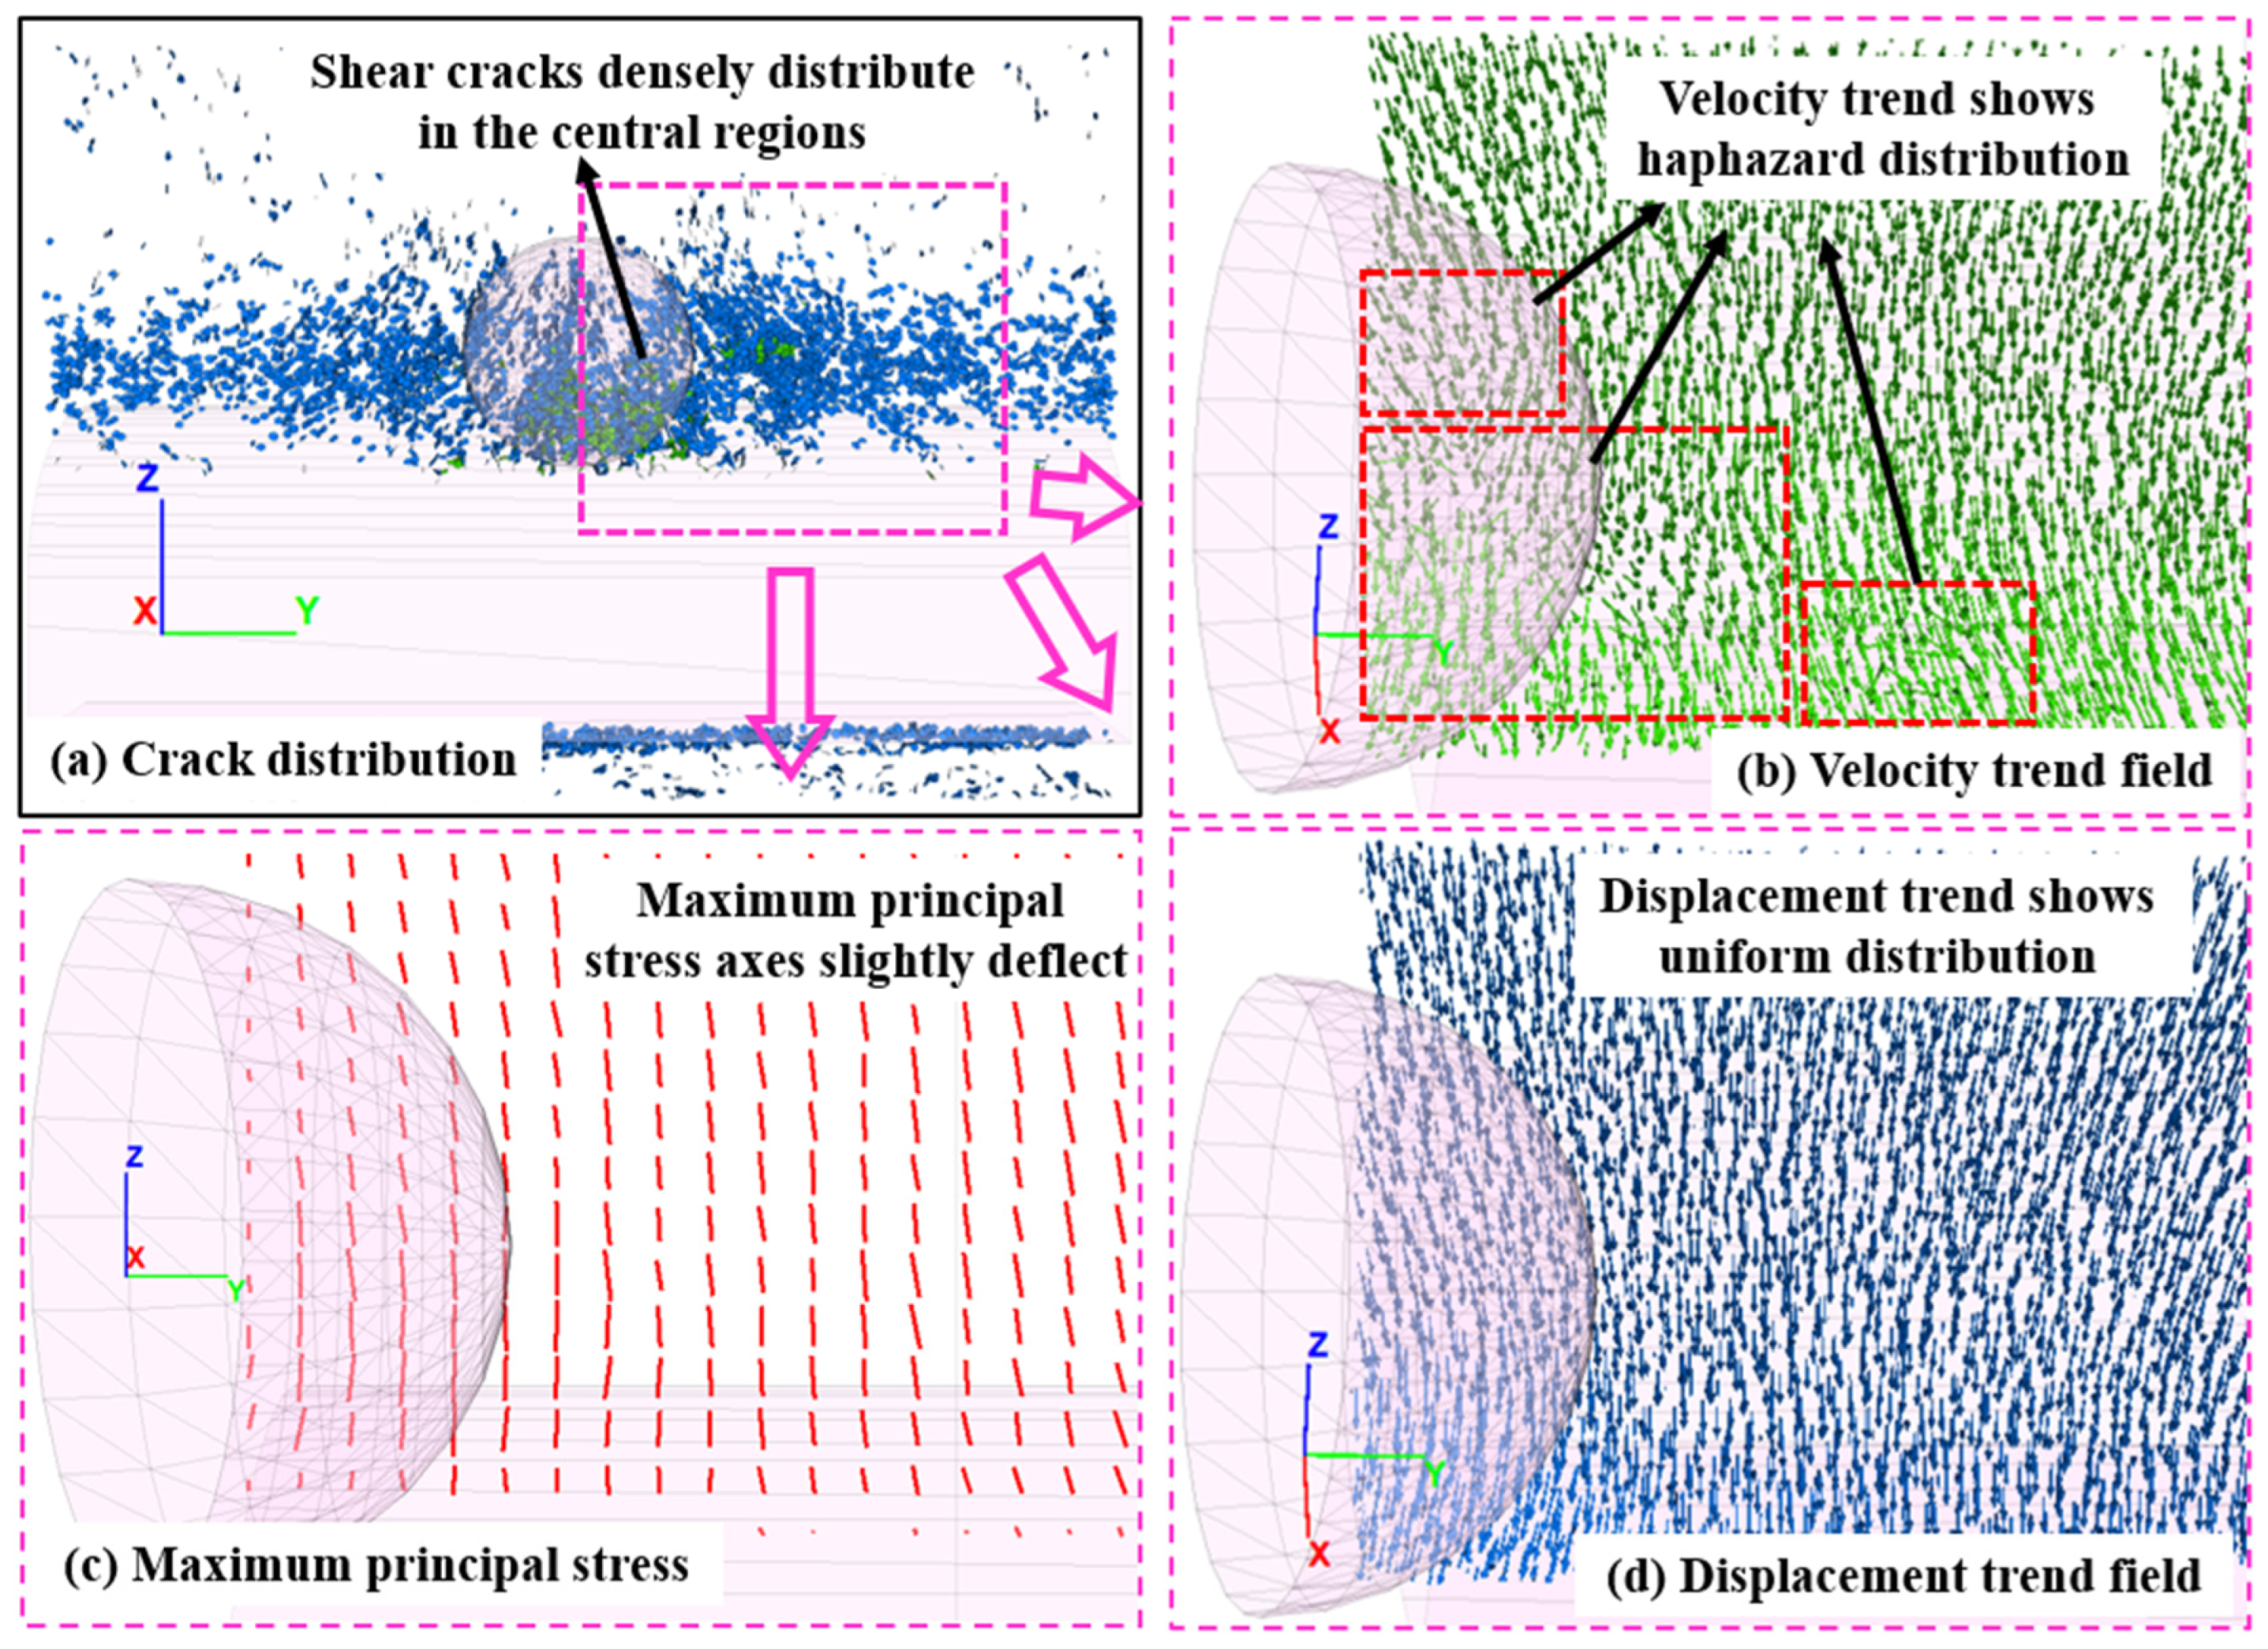
4.3. Estimation of the Stress Field

The application of the 3D-PSAC model (3D principal stress axis cross) helps to measure the stress status of surrounding rock, and the previous achievements prove that the underground engineering and fracture structure lead to the deflection and rotation of the principal stress axes [32,33,34]. Accordingly, the 3D-PSAC models were placed at the central position of the sample (measuring units covered the whole length of the sample in the y direction). Figure 9 shows detailed information on the stress evaluation region.

4.4. Numerical Results and Discussions

4.4.1. Cavern-Free Sample

Figure 10 presents the step–stress–crack relationship during the numerical test, the maximum z-axis strength of the numerical cavern-free sample is 22.38 MPa (slightly higher than the corresponding result), and the initiation of the tensile crack is earlier than the shear crack. Four special states of the sample were selected, which include the initiations of tensile and shear cracks, the construction of splitting failure, and the final peak stress state; the corresponding progressive displacement and velocity trends of the cavern-free sample are shown in Figure 11:
(1) The displacement trend field presents a typical centripetal distribution before the shear failure occurs (Figure 11a), while the velocity trend field shows an opposite moving direction in the sidewall (moving outwards).
(2) Sporadic tensile cracks distribute near the tunnel free face. When the secondary shear cracks start to gather at the bottom of sidewall (Figure 10b), particles in the sidewall only show vertical deformation because the corresponding velocity direction is outward.
(3) Surrounding rock adjacent to the tunnel face starts to show an inward displacement trend as the splitting failure forms, and the corresponding velocity trend illustrates a haphazard distribution in this region (Figure 10c); the splitting failure mainly distributes in the tunnel sidewall, and the top vault and bottom boundaries of the tunnel suffer slight tensile failure (tensile crack bands formed).
(4) The displacement and velocity trends of particles present the same distribution characteristic at the peak stress state (Figure 10d), and the majority of secondary failures appear in the tunnel sidewall, which shows a perfect agreement with the experimental results. Although the thickness of secondary cracks is large, the typical splitting failure only covers about 3 mm thickness (based on the displacement and velocity trends).
To summarize, the particle displacement trend field demonstrates a gradual change during the true triaxial compression test, which is different from the uniaxial compression test we have carried out before [25]. The application of the velocity trend field helps to capture the real change characteristics of the surrounding rock.
Distributions of the initial and final principal stress axes fields are illustrated in Figure 12. After the prestress loading is completed, the principal stress directions in the surrounding rock remain basically unchanged from the beginning to the end of the test. Moreover, the maximum principal stress axes are vertical to the tunnel boundary; the minimum principal stress is almost zero near the tunnel free face and gradually increases as the measuring position moves outward.
On the other hand, the main difference between the initial and final state is the relationship between the magnitude of the intermediate and minimum stress values in different regions. The sidewall shows relatively smaller principal stress values (red frame in Figure 12b) than those obtained from other positions in the initial state; however, the relatively high principal stress distributes in the sidewall in the final state (red frame in Figure 12(b1)), and the outermost layer of the principal stress axes is essentially the same as the external load characteristics (x-axial loading is larger than y-axial loading in the experimental test).

4.4.2. Cavern-Existing Sample

The step–stress–crack relationship of the numerical cavern-existing sample is shown in Figure 13. Five main steps, including tensile crack initiation, shear crack initiation, intermediate rock failure, start of splitting failure, and final peak stress status, were selected because of the prefabricated cavern; the appearance times of tensile, shear, and splitting failure are relatively earlier than the corresponding results of the cavern-free sample (Figure 10).
Figure 14 shows the progressive crack locations and displacement and velocity trends, and the main failure characteristics are as follows:
(1) When the tensile cracks initiate (Figure 14a), the displacement trend field presents a typical centripetal distribution on both sides of the sample (like the results of the cavern-free sample), while the velocity trends in the sidewalls present an opposite direction to the displacement vectors (outward).
(2) Shear cracks begin to gather at the bottom of the right sidewall (Figure 14b), and some shear cracks distribute in the intermediate rock between the tunnel and cavern. Displacement vectors mainly show the vertical direction in the left sidewall and present a slight horizontal displacement component in the right sidewall. The velocity trend field in the left sidewall maintains a stable distribution, while some particles (intermediate rock, marked by the small arrow) present a centripetal distribution.
(3) Because the velocity trends always show an outward direction, particles’ horizontal displacement components approach zero in the left sidewall, and displacement trends in the right sidewall present an opposite direction (the inner rock shows outward movement, and the outer rock illustrates inward movement in the horizontal direction). Tensile and shear cracks densely distribute in the intermediate rock, and there is almost no crack in the right sidewall. In the above three stages, particles above the cavern continue to show vertical displacement and velocity, and particles outside the cavern show stable right-bottom moving direction.
(4) When the splitting failures are formed (Figure 14d), the splitting boundary in the left sidewall is clear (illustrated by the displacement and velocity trends) and secondary cracks quickly appear in the inner layer of the right sidewall. Many tensile cracks wrap the cavern, and the shear cracks only occur in the intermediate rock and the right surrounding rock. Furthermore, the velocity trends show a disorganized distribution in some regions (red frames), such as the bottom of the left sidewall, the whole right sidewall, and the top-right surrounding rock of the cavern.
(5) The above disorganized velocity trends disappear at the peak stress state, and both sides of the splitting failures remain as unchanged distribution areas (the corresponding crack density gradually increases). However, particles in the intermediate rock present several velocity and displacement directions, which follows the moving characteristics of the rock block in the experimental test.
Distributions of the principal stress axes fields are illustrated in Figure 15. Because the prefabricated cavern is located at the right vault of the tunnel, the measuring region of the principal stress axes is thus broadly rightward for 20 mm. Like the results of the cavern-free sample, the maximum principal stress axes are mainly vertical to the boundaries of the tunnel and cavern in both the initial and final states. In addition, some maximum principal stress axes (in the tunnel vault and the bottom and upper surrounding rock of the cavern) approach zero at the final state (Figure 15(a1)); the prefabricated cavern shows almost no influence on the maximum principal stress axes in the right sidewall.
The values of Intermediate and minimum principal stresses in the intermediate rock are very small, and the stress axes rotations in both sidewalls appear in both the initial and final states. Like the results of the cavern-free sample, the intermediate and minimum principal stress axes in the left sidewall show relatively high values (than those in other regions) at the final state; however, this characteristic is not reproduced in the right sidewall, and the corresponding reason is that the cavern releases the compressive stresses into the surrounding rock and weakens the stress accumulation effect in the right sidewall. Subsequently, the intermediate and minimum principal stress axes only present various levels of rotation in the right sidewall.

4.4.3. Influence of the True 3D Prefabricated Cavern

Because the prefabricated cavern was placed at the central position in the y direction, the influence of the cavern on the failure and deformation characteristics of the sample is discussed in the y direction (intermediate rock). Figure 16a indicates that secondary shear cracks mainly distribute near the cavern, and the crack density near the cavern is higher than that in other regions. The maximum principal stress axes illustrate a slight deflection near the cavern, and show almost parallel distribution in the outside region (right part of Figure 16c).
The velocity trend presents haphazard distribution in several regions (Figure 16b), which is the dominant cause of local crack aggregation. However, the displacement trend shows a uniform moving direction (Figure 16d), because a short period of complex displacement fields may be covered by a long-term stable displacement field; we thus believe that it is necessary to apply both displacement and velocity trends to analyze the cracking mechanism during the test.

5. Conclusions

By conducting the experimental and numerical tests, the mechanical property, acoustic characteristics, non-uniform displacement, and velocity trend fields, the principal stress redistribution and failure mechanisms of samples are discussed in this study. The main conclusions are as follows:
(1) Based on the experimental results, the invisible cavern demonstrates a negative influence on the stability of the tunnel and leads to a 25.82% reduction in the peak z-axis load of the specimens. The AE results show that the relatively severe dominant failures mainly occur near the peak stress in all types of specimens, and the speed and intensity of the cavern-existing specimen is significantly greater than that of the cavern-free specimen.
(2) In both experimental and numerical tests, the cavity-free tunnel shows a mirror-symmetric splitting failure on the left and right sidewalls. However, the secondary cracks appear earlier and show an asymmetrical distribution in the cavern-existing specimen, and the volumes of broken rock blocks in the left and right sidewalls are different. In addition, the cavern directly changes the failure process of the tunnel-surrounding rock (intermediate rock failure is earlier than splitting failure), and the corresponding mechanism of secondary failures.
(3) The invisible cavern strongly controls the distribution of the principal stress axes. The maximum principal stress axes are consistently parallel to the tunnel free face in the cavern-free sample, and typical stress axes rotation occurs in both sidewalls of the tunnel. On the other hand, because the cavern releases the compressive stresses into the surrounding rock, the stress accumulation effect in the right sidewall is weakened; the intermediate and minimum principal stress axes only present various levels of rotation in the right sidewall.
(4) The displacement trend fields present a typical centripetal distribution in two kinds of samples at the initial state because of the true 3D compression condition. The increase in the z-axis loading leads to the outward direction of velocity trends in all states, and the uneven velocity field in the horizontal direction indirectly contributes to the splitting failure of the tunnel sidewalls. The true 3D prefabricated cavern causes uneven crack distribution in the y direction (tunnel axis), and the corresponding failure mechanism can only be figured out in the velocity trend field (because a short period of complex displacement fields may be covered by a long-term stable displacement field). It is thus necessary to apply both displacement and velocity trend fields for the analysis of failure mechanisms.
(5) This work only focused on isotropic material in both the experimental and numerical methods. In the future work, anisotropic materials like granite, shale, and sandstone will be selected as test objects; in addition, the corresponding DEM simulations will be carried out based on various particle shapes and combinations (clusters) [35,36]. Will secondary cracks cut through grains? How will splitting failure develop and distribute? These are urgent issues that need to be addressed in the next stage of research.

Author Contributions

Conceptualization and methodology, C.C.; software, X.S.; writing—review and editing, Y.Z. All authors have read and agreed to the published version of the manuscript.

Funding

This research was funded by the Natural Science Foundation of Fujian Province [grant numbers 2022J01567].

Institutional Review Board Statement

Not applicable.

Data Availability Statement

The database obtained and/or analyzed during the current study are not publicly available, but are available from the corresponding author on reasonable request.

Conflicts of Interest

The authors declare no conflict of interest.

References

  1. He, M.; Cheng, T.; Qiao, Y.; Li, H. A review of rockburst: Experiments, theories, and simulations. J. Rock Mech. Geotech. Eng. 2023, 15, 1312–1353. [Google Scholar] [CrossRef]
  2. Li, B.; Gao, P.; Cao, Y.; Gong, W.; Zhang, S.; Zhang, J. Damage and Failure Characteristics of Surrounding Rock in Deep Circular Cavern under Cyclic Dynamic Load: A True Triaxial Experiment Investigation. Minerals 2022, 12, 134. [Google Scholar] [CrossRef]
  3. Luo, Y. Influence of water on mechanical behavior of surrounding rock in hard-rock tunnels: An experimental simulation. Eng. Geol. 2020, 277, 105816. [Google Scholar] [CrossRef]
  4. Wu, H.; Zhao, G.-Y.; Ma, S.-W. Failure behavior of horseshoe-shaped tunnel in hard rock under high stress: Phenomenon and mechanisms. Trans. Nonferrous Met. Soc. China 2022, 32, 639–656. [Google Scholar] [CrossRef]
  5. Qiu, W.; Ai, X.; Zheng, Y. First application of mechanized method using earth pressure balance TBM with large horseshoe-shaped cross section to loess mountain tunnel: A case study of Baicheng tunnel. Tunn. Undergr. Space Technol. 2022, 126, 104547. [Google Scholar] [CrossRef]
  6. Gong, F.Q.; Luo, Y.; Liu, D.Q. Simulation tests on spalling failure in deep straight-wall-top-arch tunnels. Chin. J. Geotech. Eng. 2019, 41, 1091–1100. [Google Scholar] [CrossRef]
  7. Gong, F.-Q.; Luo, Y.; Li, X.-B.; Si, X.-F.; Tao, M. Experimental simulation investigation on rockburst induced by spalling failure in deep circular tunnels. Tunn. Undergr. Space Technol. 2018, 81, 413–427. [Google Scholar] [CrossRef]
  8. Si, X.; Peng, K.; Luo, S. Experimental Investigation on the Influence of Depth on Rockburst Characteristics in Circular Tunnels. Sensors 2022, 22, 3679. [Google Scholar] [CrossRef]
  9. Zhang, L.; Chao, W.; Liu, Z.; Cong, Y.; Wang, Z. Crack propagation characteristics during progressive failure of circular tunnels and the early warning thereof based on multi-sensor data fusion. Géoméch. Geophys. Geo-Energy Geo-Resour. 2022, 8, 172. [Google Scholar] [CrossRef]
  10. Li, D.; Xiao, P.; Han, Z.; Zhu, Q. Mechanical and failure properties of rocks with a cavity under coupled static and dynamic loads. Eng. Fract. Mech. 2018, 225, 106195. [Google Scholar] [CrossRef]
  11. Luo, Y.; Gong, F.; Liu, D.; Wang, S.; Si, X. Experimental simulation analysis of the process and failure characteristics of spalling in D-shaped tunnels under true-triaxial loading conditions. Tunn. Undergr. Space Technol. 2019, 90, 42–61. [Google Scholar] [CrossRef]
  12. Gong, F.; Wu, W.; Ren, L. Rockburst process and strength-weakening effect of the high-stress circular tunnel under internal unloading. J. Rock Mech. Geotech. Eng. 2023, 15, 864–885. [Google Scholar] [CrossRef]
  13. Zhang, X.-P.; Liu, Q.; Wu, S.; Tang, X. Crack coalescence between two non-parallel flaws in rock-like material under uniaxial compression. Eng. Geol. 2015, 199, 74–90. [Google Scholar] [CrossRef]
  14. Zhang, X.-P.; Wong, L.N.Y. Displacement field analysis for cracking processes in bonded-particle model. Bull. Eng. Geol. Environ. 2013, 73, 13–21. [Google Scholar] [CrossRef]
  15. Li, B.-X.; Yu, S.; Zhu, W.-S.; Yang, L.; Cai, W.-B.; Xue, Y.-G.; Li, Y. The crack coalescence mode and physical field evolutionary characteristics of a brittle material containing two 3-D parallel embedded flaws. Theor. Appl. Fract. Mech. 2020, 110, 102836. [Google Scholar] [CrossRef]
  16. Aliabadian, Z.; Sharafisafa, M.; Tahmasebinia, F.; Shen, L. Experimental and numerical investigations on crack development in 3D printed rock-like specimens with pre-existing flaws. Eng. Fract. Mech. 2020, 241, 107396. [Google Scholar] [CrossRef]
  17. Sharafisafa, M.; Aliabadian, Z.; Tahmasebinia, F.; Shen, L. A comparative study on the crack development in rock-like specimens containing unfilled and filled flaws. Eng. Fract. Mech. 2020, 241, 107405. [Google Scholar] [CrossRef]
  18. Fan, W.; Yang, H.; Jiang, X.; Cao, P. Experimental and numerical investigation on crack mechanism of folded flawed rock-like material under uniaxial compression. Eng. Geol. 2021, 291, 106210. [Google Scholar] [CrossRef]
  19. Huang, S.; Yao, N.; Ye, Y.; Cui, X. Strength and Failure Characteristics of Rocklike Material Containing a Large-Opening Crack under Uniaxial Compression: Experimental and Numerical Studies. Int. J. Géoméch. 2019, 19, 4019098. [Google Scholar] [CrossRef]
  20. Xia, K.; Ren, R.; Liu, F. Numerical analysis of mechanical behavior of stratified rocks containing a single flaw by utilizing the particle flow code. Eng. Anal. Bound. Elem. 2022, 137, 91–104. [Google Scholar] [CrossRef]
  21. Yan, Z.; Dai, F.; Liu, Y.; Li, A.; Du, H. Numerical assessment of the rate-dependent cracking behaviours of single-flawed rocks in split Hopkinson pressure bar tests. Eng. Fract. Mech. 2021, 247, 107656. [Google Scholar] [CrossRef]
  22. You, W.; Dai, F.; Liu, Y. Experimental and numerical investigation on the mechanical responses and cracking mechanism of 3D confined single-flawed rocks under dynamic loading. J. Rock Mech. Geotech. Eng. 2022, 14, 477–493. [Google Scholar] [CrossRef]
  23. Liu, B.; Zhou, Y.; Gao, Y.-T.; Xu, C. Experimental and numerical study on crack development characteristics between two cavities in rock-like material under uniaxial compression. Theor. Appl. Fract. Mech. 2020, 109, 102755. [Google Scholar] [CrossRef]
  24. Yang, S.-Q.; Yin, P.-F.; Zhang, Y.-C.; Chen, M.; Zhou, X.-P.; Jing, H.-W.; Zhang, Q.-Y. Failure behavior and crack evolution mechanism of a non-persistent jointed rock mass containing a circular hole. Int. J. Rock Mech. Min. Sci. 2019, 114, 101–121. [Google Scholar] [CrossRef]
  25. Zhao, Y.; Gao, Y.; Wu, S.; Chen, L.; Zhang, C. Experimental and numerical study of failure characteristics of brittle rocks with single internal 3D open-type flaw. Acta Geotech. 2021, 16, 3087–3113. [Google Scholar] [CrossRef]
  26. Zhao, Y.; Gao, Y.; Wu, S. Influence of different concealment conditions of parallel double flaws on mechanical properties and failure characteristics of brittle rock under uniaxial compression. Theor. Appl. Fract. Mech. 2020, 109, 102751. [Google Scholar] [CrossRef]
  27. Zhang, J.; Zhou, X.; Zhou, L.; Berto, F. Progressive failure of brittle rocks with non-isometric flaws: Insights from acousto-optic-mechanical (AOM) data. Fatigue Fract. Eng. Mater. Struct. 2019, 42, 1787–1802. [Google Scholar] [CrossRef]
  28. Zhou, X.-P.; Zhang, J.-Z.; Berto, F. Fracture Analysis in Brittle Sandstone by Digital Imaging and AE Techniques: Role of Flaw Length Ratio. J. Mater. Civ. Eng. 2020, 32, 04020085. [Google Scholar] [CrossRef]
  29. Alitalesh, M.; Yazdani, M.; Fakhimi, A.; Naeimabadi, M. Effect of loading direction on interaction of two pre-existing open and closed flaws in a rock-like brittle material. Undergr. Space 2019, 5, 242–257. [Google Scholar] [CrossRef]
  30. Wu, S.; Xu, X. A Study of Three Intrinsic Problems of the Classic Discrete Element Method Using Flat-Joint Model. Rock Mech. Rock Eng. 2015, 49, 1813–1830. [Google Scholar] [CrossRef]
  31. Wang, P.; Yin, Z.-Y.; Wang, Z.-Y. Micromechanical Investigation of Particle-Size Effect of Granular Materials in Biaxial Test with the Role of Particle Breakage. J. Eng. Mech. 2022, 148, 04021133. [Google Scholar] [CrossRef]
  32. Zhang, S.; Ma, X. How Does In Situ Stress Rotate Within a Fault Zone? Insights From Explicit Modeling of the Frictional, Fractured Rock Mass. J. Geophys. Res. Solid Earth 2021, 126, e2021JB022348. [Google Scholar] [CrossRef]
  33. Zhou, X. Dynamic damage constitutive relation of mesoscopic heterogenous brittle rock under rotation of principal stress axes. Theor. Appl. Fract. Mech. 2010, 54, 110–116. [Google Scholar] [CrossRef]
  34. Zhao, Y.; Chen, C.; Qi, Q.; Wu, S. Rotation and deflection of 3D principal stress axes induced by a prefabricated single flaw in sandstone: A numerical investigation based on DEM. Theor. Appl. Fract. Mech. 2022, 120, 103430. [Google Scholar] [CrossRef]
  35. Yin, Z.-Y.; Wang, P.; Zhang, F. Effect of particle shape on the progressive failure of shield tunnel face in granular soils by coupled FDM-DEM method. Tunn. Undergr. Space Technol. 2020, 100, 103394. [Google Scholar] [CrossRef]
  36. Nguyen, H.B.K.; Rahman, M.M.; Fourie, A.B. Effect of Particle Shape on Constitutive Relation: DEM Study. J. Geotech. Geoenviron. Eng. 2020, 146, 04020058. [Google Scholar] [CrossRef]
Figure 1. Design of the sample and the prefabricated cavern.
Applsci 13 07688 g001
Figure 2. True 3-axis loading path.
Applsci 13 07688 g002
Figure 3. True three-axis loading test machine and supporting monitoring system layout diagram: (a) the loading system and AE monitoring system in this test; (b) AE sensors are distributed along x-axis; (c) monitoring position of the internal camera.
Applsci 13 07688 g003
Figure 4. Time–stress–AE relationships among two groups of specimens: (a) mechanical and acoustic data obtained in the cavern-free sample; (b) mechanical and acoustic data obtained in the cavern-existing sample.
Applsci 13 07688 g004
Figure 5. Selected frames of cracking damage in the cavern-free (left part of semifigures (ad) and cavern-existing (right part of semifigures (a1d1)) samples.
Applsci 13 07688 g005
Figure 6. Splitting failures of tunnel-surrounding rock after the true triaxial test: (a) failure patterns of the cavern-free sample; (b) failure patterns of the cavern-existing sample.
Applsci 13 07688 g006
Figure 7. Establishment of the numerical model.
Applsci 13 07688 g007
Figure 8. Particle displacement/velocity relationships and selected research planes.
Applsci 13 07688 g008
Figure 9. Distribution of measuring units and the 3D-PSAC model: (a) distribution of the principal stress measuring units; (b) illustration of the principal stress axis.
Applsci 13 07688 g009
Figure 10. Step–stress–crack relationships of the cavern-free numerical model.
Applsci 13 07688 g010
Figure 11. Progressive developments of the displacement, velocity, and crack fields in the right part of the cavern-free sample (blue field: displacement trend; green field: velocity trend; blue disc: tensile crack; green disc: shear crack; semifigures (ad): various states of the test).
Applsci 13 07688 g011
Figure 12. Distribution of the 3D principal stress axes at the initial and final states of the cavern-free sample (semi-figures (a,b) are initial state, semi-figures (a1,b1) are final state).
Applsci 13 07688 g012
Figure 13. Step–stress–crack relationships of the cavern-existing numerical model.
Applsci 13 07688 g013
Figure 14. Progressive developments of the displacement, velocity, and crack fields in the cavern-existing sample (blue field: displacement trend; green field: velocity trend; blue disc: tensile crack; green disc: shear crack; semifigures (ae): five important states of the test).
Applsci 13 07688 g014
Figure 15. Distribution of the 3D principal stress axes at the initial and final states of the cavern-existing sample (semi-figures (a,b) are initial state, semi-figures (a1,b1) are final state).
Applsci 13 07688 g015
Figure 16. Influence of the true 3D cavern on the displacement, velocity, maximum principal stress, and crack distributions in the cavern-existing sample at the final state: (a) crack distributions in y-o-z plane; (b) velocity trend field in y-o-z plane; (c) maximum principal stress axes in y-o-z plane; (d) displacement trend field in y-o-z plane.
Applsci 13 07688 g016
Table 1. The related parameters of the rock-like sample.
Paremeters NameNotes
Chemical composition of gypsum powdera-CaSO4-1/2H2O
Mesh number2000
Initial setting period/min≥3.0
Final setting period/min≤30.0
2 h strength/MPa4.0
Uniaxial compressive strength/MPa26.63
Tensile strength/MPa1.13
Elastic modulus/GPa17.19
Table 2. Micro- and macro-parameters of the numerical model.
Micro-ParametersValue
Maximum   to   minimum   grain   diameter   ratio ,   d max / d min 1.66
Minimum grain diameter1.0
Installation   gap   ratio ,   g r a t i o 0.3
Local   damping   factor ,   d a m p 0.0
Bonded   element   fraction ,   φ B 0.9
Slit   element   fraction ,   φ S 0.1
Radial   element ,   N r 1
Circumferential   elements ,   N a 3
Effective   modulus   of   both   particle   and   bond ,   E c = E ¯ c (GPa)12.8
The   ratio   of   normal   to   shear   stiffness   of   both   particle   and   bond ,   k n / k s = k ¯ n / k ¯ s 1.0
Mean   and   standard   deviation   bond   tensile   strength ,   ϕ b (MPa)(1.2, 0.1)
Mean   and   standard   deviation   bond   cohesion   strength ,   ϕ c (MPa)(16.5, 1.5)
Macro-parameters of the ISRM sample (real/numerical model)Value
Uniaxial compressive strength (UCS)/MPa26.63/26.58
Elastic modulus (EM)/GPa17.19/17.15
Tensile strength (TS)/MPa1.13/1.12
Related properties of the cubic modelValue
Length of cubic model/mm100
Total particle number1,098,824
Interval between each saving file/steps5000
Disclaimer/Publisher’s Note: The statements, opinions and data contained in all publications are solely those of the individual author(s) and contributor(s) and not of MDPI and/or the editor(s). MDPI and/or the editor(s) disclaim responsibility for any injury to people or property resulting from any ideas, methods, instructions or products referred to in the content.

