
Defect Detection in CFRP Concrete Reinforcement Using the Microwave Infrared Thermography (MIRT) Method—A Numerical Modeling and Experimental Approach


Abstract
:1. Introduction
1.1. Quality Control of the CFRP for Concrete Reinforcement
1.2. Active Thermography Method
1.3. Novelty and Significance of the Research
1.4. Organization of the Paper
2. Numerical Model
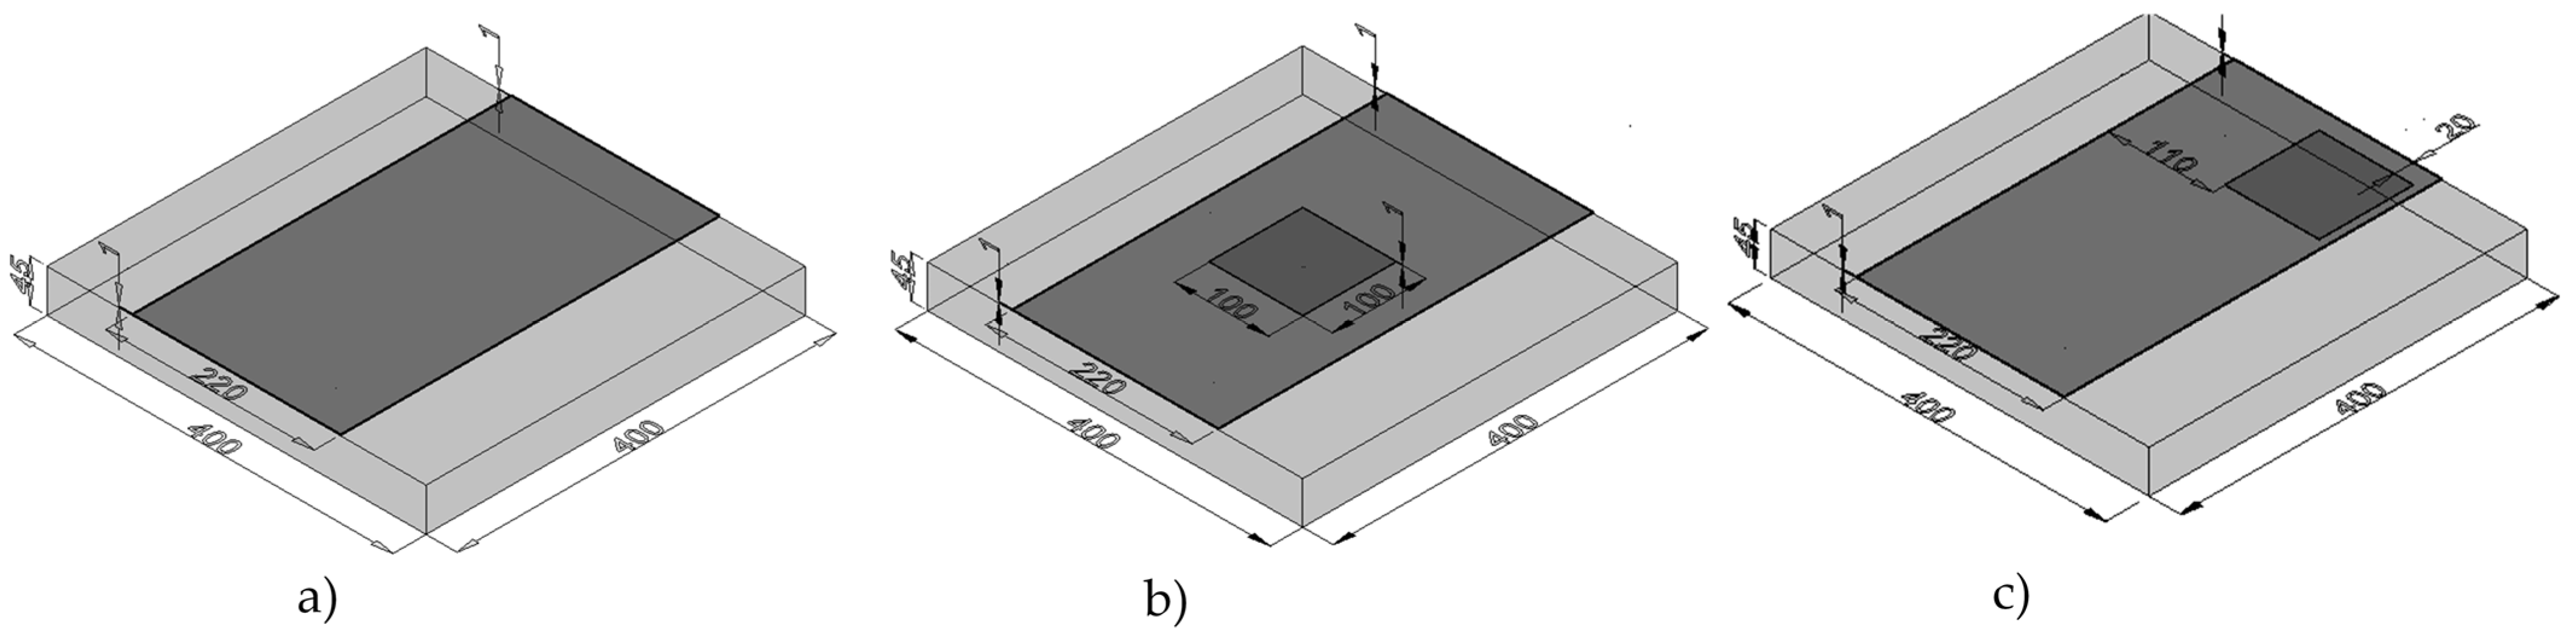
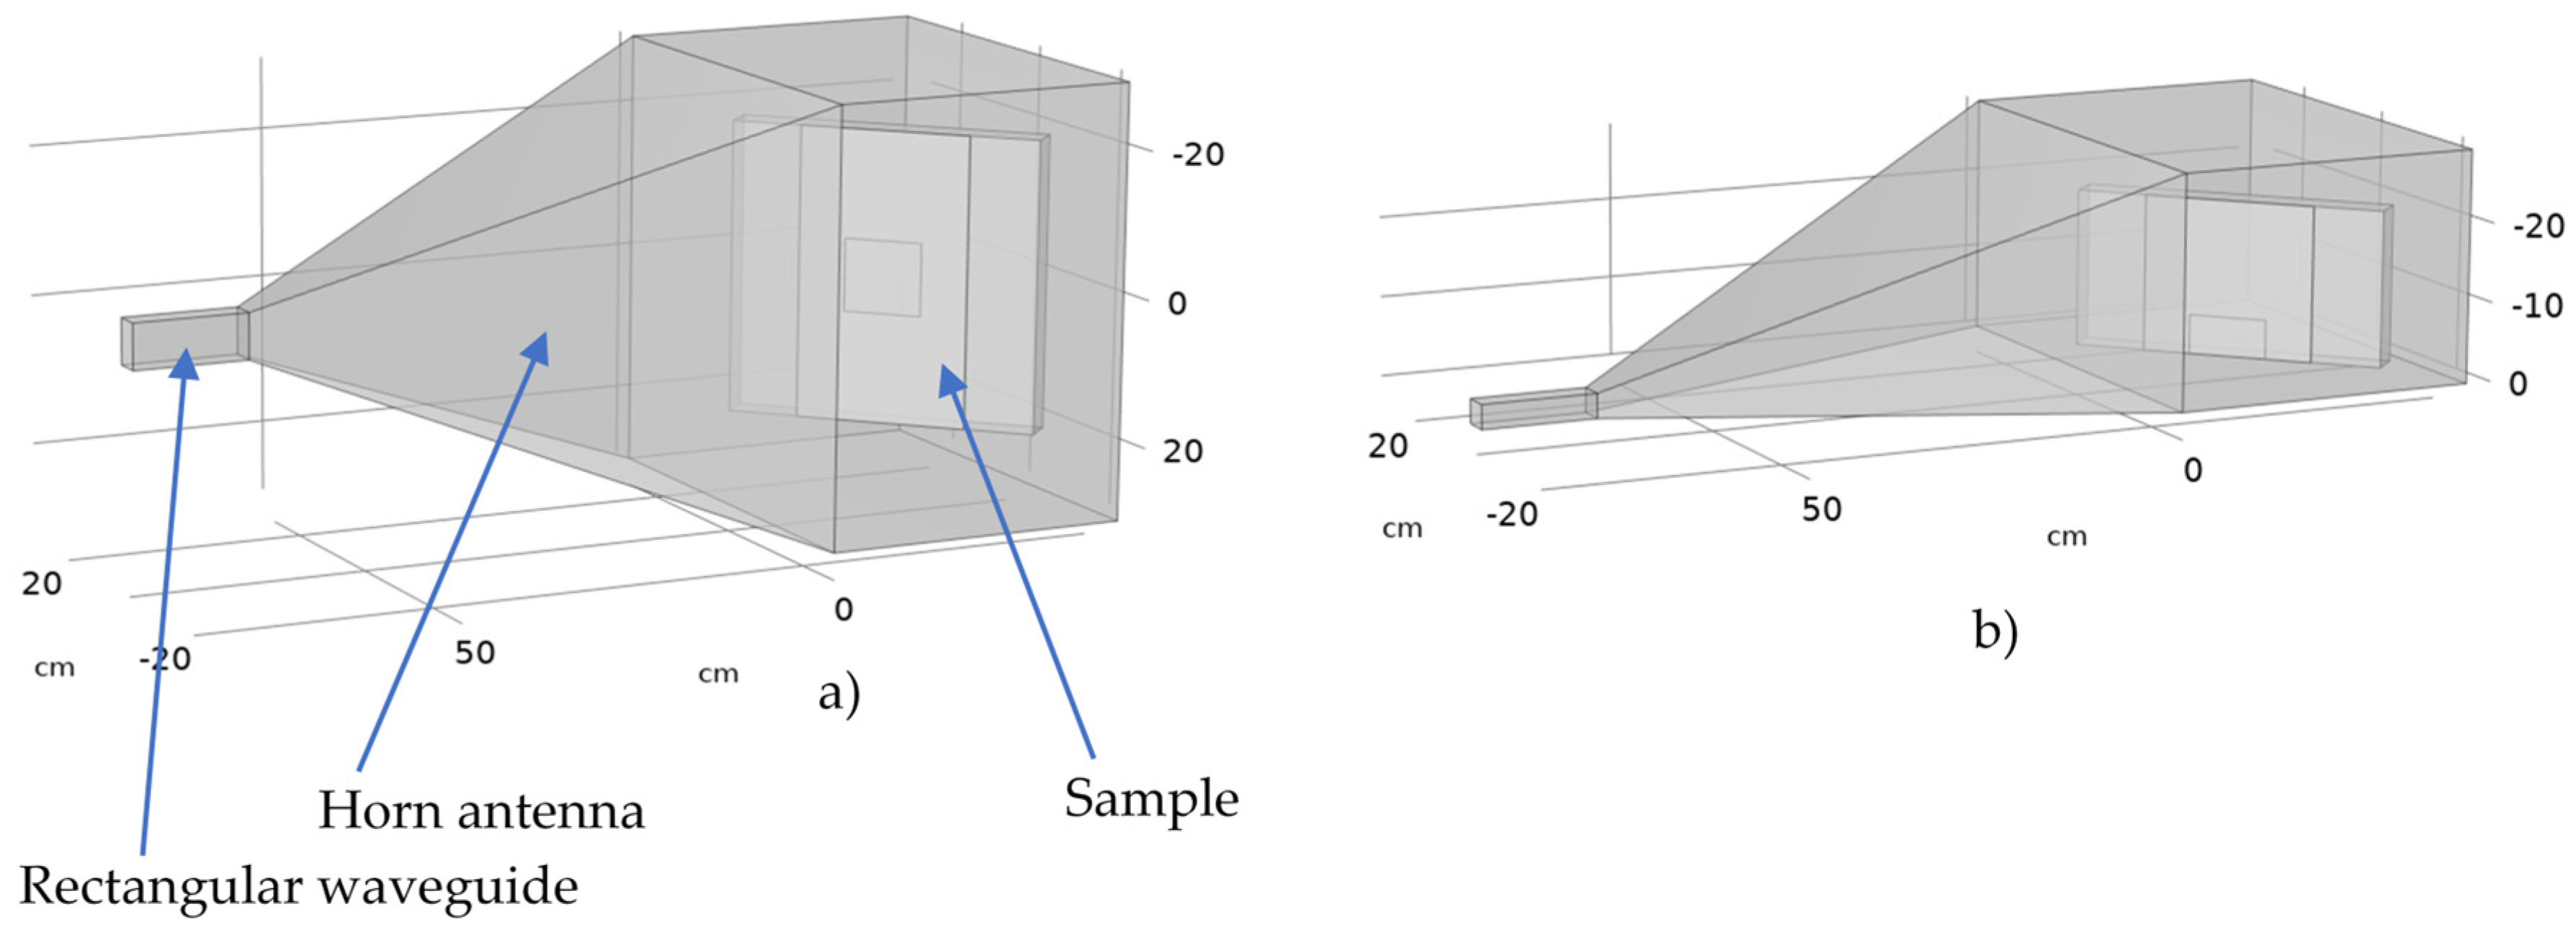
2.1. Model Geometry
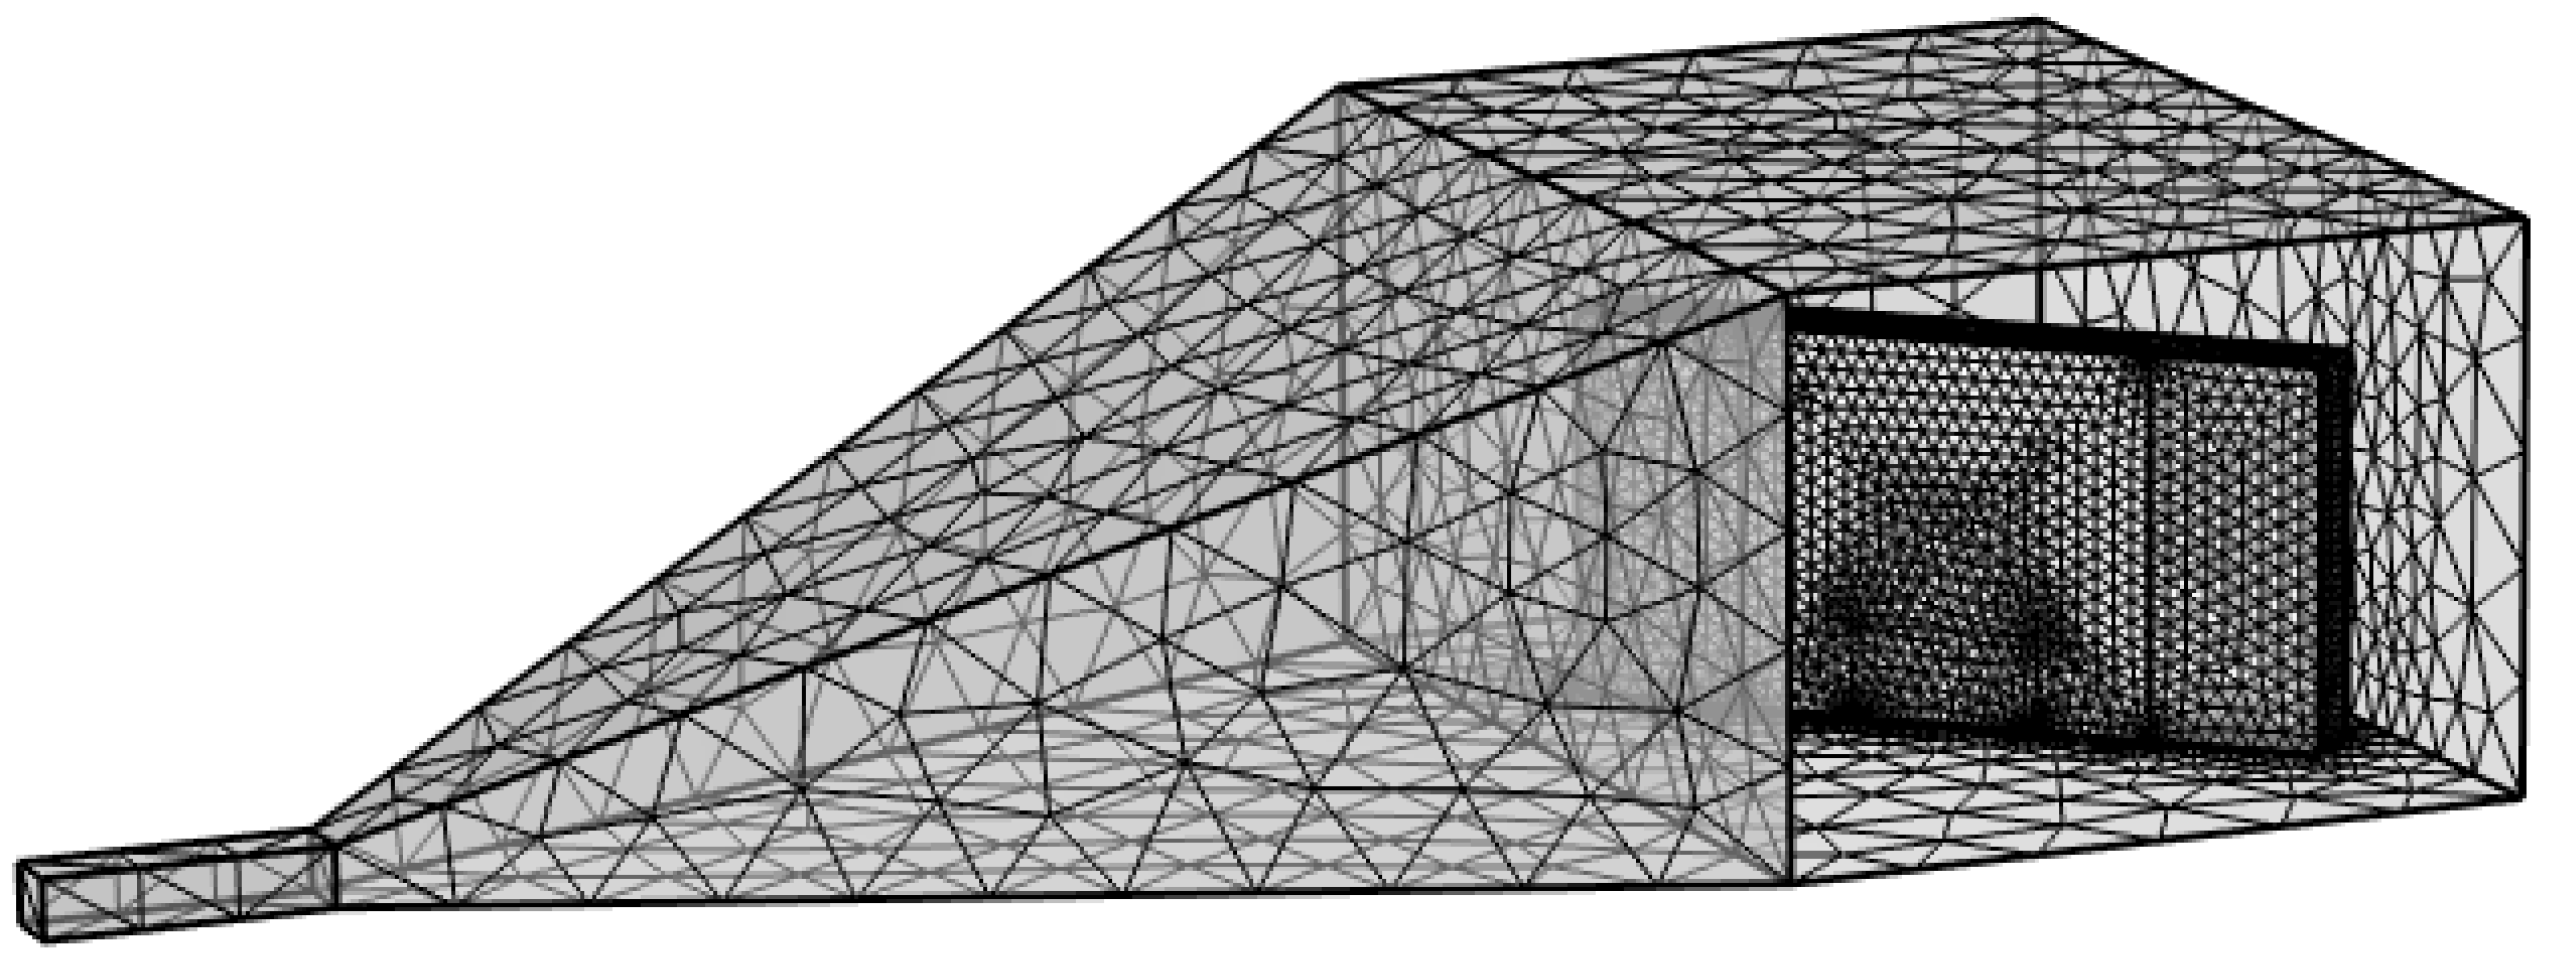
2.2. Boundary Conditions and Material Properties and Meshing
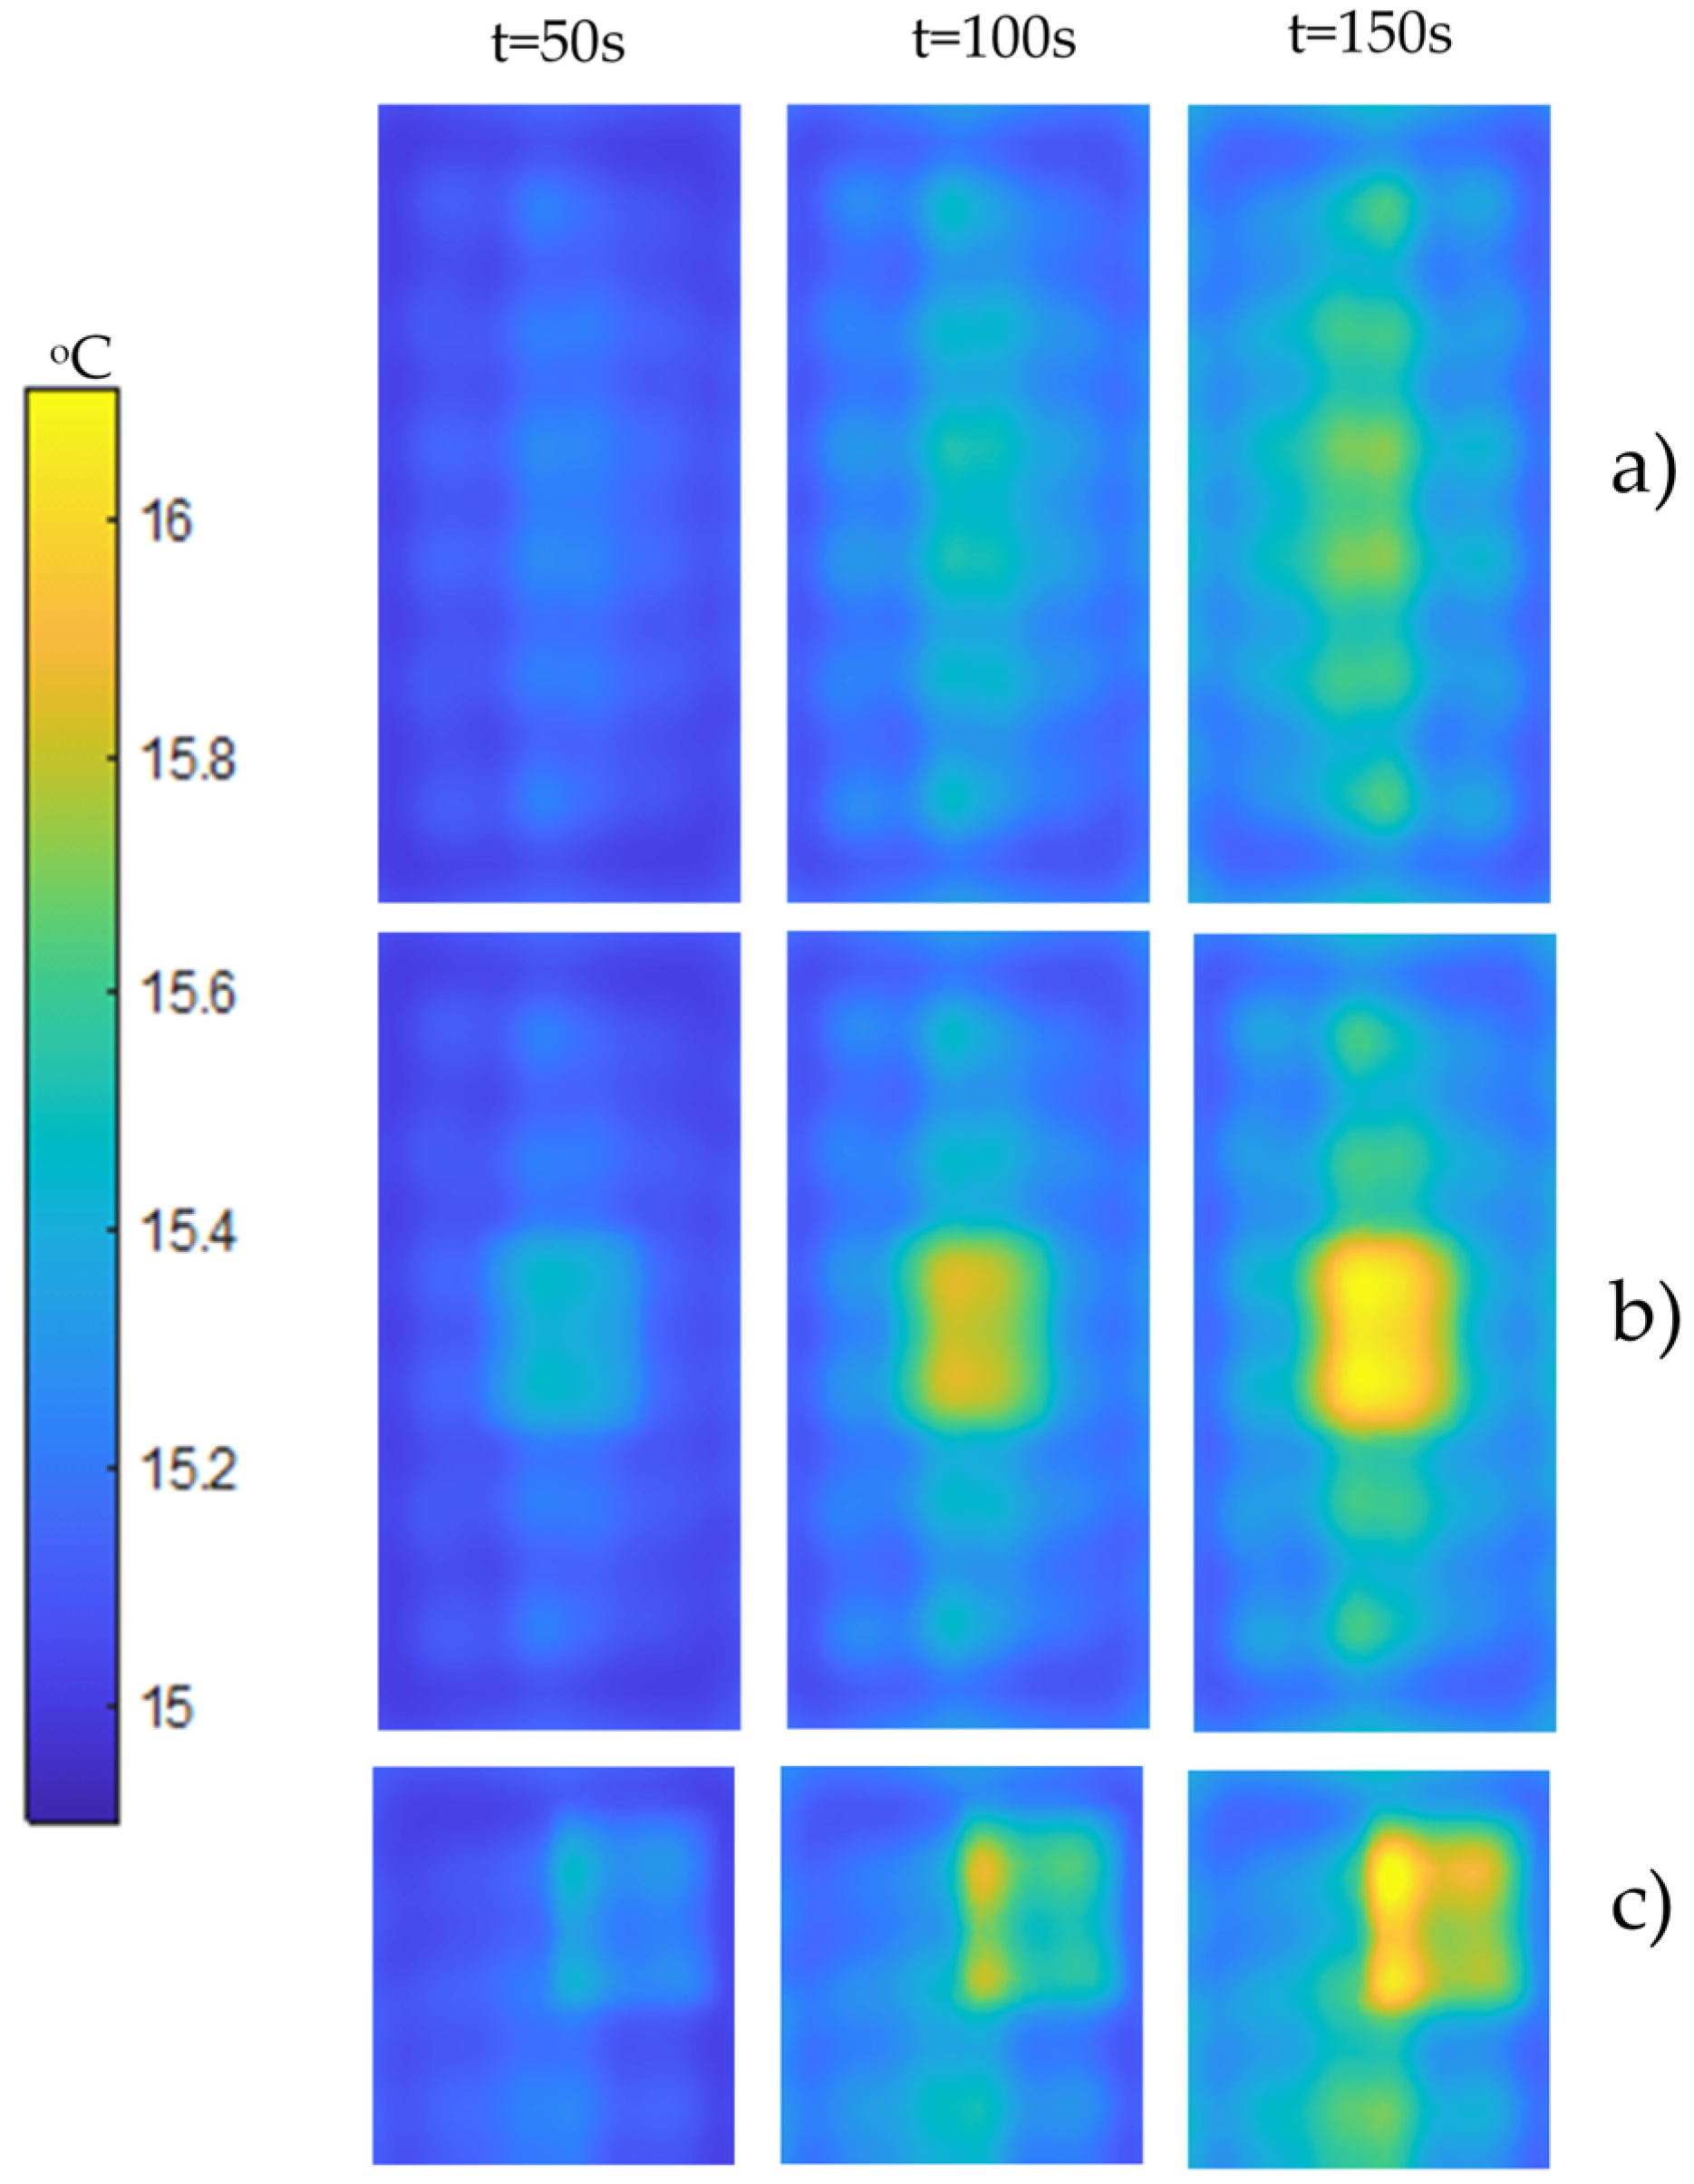
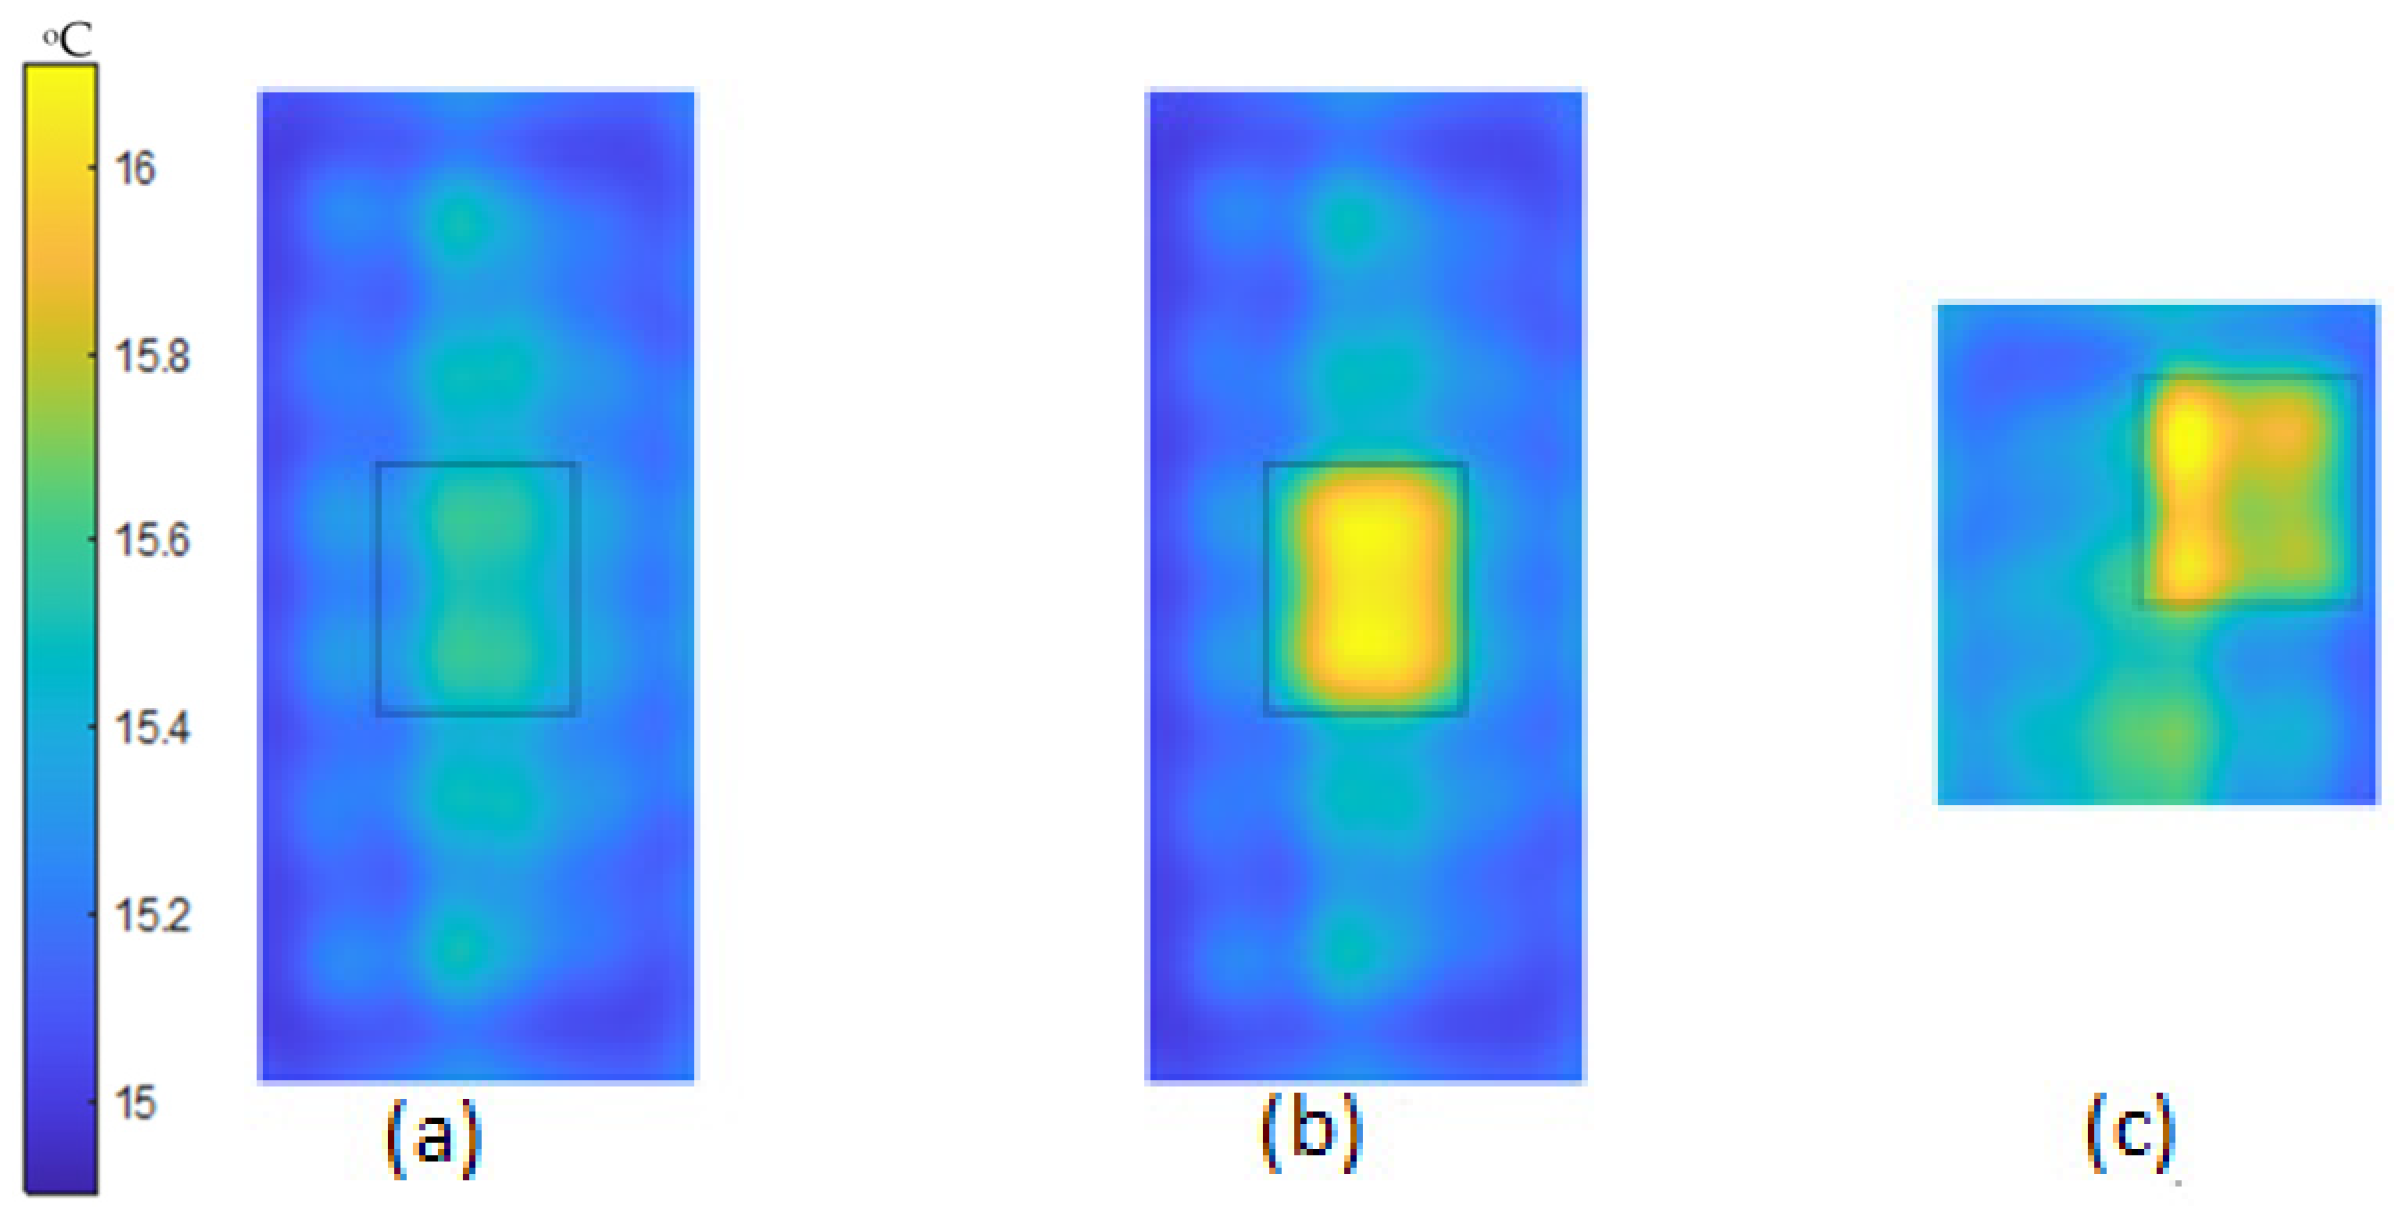
2.3. Exemplary Results
3. Experimental Tests and Results
3.1. Samples and Experimental Setup
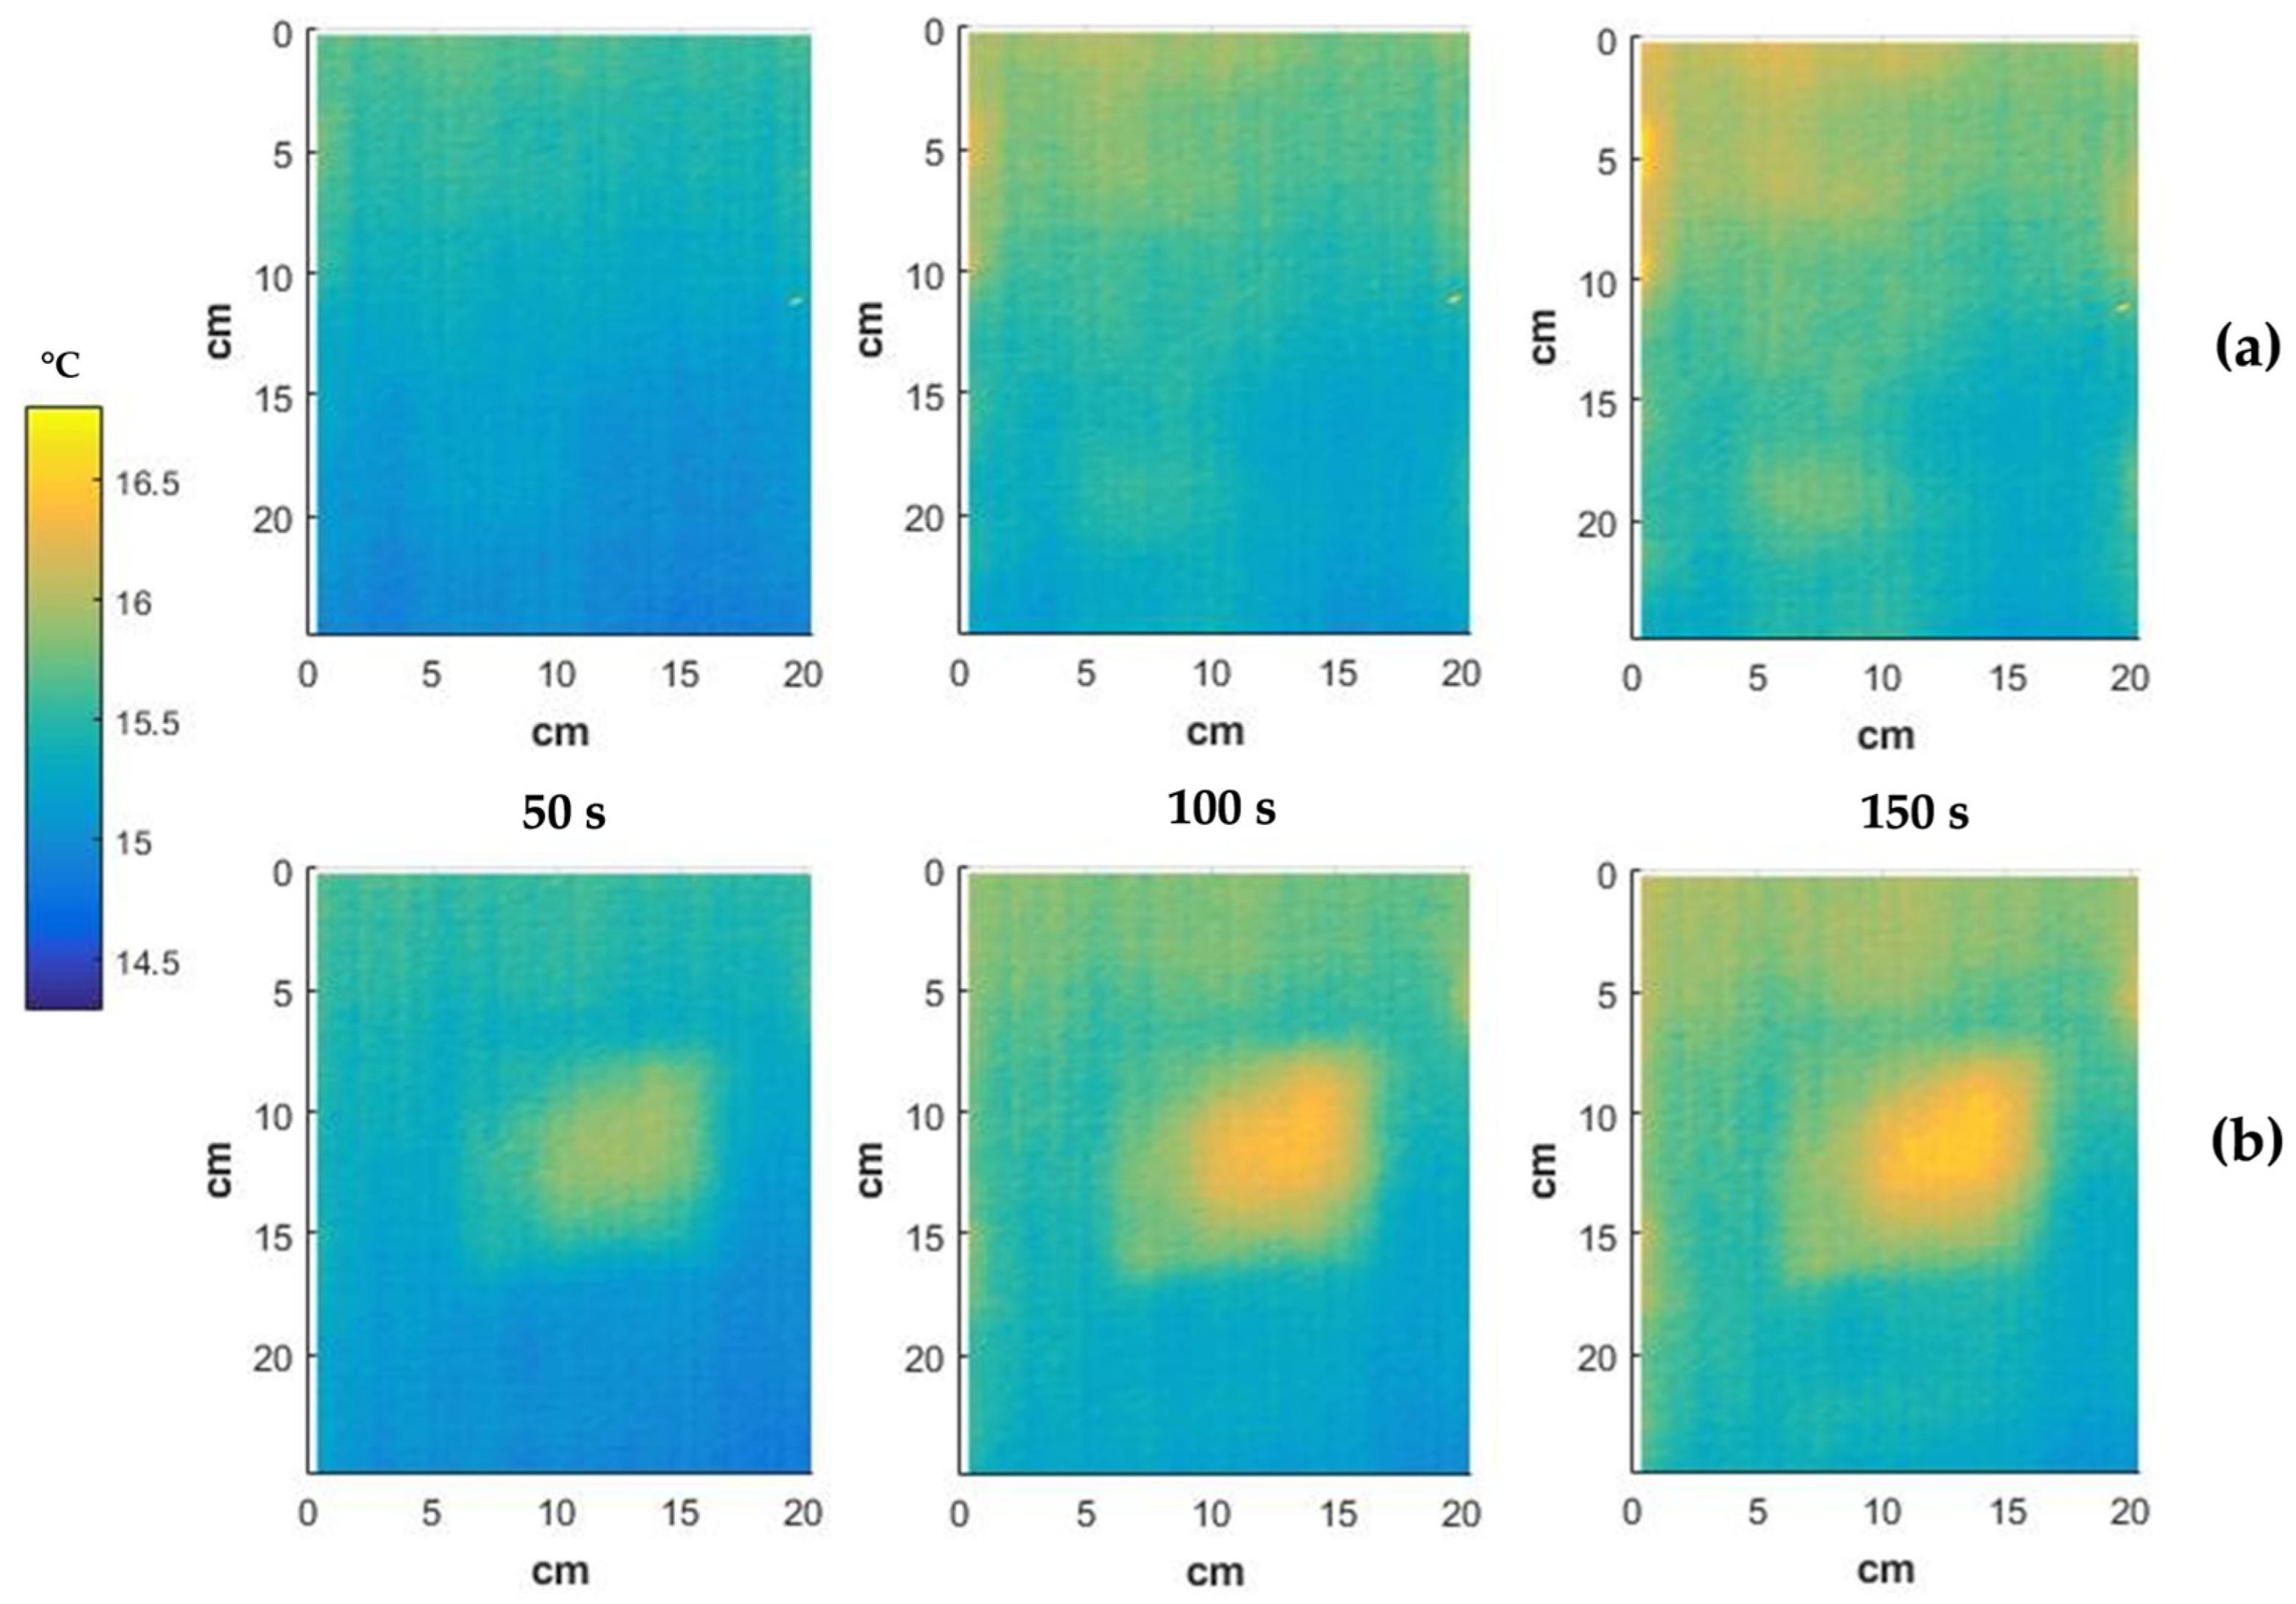
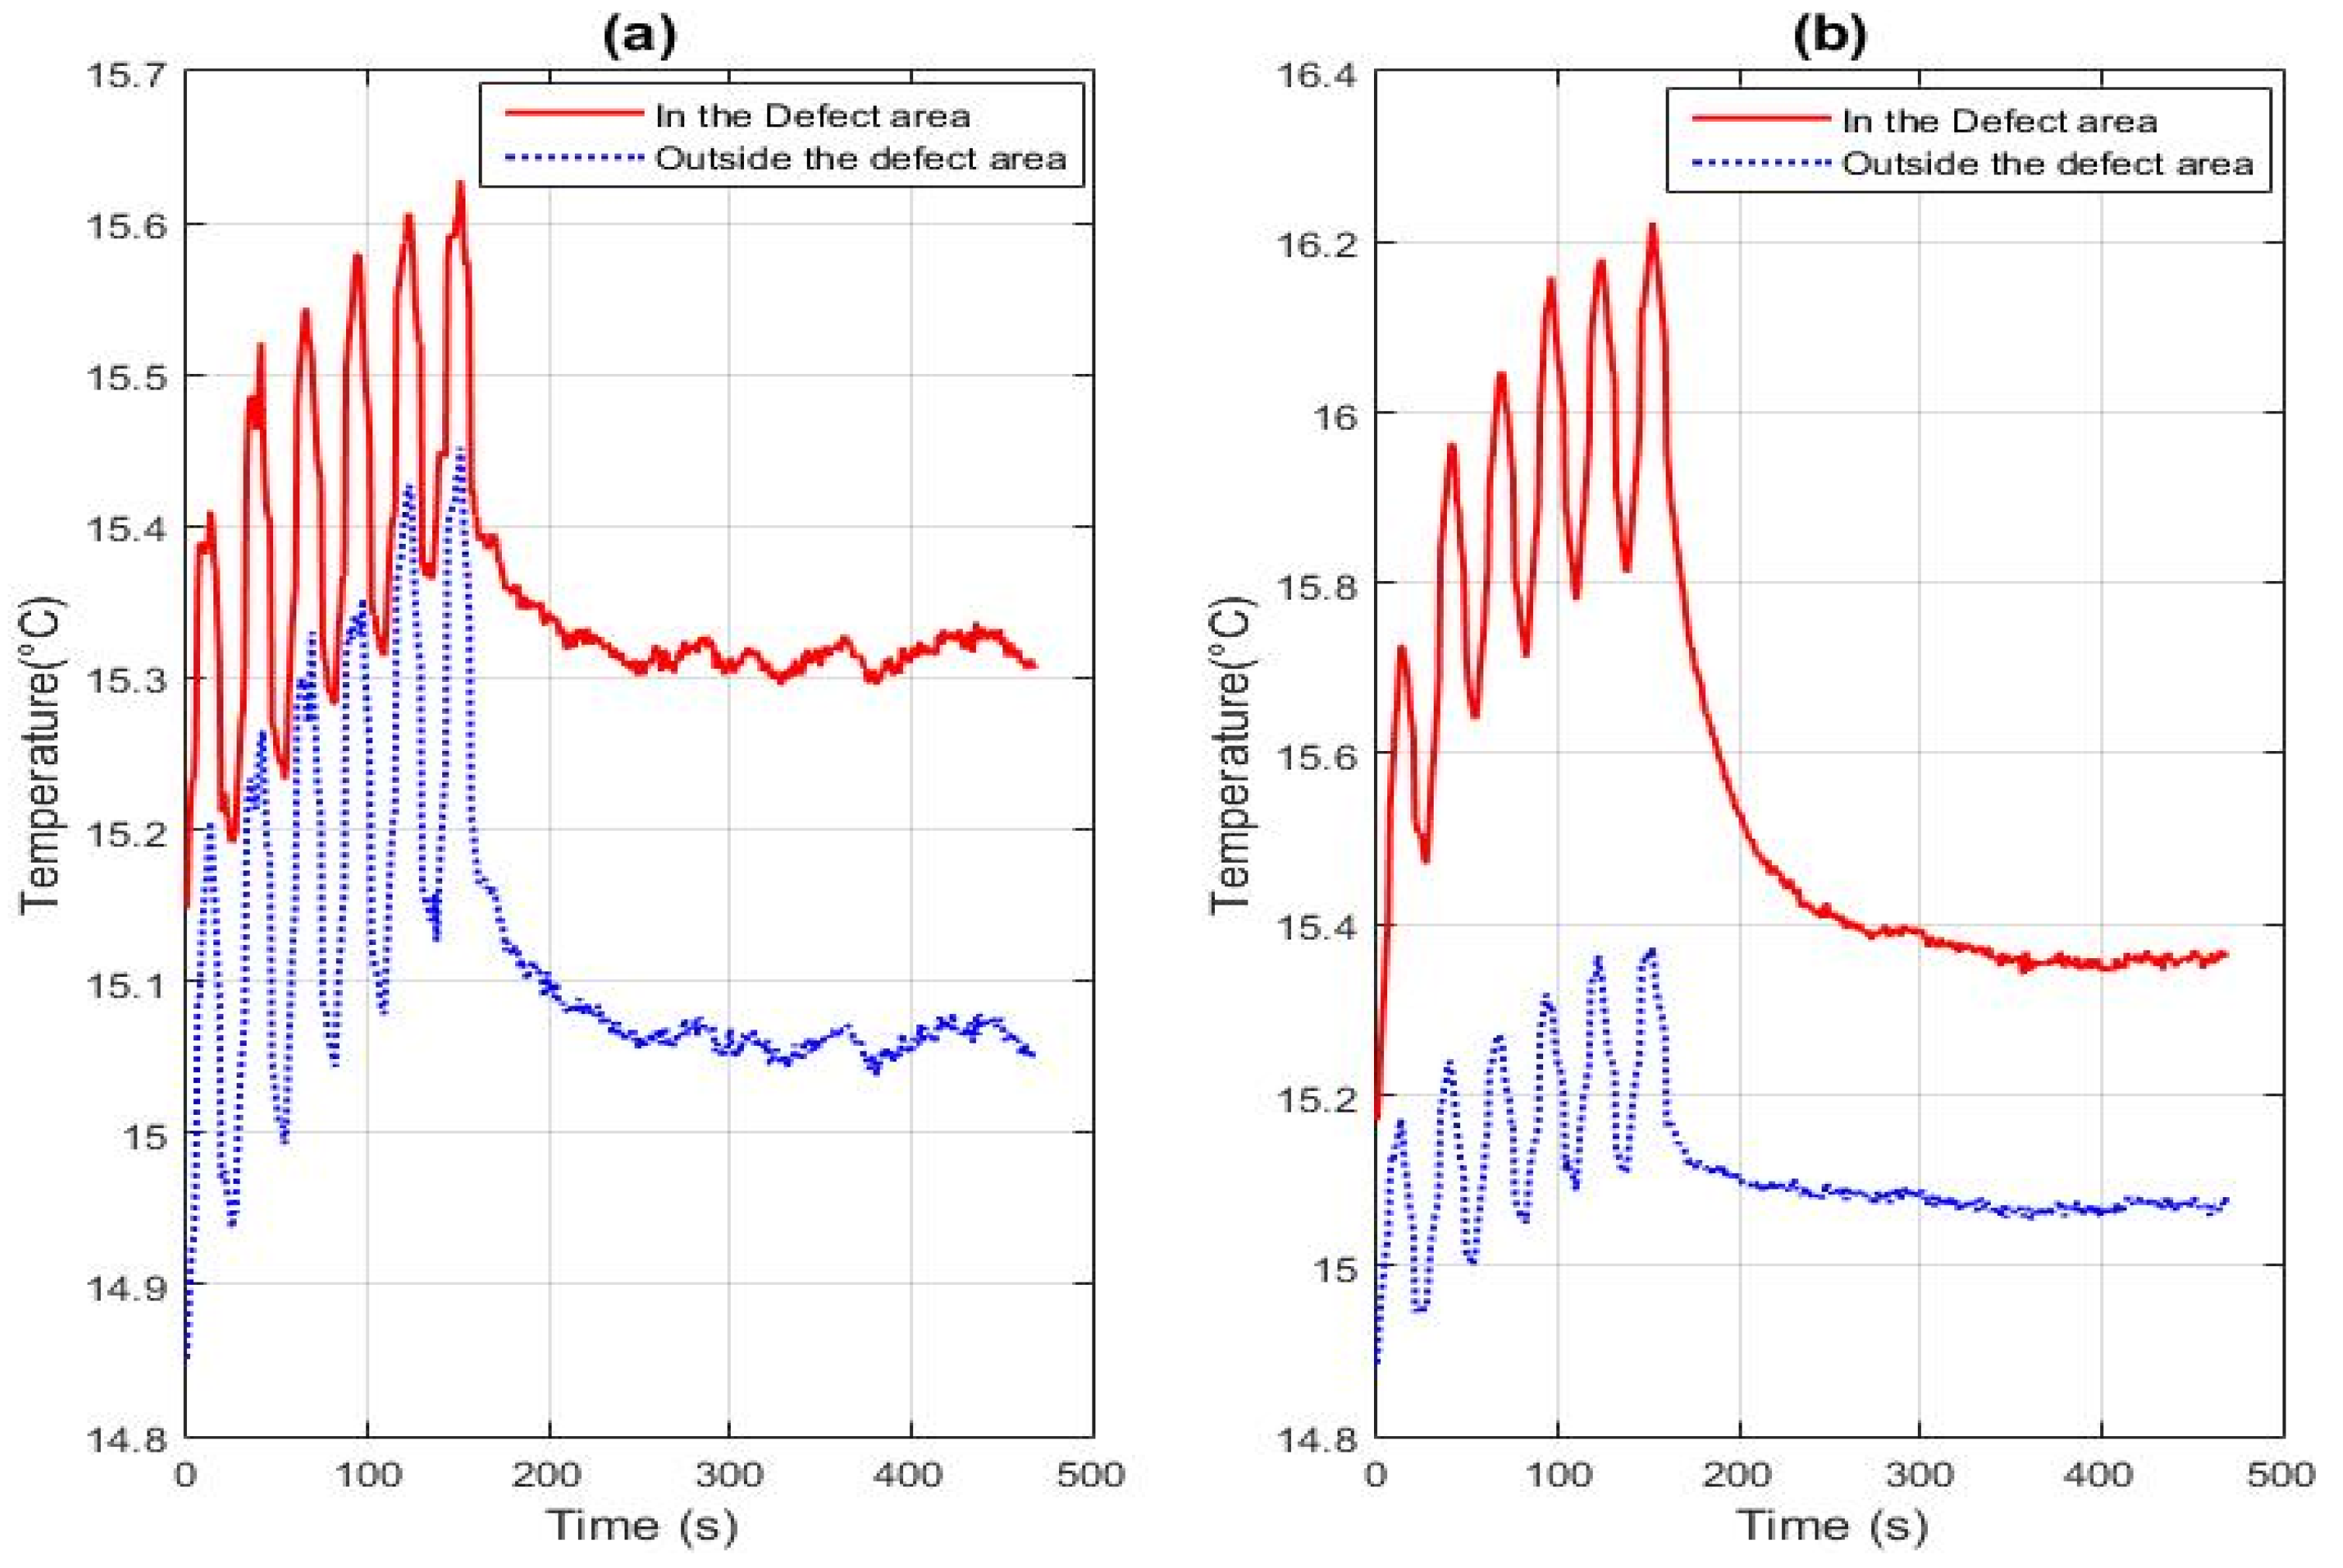
3.2. Results from Experimental Campaigns
4. Conclusions
Author Contributions
Funding
Institutional Review Board Statement
Informed Consent Statement
Data Availability Statement
Acknowledgments
Conflicts of Interest
References
- Hegde, S.; Satish Shenoy, B.; Chethan, K.N. Review on Carbon Fiber Reinforced Polymer (CFRP) and Their Mechanical Performance. Mater. Today Proc. 2019, 19 Pt 2, 658–662. [Google Scholar] [CrossRef]
- Lepretre, E.; Chataigner, S.; Dieng, L.; Gaillet, L. Fatigue Strengthening of Cracked Steel Plates with CFRP Laminates in the Case of Old Steel Material. Constr. Build. Mater. 2018, 174, 421–432. [Google Scholar] [CrossRef]
- Firmo, J.P.; Correia, J.R.; França, P. Fire Behaviour of Reinforced Concrete Beams Strengthened with CFRP Laminates: Protection Systems with Insulation of the Anchorage Zones. Compos. Part B Eng. 2012, 43, 1545–1556. [Google Scholar] [CrossRef]
- Obaidat, Y.T.; Heyden, S.; Dahlblom, O.; Ghazi, A.-F.; Yahia, A.-J. Retrofitting of Reinforced Concrete Beams Using Composite Laminates. Constr. Build. Mater. 2011, 25, 591–597. [Google Scholar] [CrossRef]
- Yumnam, M.; Gupta, H.; Ghosh, D.; Jaganathan, J. Inspection of Concrete Structures Externally Reinforced with FRP Composites Using Active Infrared Thermography: A Review. Constr. Build. Mater. 2021, 310, 125265. [Google Scholar] [CrossRef]
- Alessi, S.; Giuseppe, P.; Giuseppe, S. Effect of Hydrothermal Ageing on the Thermal and Delamination Fracture Behaviour of CFRP Composites. Compos. Part B Eng. 2014, 67, 145–153. [Google Scholar] [CrossRef]
- Shang, X.; Marques, E.A.S.; Machado, J.J.M.; Carbas, R.J.C.; Jiang, D.; da Silva, L.F.M. Review on Techniques to Improve the Strength of Adhesive Joints with Composite Adherends. Compos. Part B Eng. 2019, 177, 107363. [Google Scholar] [CrossRef]
- Jasiūnienė, E.; Yilmaz, B.; Smagulova, D.; Bhat, G.A.; Cicėnas, V.; Žukauskas, E.; Mažeika, L. Non-Destructive Evaluation of the Quality of Adhesive Joints Using Ultrasound, X-Ray, and Feature-Based Data Fusion. Appl. Sci. 2022, 12, 12930. [Google Scholar] [CrossRef]
- Wang, B.; Zhong, S.; Lee, T.-L.; Fancey, K.S.; Mi, J. Non-Destructive Testing and Evaluation of Composite Materials/Structures: A State-of-the-Art Review. Adv. Mech. Eng. 2020, 12, 168781402091376. [Google Scholar] [CrossRef] [Green Version]
- Wang, B.; He, P.; Kang, Y.; Jia, J.; Liu, X.; Li, N. Ultrasonic Testing of Carbon Fiber-Reinforced Polymer Composites. J. Sens. 2022, 2022, 5462237. [Google Scholar] [CrossRef]
- Wen, B.; Zhou, Z.; Zeng, B.; Yang, C.; Fang, D.; Xu, Q.; Shao, Y.; Wan, C. Pulse-Heating Infrared Thermography Inspection of Bonding Defects on Carbon Fiber Reinforced Polymer Composites. Sci. Prog. 2020, 103, 003685042095013. [Google Scholar] [CrossRef]
- Maldague, X.P.V. Theory and Practice of Infrared Technology for Nondestructive Testing; Wiley series in microwave and optical engineering; Wiley: New York, NY, USA, 2001. [Google Scholar]
- Cannard, H.; Mahrez, M.; Perrin, T.; Muzet, V.; Prybyla, D.; Brachelet, F. The use of infrared thermography for defects detection on reinforced concrete bridges. In Proceedings of the 12th Quantitative InfraRed Thermography (QIRT2014), Bordeaux, France, 7–11 July 2014. [Google Scholar]
- Keo, S.A.; Brachelet, F.; Breaban, F.; Defer, D. Defect Detection in CFRP by Infrared Thermography with CO2 Laser Excitation Compared to Conventional Lock-in Infrared Thermography. Compos. Part B Eng. 2015, 69, 1–5. [Google Scholar] [CrossRef]
- Keo, S.-A.; Brachelet, F.; Breaban, F.; Defer, D. Development of an Infrared Thermography Method with CO2 Laser Excitation, Applied to Defect Detection in CFRP. Int. J. Civ. Environ. Eng. 2013, 7, 5. [Google Scholar]
- Keo, S.A. Développement d’une méthode de Thermographie Infrarouge Active par Excitation Micro-Ondes Appliquée au Contrôle non Destructif. Ph.D. Thesis, Université d’Artois, Béthune, France, 2013. [Google Scholar]
- Dragan, R.G.; Rosca, I.-C.; Keo, S.-A.; Breaban, F. Active Thermography Method Using an CO2 Laser for Thermal Excitation, Applied to Defect Detection in Bioceramic Materials. In 2013 E-Health and Bioengineering Conference (EHB); IEEE: Iași, Romania, 2013; pp. 1–4. [Google Scholar] [CrossRef]
- Geng, C.; Shi, W.; Liu, Z.; Xie, H.; He, W. Nondestructive Surface Crack Detection of Laser-Repaired Components by Laser Scanning Thermography. Appl. Sci. 2022, 12, 5665. [Google Scholar] [CrossRef]
- Deane, S.; Avdelidis, N.P.; Ibarra-Castanedo, C.; Williamson, A.A.; Withers, S.; Zolotas, A.; Maldague, X.P.V.; Ahmadi, M.; Pant, S.; Genest, M.; et al. Development of a Thermal Excitation Source Used in an Active Thermographic UAV Platform. Quant. InfraRed Thermogr. J. 2022, 1–32. [Google Scholar] [CrossRef]
- Dahlberg, P.; Ziegeler, N.J.; Nolte, P.W.; Schweizer, S. Design and Construction of an LED-Based Excitation Source for Lock-In Thermography. Appl. Sci. 2022, 12, 2940. [Google Scholar] [CrossRef]
- Jia, Y.; Tang, L.; Xu, B.; Zhang, S. Crack detection in concrete parts using vibrothermography. J. Nondestruct. Eval. 2019, 38, 21. [Google Scholar] [CrossRef]
- Katunin, A.; Angelika, W.-K.; Dominik, W. Impact damage assessment in polymer matrix composites using self-heating based vibrothermography. Compos. Struct. 2019, 214, 214–226. [Google Scholar] [CrossRef]
- Mendioroz, A.; Celorrio, R.; Cifuentes, A.; Zatón, L.; Salazar, A. Sizing vertical cracks using burst vibrothermography. NDT E Int. 2016, 84, 36–46. [Google Scholar] [CrossRef]
- Makul, N.; Rattanadecho, P.; Agrawal, D.K. Applications of Microwave Energy in Cement and Concrete—A Review. Renew. Sustain. Energy Rev. 2014, 37, 715–733. [Google Scholar] [CrossRef]
- Makul, N.; Rattanadecho, P.; Pichaicherd, A. Accelerated Microwave Curing of Concrete: A Design and Performance-Related Experiments. Cem. Concr. Compos. 2017, 83, 415–426. [Google Scholar] [CrossRef]
- Choi, H.; Koh, T.; Choi, H.; Hama, Y. Performance Evaluation of Precast Concrete Using Microwave Heating Form. Materials 2019, 12, 1113. [Google Scholar] [CrossRef] [Green Version]
- Zhang, L.; Zhang, Z.; Yu, W.; Miao, Y. Review of the Application of Microwave Heating Technology in Asphalt Pavement Self-Healing and De-Icing. Polymers 2023, 15, 1696. [Google Scholar] [CrossRef]
- Keo, S.A.; Brachelet, F.; Defer, D.; Breaban, F. Defects Detection by Infrared Thermography with a New Microwave Excitation System. Mech. Ind. 2014, 15, 509–516. [Google Scholar] [CrossRef]
- Keo, S.A.; Brachelet, F.; Breaban, F.; Defer, D. Steel Detection in Reinforced Concrete Wall by Microwave Infrared Thermography. NDT E Int. 2014, 62, 172–177. [Google Scholar] [CrossRef]
- Keo, S.-A.; Yune, C.-Y.; Dragan, R.G.; Defer, D.; Breaban, F. Analysis of Effects of Diffraction and Interference on Detection by Microwave Thermography. J. Civ. Struct. Health Monit. 2019, 9, 153–167. [Google Scholar] [CrossRef]
- Keo, S.A.; Brachelet, F.; Defer, D.; Breaban, F. Detection of Concrete Cover of Reinforcements in Reinforced Concrete Wall by Microwave Thermography with Transmission Approach. Appl. Sci. 2022, 12, 9865. [Google Scholar] [CrossRef]
- Szymanik, B.; Chady, T.; Frankowski, P. Inspection of Reinforcement Concrete Structures with Active Infrared Thermography. In Proceedings of the AIP Conference Proceedings, Atlanta, GA, USA, 17–22 July 2017; Volume 1806, p. 100013. [Google Scholar] [CrossRef]
- Szymanik, B.; Frankowski, P.; Chady, T.; John Chelliah, C. Detection and Inspection of Steel Bars in Reinforced Concrete Structures Using Active Infrared Thermography with Microwave Excitation and Eddy Current Sensors. Sensors 2016, 16, 234. [Google Scholar] [CrossRef] [Green Version]
- Szymanik, B. An Evaluation of 3D-Printed Materials’ Structural Properties Using Active Infrared Thermography and Deep Neural Networks Trained on the Numerical Data. Materials 2022, 15, 3727. [Google Scholar] [CrossRef]
- Hong, C.R.; Buyukozturk, O. Electromagnetic Properties of Concrete at Microwave Frequency Range. ACI Mater. J. 1998, 95, 262–271. [Google Scholar]
- Verspeek, S.; Ribbens, B.; Maldague, X.; Steenackers, G. Spot Weld Inspections Using Active Thermography. Appl. Sci. 2022, 12, 5668. [Google Scholar] [CrossRef]
- Zheng, H.; Zhou, L.; Marks, R.; Happonen, T.; Kraft, T.M. Defect Recognition of Roll-to-Roll Printed Conductors Using Dark Lock-in Thermography and Localized Segmentation. Appl. Sci. 2022, 12, 2005. [Google Scholar] [CrossRef]
- Goffin, B.; Banthia, N.; Yonemitsu, N. Use of Infrared Thermal Imaging to Detect Corrosion of Epoxy Coated and Uncoated Rebar in Concrete. Constr. Build. Mater. 2020, 263, 120162. [Google Scholar] [CrossRef]
- Bu, C.; Liu, G.; Zhang, X.; Tang, Q. Debonding Defects Detection of FMLs Based on Long Pulsed Infrared Thermography Technique. Infrared Phys. Technol. 2020, 104, 103074. [Google Scholar] [CrossRef]
- Sultan, A.A.; Washer, G. A Pixel-by-Pixel Reliability Analysis of Infrared Thermography (IRT) for the Detection of Subsurface Delamination. NDT E Int. 2017, 92, 177–186. [Google Scholar] [CrossRef]
- Lai, W.L.; Kou, S.C.; Poon, C.S.; Tsang, W.F.; Ng, S.P.; Hung, Y.Y. Characterization of flaws embedded in externally bonded CFRP on concrete beams by infrared thermography and shearography. J. Nondestruct. Eval. 2009, 28, 27–35. [Google Scholar] [CrossRef]
- Weritz, F.; Arndt, R.; Röllig, M.; Maierhofer, C.; Wiggenhauser, H. Intestigation of concrete structures with pulse phase thermography. Mater. Struct. 2005, 38, 843–849. [Google Scholar] [CrossRef]
- Maierhofer, C.; Arndt, R.; Röllig, M.; Rieck, C.; Walther, A.; Scheel, H.; Hillemeier, B. Application of impulse-thermography for non-destructive assessment of concrete structures. Cem. Concr. Compos. 2006, 28, 393–401. [Google Scholar] [CrossRef]
- Keo, S.-A.; Defer, D.; Breaban, F.; Brachelet, F. Comparison between microwave infrared thermography and CO2 laser infrared thermography in defect detection in applications with CFRP. Mater. Sci. Appl. 2013, 4, 600–605. [Google Scholar] [CrossRef] [Green Version]
- Kong, J.A. Electromagnetic Wave Theory; EMW Publishing: Cambridge, MA, USA, 2000. [Google Scholar]
- Leontovich, M.A. Approximate boundary conditions for the electromagnetic field at the surface of a well conducting body. In Investigations of Radiowave Propagation; AN SSSR: Moscow, Russia, 1949; pp. 5–12. (In Russian) [Google Scholar]
- Gustafson, K.; Abe, T. The third boundary condition—Was it robin’s? Math. Intell. 1998, 20, 63–71. [Google Scholar] [CrossRef]
- Balanis, C.A. Antenna Theory: Analysis and Design, 4th ed.; John Wiley & Sons: Hoboken, NJ, USA, 2016. [Google Scholar]
- Meredith, R.J. Engineers’ Handbook of Industrial Microwave Heating; No. 25; IET: London, UK, 1998. [Google Scholar]
- Lundström, F.; Frogner, K.; Wiberg, O.; Cedell, T.; Andersson, M. Induction heating of carbon fiber composites: Investigation of electrical and thermal properties. Int. J. Appl. Electromagn. Mech. 2017, 53, S21–S30. [Google Scholar] [CrossRef]


| Air | Aluminum | Epoxy | CFRP | Concrete | |
|---|---|---|---|---|---|
| Cp (J/(kg·K)) | N/A | 1700 | 1700 | 750 | |
| Density (kg/m3) | N/A | 1150 | 1150 | 2400 | |
| Epsilon (relative permittivity) | 1 | 1 | 3.9–2.2 j | 3.6 | 8.4–2.86 j |
| Thermal conductivity (W/(m·K)) | N/A | 0.18 | 5 | 0.8 | |
| Electrical conductivity (S/m) | 0 | 0 | 0.5 | 0 | |
| Relative permeability | 1 | 1 | 1 | 1 | 1 |
Disclaimer/Publisher’s Note: The statements, opinions and data contained in all publications are solely those of the individual author(s) and contributor(s) and not of MDPI and/or the editor(s). MDPI and/or the editor(s) disclaim responsibility for any injury to people or property resulting from any ideas, methods, instructions or products referred to in the content. |
© 2023 by the authors. Licensee MDPI, Basel, Switzerland. This article is an open access article distributed under the terms and conditions of the Creative Commons Attribution (CC BY) license (https://creativecommons.org/licenses/by/4.0/).
Share and Cite
Keo, S.A.; Szymanik, B.; Le Roy, C.; Brachelet, F.; Defer, D. Defect Detection in CFRP Concrete Reinforcement Using the Microwave Infrared Thermography (MIRT) Method—A Numerical Modeling and Experimental Approach. Appl. Sci. 2023, 13, 8393. https://doi.org/10.3390/app13148393
Keo SA, Szymanik B, Le Roy C, Brachelet F, Defer D. Defect Detection in CFRP Concrete Reinforcement Using the Microwave Infrared Thermography (MIRT) Method—A Numerical Modeling and Experimental Approach. Applied Sciences. 2023; 13(14):8393. https://doi.org/10.3390/app13148393
Chicago/Turabian StyleKeo, Sam Ang, Barbara Szymanik, Claire Le Roy, Franck Brachelet, and Didier Defer. 2023. "Defect Detection in CFRP Concrete Reinforcement Using the Microwave Infrared Thermography (MIRT) Method—A Numerical Modeling and Experimental Approach" Applied Sciences 13, no. 14: 8393. https://doi.org/10.3390/app13148393