Article

Construction of Half Masks for the Respiratory Tract Protection and the Speech Intelligibility Assessed from the Measured Suppression of Sound

1
Department of Production Engineering, Faculty of Materials Engineering, Silesian University of Technology, Akademicka 2A, 44-100 Gliwice, Poland
2
Faculty of Science and Technology, Jan Długosz University, Al. Armii Krajowej 13/15, 42-200 Czestochowa, Poland
3
Institute for Energy Security and Environmental Safety, Centre for Energy Research, Konkoly-Thege Miklos ut 29–33, 1121 Budapest, Hungary
*
Author to whom correspondence should be addressed.
Appl. Sci. 2023, 13(15), 8644; https://doi.org/10.3390/app13158644
Submission received: 22 May 2023 / Revised: 16 July 2023 / Accepted: 25 July 2023 / Published: 27 July 2023

Abstract

:
Half masks (a.k.a. filtering facepieces, FFP) are personal protective equipment against dust in a work environment. Their filtration efficiency is legally regulated. Occupational safety and health services have not paid enough attention to speech disruption caused by FFPs, even though the latter could impair verbal communication and result in discomfort or increased risk of accidents. This study deals with the objective differences in speech suppression between masks of various construction belonging to the same filtration class, FFP2, and equipped with exhalation valves. We applied an objective method of white noise attenuation, suggested in our previous work. Its uniqueness lies in the fact that the acoustic apparati are applied in the whole procedure, and no human speakers/listeners participation is required. We compared seven types of masks: three moulded, one moulded with folded elements, two folded horizontally, and one vertically. We determined attenuation caused by the masks in 1/3 octave-wide bands with centre frequency from 100 Hz to 20 kHz. All the studied FFPs attenuated sound waves in a frequency range responsible for 80–90% of the perceived speech intelligibility. The attenuations of moulded masks were ca. 3 dB higher in 1–16 kHz bands than those of folded ones. The moulded mask with foldable parts for better fitting the face suppressed the high-pitch tones considerably more than the other masks. These observations were confirmed quantitatively by the cluster analysis based on the Euclidean distances between the acoustic spectra.

1. Introduction

Good verbal communication is crucial in a work environment. The intelligibility of spoken messages depends on the acoustic parameters of the work environment, the message unambiguity and the speech signal quality. Industrial noise interferes with the speech signal and forces speakers to raise their voices. That impedes communication, all the more so because individual hearing protectors in a noisy environment are often necessary. Another impediment could be personal equipment for respiratory tract protection. Workers must wear masks or half-masks when concentrations of industrial dust and chemical or biological agents in the work environment exceed the threshold limit values specified by law [1,2]. Thus, manufacturers and researchers have focused their attention on filtration efficiency, i.e., on filtration capacity and air permeability, and the construction improvement for better fitting different wearers’ faces [3]. Filtration efficiency is the subject of standardization. For example, three classes of filtering facepieces: FFP1, FFP2, and FFP3, are specified in the EN 149:2001+A1:2009 standard [4].
The COVID-19 pandemic regulations introduced masks as mandatory protective equipment in public spaces. The wider use caused broader interest in mask-wearing comfort, including the so far overlooked problem of speech suppression. Still, the studies dealt mainly with subjective assessments of the speech deterioration caused by the masks [5,6,7,8,9]. Indeed, the legibility perceived by humans is the ultimate test of speech disruption. However, large groups of speakers and listeners must be involved in such experiments to keep the uncertainty of the results within reasonable limits. Another problem is the repeatability of the results obtained in this manner. Objective methods based solely on acoustic measurements rather than on human perception seem to be a good alternative.
To the best of our knowledge, the first objective method was suggested in our previous paper [10]. We have not found information about similar ideas in the literature. For this reason, the basics of the method and the validation procedure are summarised below for the readers’ convenience. The approach relied on the measurements of white noise attenuation by FFPs. The measured attenuation of sound in the octave-wide frequency bands, ΔLf, constituted an “acoustic characteristic” of the mask. With the acoustic characteristics, one could easily predict the speech disruption caused by the FFP just by subtracting the ΔLf values from the acoustic spectrum of the speech, e.g., that defined in the ANSI 3.5-1997 standard [11]. We verified the method using a speech signal played by a calibrated acoustic source. Two time series of sound pressure levels (SPL) were compared for each FFP. The first series contained the SPLs recorded for the source speaker covered with the mask. The data in the second series were differences between the SPLs recorded for the uncovered speaker and the respective ΔLf values. We observed almost perfect agreement for all tested FFPs. Thus, the method ensured objective characteristics of speech suppression by the masks.
The studies [10] led to several conclusions of practical importance. All tested half-masks attenuated acoustic waves in the frequency range responsible for 80% of perceived speech intelligibility, especially in the octave band with the centre frequency of 2 KHz. Masks of higher filtration efficiency stronger attenuated the sound. Moreover, FFPs changed the voice timbre because the attenuation depended on the sound wave frequency.
In the present paper, we report the acoustic characteristics of seven FFPs. All of them belonged to the FFP2 type and were made of the same materials by one manufacturer but differed in construction. We studied how these differences influenced the suppression of sound and, consequently, disruption of the standardized speech spectra.
The paper has a structure typical of such works. The research material, measuring apparatus, and methodology were described in Section 2. The acoustic characteristics of the masks, i.e., the attenuations of sound in 1/3-octave-wide frequency bands, together with respective uncertainties, were reported in the Section 3. Section 4 contains a comparison of the masks based on the quantitative differences between the acoustics characteristics. To the best of our knowledge, application of the cluster analysis with the Euclidean distances and the single linkage method was applied here for the first time to this aim. Furthermore, disruptions to the ANSI 3.5-1997 standard acoustic spectrum of the speech [11] caused by the masks were reported and compared. The paper ends with conclusions and suggestions about further studies and possible implementation of the objective method in practice.

2. Experimental

2.1. Research Material

We tested seven types of disposable half masks from one manufacturer, Delta Plus, classified as FFP2 according to EN 149:2001+A1:2009 standard [4]. All the masks were made of synthetic nonwoven fabric and equipped with an exhalation valve for better breathing and an adjustable nose clip. Masks in the experiments were new and unused. Table 1 contains a description of the research material. The M1204 V mask fits the wearer’s face tighter than the remaining ones. For details, see the manufacturer’s web page [12].

2.2. Apparatus and Methodology

In this study, we used the same apparatus as previously [10]: Svantek SVAN 979 class 1 sound and vibration analyzer compliant with the IEC 61672-1: 2013 standard [13], equipped with a GRAS 40AE 1/2′′ microphone, and Bedrock TalkBox BTB65 source of the acoustic signal. Immediately before and after the measurements, we checked the Svantek meter with the class 1 Sound Calibrator SV36 according to the IEC 60942: 2017 standard [14]. All apparatus had valid certificates of calibration. We measured the sound pressure levels (SPL) in the same medium-sized laboratory room as previously, and the apparatus configuration was also the same [10]. The only difference was that we set the speaker-microphone distance to 1 m and the generated total sound pressure level to 72 dB rather than trying several combinations. The previous study evidenced that the measured attenuation of the FFPs did not depend on the speaker-microphone distance and the generated sound pressure level in the ranges of 1–5 m and from 60 to 72 dB at least [10].
In the 10-s-long measurement runs, the TalkBox generated white noise. The SVAN 979 recorded SPLs in 1/3 octave-wide bands averaged for this time interval. In further calculations, we considered the bands with centre frequency from 100 Hz to 20 kHz. In this frequency range, the total uncorrected background SPL of 33 dB was negligibly small in comparison with those recorded during the measurements. The measurements were done for the TalkBox speaker uncovered and covered by each of the FFPs.
Contrary to the previous study, we did not measure the influence of FFPs on simulated speech generated by TalkBox in the present study. Previously, we proved that the Lf values recorded in the direct measurements of the speech and calculated from the attenuation characteristics, ΔLf, did not differ significantly from one another [10]. Thus, such measurements were unnecessary this time.

3. Results

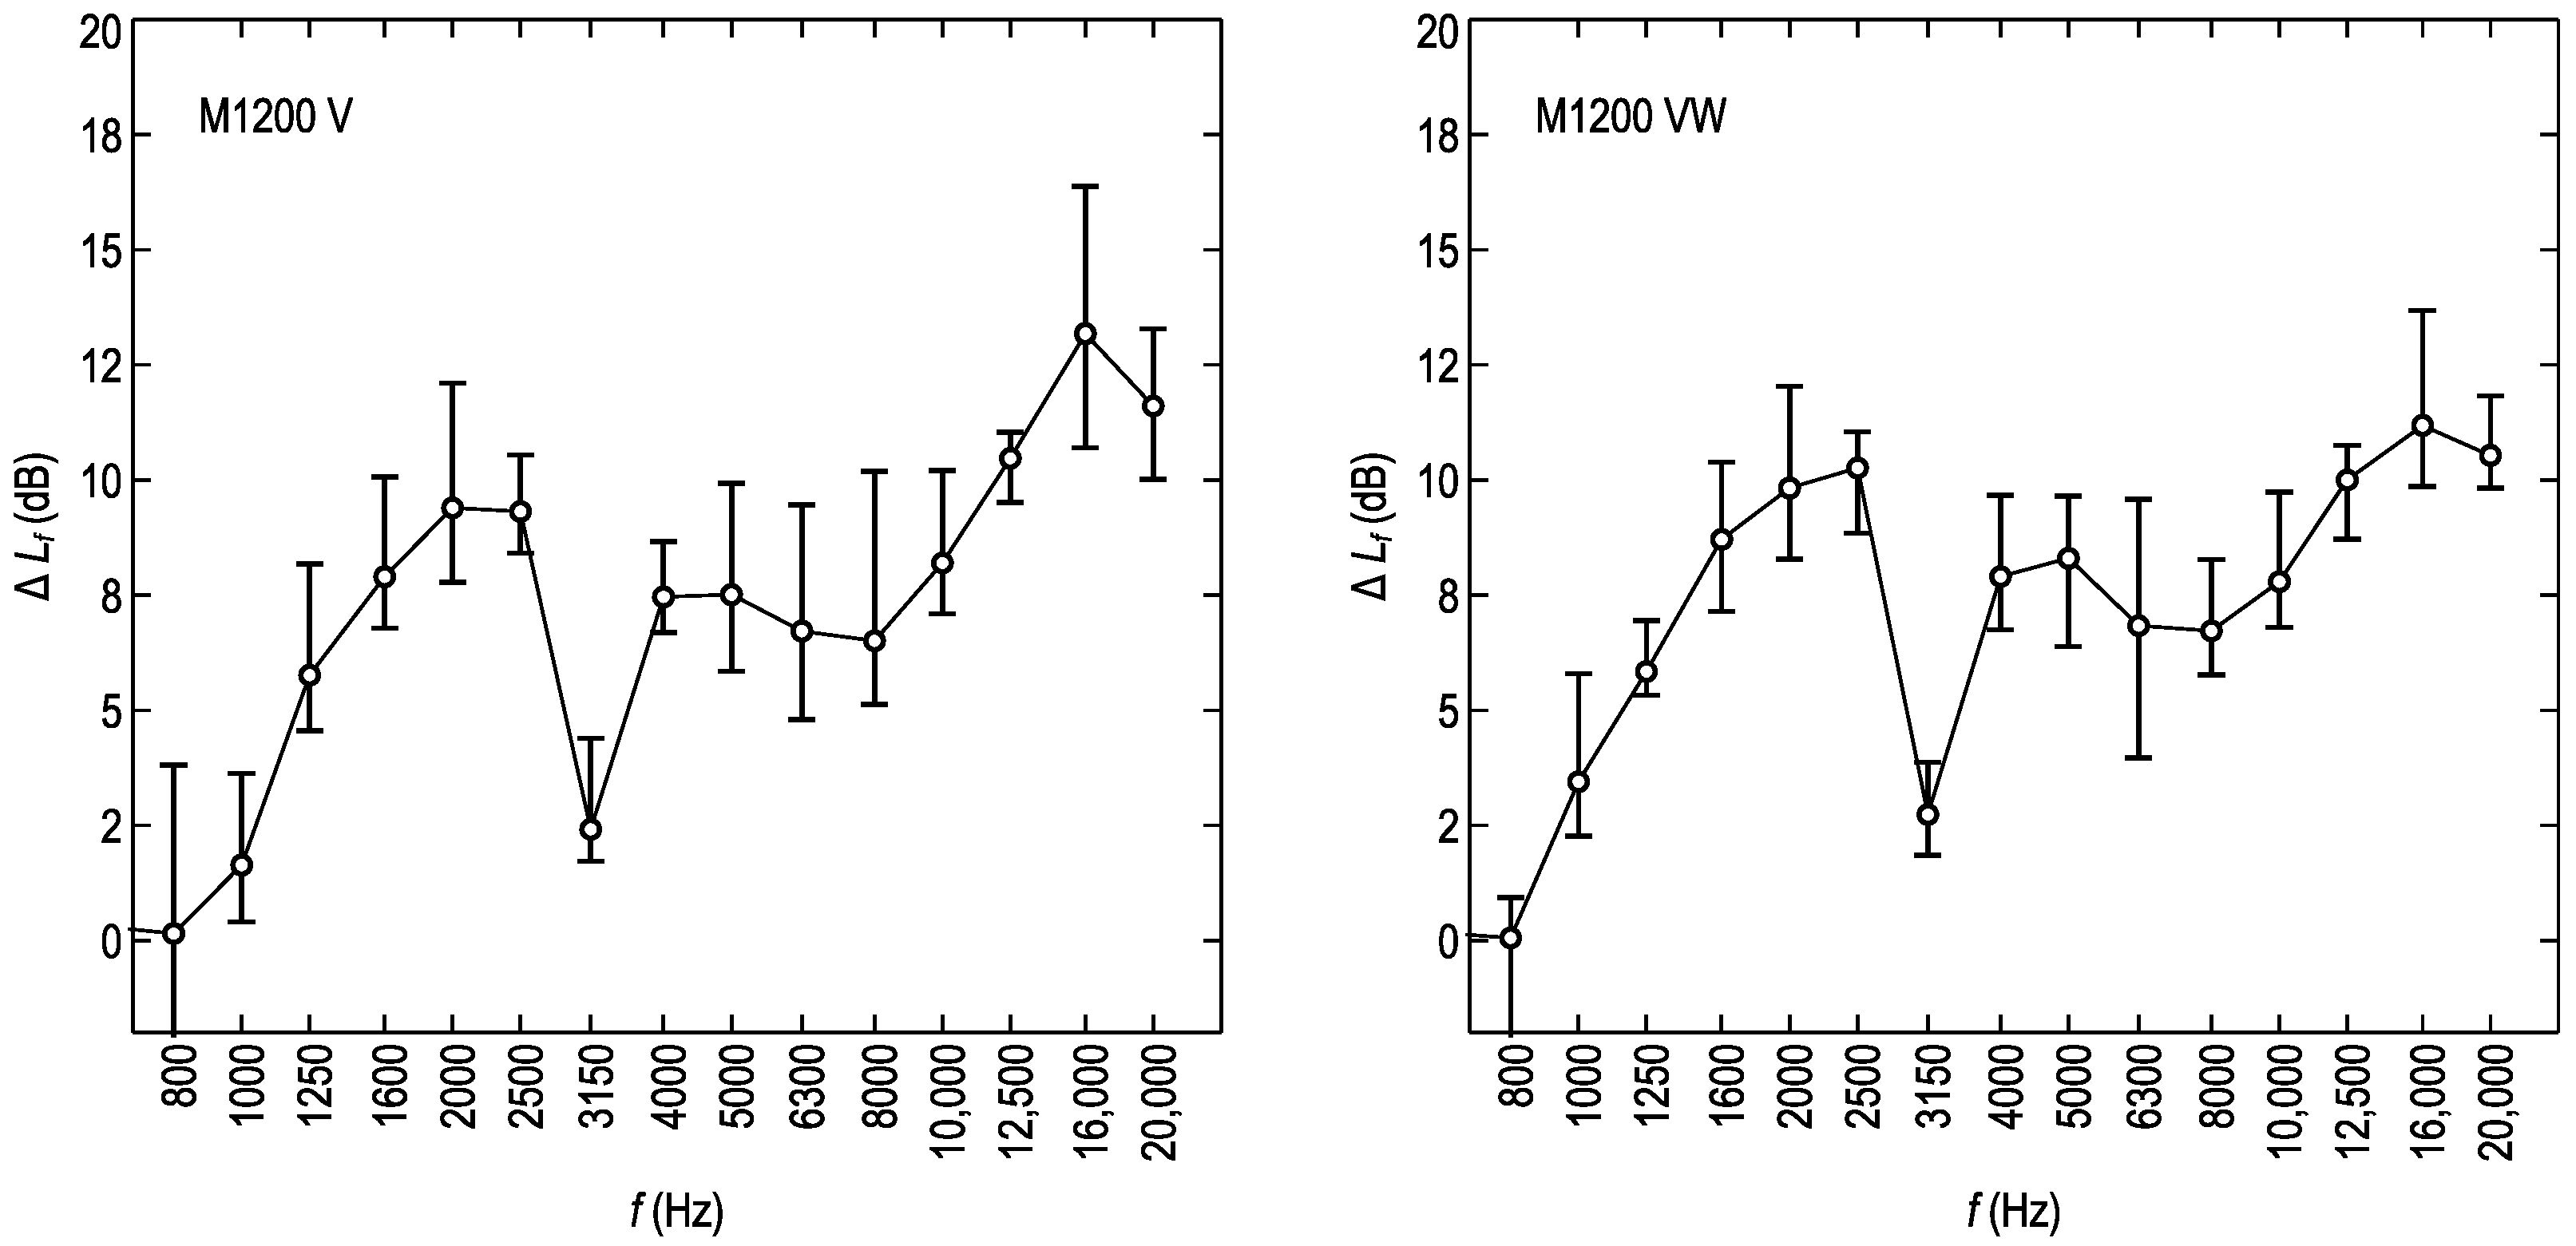
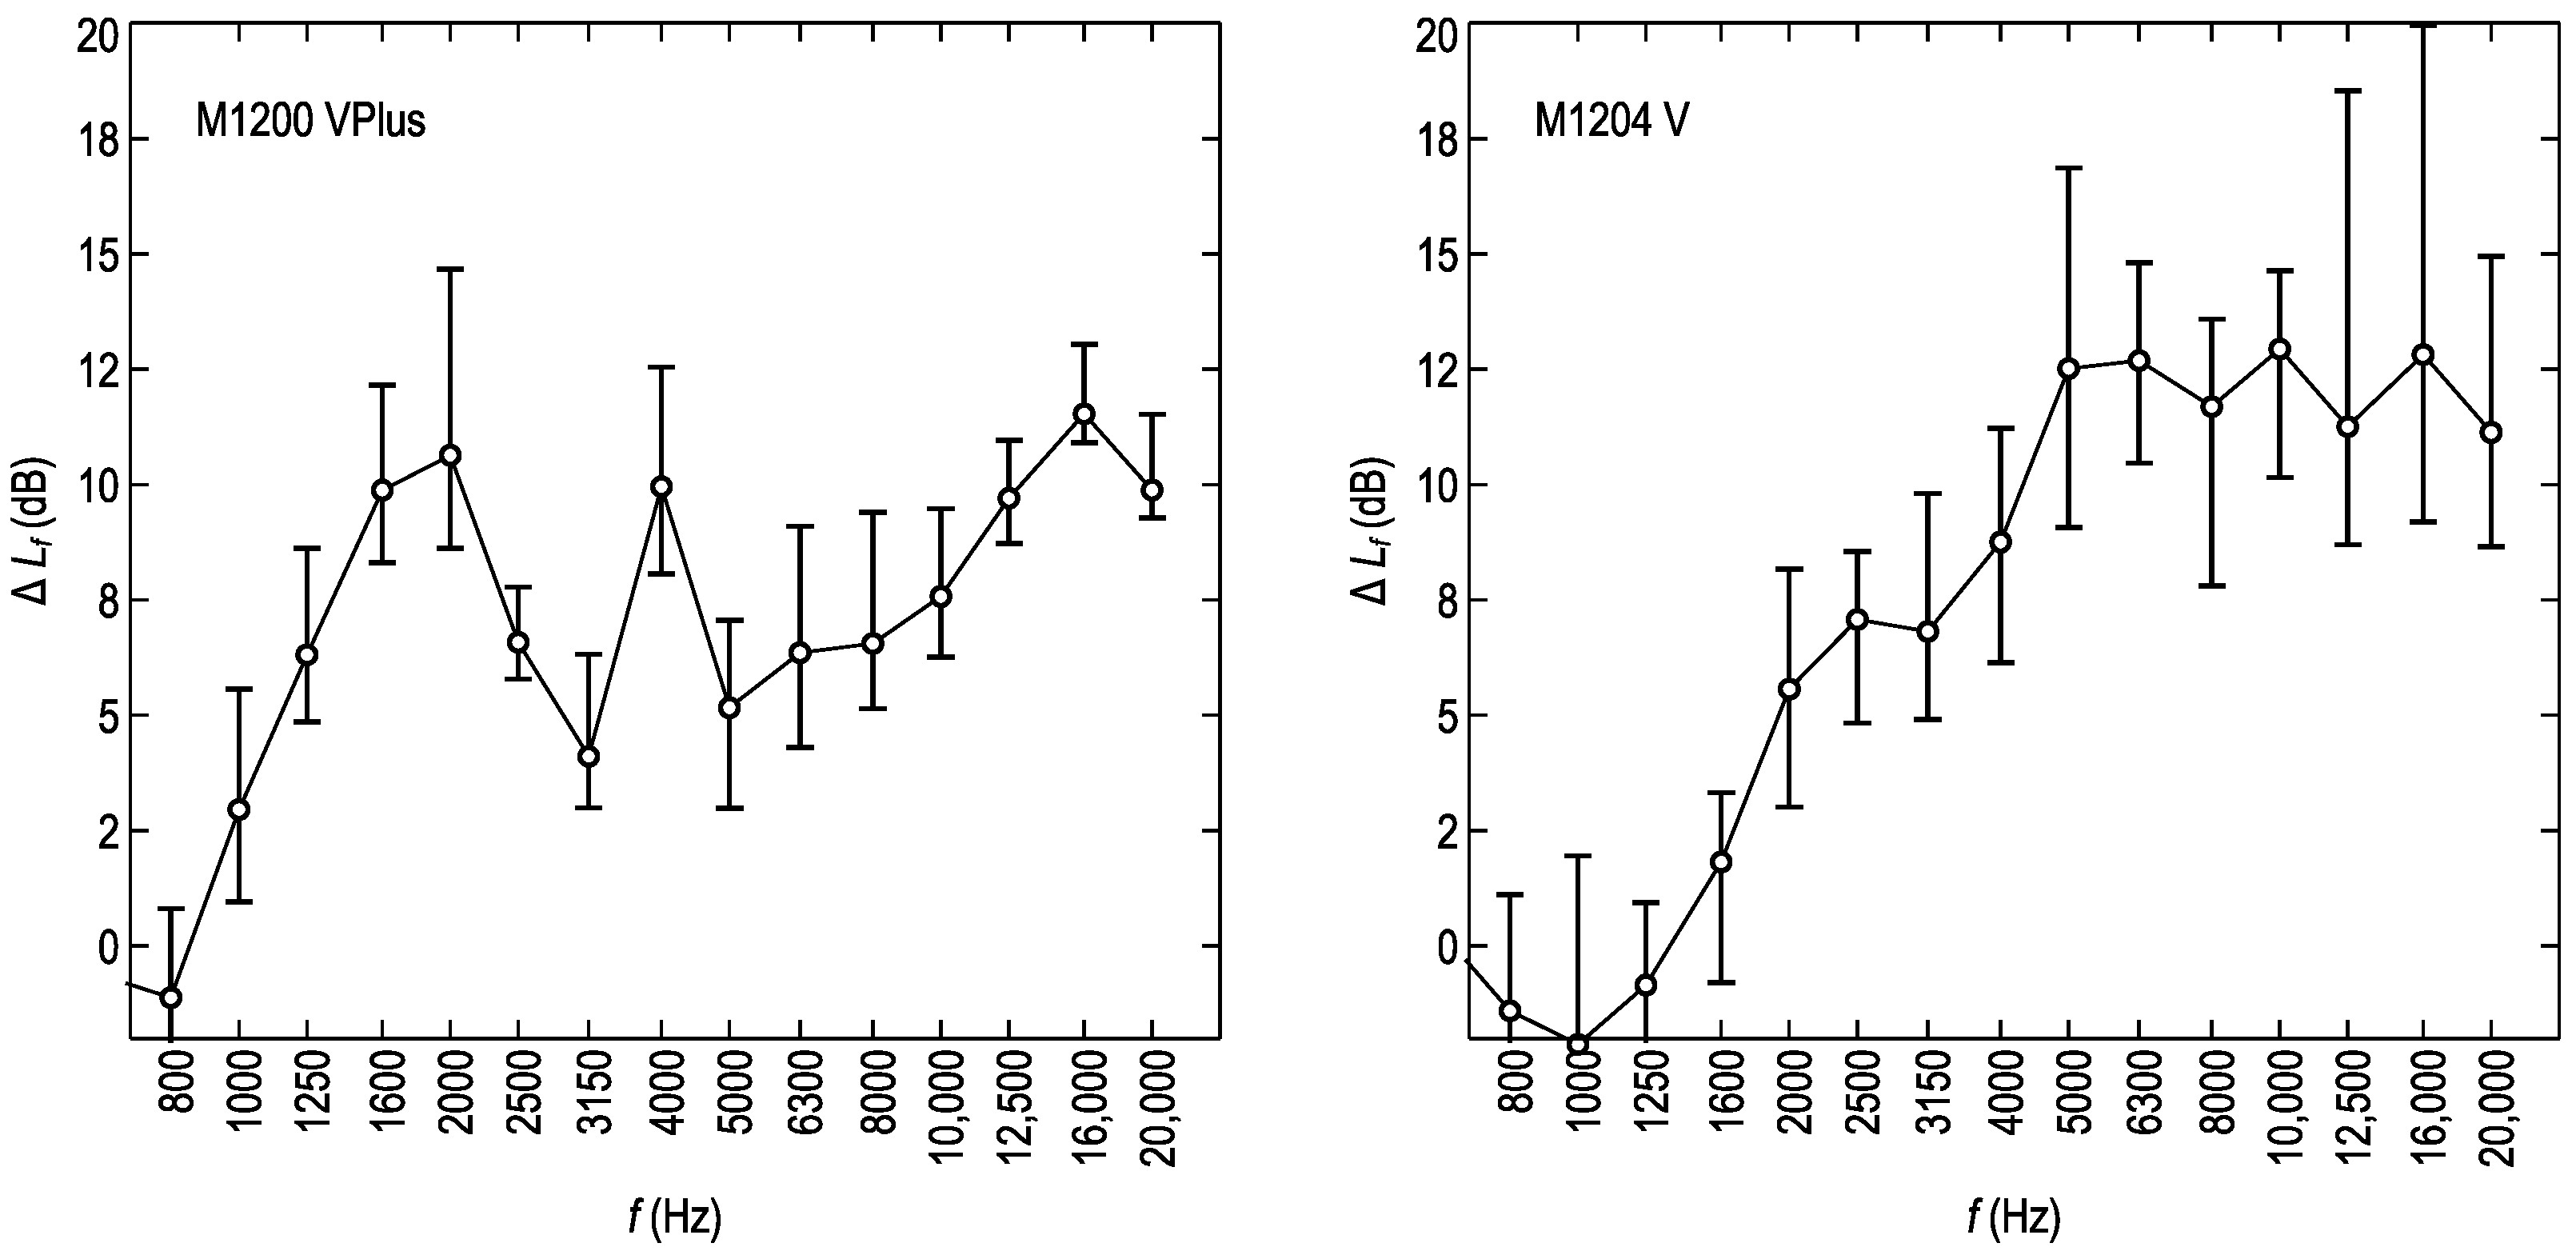
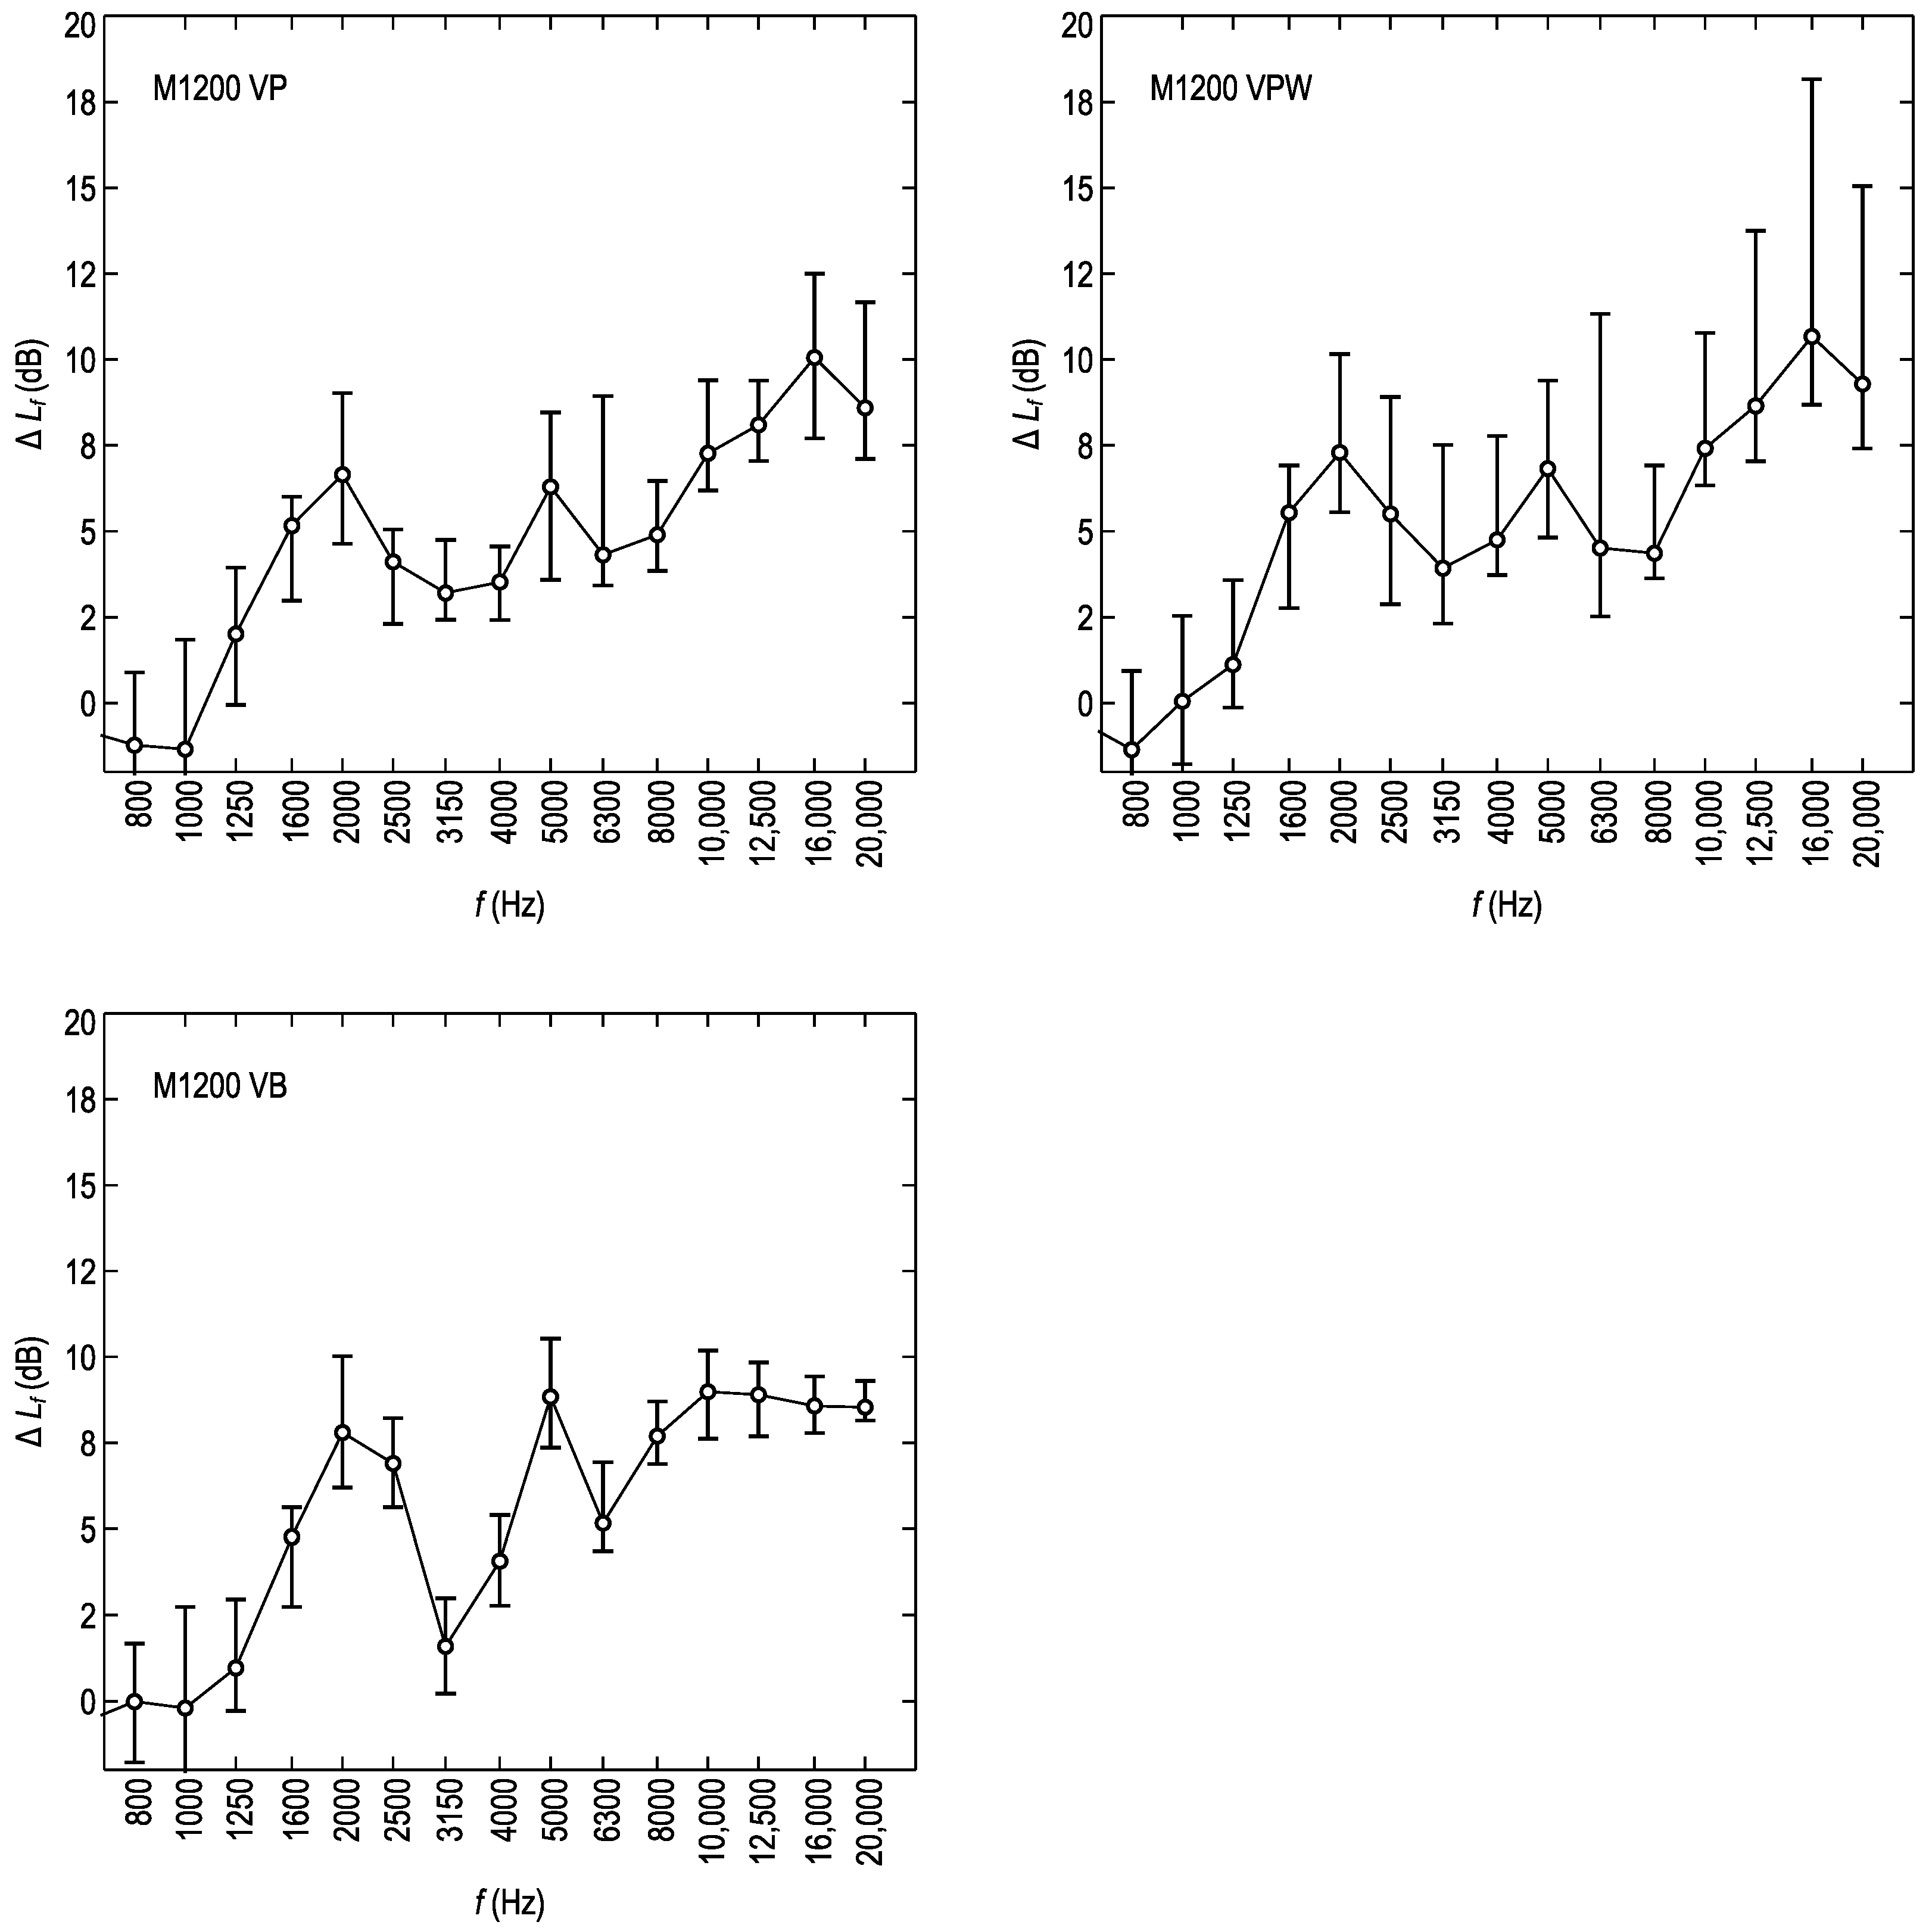
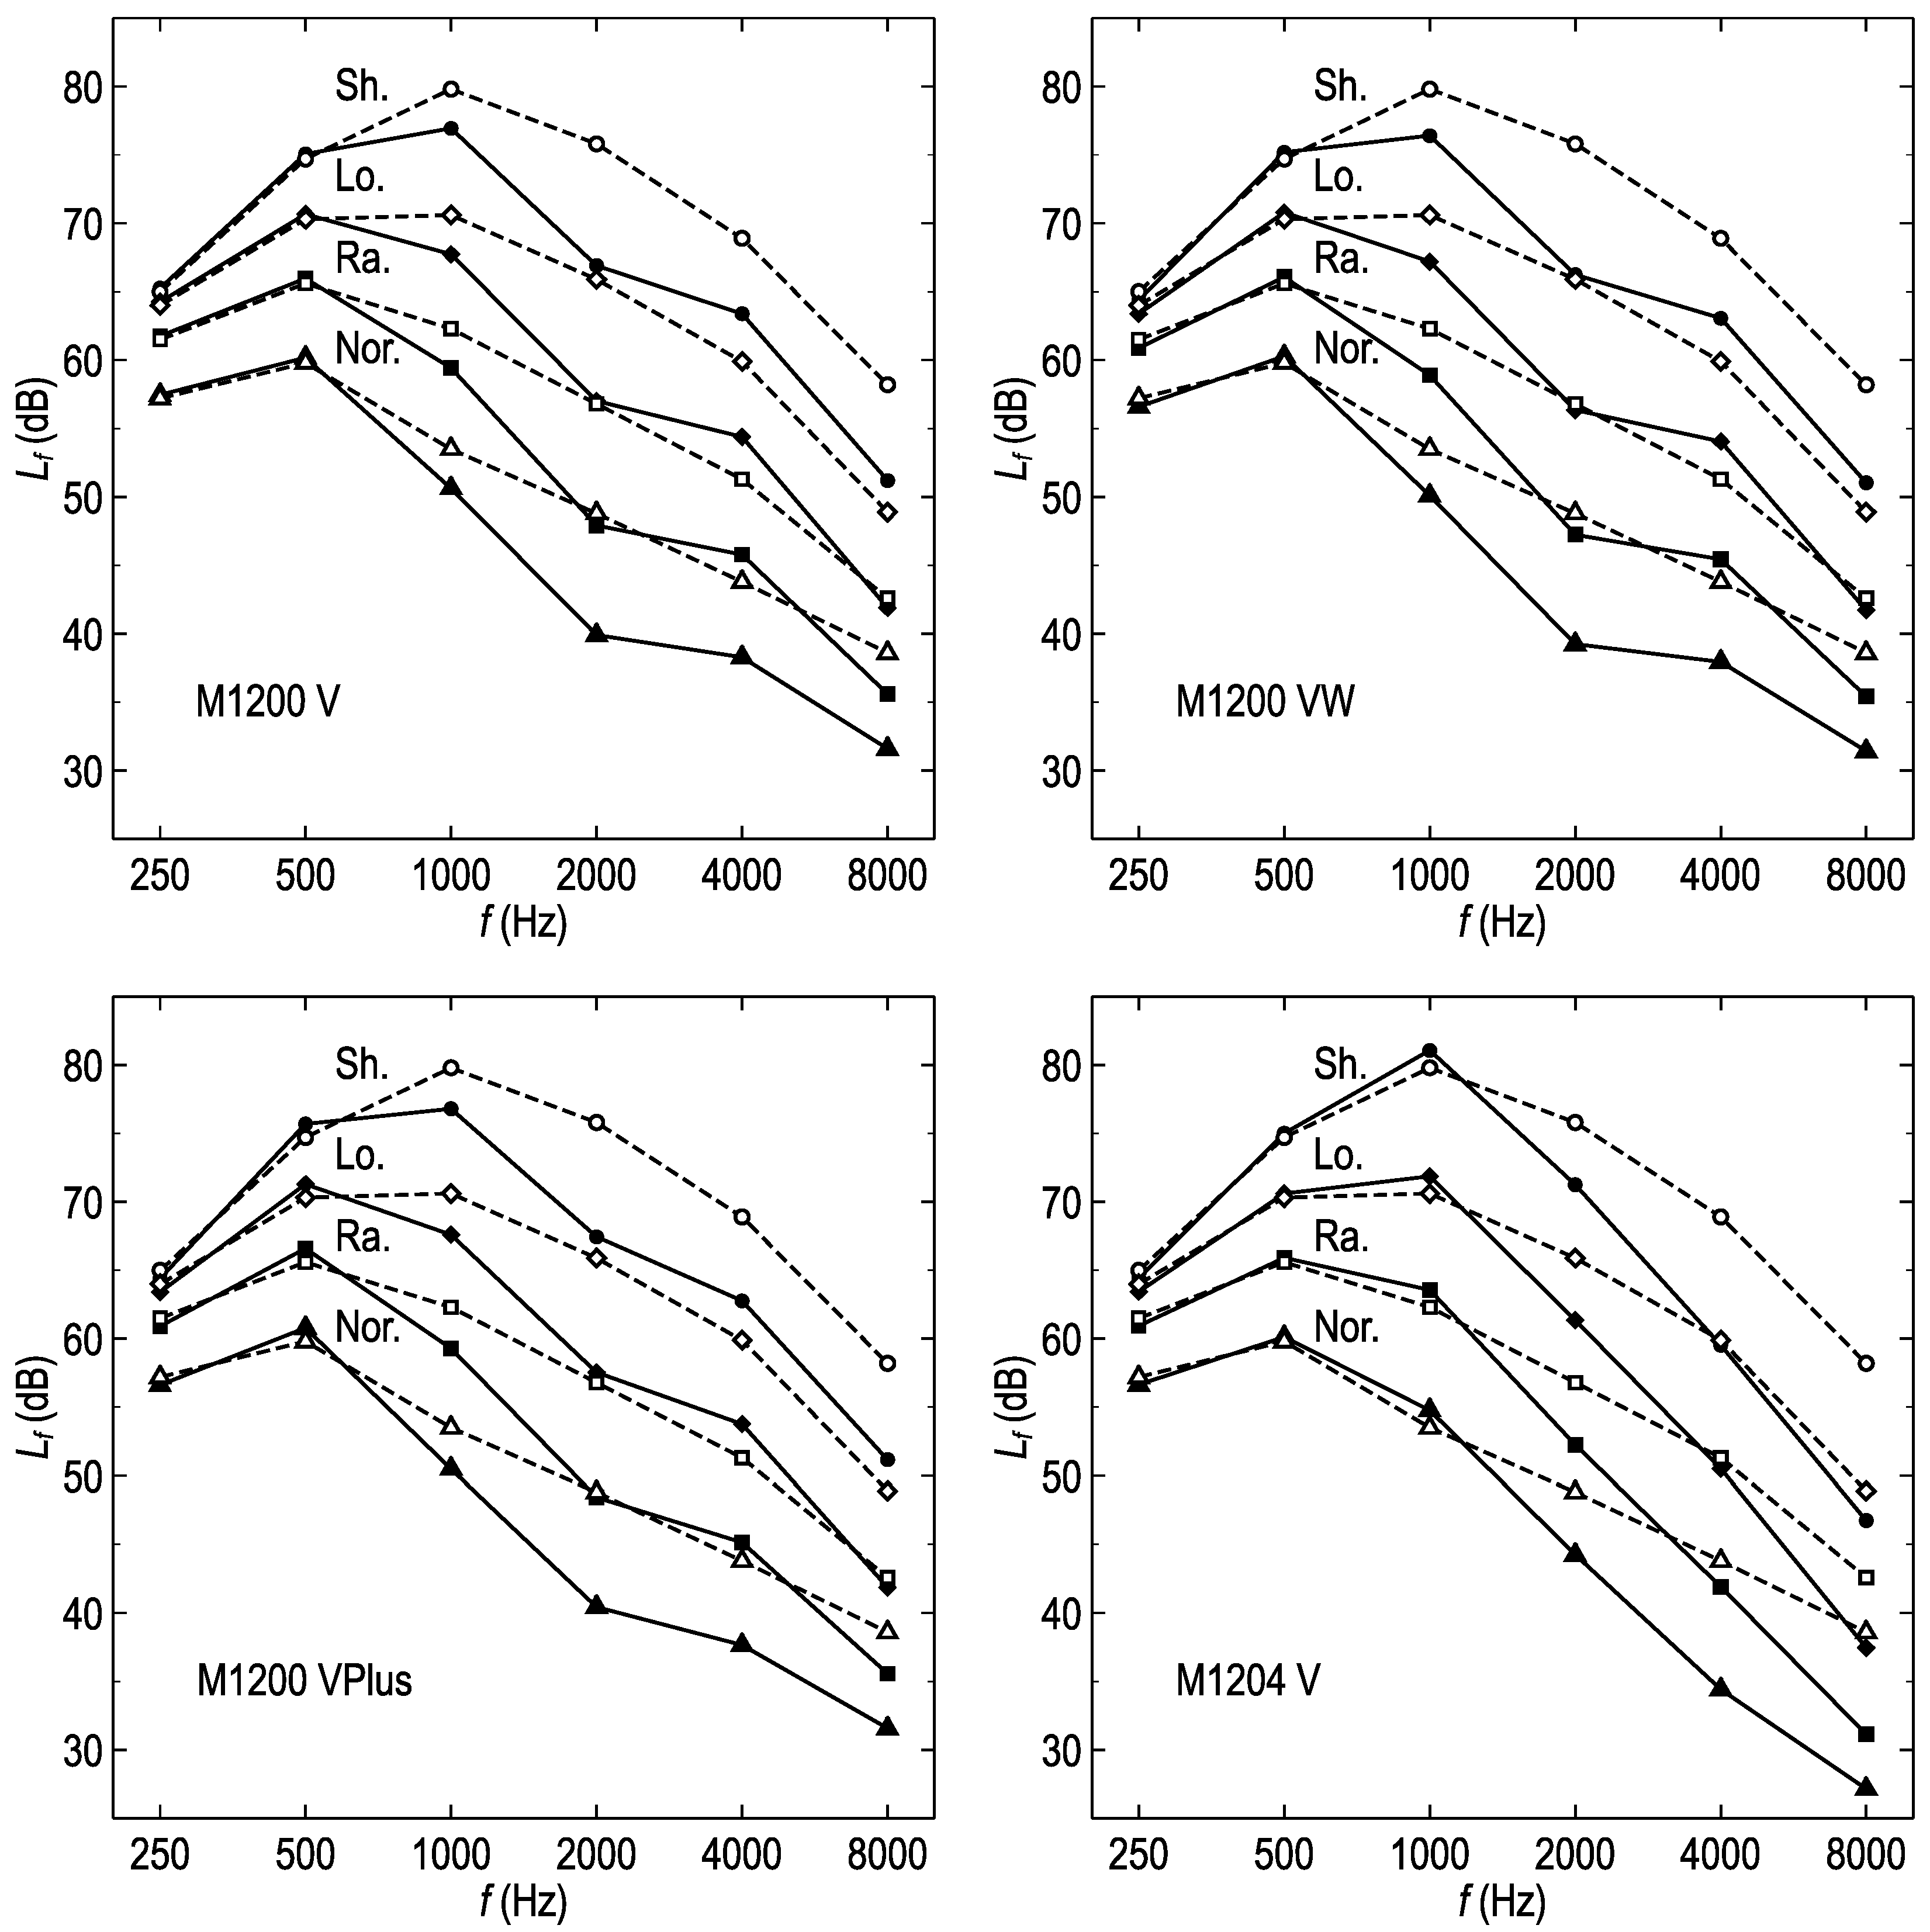
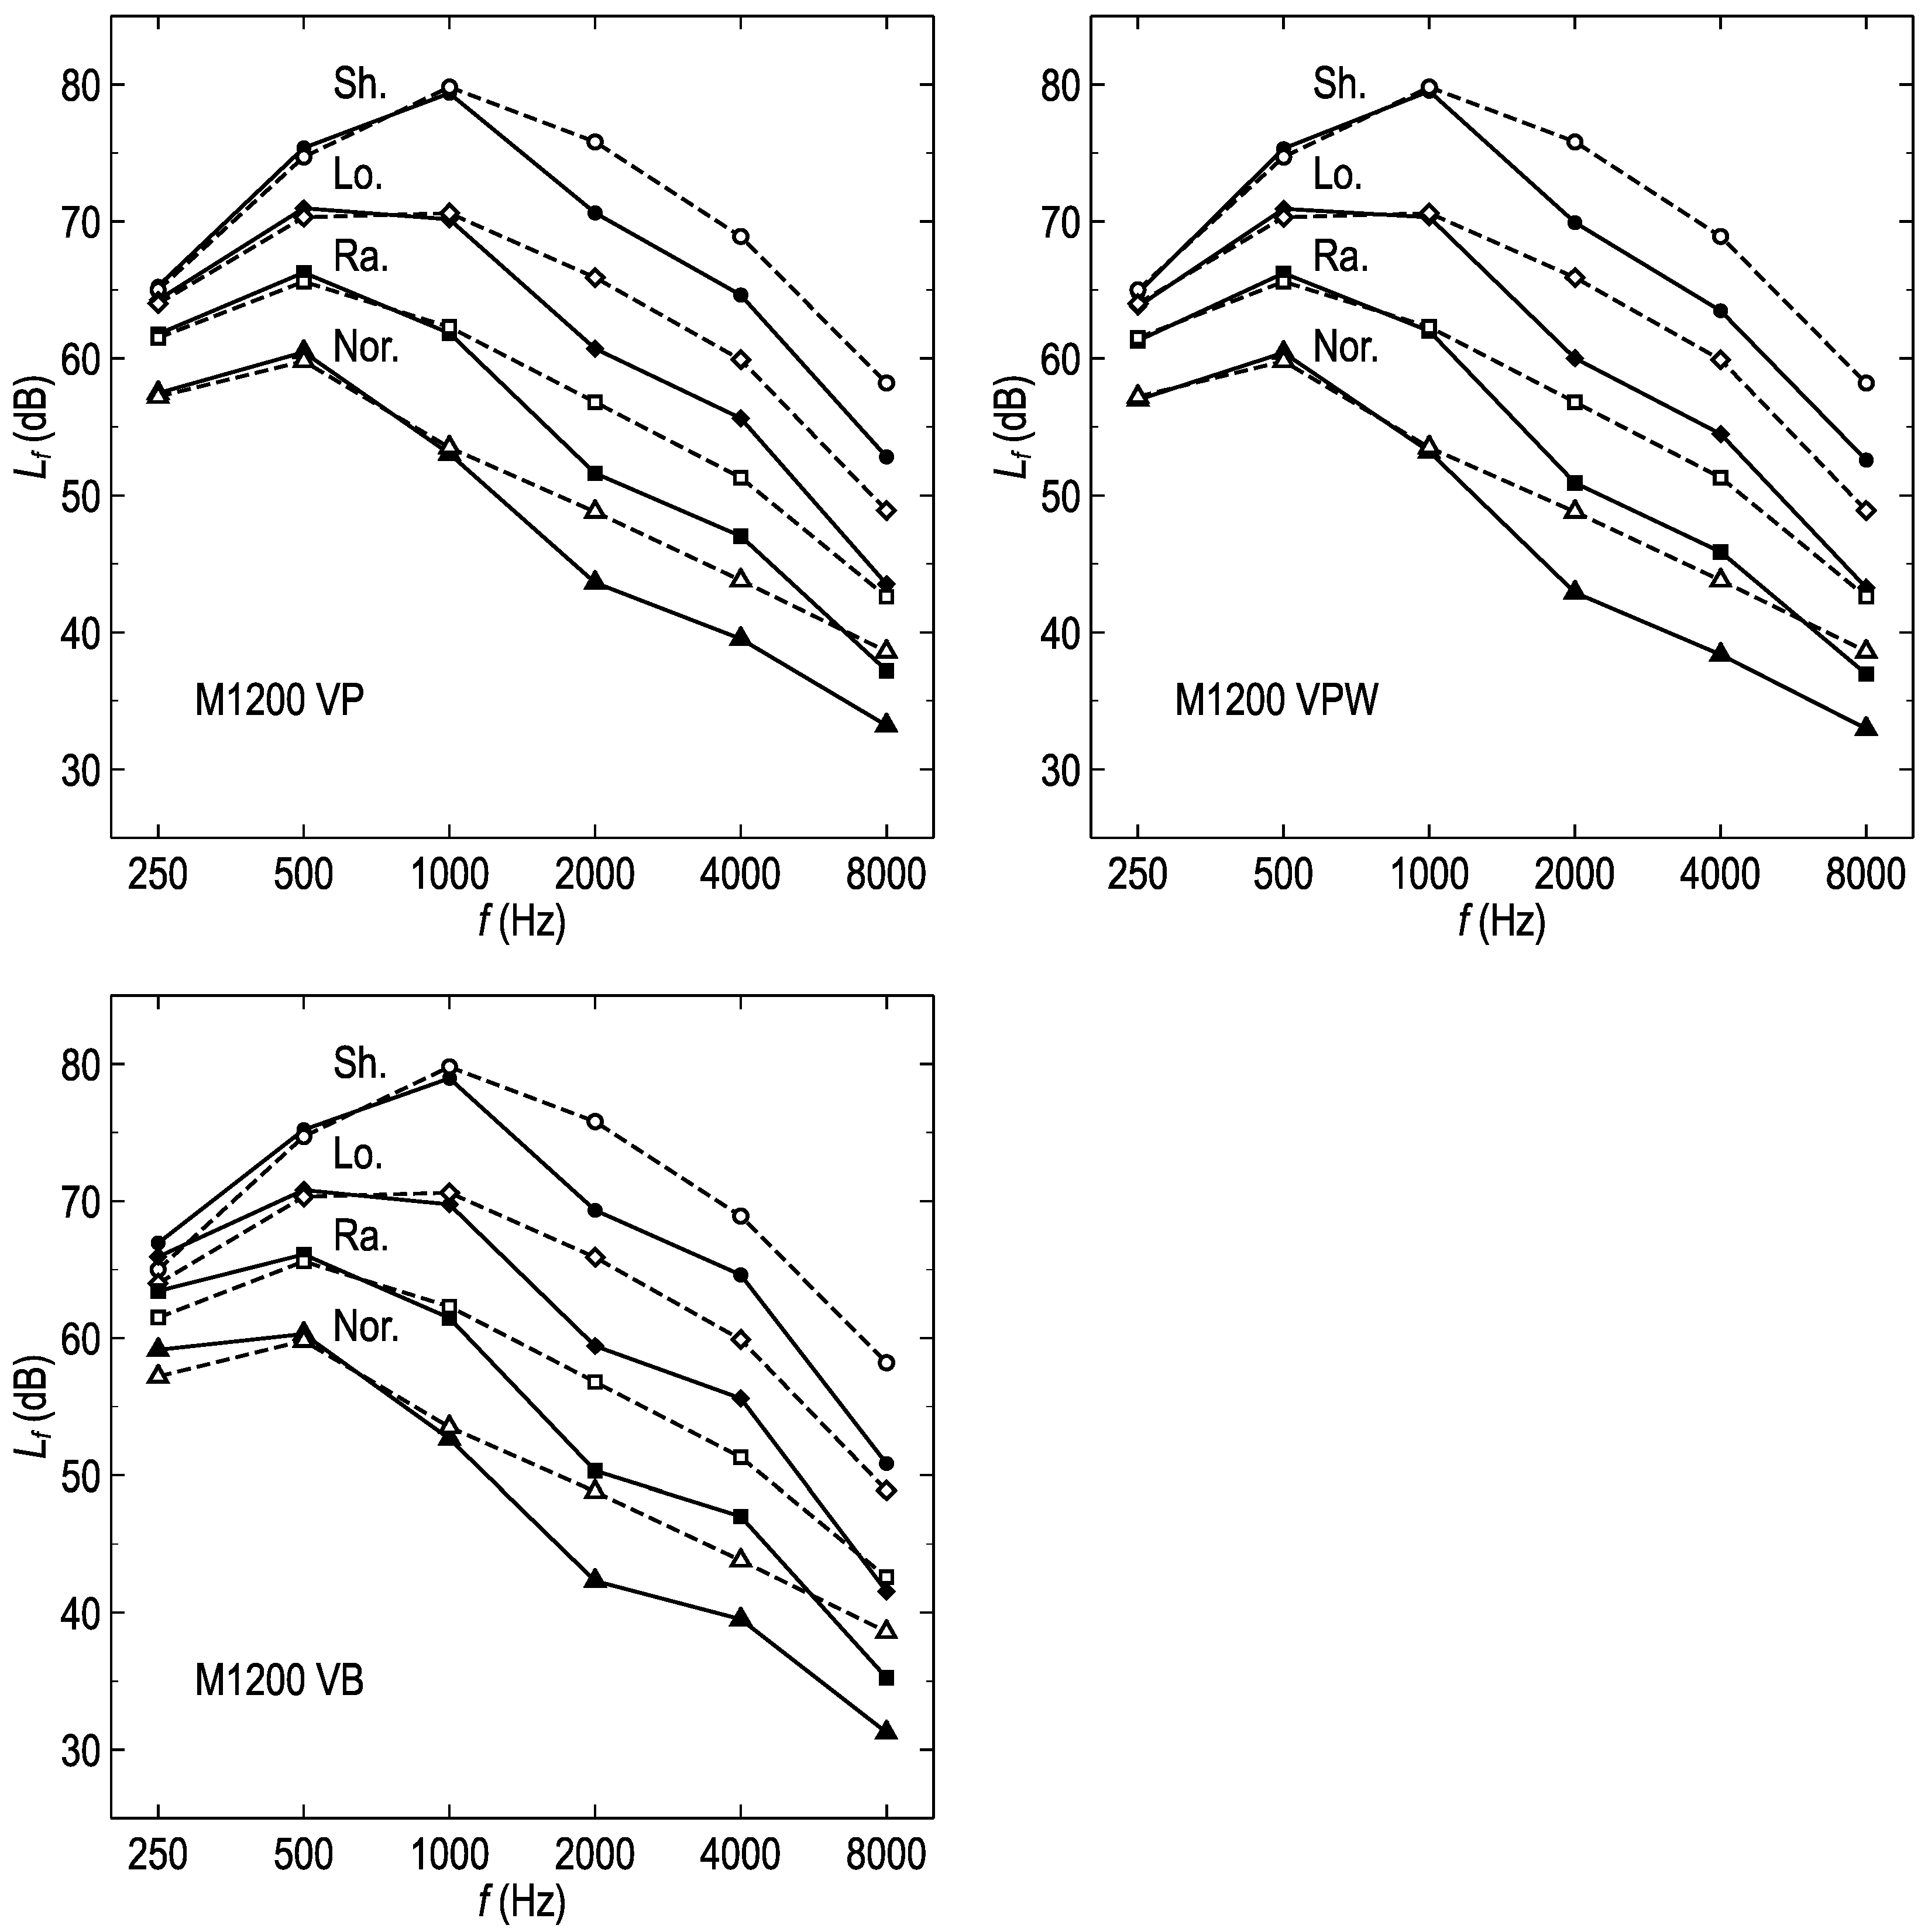
3.1. Measured Sound Pressure Levels and Attenuation

The measured SPLs in 1/3 octave-wide bands, Lf, are reported in the Supplementary Materials “FFP2_results.xlsm”. Ten masks of each type were examined except the M1200VPlus, five items of which were examined twice. In this manner, 70 datasets were obtained for the masks and 10 for the uncovered Talk Box speaker. Each dataset included 24 values of Lf in 1/3 octave-wide bands with centre frequency from 100 Hz to 20 kHz.
The attenuation of sound by an FFP in the band of centre frequency f was calculated from the following equation:
Δ L f = L f   no   FFP L f   with   the   FFP
where Lf were the median values of the SPLs averaged for a 10-s-long measurement time. The averages were calculated conventionally from the root mean squares of the sound pressures. The calculation details and the uncertainty estimation were discussed in the next section. The ΔLf values for the bands with centre frequencies from 800 Hz to 20 kHz are reported in Table 2, Table 3 and Table 4 and Figure 1 and Figure 2. All the FFPs did not attenuate sound waves of lower frequencies.

3.2. Uncertainties in the Measurements and Calculations

A fundamental question was which statistical characteristics approximate the expected value and uncertainty of Lf and the total combined uncertainty of ΔLf.
We applied the Shapiro–Wilk test to check whether the Lf values were normally distributed for each FFP and frequency combination [15]. The normal distribution hypothesis could not be rejected in 164 out of 192 cases, i.e., for 85% of the datasets in the centre frequency range 100–20 kHz at the significance level p < 0.05. Lf in 86 out of 96 datasets for the f range from 800 Hz to 10 kHz, i.e., 89%, showed normal distribution. However, we decided to reject the normal distribution model for the sake of consistency in calculations. We noticed that the Lf values were normally distributed in only five out of 24 frequency bands for all measurement series, with and without FFPs. Consequently, the attenuations ΔLf and their uncertainties estimated from the arithmetic means, and variances could be compared for five bands only, these with centre frequencies of 315, 630, 2000, 5000, and 12,500 Hz. Thus, we used medians and ranges rather than arithmetic means and standard deviations as characteristics of the variables’ distributions. In the vast majority of cases, the medians and means: arithmetic, geometric and harmonic, were equal within the limits of ±0.1 dB. The difference never exceeded the limits for the class 1 sound meter. The latter is ±1.1 dB for f = 1 kHz and is higher for other frequencies [13].
The ranges of Lf (no FFP) values were close to the measurement uncertainty limits for the class 1 sound meter. The largest range of Lf (no FFP) was 2.0 dB for the 1/3 octave-wide band with the centre frequency of 250 Hz, while that for L1kHz (no FFP) was 1.5 dB. Contrary to the Lf ranges for the uncovered TalkBox speaker, those of the Lf (with the FFP) significantly exceeded the sound meter uncertainty limits.
According to the classical calculus of errors, the maximum error of ΔLf is the sum of the maximum errors of Lf (no FFP) and Lf (with the FFP) in Equation (1):
ε Δ L f = ε L f no   FFP + ε L f with   the   FFP
The measurement errors seldom add up in this most unfavourable manner [16]. Moreover, the errors are symmetric in this approach. In our measurements, the median value usually did not lie in the middle of the minimum–maximum value range. Thus, the asymmetric errors approach seemed a better choice for uncertainty estimation. The lower and upper limits of the ΔLf value, (ΔLf)low and (ΔLf)upp, were calculated from Equation (1) in the following way:
Δ L f low = min L f no   FFP max L f with   the   FFP
and
Δ L f upp = max L f no   FFP min L f with   the   FFP
where “min” and “max” denote the minimum and maximum values in the series of ten measured sound pressure levels in the 1/3 octave-wide band.

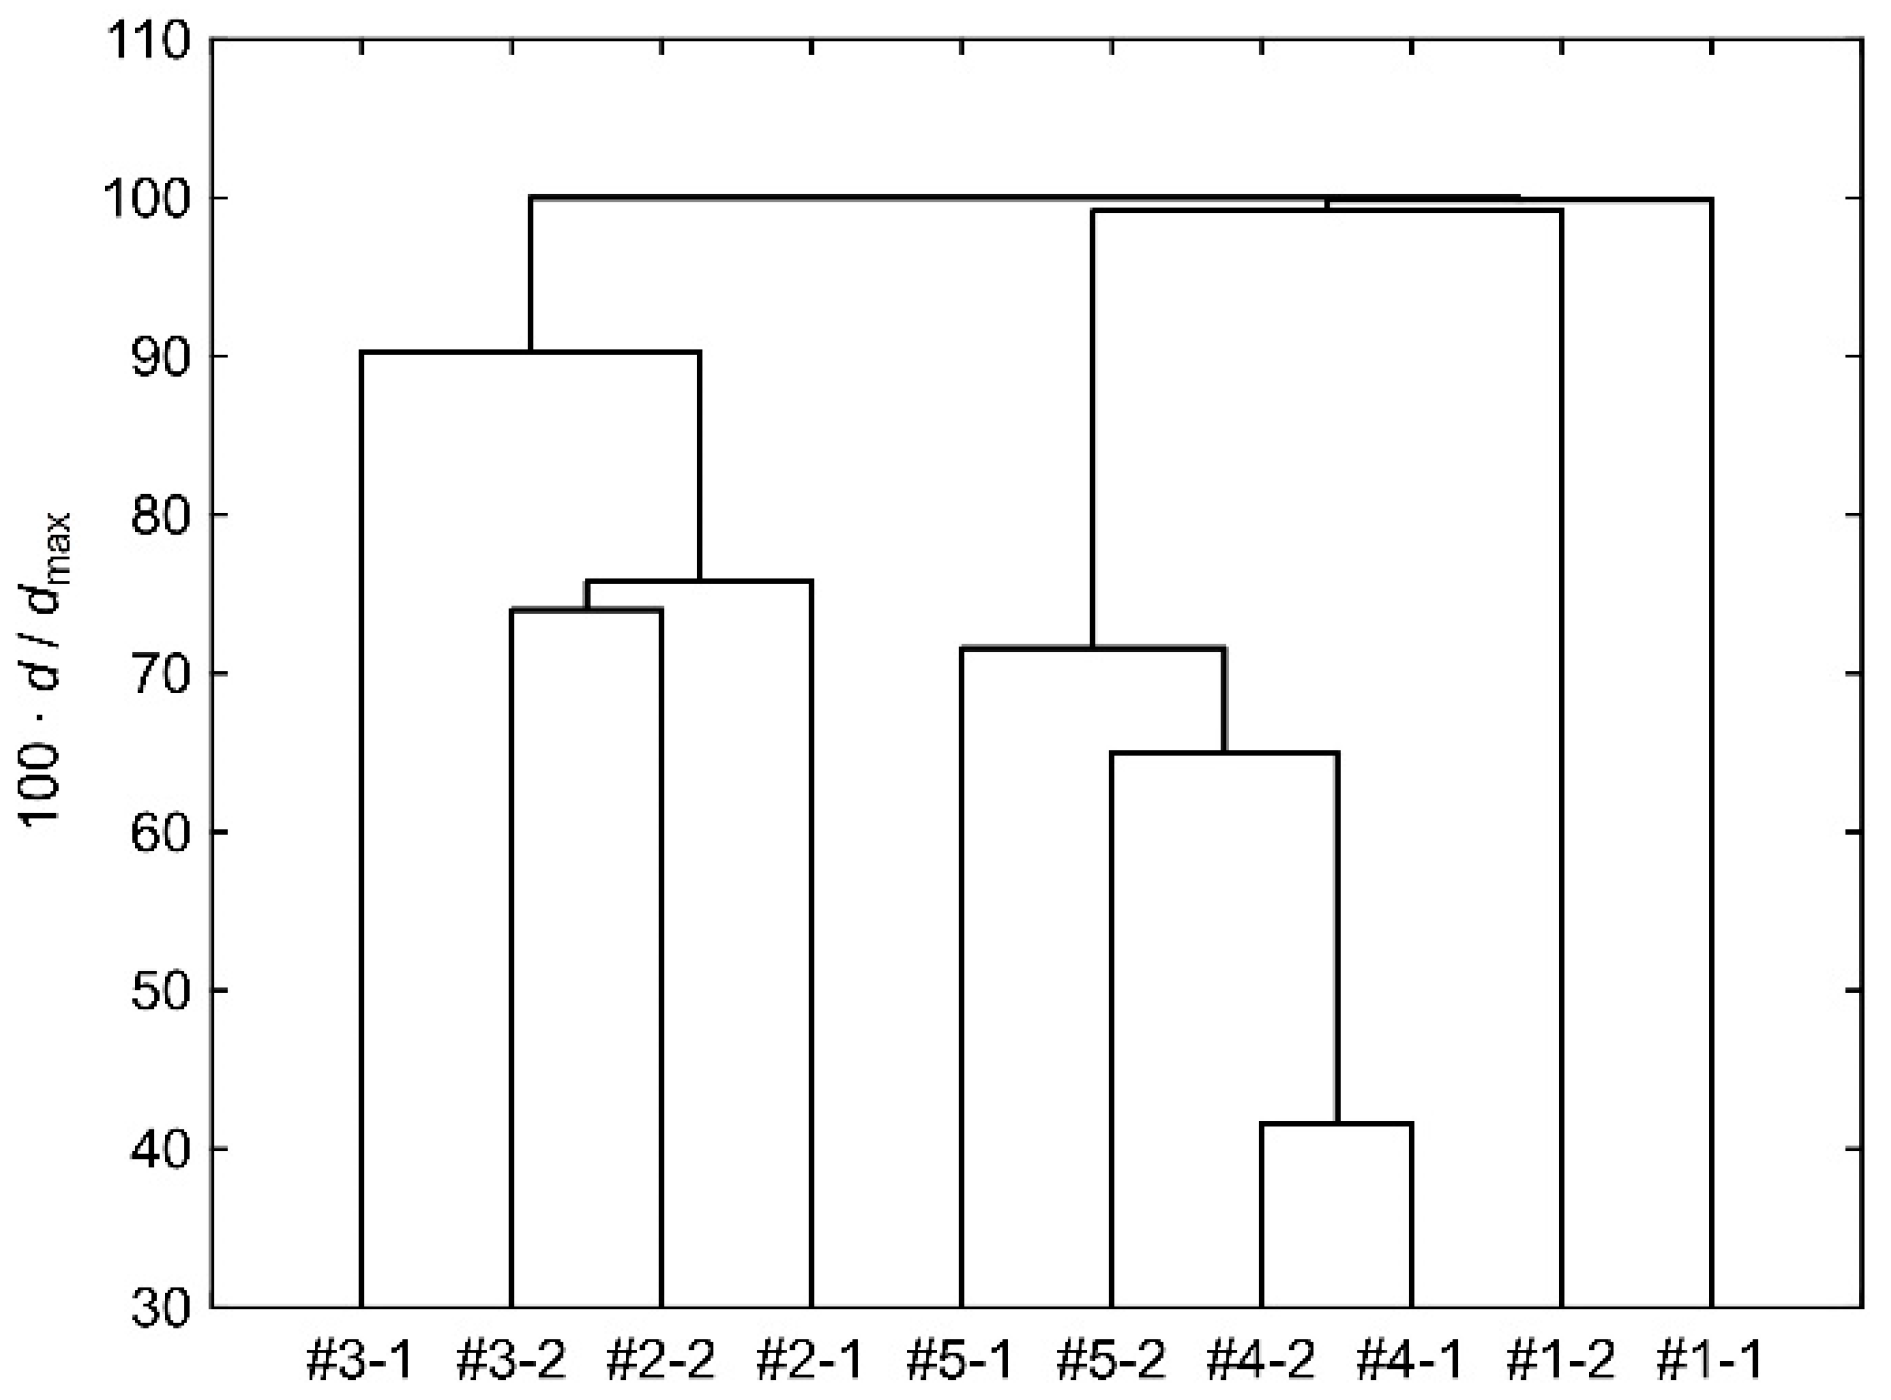
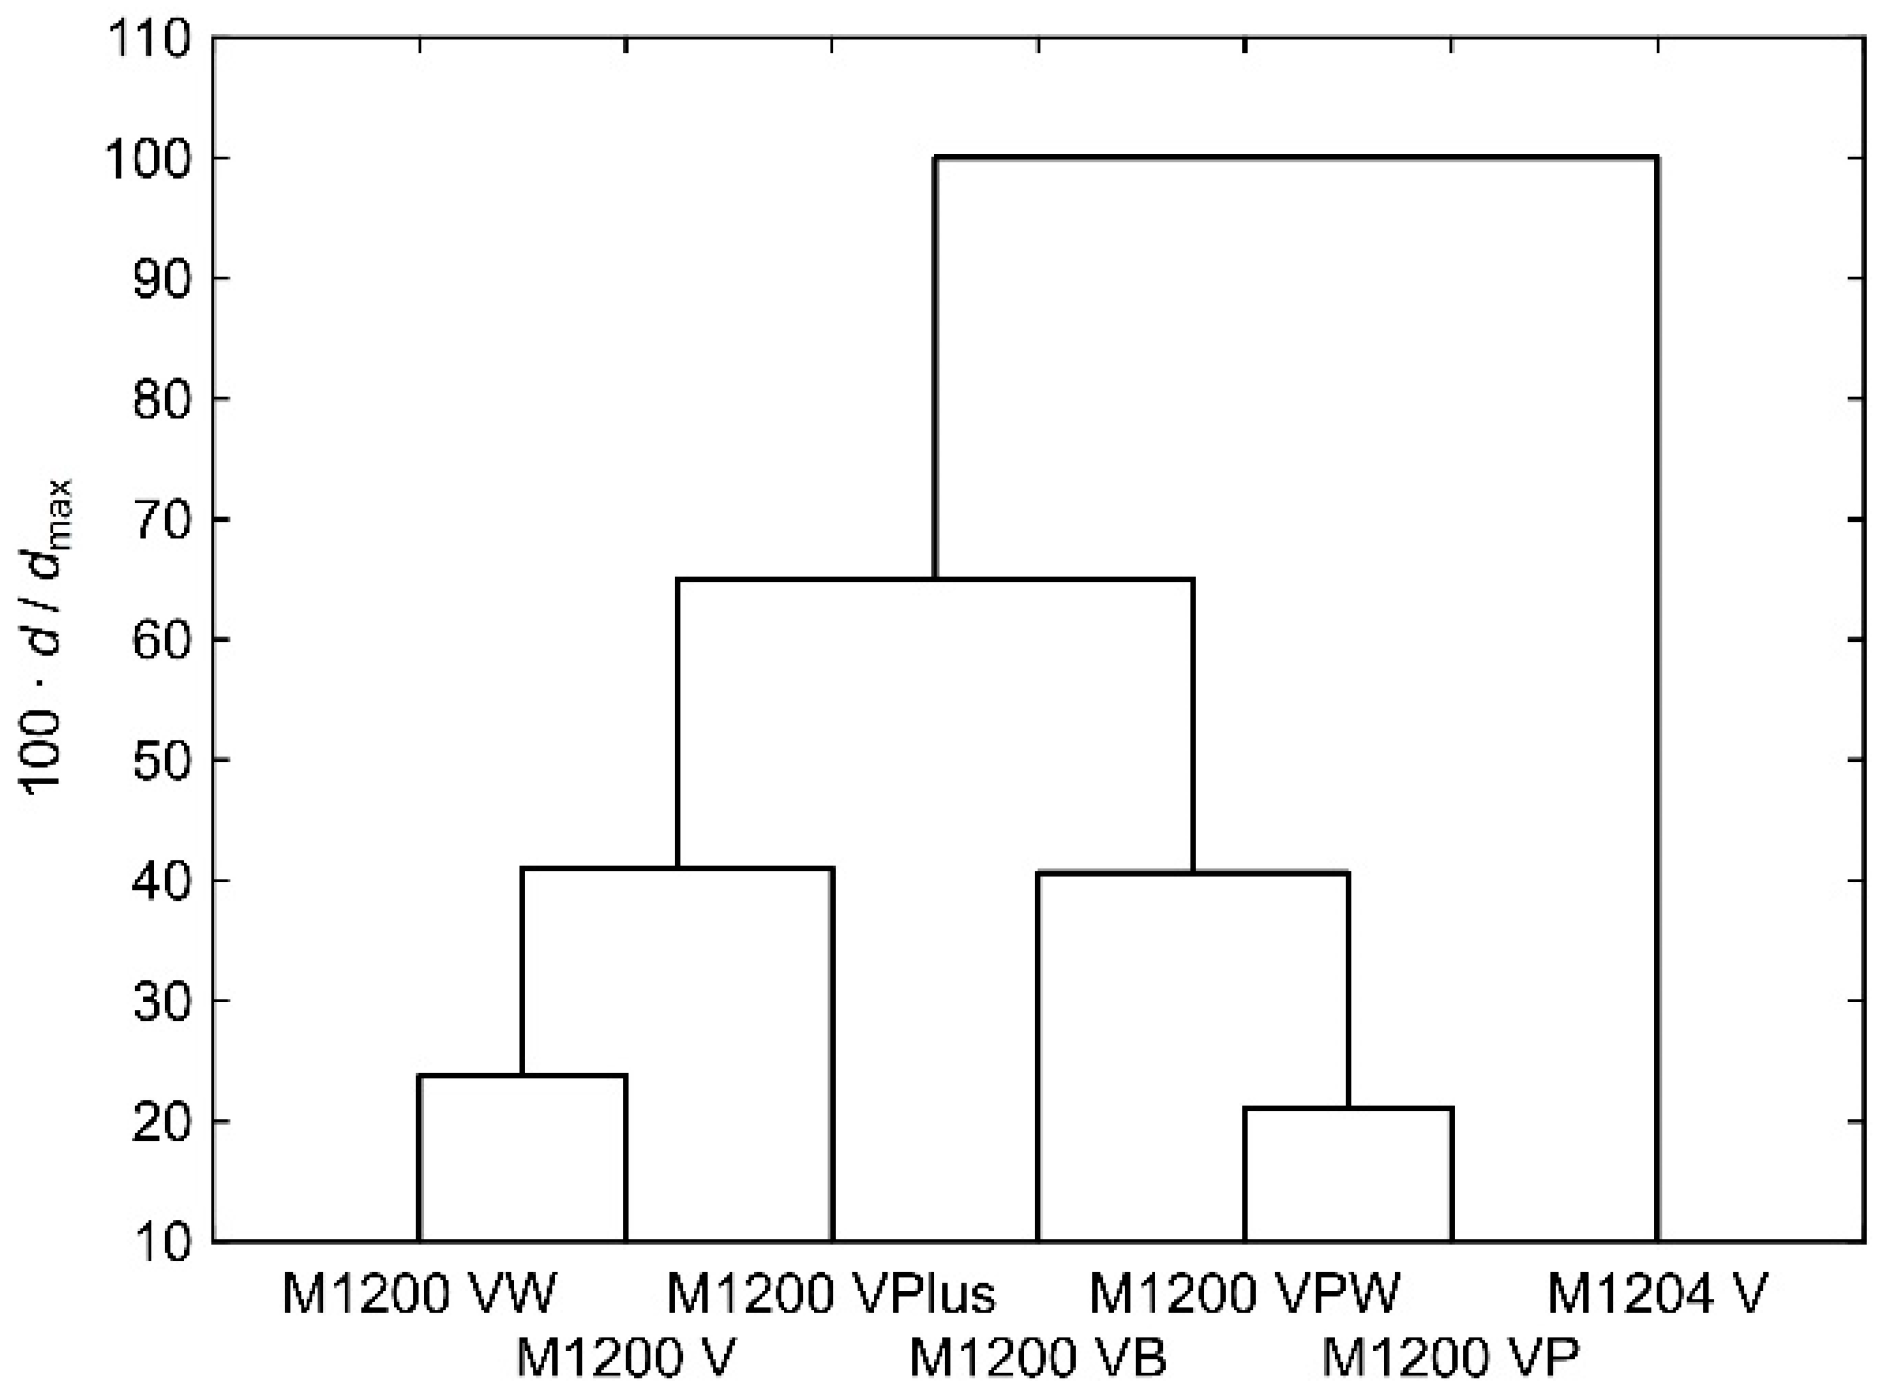
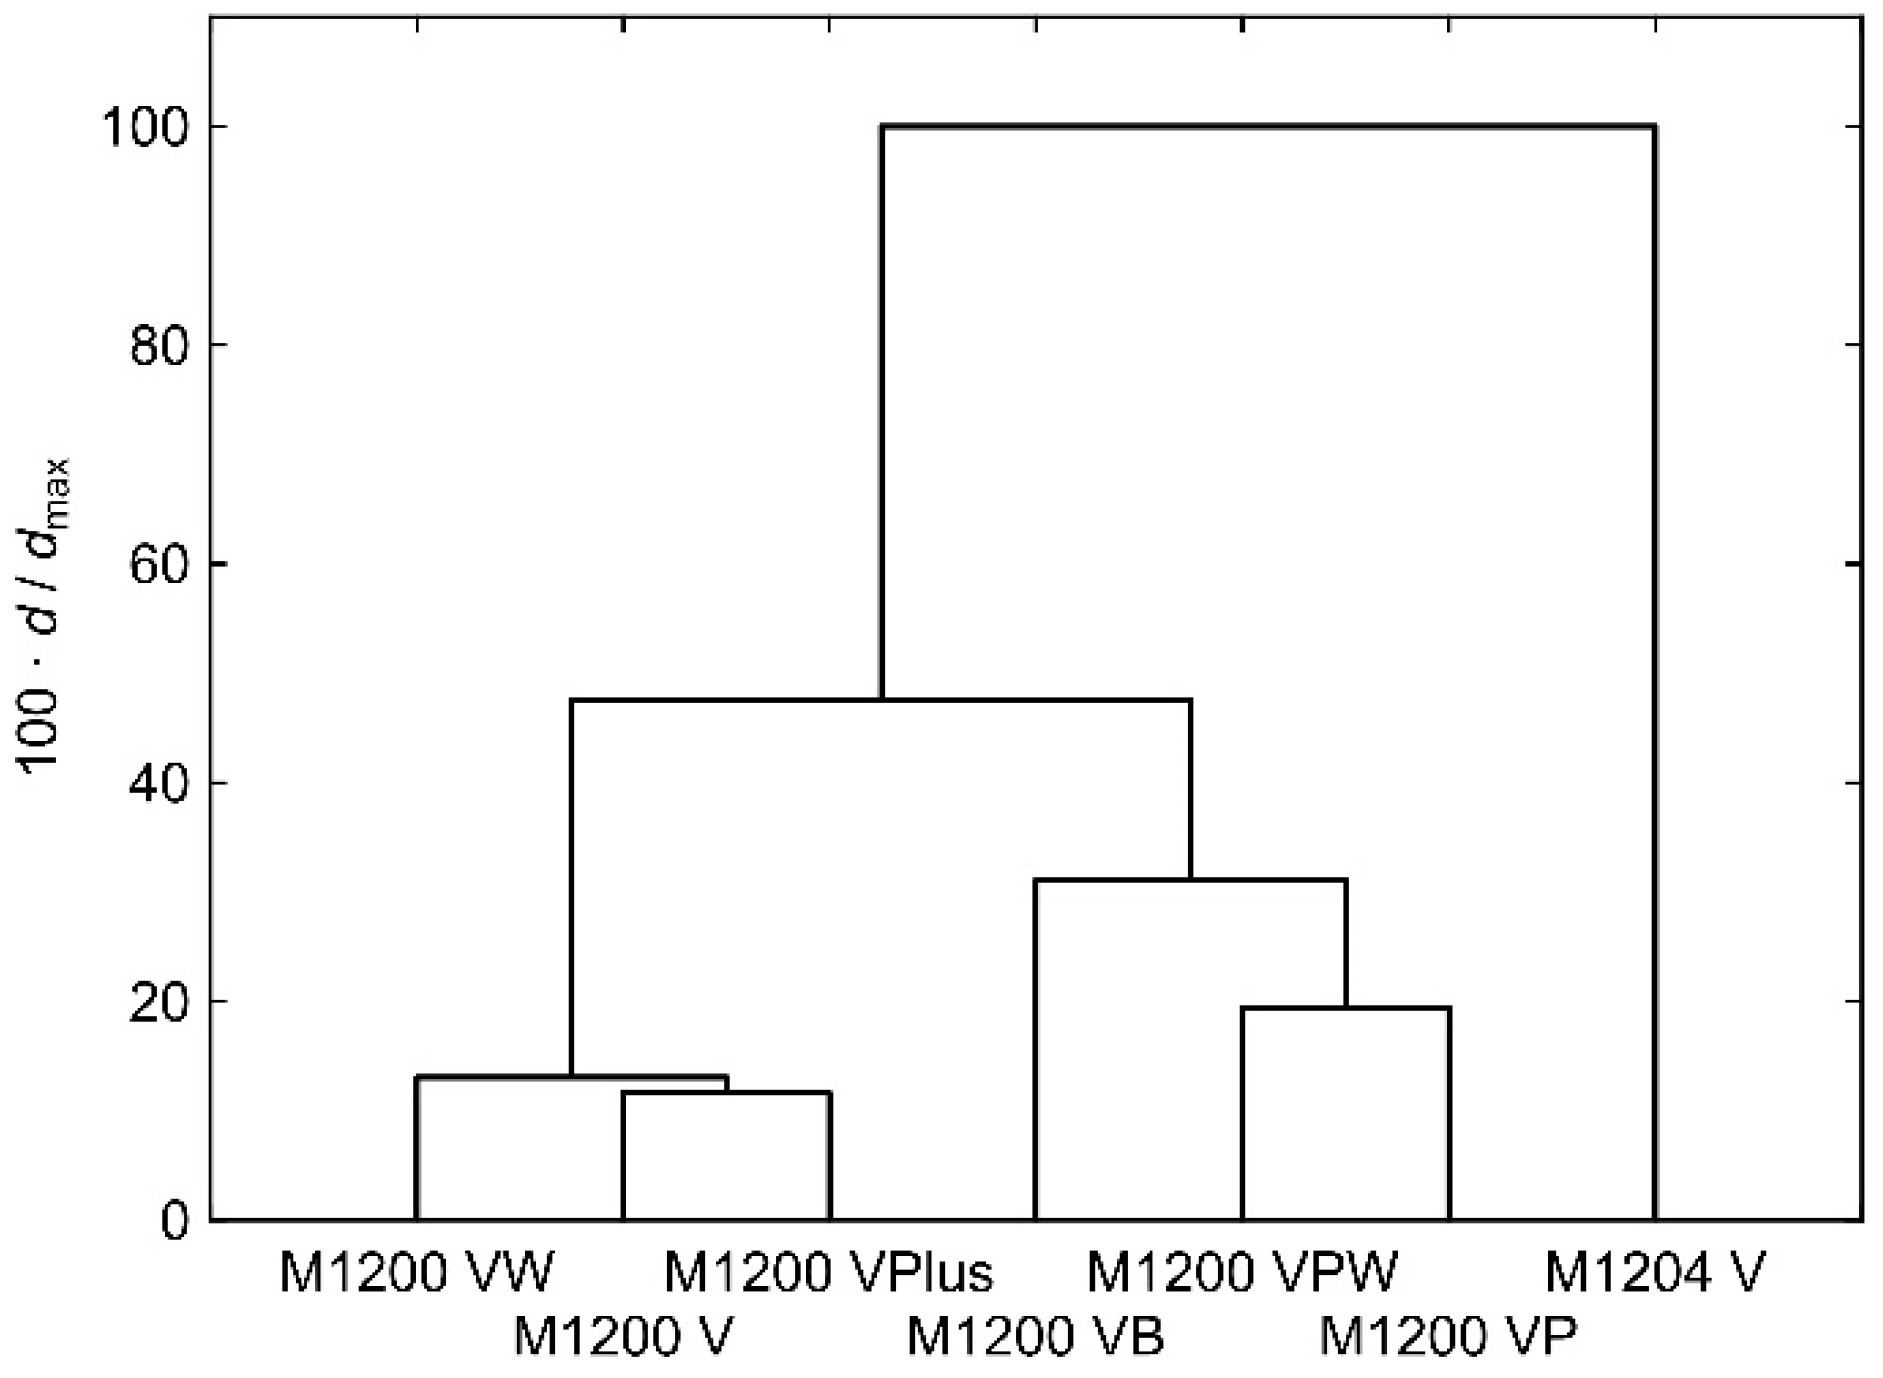
3.3. Consistency Test

The measurements for five M1200 VPlus masks were performed twice to check the results’ consistency. The FFPs did not attenuate low-frequency sound waves. For this reason, each dataset was reduced to 15 values of ΔLf in the 1/3 octave-wide frequency bands with centre frequency from the range 800–20 kHz. For quantitative determination of the distances between the datasets, we applied the cluster analysis module implemented in the Statistica software [15]. The Euclidean distance was defined by the following formula:
d = f Δ L f , 1 Δ L f , 2 2
where 1 and 2 denote two datasets. The cluster analysis evidenced that the Euclidean distances between two datasets for the same mask and those for two masks are close to one another. It is illustrated by the numbers reported in Table 5 and a hierarchical tree plotted in Figure 3. Note that distances d for a given pair of compared objects are the same for the ΔLf and Lf datasets. That is because the minuends in Equation (1) are the same for a given frequency band for all datasets.
The test results suggested that particular specimens of M1200 VPlus FFPs did not differ significantly from one another. Therefore, we decided to study ten specimens of each remaining FFP type rather than five twice. This approach proved to be correct, as was evidenced by the measured attenuation uncertainties reported in Table 2, Table 3 and Table 4. Note that the uncertainties for M1200 VPlus and the other FFPs were similar.

4. Discussion

The attenuation spectra in two FFPs pairs are similar to one another: M1200 V to M1200 VW and M1200 VP to M1200 VPW, cf. Figure 1 and Figure 2. This result evidences that modification of the filter for protection against unpleasant odours does not change the sound attenuation characteristics of the FFP. Euclidean distances d (Equation (5)) between the sets of ΔLf values quantitatively describe differences between the FFPs studied. They are reported in Table 6. The hierarchical tree plotted in Figure 4 illustrates the relative distances between the datasets. Three moulded masks, M1200 V, M1200 VW, and M1200 VPlus, make one group, while three folded ones: M1200 VP, M1200 VPW (both folded horizontally), and M1200 VB (folded vertically), make another. The moulded M1204 V stands apart from the two groups probably because of different construction. It has four foldable parts providing better fit on faces of various sizes or shapes.
In the previous paper [10], we reported speech intelligibility disrupted by FFPs. In this study, we applied the same approach based on perceived speech intelligibility. According to French and Steinberg [17], sound waves of frequency ranging from 250 to 7000 Hz transmit all the information necessary for the understanding of speech, at least in non-tonal languages. Six octave-wide bands with centre frequencies of 0.250, 0.5, 1, 2, 4, and 8 kHz fully encompass this range. Three moulded masks without elements for tighter fitting the wearer’s face suppress sound waves belonging to the octaves with a centre frequency of 1 kHz and higher. The frequency limit of suppression is 2 kHz for other FFPs. Figure 5 illustrates the differences between the masks. The band with a centre frequency of 16 kHz is not important for the understanding of speech. Thus, we compared the attenuations in four octave-wide bands with centre frequencies 1, 2, 4, and 8 kHz. The Euclidean distances between the sets of ΔLf values in octave-wide bands are reported in Table 7. The hierarchical diagram plotted in Figure 6 shows that the relative distances between the datasets within the two groups of FFPs are even shorter than those between the sets of ΔLf values in 1/3 octave-wide bands. In general, the two analyses led to the same conclusion about the FFPs’ similarity.
The moulded FFPs attenuate sound stronger than the folded ones in the whole frequency range (Figure 5). Contrary to other FFPs, they suppress waves in the octave-wide band with a centre frequency of 1 kHz. It should be noted that frequencies above 1 kHz are essential for vowels articulation [17], thus for the understanding of human speech. The difference reaches ca. 3 dB for the octave-wide band with a centre frequency of 2 kHz. French and Sternberg [18] estimated that this frequency band carries about 28% of the articulation index; thus, it is essential for the understanding of speech. For other frequency bands, the values are 18, 30, and 13% for 1 kHz, 4 kHz, and 8 kHz, respectively. The percentages were calculated from the numbers reported in Table III of French and Sternberg’s paper [18]. They slightly differ from those reported earlier [10] because of the improved calculation method.
The FFP equipped with four foldable parts for better fit, M1204 V, significantly attenuates sound waves of higher frequency. The attenuation is about 3 to 6 dB higher than those of moulded and folded masks for the octave-wide bands with centre frequencies 4 and 8 kHz, which together carry 43% of the articulation index. The calculation result confirms intuition: the tighter-fitted mask stronger suppresses waves of higher frequency. Figure 7 demonstrates the remarkable difference between the attenuation of M1204 V and the other masks in the 1/3 octave-wide bands with centre frequencies of 2 kHz and 5 kHz. M1204 V attenuates the higher-frequency band stronger than the lower-frequency one. Such a difference is much smaller for the folded vertically M1200 VB, while the opposite relation occurs for the remaining five FFPs.
Figure 8 and Figure 9 illustrate how the studied FFPs disrupt the normalized speech spectra reported in ANSI 3.5-1997 standard [11]. Doubtless, speaking persons should raise their voice by at least one “loudness level” to compensate for the attenuation by an FFP. That would cause changes in the voice timbre, which may result in a worsened understanding by the listener despite sufficient loudness. The listener’s experience could be compared to that of a person with hearing loss. The latter concerns mainly frequencies above 1 kHz [19].

5. Conclusions

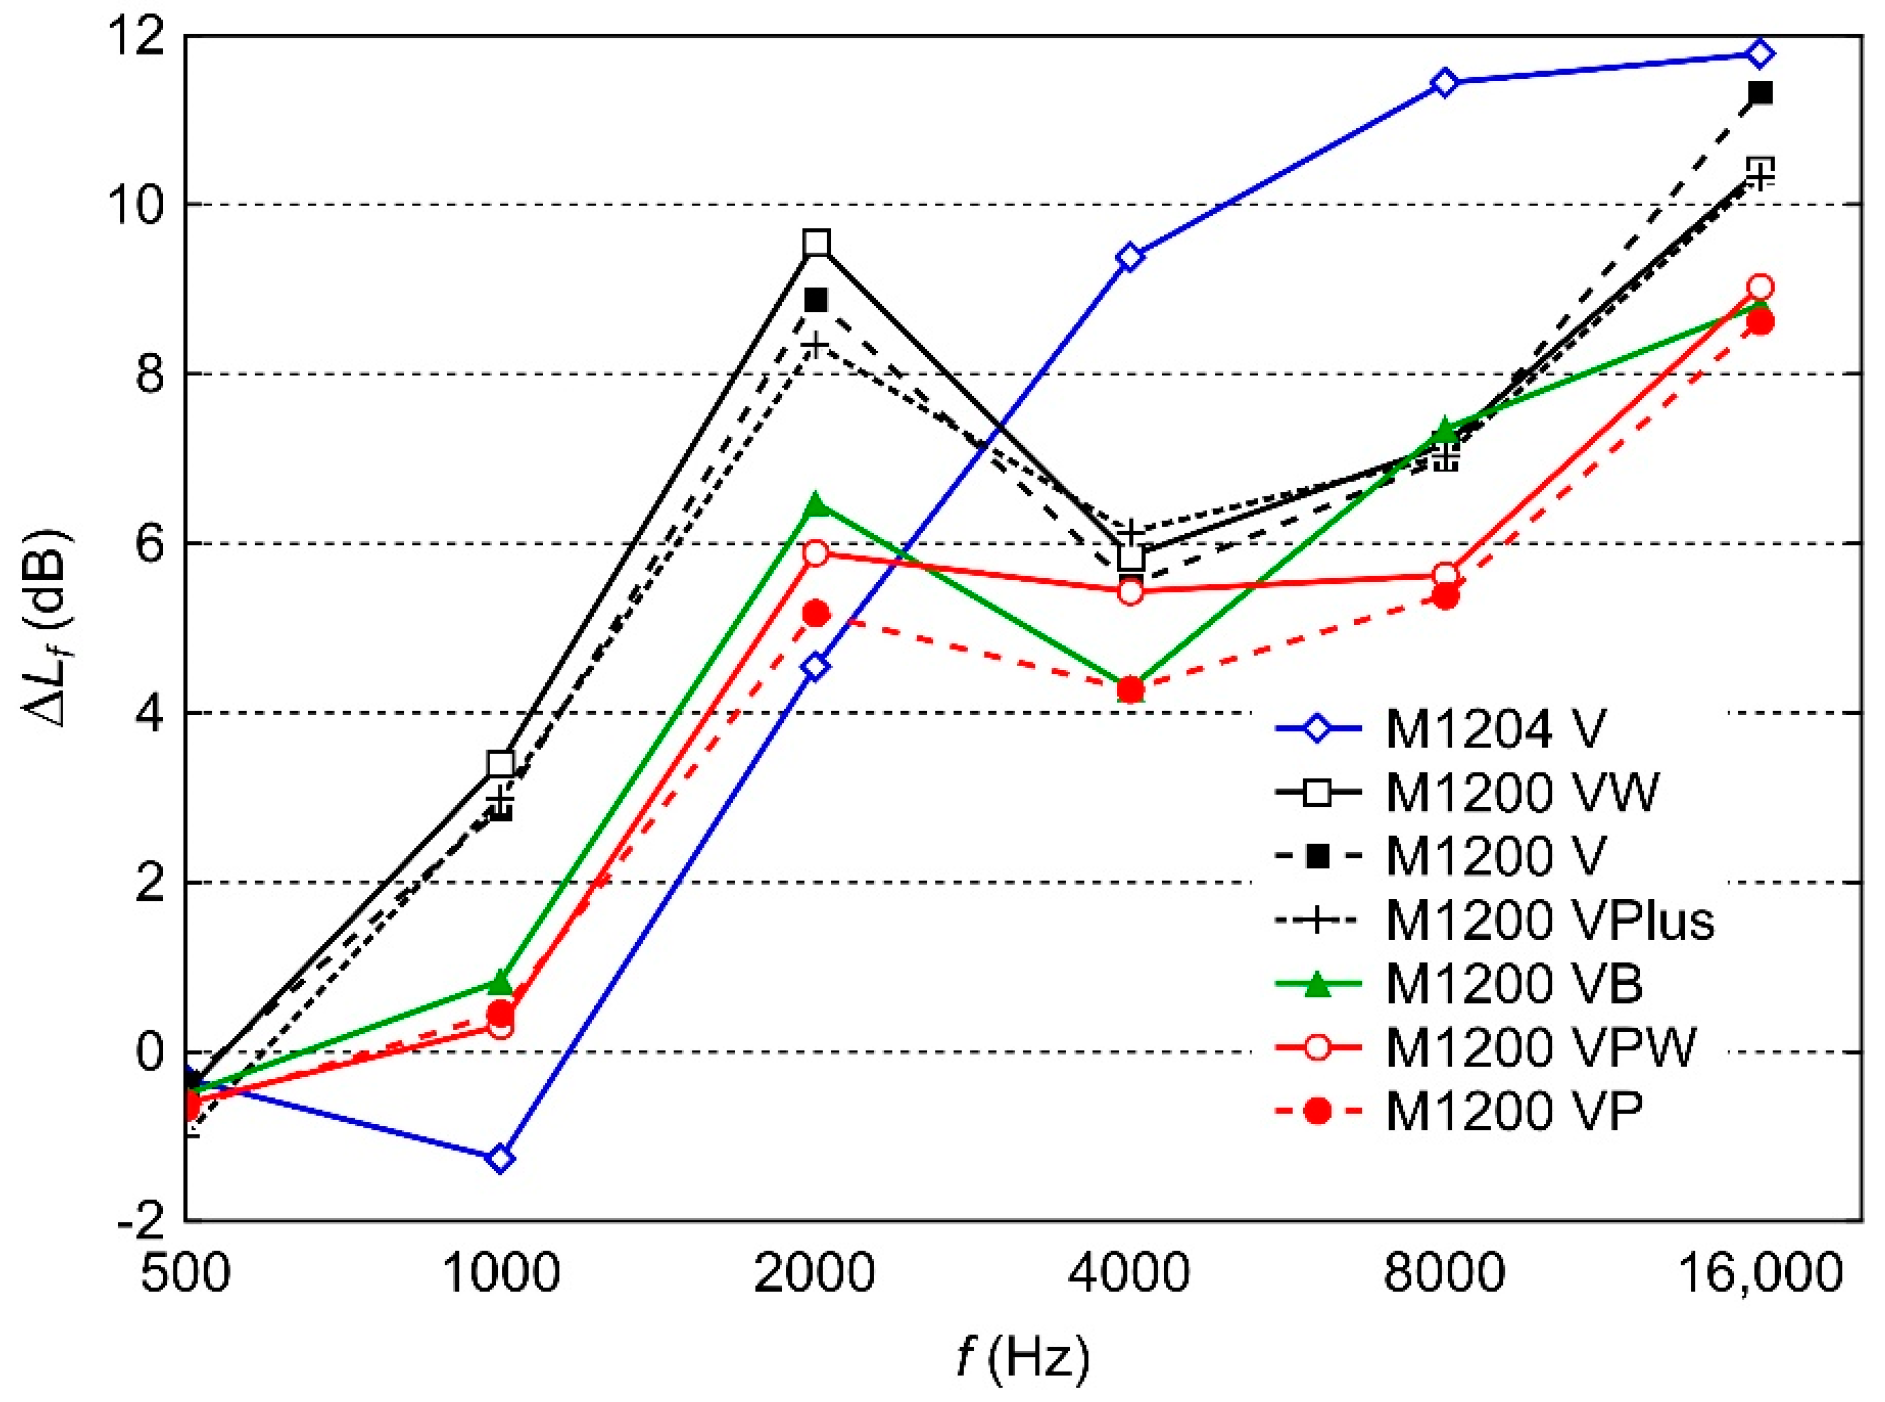
  • The results of this study are similar to those obtained previously [10]. The FFPs affected sound pressure levels in the frequency range responsible for 80–90% of the perceived speech intelligibility. The waves of frequency below 1 kHz were not attenuated.
  • Since all the FFPs studied were built of the same synthetic nonwoven fabric, the differences in the sound suppression resulted solely from the differences in the construction of the masks.
  • The moulded masks, M1200 V, M1200 VW, and M1200 VPlus, suppressed the acoustic waves stronger than the folded ones, M1200 VP, M1200 VPW, and M1200 VB, by approximately 2–3 dB in the octave bands of centre frequency from 1 to 16 kHz.
  • The exception was the moulded mask with four foldable parts for tighter fitting of the wearer’s face, M1204 V. It attenuated sound similarly as the folded masks did in the octave-wide bands with centre frequency up to 2 kHz. It suppressed waves of higher frequencies stronger than the other studied FFPs did.
  • Persons using FFPs have to raise their voices by one “loudness level”, as defined in ANSI 3.5-1997, to compensate for the loss of high-pitch tones in verbal communication.
This and previous studies [10] led to similar conclusions. The patterns of the acoustic characteristics of the masks are essentially similar to one another. The tighter-fitted masks are stronger than other ones and attenuate the high-frequency waves.
We have not considered the influence of contaminations on the acoustic characteristics of FFPs. This problem requires further studies. Such contaminations, e.g., particulate matter, are common in the work environment. Even if not attenuating sound, they would further impede the breathing of the mask wearer [20,21] and make verbal communication harder because louder speech requires more effort in inhaling the air.
This is just the second report of the studies performed with our method. Probably, the measurement procedure could be refined and simplified. Parallel studies of speech deterioration predicted by this objective method and the changes in legibility perceived by humans would be helpful to this purpose.
Disturbed verbal communication at workplaces may cause danger and even result in accidents. For this reason, occupational safety and health services should be aware of the impact of FFPs on speech intelligibility. However, this question is commonly not recognized as there are no legal regulations on this subject. Our method is sufficiently simple to be widely used in practice, contrary to the methods that require large groups of speakers and listeners. By applying it, manufacturers would collect information necessary for providing their customers with knowledge about this aspect of FFP use.

Supplementary Materials

The following supporting information can be downloaded at https://www.mdpi.com/article/10.3390/app13158644/s1, “FFP2_results.xlsm”. The file contains VBA code which can be misinterpreted as a virus thread by antivirus software. We suggest disregarding this and opening the file with macros.

Author Contributions

Conceptualization, K.N. and K.Ł.; methodology, K.N., W.M. and K.Ł.; investigation, K.N. and W.M.; data curation, K.N. and K.Ł.; writing—original draft preparation, K.N. and W.M.; calculations, K.N., W.M. and L.A.; visualization, K.N., W.M. and L.A. All authors have read and agreed to the published version of the manuscript.

Funding

Silesian University of Technology (Faculty of Materials Engineering) supported this work as a part of Statutory Research BK-218/RM1/2023 (11/010/BK_23/0045).

Institutional Review Board Statement

Not applicable.

Informed Consent Statement

Not applicable.

Data Availability Statement

Acknowledgments

The authors are grateful to Adam Krzycki and Zbigniew Gach and Delta Plus Polska Sp. z o.o. for support during the research.

Conflicts of Interest

The authors declare no conflict of interest.

References

  1. Sun, C.; Thelen, C.; Sanz, I.S.; Wittmann, A. Evaluation of a new workplace protection factor–measuring method for filtering facepiece respirator. Saf. Health Work 2020, 11, 61–70. [Google Scholar] [CrossRef]
  2. Bertoli, S.; Leone, A.; De Amicis, R.; Foppiani, A.; Osio, D.; Battezzati, A. Effects of wearing a FFP2 mask on indirect calorimetry measurements: A pilot study. Clin. Nutr. ESPEN 2021, 41, 443–446. [Google Scholar] [PubMed]
  3. Wang, A.B.; Zhang, X.; Gao, L.J.; Zhang, T.; Xu, H.J.; Bi, Y.J. A review of filtration performance of protective masks. Int. J. Environ. Res. Public Health 2023, 20, 2346. [Google Scholar] [PubMed]
  4. EN 149:2001+A1:2009 (E); Respiratory Protective Devices—Filtering Half Masks to Protect against Particles—Requirements, Testing, Marking. European Committee for Standardization (CEN): Brussels, Belgium, 2009.
  5. Brotto, D.; Sorrentino, F.; Agostinelli, A.; Lovo, E.; Montino, S.; Trevisi, P.; Favaretto, N.; Bovo, R.; Martini, A. How great is the negative impact of masking and social distancing and how can we enhance communication skills in the elderly people? Aging Clin. Exp. Res. 2021, 33, 1157–1161. [Google Scholar] [CrossRef] [PubMed]
  6. Cohn, M.; Pycha, A.; Zellou, G. Intelligibility of face-masked speech depends on speaking style: Comparing casual, clear, and emotional speech. Cognition 2021, 210, 104570. [Google Scholar] [PubMed]
  7. Caniato, M.; Marzi, A.; Gasparella, A. How much COVID-19 face protections influence speech intelligibility in classrooms? Appl. Acoust. 2021, 178, 108051. [Google Scholar] [PubMed]
  8. Bandaru, S.; Augustine, A.; Lepcha, A.; Sebastian, S.; Gowri, M.; Philip, A.; Mammen, M. The effects of N95 mask and face shield on speech perception among healthcare workers in the coronavirus disease 2019 pandemic scenario. J. Laryngol. Otol. 2020, 134, 895–898. [Google Scholar]
  9. Ho, G.Y.; Kansy, I.K.; Klavacs, K.A.; Leonhard, M.; Schneider-Stickler, B. Effect of FFP2/3 masks on voice range profile measurement and voice acoustics in routine voice diagnostics. Folia Phoniatr. Logop. 2022, 74, 335–344. [Google Scholar] [CrossRef] [PubMed]
  10. Nowacki, K.; Łakomy, K.; Marczak, W. Speech Impaired by Half Masks Used for the Respiratory Tract Protection. Int. J. Environ. Res. Public Health 2022, 19, 7012. [Google Scholar] [CrossRef]
  11. ANSI 3.5-1997; Methods for Calculation of the Speech Intelligibility Index. American National Standard: New York, NY, USA, 1997.
  12. Available online: https://www.deltaplus.eu/en/respiratory-protection (accessed on 24 January 2023).
  13. IEC 61672-1; Electroacoustics—Sound Level Meters—Part 1: Specifications. International Electrotechnical Commission: Geneva, Switzerland, 2013.
  14. IEC 60942; Electroacoustics—Sound Calibrators. International Electrotechnical Commission: Geneva, Switzerland, 2017.
  15. Statistica (Data Analysis Software System), Version 13; TIBCO Software Inc.: Palo Alto, CA, USA, 2017. Available online: http://statistica.io(accessed on 1 March 2023).
  16. Czermiński, J.; Iwasiewicz, A.; Paszek, Z.; Sikorski, A. Statistical Methods in Applied Chemistry; PWN: Warszawa, Poland; Elsevier: Amsterdam, The Netherlands, 1990. [Google Scholar]
  17. Xue, Y.; Marxen, M.; Akagi, M.; Birkholz, P. Acoustic and articulatory analysis and synthesis of shouted vowels. Comput. Speech Lang. 2021, 66, 101156. [Google Scholar]
  18. French, N.R.; Steinberg, J.C. Factors governing the intelligibility of speech sounds. J. Acoust. Soc. Am. 1947, 19, 90–119. [Google Scholar] [CrossRef]
  19. Vogelzang, M.; Thiel, C.M.; Rosemann, S.; Rieger, J.W.; Ruigendijk, E. Effects of age-related hearing loss and hearing aid experience on sentence processing. Sci. Rep. 2021, 11, 5994. [Google Scholar] [CrossRef] [PubMed]
  20. Cheberyachko, S.; Cheberyachko, Y.; Naumov, M. Use of dust masks at coal enterprises. In Proceedings of the School of Under-ground Mining Location: Technical and Geoinformational Systems in Mining, Dnipropetrovsk, Ukraine, 2–8 October 2011; pp. 231–235. [Google Scholar]
  21. Choi, S.; Park, R.; Hur, N.; Kim, W. Evaluation of wearing comfort of dust masks. PLoS ONE 2020, 15, e0237848. [Google Scholar] [CrossRef] [PubMed]
Figure 1. Attenuation of sound in 1/3 octave-wide bands by moulded FFPs. Points—values calculated from Equation (1) with the medians of Lf (no FFP) and Lf (with the FFP). Error bars represent uncertainties given by Equations (3) and (4). Lines are guides for the eye only.
Applsci 13 08644 g001aApplsci 13 08644 g001b
Figure 2. Attenuation of sound in 1/3 octave-wide bands by Folded FFPs. For a detailed description, see the Figure 1 caption.
Applsci 13 08644 g002
Figure 3. A hierarchical diagram of relative distances between ten ΔLf datasets for five masks of M1200 VPlus type. The single linkage method (“nearest neighbour”) was the amalgamation rule. The datasets are identified by the names #i-j, where i and j denote mask and measurement, respectively.
Applsci 13 08644 g003
Figure 4. A hierarchical diagram of relative distances between ΔLf datasets for seven types of the FFPs studied. Each dataset contained fifteen ΔLf values for the 1/3 octave-wide bands with centre frequencies from 800 Hz to 20 kHz. The single linkage method (“nearest neighbour”) was the amalgamation rule.
Applsci 13 08644 g004
Figure 5. Attenuation of sound by the seven studied FFPs in octave-wide frequency bands. Error bars are omitted for the picture clarity; uncertainty is roughly ±1.5 dB. Lines are guides for the eye only.
Applsci 13 08644 g005
Figure 6. A hierarchical diagram of relative distances between ΔLf datasets for seven types of the FFPs studied. Each dataset contained four ΔLf values for the octave-wide bands with centre frequencies 1, 2, 4, and 8 kHz. The single linkage method (“nearest neighbour”) was the amalgamation rule.
Applsci 13 08644 g006
Figure 7. Attenuation of sound by the seven studied FFPs in 1/3 octave-wide bands with centre frequencies of 2 kHz (diagonal hatching) and 5 kHz (cross-hatching).
Applsci 13 08644 g007
Figure 8. Disruptions on the ANSI speech spectra caused by the moulded FFPs. Empty symbols—ANSI spectra, filled symbols—spectra with the FFPs corrections: L f   ANSI Δ L f . Lines are guides for the eye only. Speech levels: Nor.—normal, Ra.—raised, Lo.—loud, Sh.—shouted.
Applsci 13 08644 g008
Figure 9. Disruptions on the ANSI speech spectra caused by the folded FFPs. Empty symbols—ANSI spectra, filled symbols—spectra with the FFPs corrections: L f   ANSI Δ L f . Lines are guides for the eye only. Speech levels: Nor.—normal, Ra.—raised, Lo.—loud, Sh.—shouted.
Applsci 13 08644 g009
Table 1. Disposable half masks in this study. “W” in the mask symbol denotes “protection against unpleasant odours”.
Manufacturer’s SymbolConstructionPicture
M1200 V
M1200 VW
M1200 VPlus
MouldedApplsci 13 08644 i001
M1204 VMoulded with four foldable partsApplsci 13 08644 i002
M1200 VP
M1200 VPW
Folded horizontallyApplsci 13 08644 i003
M1200 VBFolded verticallyApplsci 13 08644 i004
Table 2. Attenuation of sound by three moulded FFPs in 1/3 octave-wide bands. Median values calculated from Equation (1), lower and upper limits of the uncertainty range from Equations (3) and (4).
f (Hz)ΔLf (dB), M1200 VΔLf (dB), M1200 VWΔLf (dB), M1200 VPlus
MedianLowerUpperMedianLowerUpperMedianLowerUpper
8000.15−3.123.810.05−3.050.93−1.12−2.370.81
10001.640.403.633.452.275.802.960.955.57
12505.764.568.185.845.336.956.324.868.62
16007.906.7910.078.717.1510.389.888.3112.16
20009.407.7812.109.838.2912.0310.648.6214.66
25009.328.4210.5410.268.8511.046.585.787.78
31502.421.724.392.741.853.874.112.996.32
40007.476.698.677.916.759.679.968.0612.55
50007.515.859.938.306.399.655.172.987.06
63006.724.809.466.843.979.586.364.309.10
80006.515.1310.196.735.778.286.565.149.40
10,0008.207.1010.207.796.809.737.586.269.48
12,50010.479.5111.0310.008.7210.759.718.7210.96
16,00013.1810.7016.3811.199.8613.6811.5310.9113.04
20,00011.6110.0213.2810.549.8211.829.889.2811.52
Table 3. Attenuation of sound by M1204 V, a moulded FFP with four foldable parts in 1/3 octave-wide bands. Median values calculated from Equation (1), lower and upper limits of the uncertainty range from Equations (3) and (4).
f (Hz)ΔLf (dB)
MedianLowerUpper
800−1.41−2.651.11
1000−2.14−3.851.95
1250−0.84−2.670.94
16001.82−0.793.32
20005.573.018.17
25007.084.838.55
31506.824.919.81
40008.766.1411.22
500012.529.0716.86
630012.6910.4714.81
800011.697.8013.59
10,00012.9410.1514.64
12,50011.268.7018.53
16,00012.829.1919.94
20,00011.138.6514.94
Table 4. Attenuation of sound by the folded FFPs in 1/3 octave-wide bands. Median values calculated from Equation (1), lower and upper limits of the uncertainty range from Equations (3) and (4).
f (Hz)ΔLf (dB), M1200 VPΔLf (dB), M1200 VPWΔLf (dB), M1200 VB
MedianLowerUpperMedianLowerUpperMedianLowerUpper
800−1.23−2.160.89−1.36−3.060.94−0.02−1.781.68
1000−1.35−3.331.850.05−1.782.54−0.20−2.642.74
12502.01−0.053.951.12−0.133.580.97−0.282.95
16005.162.986.015.542.776.924.772.745.62
20006.654.649.037.305.5610.167.806.2010.02
25004.112.315.065.512.888.916.905.628.22
31503.212.434.753.932.327.521.600.212.99
40003.532.424.564.753.737.784.082.775.40
50006.303.598.466.834.829.398.847.3610.53
63004.323.438.944.522.5211.335.174.366.93
80004.903.856.474.363.636.927.706.888.70
10,0007.276.199.407.426.3410.788.997.6210.18
12,5008.107.059.398.657.0413.748.907.699.84
16,00010.067.7112.5010.678.6918.168.587.789.43
20,0008.607.1111.679.297.4115.048.548.159.30
Table 5. The Euclidean distances d, in dB, between the ΔLf datasets for five masks of M1200VPlus type. Numbers in bold print denote the shortest distance for at least one set in the pair; underlining marks the shortest distance for both sets in the pair. The datasets are identified by #i-j, where i and j denote mask and measurement, respectively.
Dataset#1-1#1-2#2-1#2-2#3-1#3-2#4-1#4-2#5-1#5-2
#1-1 7.934.245.345.825.704.695.234.236.3
#1-27.93 7.795.756.196.434.594.286.334.21
#2-14.247.79 3.215.704.246.246.235.616.85
#2-25.345.753.21 4.273.145.224.965.435.23
#3-15.826.195.704.27 3.834.664.945.605.10
#3-25.706.434.243.143.83 5.135.595.945.46
#4-14.694.596.245.224.665.13 1.773.533.16
#4-25.234.286.234.964.945.591.773.042.76
#5-14.236.335.615.435.605.943.533.04 3.99
#5-26.304.216.855.235.105.463.162.763.99
Table 6. The Euclidean distances d, in dB, between the ΔLf datasets for seven FFP types. ΔLf values in fifteen 1/3 octave-wide bands with centre frequencies 800–20 kHz. Numbers in bold print denote the shortest distance for at least one set in the pair; underlining marks the shortest distance for both sets in the pair.
FFPM1204 VM1200 VPM1200 VPWM1200 VBM1200 VPlusM1200 VM1200 VW
M1204 V 16.7715.8314.2718.2115.7716.70
M1200 VP16.77 3.016.0711.7510.8711.91
M1200 VPW15.833.01 5.8010.349.2710.16
M1200 VB14.276.075.80 12.029.8010.07
M1200 VPlus18.2111.7510.3412.02 6.165.85
M1200 V15.7710.879.279.806.16 3.39
M1200 VW16.7011.9110.1610.075.853.39
Table 7. The Euclidean distances d, in dB, between the ΔLf datasets for seven FFP types. ΔLf values in four octave-wide bands with centre frequencies 1, 2, 4, and 8 kHz. Numbers in bold print denote the shortest distance for at least one set in the pair; underlining marks the shortest distance for both sets in the pair.
FFPM1204 VM1200 VPM1200 VPWM1200 VBM1200 VPlusM1200 VM1200 VW
M1204 V 8.137.337.137.928.408.81
M1200 VP8.13 1.382.394.774.875.78
M1200 VPW7.331.38 2.223.984.185.05
M1200 VB7.132.392.22 3.423.394.30
M1200 VPlus7.924.773.983.42 0.831.30
M1200 V8.404.874.183.390.83 0.93
M1200 VW8.815.785.054.301.300.93
Disclaimer/Publisher’s Note: The statements, opinions and data contained in all publications are solely those of the individual author(s) and contributor(s) and not of MDPI and/or the editor(s). MDPI and/or the editor(s) disclaim responsibility for any injury to people or property resulting from any ideas, methods, instructions or products referred to in the content.

