
Extreme Wave Loading on a Vertical Circular Cylinder
1
China Southern Power Grid Technology Co., Ltd., Guangzhou 510062, China
2
State Key Laboratory of Coastal and Offshore Engineering, Dalian University of Technology, Dalian 116024, China
3
Dalian Key Laboratory of Offshore Renewable Energy, Dalian 116024, China
*
Author to whom correspondence should be addressed.
Appl. Sci. 2023, 13(15), 8784; https://doi.org/10.3390/app13158784
Submission received: 18 June 2023
/
Revised: 13 July 2023
/
Accepted: 13 July 2023
/
Published: 29 July 2023
(This article belongs to the Special Issue Offshore Wind Turbines and Wave Energy: Modeling, Simulation and Applications)
Abstract
:Extreme wave loading on a marine structure, consisting of a quasi-static and a dynamically slamming component, often drives the design of such a structure. Their accurate predictions remain challenging tasks. This paper examines the slamming contribution to the force–time histories from a series of experiments in which the crest of a wave is forced to hit a truncated cylinder suspended from above. A range of inundation levels, representing the breaker heights, are considered. The work also provides insights into nonlinear load characteristics on a vertical truncated cylinder. A simple analytical model based on the Newtonian momentum analysis is extended to describe the scaling of the horizontal peak force with the inundation level, i.e., the relationship between the wave slamming loads and the breaker height. More specially, it is found that the peak horizontal impact force is proportional to the inundation level and the square of the linear wave amplitude. In addition, the horizontal and the vertical impact forces on a truncated cylinder are found to increase with the increasing inundation level, while the effect from the wave steepness is relatively small. Furthermore, the higher-order wave components driving nonlinear (quasi-static) loading on a structure are separated by applying a phase-based separation method assuming a Stokes-like approximation. The separation method is found to work well even for long shallow-water waves that have strong nonlinearities. The results suggested that the relative contribution from the fundamental linear wave and higher-order wave components decreases and increases with the increasing nonlinearity of long waves, respectively, characterized by the Ursell number. Finally, this increase in the higher-order wave components is found to be saturated at large Ursell numbers.
1. Introduction
Wave-induced loads on platform columns and offshore wind turbine columns need to be properly considered to ensure a reliable design of these structures. The former are support structures of, e.g., tension-leg platforms (TLPs), gravity-based structures (GBSs), and semisubmersible rigs, which are widely used for offshore oil and gas exploration. The latter become increasingly important due to the rapid expansion in the global offshore wind sector. The relevant interaction of surface water waves and cylindrical structures has been the subject of intense interest for decades. Yet, the physics and statistics of such interaction are complex, which remain to be fully resolved for strongly nonlinear loads as experienced in severe conditions. Typically, the physics of wave loading can be split into a quasi-static (non-breaking) and a dynamically slamming (breaking) component [1]. These have different magnitudes and timescales as they are dominated by different physical phenomena.
For non-breaking waves, the relevant phenomena that cannot be well explained by the linear wave theory include the so-called ‘springing’- [2] and ‘ringing’-type [3] responses of a vertical cylinder. These are typically large transient deformations of a structure that have natural frequencies substantially higher than the dominant frequencies of surrounding waves. Extensive research (e.g., [2,3]) suggested that these are associated with higher-order forces occurring at frequencies that are close to integer multiples of the fundamental/dominant wave frequency. More specially, second-order forces are found to be responsible for exciting the ‘springing’-type responses and third-order forces for the ‘ringing’-type responses. In addition, a secondary load cycle, i.e., an oscillation after the main peak at about one-quarter of the wave period, was observed [4,5,6]. Numerical investigations by [7] indicate that the high-frequency forces (up to the sixth order) are also responsible for the occurrence of this secondary load cycle. Thus, an accurate description of higher-order nonlinear characteristics of an extreme non-breaking wave loading on a cylindrical structure is of importance.
Currently, diffraction analyses up to second order conducted in the frequency domain have been widely applied; see, e.g., [8,9]. For using the perturbation analysis to capture the third-order wave forces, the work of [3] is noted. While for wave forces above the third order, fully nonlinear numerical models solving the Laplace equation (e.g., [10,11]) or the Navier–Stokes equations (e.g., [12,13]) in the time domain are developed. The huge computational resources required in these time-domain approaches limit their applications to the offshore industry as engineering models. The forcing model developed by [14] is thus extremely useful. They found that the nonlinear part of non-breaking wave loading on a bottom-mounted cylinder can be described by a Stokes-type expansion. Thus, the higher-order wave forces (up to fifth order) can be estimated from the linear component alone. The linear forces can be obtained quickly by using the linear diffraction analysis mentioned above.
In contrast to non-breaking wave loading, breaking waves are notoriously difficult to model numerically and physically due to the violence of the hydrodynamics and scaling issues. Various models have been put forward for calculating the time history of the loading, see for instance, a Wagner-type model in [1] and CFD (computational fluid dynamics)-type models in [15,16]. However, for dynamically sensitive structures, the time-integrated impulse from the force on a short time scale (e.g., breaking wave loading) rather than the exact loading time history is generally considered to be sufficient at the early stage of design [17]. Estimating and modeling the underlying physics of the impulse are more robust and tractable.
Pressure–impulse theories solving the Laplace equation were derived for wave impact on a two-dimensional and three-dimensional vertical wall by [18,19], respectively. The approach was also extended to more complicated configurations, including wave impact on perforated structures by [20], breaking wave impact on permeable barriers by [21], and axisymmetric wave impact on a vertical cylinder by [17]. Recently, [22] developed a simpler analytical model based on a Newtonian momentum argument for describing the horizontal impulse on a rectangular solid deck. The model assumes that the momentum carried by the incident large wave crest is transferred perfectly into the impact on the vertical edge of the solid deck. This has the potential to yield a practical approach for providing satisfactory engineering predictions due to its simplicity and thus motivates this work. The possible application of the methodology to a vertical cylinder of curved surface is explored experimentally here. A certain portion of the incoming flow momentum may be diverted rather than captured by the circular cylinder because it is more streamlined when compared to the square solid box.
For simplicity and as a starting point to inform more sophisticated work in the future, the slamming contribution to the force–time series is isolated by forcing the crest of a wave to hit a truncated cylinder with its bottom being at or above the mean still water level. The height of the breaker (i.e., the height of the impacting fluid) is modeled/simulated by the vertical distance between the wave crest and the cylinder bottom, i.e., the inundation level in this work. It is worth noting that in the aforementioned pressure–impulse theory (see, e.g., [18]), this is usually left as a free parameter determined by calibrating against the experimental measurements or more advanced numerical results.
It is also our aim to investigate the importance of higher-order wave components driving nonlinear loading on a structure. Hence, we use focused wave groups [23] as input waves to impinge the truncated cylinder, facilitating the extraction of wave components at various orders via the so-called phase-separation method [24]. In the phase-separation method, the Stokes expansion in regular waves is generalized to wave groups (i.e., the magnitude of each higher-order wave component is proportional to the linear component amplitude to the corresponding power) and is assumed to be valid for the physical process of interest. This hypothesis has been testified to be appropriate for deep- and intermediate-water waves (e.g., [14,24,25]). The application of the methodology, and hence the engineering model for nonlinear wave loading proposed by [14], to shallow-water waves of large steepness (the possible offshore wind farms scenarios) will be assessed in this paper.
In addition, the use of a transient wave group has three other attractive advantages that are worth noting. Firstly, it retains the spectral nature of the real ocean waves, and secondly, the measurements are not contaminated by reflected waves from physical wave tank walls, making the interpretation of results easier [14,25]. Thirdly, it is demonstrated to be a good representation of an individual extreme wave event in random seas, see, e.g., [26,27,28].
This work will also provide insights into the nonlinear characteristics of extreme wave loading on a vertical truncated cylinder, although limited to the scenarios in which the offshore platform or the floating wind turbine foundation (i.e., the cylinder bottom) is moved above the free surface by water waves. In contrast to bottom-mounted cylinders, this is less explored and shows rather different loading characteristics.
In this context, the work of [29,30,31] is worth mentioning. [29] assessed the performance of a frequency domain potential flow solver and a full CFD solver when applied to nonlinear regular wave-truncated cylinder interactions. Comparisons to the experiments carried out at MOERI [32] were performed. [30] investigated linear wave diffractions from a truncated cylinder, with its upper part being surrounded by a porous material. The run-up around and the loading on a vertical cylinder in solitary waves were measured by [31]. Unlike these pioneering works, our present work aims at improving the understanding of the underlying physical features, making the development of a simpler engineering model for predictions of extreme loading on a (truncated) cylinder viable.
The rest of this paper is organized as follows. The experimental setup and data analysis are described in Section 2. In Section 3, the importance of nonlinear higher-order wave components associated with nonlinear loading on a structure is explored, and Section 4 presents the application of the method based on the ‘Newtonian momentum argument’ to experimental data. Finally, Section 5 contains the main conclusions.
2. Experimental Modeling and Data Analysis
2.1. Experimental Setup
The aforementioned physical experiments on wave interactions with a vertical cylinder were conducted in a wave flume at Dalian University of Technology, China. The flume is 22 m in length, 0.45 m in width, and 0.65 m in depth, see Figure 1a. A ‘piston-type’ wave paddle is installed at one end, while a sloping beach acting as a passive absorber is placed at the other end. In the experiments, linear wave generation was used, and the water depth h was set to 0.35 m.
In the experiments, a single vertical cylinder of diameter 0.165 m (i.e., radius R = 0.0825 m) was located with its front stagnation point 9.3 m away from the wave paddle in the center of the flume. The cylinder was supported from above by a stiff frame via a load cell at the top, permitting measurement of the total horizontal and vertical forces, see Figure 1b. The load cell is of the strain gauge type (KD4), which measures the applied force via the change in resistance incurred by the subsequent strain deforms. The sampling frequency was set to 2000 Hz in this work. It can also be seen from Figure 1b that colorful strips of 3 cm were wrapped around, and a ruler was attached to the cylinder. These, in combination with a high-speed camera, were used for measuring the wave run-ups around the cylinder visually. This paper is focused on the wave loads on the cylinder.
The height of the cylinder was 0.3 m, and a range of air gaps, i.e., vertical distances from the mean still water level in the flume to the bottom of the cylinder, were considered, aiming to investigate its effect on the impact force. These were 0, 3, 6, 9, and 12 cm, and the value of 0 cm indicates that the bottom of the cylinder was at the still water level of the flume. As mentioned in the Introduction, this is designed to represent the breaker height and, in turn, isolate the slamming wave contribution from the total force–time histories.
In addition, free surface elevations in the flume were measured using three ultrasonic-type wave gauges, which were located at 2 m, 8 m, and 8.9 m away from the wave paddle and along the wave flume centerline, respectively. The sampling frequency of the wave gauges was set to 50 Hz.
The schematic diagram of the experimental setup, including the layout of wave gauges, is shown in Figure 2. Also shown in the figure is the Cartesian coordinate system Oxz introduced in this work for the sake of discussion. The origin O is the plane of the undisturbed free surface, x = 0 indicates the location of the wave paddle, and z is positive upwards.
In addition to the wave–cylinder interaction experiments, a set of experiments in the absence of the model cylinder were also carried out for studying nonlinear wave evolutions and, thus, the contribution of higher-order wave components driving the nonlinear loads on a marine structure. It is noted that the arrangement of the wave gauges was slightly different for measuring the undisturbed wave fields in this set of experiments. They were arranged at x = 2 m, 6.7 m, and 9.3 m, respectively. The incident wave field characterized in Section 2.2 followed is based on the records at wave gauge 3 (WG3; x = 9.3 m), and WG1 (x = 2 m) was used to check the repeatability of wave runs with and without the cylinder in place.
2.2. Incident Wave Field
A range of wave conditions with varying wave steepness and spectral peak wave frequencies were tested, as listed in Table 1. Here, kp and λp are the wave number and the wavelength corresponding to the spectral peak wave period Tp. Ap is the peak wave amplitude, and Ur is the Ursell number (= (Ap/h)/(kph)2). It can be seen that the ratio of the peak wave amplitude (Ap) to the cylinder radius (R) was up to 1.2 (i.e., Ap/R ≤ 1.2), and the cylinder size (kpR) ranged from 0.149 to 0.364. These correspond to the field scale conditions in which the dynamic responses of a structure are expected to occur.
A focused wave group consistent with a JONSWAP spectrum with γ = 3.3 was used, providing a model for transient events and thus ensuring that the experimental results over the time of interest are not contaminated by reflected waves [33].
In this context, the NewWave-type focused wave group is applied [26],
where x0 and t0 are the focus point and time, respectively. In this work, these are pre-determined as 9.3 m and 32 s, respectively. φg is the global phase difference, and the amplitude of each wave component is calculated as
In which Δω is the increment of the angular frequency, and S(ω) is the wave energy spectrum (JONSWAP spectrum in this work). Here, ω and k are the wave angular frequency and the wave number, respectively, satisfying the dispersive equation
where g is the acceleration due to gravity. Recall that h is the water depth and Ap is the peak wave amplitude.
An example time history of a NewWave-type focused wave group is shown in Figure 2 (top right), where all Fourier wave components are forced to come into phase with each other to produce a very violent wave–structure interaction, see, e.g., in Figure 2 (top left). It is clear from the photo that a mass of water is projected vertically upwards during the violent impact event, forming a thin sheet of water that wrapped around the upstream half of the cylinder. A similar phenomenon has been reported by [5,14,34], among others, in their experiments on wave interactions with a vertical bottom-mounted cylinder, and by [22] in their wave-in-deck experiments with focused waves into a solid deck.
2.3. Four-Phase-Based Decomposition Method
In order to apply the four-phase-based decomposition method presented by [24] to extract the harmonic structure of a nonlinear wave (i.e., higher-order wave components), a crest-focused wave group and three wave groups with phase shifts of π/2, π, and 3π/2 were generated in groups. These four waves (Figure 3; labeled as η0, ηπ/2, ηπ, η3π/2) were generated by the same paddle signal (i.e., have the same frequency content), but with the phase of each Fourier component being shifted 0°, 90°, 180°, and 270°. That is, φg in Equation (1) equals 0, π/2, π, and 3π/2, respectively.
The wave component at each order is then decomposed as [24]
The superscript ‘H’ indicates this is the Hilbert transform of the corresponding free surface elevation time history. η(1), η(2+), η(3+), η(4+), and η(2−) are the linear component, second-order sum, third-order sum, fourth-order sum, and second-order difference terms, respectively. The second-order difference (long wave) and fourth-order sum terms can be further separated by performing digital frequency filtering.
2.4. Iterative Correction for Generating Controlled and Accurate Focused Wave Group
A downshift in the actual focus point/time is often observed due to the nonlinear dispersion of the wave groups between the paddle and the structure; see, e.g., [35,36]. As a consequence, some of the recorded wave groups may be focused better than others (depending on the wave nonlinearity), and there may be a discrepancy between the target and the measured focused wave groups at the desired focus point (measured by WG3 at x0 in this work).
This critical challenge of generating controlled and accurate wave groups was addressed through the use of the iterative correction technique by [37]. In this method, the signal driving the wave paddle motion is iteratively corrected by comparing the measured to the desired target amplitude spectra [37],
where a(fi) and φ(fi) are the amplitude and phase of a spectral component at frequency fi, respectively. The superscript n is the number of iterations, and the subscripts ‘in’ and ‘out’ indicate that these are associated with the input and output signals, respectively. Note that for n = 1, = atgt(fi) = aNW(fi) and = φtgt(fi) = (ωit0−kix0 + φg), i.e., the pre-selected linear spectrum (atgt, φtgt) is used for driving the paddle signal initially.
More specially, this work uses the linearized part of the measured total wave signal, and thus, the measured output spectrum (aout, φout) is obtained by performing an FFT (fast Fourier transform) calculation on the linear component time history, i.e., η(1) in Equation (4) isolated by the four-phase decomposition method [24]. And the output amplitudes and phases (aout, φout) are calculated based on the free surface elevations measured at WG3 (i.e., x = 9.3 m, the predefined focus point).
The final linearized undisturbed wave shape (dashed red line) is compared to the target (black solid line) in Figure 4. Here, the peak wave period Tp = 1 s and Ap = 0.07 m. It can be seen that a satisfactory agreement is achieved, indicating that the applied methodology, i.e., iterative correction scheme in tandem with the four-phase-based decomposition method, works well for generating the desired focused wave in a physical flume with a piston-type wavemaker. The aforementioned issues associated with spatial and temporal downshift of the focal location are overcome.
Comparisons have also been made for other wave conditions considered in this work (details are to follow later in this section and see Table 1), with comparable agreement, but are not shown here for brevity.
In addition, the good agreement also suggests that the nonlinear process in water waves of high steepness (kpAp up to 0.3) that propagate in intermediate, nearly shallow waters (h/λp down to 0.1 in which λp is the wavelength) may still be described by a Stokes-type perturbation expansion in both frequency and wave steepness. This assumption is the key for the four-phase decomposition method discussed above to be applicable.
2.5. Variability of the Surface Elevations and Forces
Two repeat tests were conducted for all cases (i.e., the wave conditions listed in Table 1) to quantify the repeatability of the system and the variability of the wave impact process. Figure 5 shows example time histories of the disturbed free surface elevation (measured with the cylinder in place) and forces measured in the two repeated runs. Analysis of repeatability reveals that the root-mean-square error (RMSE) for the free surface elevation is 0.0045 m with a peak value of 0.12 m and 0.015 N with a peak value of 5 N. Thus, the averaged errors across all the cases studied in terms of the maximum free surface elevation and the peak force are 3.75% and 0.3%, respectively. Overall, there is a good level of repeatability in both the measured wave impact force as well as free surface elevation time histories.
3. Higher-Order Wave Components Driving Nonlinear Loading on a Structure
3.1. Nonlinear Wave Evolutions
Figure 6 and Figure 7 show time histories (left) and the corresponding spectra (right) of the free surface elevation measured at various spatial locations in the absence of the model cylinder to investigate nonlinear wave evolutions. Typically, the peak wave period Tp = 1 s and the peak wave amplitude Ap = 0.07 m in Figure 6. And these are 2 s and 0.08 m, respectively, for results in Figure 7. According to Table 1, the former corresponds to the case with stronger nonlinear (i.e., larger wave steepness) but smaller shallow-water effects (i.e., the ratio of water depth and the wavelength is smaller), while the latter is the opposite.
It can be seen from measurements at the location of WG1 (x = 2 m) that a transient wave group is generated due to frequency dispersion, as expected. The wave group becomes more compact at the location of WG2 (x = 6.7 m), and at the focus point (WG3; x = 9.3 m), all wave components come in phase, producing a large energetic event in the form of NewWave. The crests/troughs preceding and succeeding the peak are symmetric, suggesting that linear components dominate even for the wave of large steepness up to 0.31. This is confirmed by the amplitude spectra shown on the right of Figure 6.
In contrast, the shape, and thus the kinematic of the wave group, shown in Figure 7, differ substantially from the predictions of linear wave theory. Even at the location of WG1, a significant amount of energy is transferred to the higher harmonic wave components at frequencies 2fp and 3fp. They are about 40% and 10% of the linear wave components, respectively. Recall that the wave steepness for this case is 0.144, and the non-dimensional water depth (h/λp) is 0.1. Thus, it is reasonable to infer that for this case, the shallow-water effect, i.e., wave–bottom interaction, plays a more important role in facilitating this significant energy transfer to high-wavenumber components and occurs shortly after releasing/propagating from the wave paddle.
In general, there is significant energy transfer among wave components, and the wave steepness is not the best measure of wave nonlinearity for the cases considered, as expected. This will be further discussed later.
3.2. Harmonic Structure of Nonlinear Waves
It is clear from Section 3.1 that nonlinear wave–wave and wave–bottom interactions may introduce a significant harmonic generation, redistributing the wave energy from the fundamental frequency into higher harmonics of this linear component. And given that each harmonic for a wave group spreads over a range of frequencies, the four-phase decomposition method discussed above (Equation (4)) is adopted to extract the harmonic structure of the nonlinear wave fields. Typical results are shown in Figure 8; from top to bottom are long-wave difference component, linear, second, third, and fourth sum harmonics, respectively. The fourth sum harmonic is separated from the second-order difference term by digital filtering. The envelopes of the harmonics in time are also calculated and plotted on top of the corresponding wave harmonics, displaying the structure of the wave signal in time.
The envelope of the linear wave component is obtained using the formula
Recall that (η(1))H is the Hilbert transform of the linear wave time history.
If the nonlinear process follows a Stokes-type expansion, the envelopes of the nth harmonics can be approximated by raising the fundamental envelope to the power n, which is then scaled according to the magnitude of the nth harmonic component [37]. That is,
where s is the scaling factor obtained by the least-square method to match the size of envelopes to the maximum of the measured nth-order harmonics. This assumption is further assessed in Figure 8 by plotting the approximated envelopes on top of the wave time series at each other.
It can be seen that the extracted harmonics fit the estimated envelopes fairly well, although some discrepancies are found. The mismatch is slightly more obvious in the case shown on the right. The second-order harmonic wave curve shows a small secondary pulse at approximately t = (34–38) s, which may be attributed to the error waves from the wave paddle. The error wave results from the fact that the linear wave signal was used for driving the paddle, while the waves generated were inherently nonlinear. In addition, the wiggles of the third-order harmonic wave spread slightly outside their approximated envelopes. This is not surprising as the methodology is well known to work less well for the third harmonics [14]. Distinct/extra nonlinear mechanisms, including Morison drag from ringing forces [5,38] and the secondary load cycle [6], may be responsible for this. It is clear that the Stokes-like approximation and, thus, the applied four-phase decomposition method works well, even for the waves of stronger nonlinear and shallow-water effects.
It also can be seen from Figure 8 that contributions from higher-order harmonics (ratio between the linear and higher harmonics) are larger for the case with a smaller (non-dimensional) water depth (right plot), consistent with the observations in Figure 6 and Figure 7.
The peaks of each harmonic (non-dimensionalized by dividing by the total peak wave amplitude ηt) for the waves studied in this work (see Table 1) are then summarized in Figure 9. As suggested by the analysis in Section 3.1 and in Figure 8, we plot the variation in the peaks against the so-called Ursell number (Ur = (Ap/h)/(kph)2), which indicates the nonlinearity of long surface water waves. The values of the Ursell number are also listed in Table 1 for reference. Note that for long waves (i.e., smaller h/λp) with a small Ursell number, the linear wave theory is supposed to be applicable.
It can be seen from Figure 9 that the linear component always dominates the higher-order harmonic waves, although its relative value decreases with the increasing Ursell number. Accordingly, the higher-order harmonic waves increase with the increasing Ursell number and are of significant size when the wavelength is increased up to 10 times larger than the water depth. This suggests that the Ursell number actually weighs the respective importance of the nonlinear and shallow-water effects; thus, it is a good measure of the nonlinearity of shallow-water waves.
In addition, it is interesting to observe that the increases/decreases are observed to arrive at their saturation levels at larger Ursell numbers (>0.35 in this work). The opposite effects from the wave nonlinearity and the wave shoaling may cancel out each other or reach an equilibrium state here.
4. Extreme Wave Loads on the Vertical Cylinder
4.1. Impact Force on a Vertical Truncated Cylinder
Example time histories of the free surface elevation measured in front of the cylinder (x = 8.9 m) and the subsequent impact forces on the vertical truncated cylinder are shown in Figure 10. Here Tp = 1.5 s, Ap = 0.1 m, and hag = 0.06 m. Recall that the front stagnation point of the cylinder was arranged at x = 9.3 m.
It is clear from the figure that (both horizontal and vertical) forces are induced when the wave crests exceed the cylinder bottom at t = 30.44 s and 32 s. Steep rises and sharp peaks are observed in both horizontal and vertical forces due to the impingement of the wave crests and the bottom slamming during water entry, respectively. The following negative horizontal force is introduced by the reverse flow impacting onto the back face of the cylinder, while the water exiting during the impact process leads to the large negative (suction) force vertically. A similar phenomenon was reported by [22] for wave interactions on an elevated rectangular deck. It also can be seen from the figure that the peak vertical force is larger than that of the horizontal force, and the duration of the (vertical) suction phase is relatively longer than the wave impacting/slamming.
The effect of the air gap/inundation level on the impact force is investigated in Figure 11. It can be seen that both the horizontal and vertical forces increase with the increasing inundation level (=undisturbed wave crest-air gap), as expected. Generally, the horizontal force is found to increase with the wave steepness, although the increase is mild for smaller inundation levels. An opposite trend is found for the vertical force, i.e., the vertical force decreases with the increasing wave steepness. The results from the Morison equation for a truncated cylinder [39] are also included. It can be seen that our measurements agree well with the Morison equation when the cylinder size (i.e., for cases with kpAp = 0.144 and kpR = 0.149) is within the expected range of validity of the Morison equation (i.e., kpR < 0.157). While for larger cylinders, the Morison equation overestimates the horizontal force in general. This further supports/confirms the capability of the present scaled physical experiments in modeling wave-truncated cylinder interactions.
4.2. On the Scaling of Peak Horizontal Impact Forces
Assumes that the horizontal momentum carried by the impacting water is transferred completely into the impact force on the structure, then the instantaneous peak horizontal force applied to the structure per unit width can be calculated by [22]
where ∆m is the mass flow rate of the impacting water per unit width, and u is the corresponding fluid velocity. Referring to Figure 2, ∆m = ρuhd, assuming that the fluid velocity is uniform over the depth of inundation.
For non-breaking waves in shallow waters, we assume that the linear horizontal velocity at the wave crest can be approximated by [40]
And thus,
Assuming that the horizontal force is uniform across the structure width, then the peak horizontal force Fxmax scales with the square of the linear wave amplitude and the inundation level. This is consistent with the scaling proposed by [22] for a wave into a solid deck. While for a circular cylinder, there may be a factor (smaller than 1) considering the change across the structure width. Nevertheless, we note that this treatment/assumption is adequate at this stage as only the scaling is of concern here.
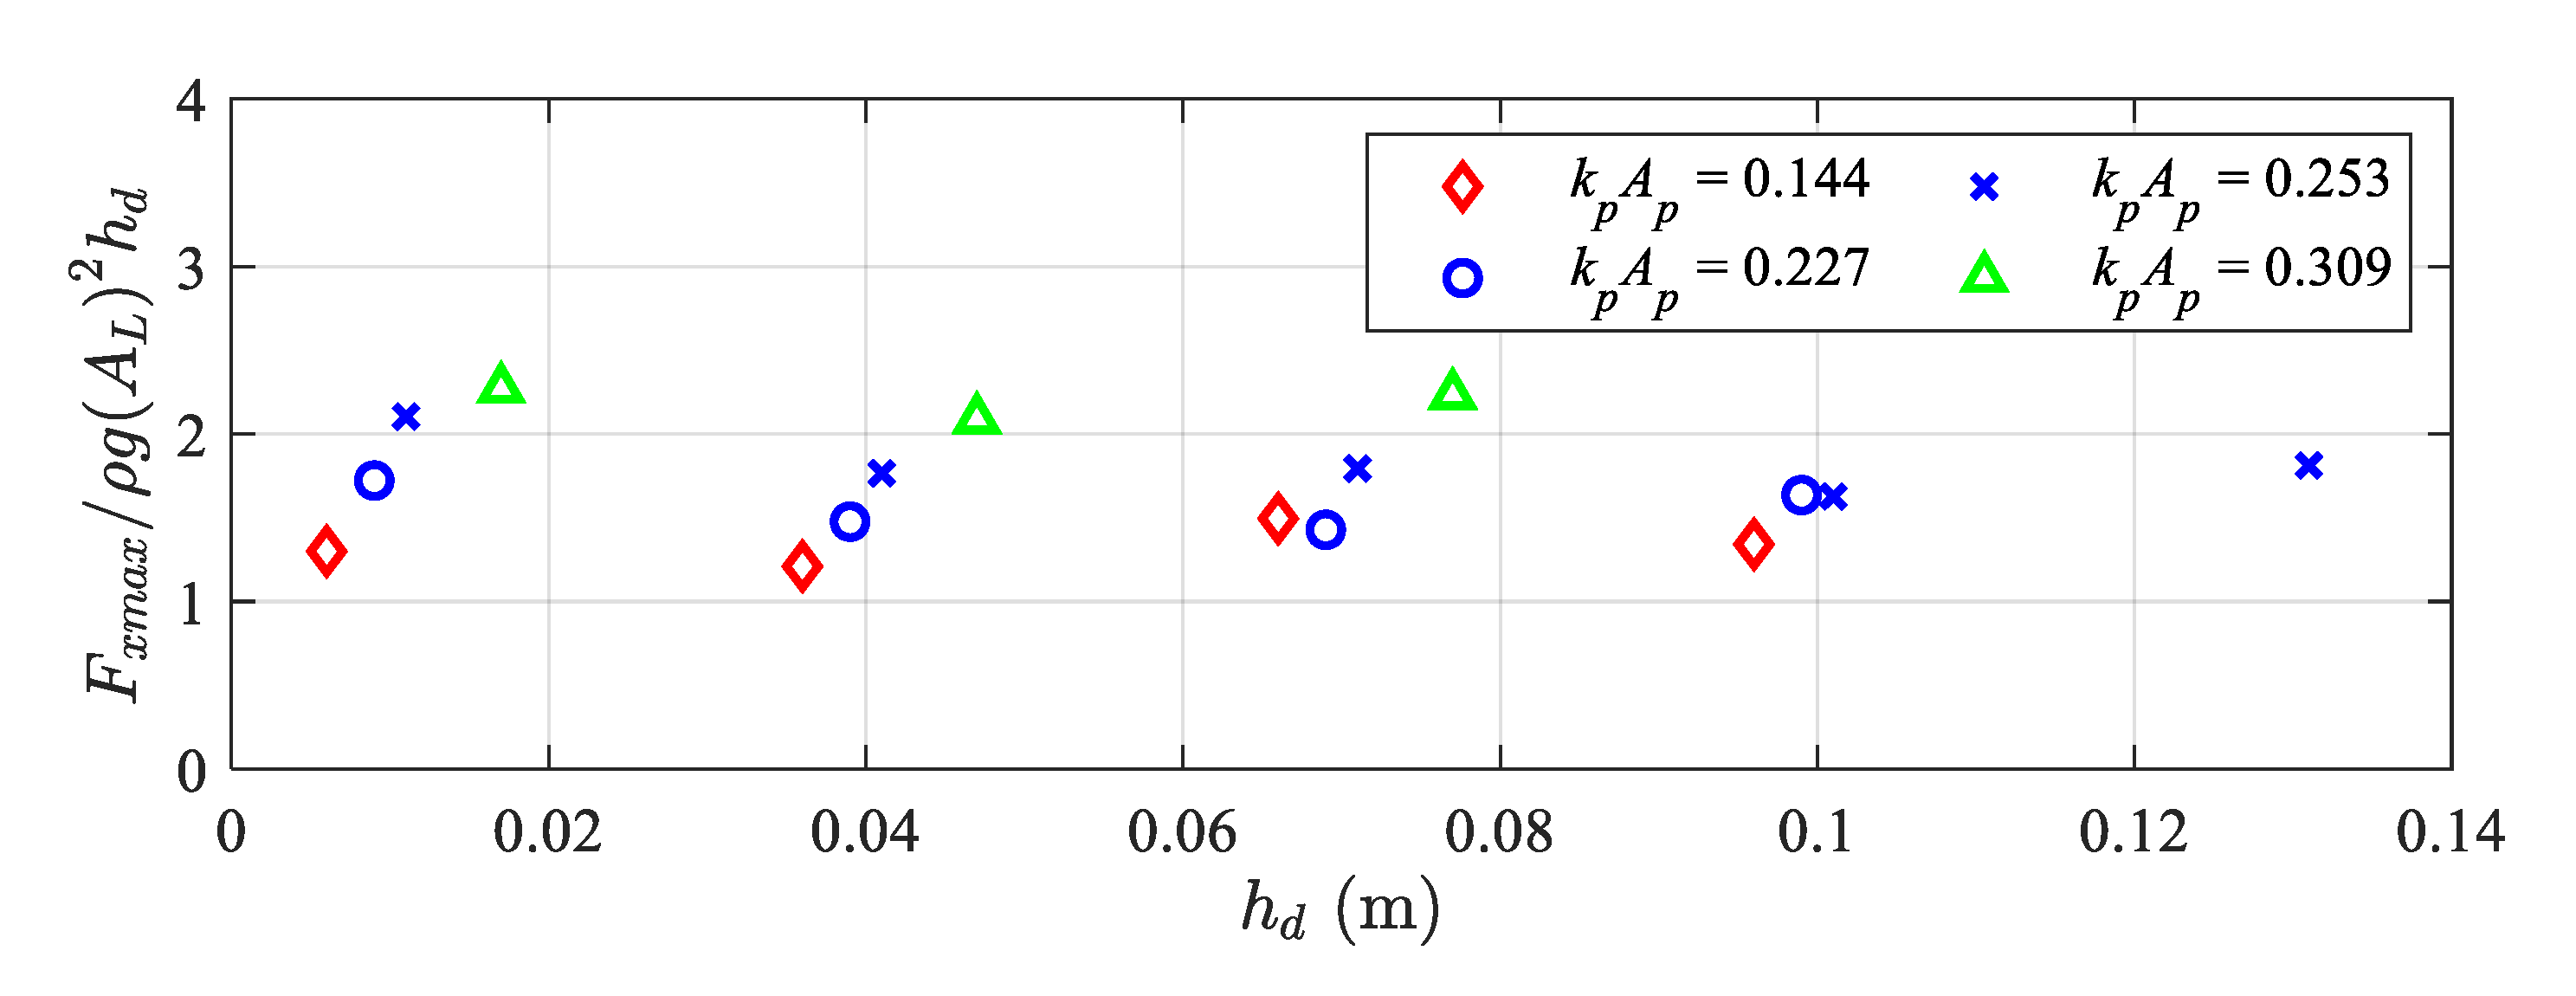
Using the scaling above, the amplitude/peak of the horizontal impact force is now non-dimensionalized by dividing by ρg(AL)2hd. Here the wave amplitude is selected as AL, which is the maximum value of the linearized wave elevation envelope at the position of the cylinder, i.e., x = 9.3 m, as discussed in Section 3.2 and Figure 8 and Figure 9. It can be seen that for all four wave conditions investigated, the non-dimensional horizontal impact force is approximately constant for the whole range of inundation levels and increases slightly with the increasing wave steepness. This suggests that the impact force is independent of the inundation level or the air gap if Santo’s scaling is applied.
It is worth noting that Santo’s scaling discussed above is introduced based on a ‘destruction of momentum’ argument, which assumes that the horizontal momentum of the impacting water (below the undisturbed free surface but above the deck bottom) is transferred completely into the impact on the vertical edge of a structure. Also, the linear Stokes shallow-water wave model is used for approximating the wave crest kinematics. These assumptions may explain the observed scatter in the results in Figure 12. A certain amount of water is deflected away by the curved face of the cylinder (see, e.g., Figure 2 top left photo), i.e., some horizontal momentum is deflected rather than transferred to the impact. And the linear Stokes water wave is certainly not a good approximation for waves in intermediate, nearly shallow waters, as investigated in this work.
Nevertheless, this work, as shown in Figure 12, provides further support to the momentum block model proposed by [22] and extends its applicability to structures with curved surfaces, although more systematic analysis is required. We leave this additional complication for future work. The momentum block model is useful and could be applied for practical engineering analysis for estimating the violent impact introduced by, e.g., breaking waves.
5. Conclusions
A set of physical experiments on wave-truncated cylinder interactions were carried out, aiming to improve understanding of the nonlinear characteristics of extreme wave loading on a vertical cylinder, representing supporting foundations of offshore oil and gas platforms or offshore floating wind turbines. A transient wave group was used to model the individual extreme event in random seas in a more efficient and controlled manner. A range of wave conditions with varying wave steepness and spectral peak wave frequencies were considered, and the model cylinder was suspended at various heights, representing the breaker height and the instantaneous vertical position of the columns in water waves. The following conclusions are drawn:
- The four-phase separation method is found to work well even for long shallow-water waves of strong nonlinearity. The extracted harmonic structure of the wave fields is still apparent, and the nth harmonic wave scales with the nth power of the envelope of the linear wave component.
- The four-phase separation method, in tandem with the iterative technique, works well for generating the desired focused wave groups even in the nearly shallow water regime. The known issue of downshifting in both spatial and temporal domains is resolved.
- The relative contribution from the fundamental wave decreases with the increasing Ursell number, while the contributions from the higher-order harmonics increase, and both arrive at their corresponding saturation levels at larger Ursell numbers. The Ursell number indicates the wave nonlinearity in the long-wave regime, i.e., weighting the respective importance of the nonlinear and shallow-water effects.
- Both horizontal and vertical impact forces are found to increase with the increasing inundation level, while the effect from the wave steepness is relatively small. The Santo scaling, i.e., ρg(AL)2hd, is introduced for non-dimensionalizing the peak horizontal force, which works very well. A reasonably good collapse in data is observed, indicating that the ‘destruction of momentum’ argument may still be applicable to structures with curved surfaces.
Author Contributions
Conceptualization, S.L. and L.C.; methodology, L.C.; software, Y.Y.; validation, L.C., Y.Y. and X.G.; formal analysis, L.C.; investigation, L.C.; resources, S.L., Y.Y. and X.G.; data curation, Y.L.; writing—original draft preparation, Y.L.; writing—review and editing, L.C.; visualization, L.C.; supervision, L.C.; project administration, X.G.; funding acquisition, S.L., L.C. and X.G. All authors have read and agreed to the published version of the manuscript.
Funding
This research was funded by [the National Key R&D Program of China] grant number [2019YFB1504400], [China Southern Power Grid Technology Co. Ltd.] grant number [NYJS2020KJ005-23], [the Natural Science Foundation of Liaoning Province] grant number [2021-KF-16-03] and [the Natural Science Foundation of China] grant number [grant no. 52001053].
Institutional Review Board Statement
Not applicable.
Informed Consent Statement
Not applicable.
Data Availability Statement
Not applicable.
Conflicts of Interest
The authors declare no conflict of interest.
Abbreviations
| Abbr. | Abbreviation(s) |
| TLP | Tension-leg platform |
| GBS | Gravity-based structure |
| CFD | Computational fluid dynamics |
| MOERI | Maritime and Ocean Engineering Research Institute |
| WG | Wave gauge |
| Ur | Ursell number |
| JONSWAP | The Joint North Sea Wave Observation Project |
| FFT | Fast Fourier transform |
| RMSE | Root-mean-square error |
References
- Wienke, J.; Oumeraci, H. Breaking wave impact force on a vertical and inclined slender pile—Theoretical and large-scale model investigations. Coast. Eng. 2005, 52, 435–462. [Google Scholar] [CrossRef]
- Faltinsen, O.M.; Newman, J.N.; Vinje, T. Nonlinear wave loads on a slender vertical cylinder. J. Fluid Mech. 1995, 289, 179–198. [Google Scholar] [CrossRef]
- Malenica, Š.; Molin, B. Third-harmonic wave diffraction by a vertical cylinder. J. Fluid Mech. 1995, 302, 203–229. [Google Scholar] [CrossRef]
- Grue, J.; Bjørshol, G.; Strand, Ø. Higher Harmonic Wave Exciting Forces on a Vertical Cylinder; Institute of Mathematics, University of Oslo Preprint: Oslo, Norway, 1993; Volume 2, ISBN 82-553-0862-8. [Google Scholar]
- Chaplin, J.R.; Rainey, R.C.T.; Yemm, R.W. Ringing of a vertical cylinder in waves. J. Fluid Mech. 1997, 350, 119–147. [Google Scholar] [CrossRef]
- Grue, J.; Huseby, M. Higher-harmonic wave forces and ringing of vertical cylinders. Appl. Ocean Res. 2002, 24, 203–214. [Google Scholar] [CrossRef]
- Paulsen, B.T.; Bredmose, H.; Bingham, H.B.; Jacobsen, N.G. Forcing of a bottom-mounted circular cylinder by steep regular water waves at finite depth. J. Fluid Mech. 2014, 755, 1–34. [Google Scholar] [CrossRef]
- Taylor, R.E.; Chau, F.P. Wave Diffraction Theory—Some Developments in Linear and Nonlinear Theory. J. Offshore Mech. Arct. Eng. 1992, 114, 185–194. [Google Scholar] [CrossRef]
- Lee, C.H.; Newman, J.N. Computation of wave effects using the panel method. In Numerical Models in Fluid–Structure Interaction; WIT Press: Southampton, UK, 2005; pp. 211–251. [Google Scholar]
- Yang, C.; Ertekin, R.C. Numerical simulation of nonlinear wave diffraction by avertical cylinder. Trans. ASME J. Offshore Mech. Arct. Eng. 1992, 114, 36–44. [Google Scholar] [CrossRef]
- Bai, W.; Eatock Taylor, R. Numerical simulation of fully nonlinear regular and focused wave diffraction around a vertical cylinder using domain decomposition. Appl. Ocean Res. 2007, 29, 55–71. [Google Scholar] [CrossRef]
- Chen, L.F.; Zang, J.; Taylor, P.H.; Stagonas, D.; Buldakov, E.; Simons, R. Numerical investigation of unsteady hydrodynamic loads on a vertical cylinder in waves and sheared currents. In Proceedings of the 31st International Workshop on Water Waves and Floating Bodies, Ann Arbor, MI, USA, 3–6 April 2016. [Google Scholar]
- Jian, W.; Cao, D.; Lo, E.Y.; Huang, Z.; Chen, X.; Cheng, Z.; Gu, H.; Li, B. Wave runup on a surging vertical cylinder in regular waves. Appl. Ocean. Res. 2017, 63, 229–241. [Google Scholar] [CrossRef]
- Chen, L.F.; Zang, J.; Taylor, P.H.; Sun, L.; Morgan, G.C.J.; Grice, J.; Orszaghova, J.; Ruiz, M.T. An experimental decomposition of nonlinear forces on a surface-piercing column: Stokes-type expansions of the force harmonics. J. Fluid Mech. 2018, 848, 42–77. [Google Scholar] [CrossRef] [Green Version]
- Kamath, A.; Chella, M.A.; Bihs, H.; Arntsen, Q.A. Breaking wave interaction with a vertical cylinder and the effect of breaker location. Ocean Eng. 2016, 128, 105–115. [Google Scholar] [CrossRef]
- Qu, S.; Liu, S.; Ong, M.C. An evaluation of different RANS turbulence models for simulating breaking waves past a vertical cylinder. Ocean Eng. 2021, 234, 109195. [Google Scholar] [CrossRef]
- Ghadirian, A.; Bredmose, H. Pressure impulse theory for a slamming wave on a vertical circular cylinder. J. Fluid Mech. 2019, 867, R1. [Google Scholar] [CrossRef]
- Cooker, M.J.; Peregrine, H. Pressure-impulse theory for liquid impact problems. J. Fluid Mech. 1995, 297, 193–214. [Google Scholar] [CrossRef]
- Wood, D.J.; Peregrine, D.H. Two and three-dimensional pressure-impulse models of wave impact on structures. Coast. Eng. 1998, 1, 1502–1515. [Google Scholar]
- Korobkin, A. Non-classical boundary conditions in water-impact problems. In IUTAM Symposium on Fluid–Structure Interaction in Ocean Engineering, Proceedings of the IUTAM Symposium, Hamburg, Germany, 23–26 July 2007; Springer: Berlin/Heidelberg, Germany, 2008; pp. 167–178. [Google Scholar]
- Cooker, M.J. A theory for the impact of a wave breaking onto a permeable barrier with jet generation. J. Eng. Maths 2013, 79, 1–12. [Google Scholar] [CrossRef] [Green Version]
- Santo, H.; Taylor, P.H.; Dai, S.S.; Day, A.H.; Chan, E.S. Wave-in-deck experiments with focused waves into a solid deck. J. Fluids Struct. 2020, 98, 103139. [Google Scholar] [CrossRef]
- Tromans, P.S.; Anatruk, A.; Hagemeijer, P. New model for the kinematics of large ocean waves application as a design wave. In Proceedings of the First International Offshore and Polar Engineering Conference, Edinburgh, UK, 11 August 1991; pp. 64–71. [Google Scholar]
- Fitzgerald, C.; Taylor, P.H.; Eatock Taylor, R.; Grice, J.; Zang, J. Phase manipulation the harmonic components of ringing forces on a surface-piercing column. Proc. R. Soc. A 2014, 470, 20130847. [Google Scholar] [CrossRef]
- Chen, L.F.; Taylor, P.H.; Ning, D.Z.; Cong, P.W.; Wolgamot, H.; Draper, S.; Cheng, L. Extreme runup events around a ship-shaped floating production, storage and offloading vessel in transient wave groups. J. Fluid Mech. 2021, 911, A40. [Google Scholar] [CrossRef]
- Taylor, P.H.; Williams, B.A. Wave statistics for intermediate depth water: New waves symmetry. J. Offshore Mech. Arct. Eng. 2004, 126, 54–59. [Google Scholar] [CrossRef]
- Christou, M.; Ewans, K. Field measurements of rogue water waves. J. Phys. Oceanogr. 2014, 44, 2317–2335. [Google Scholar] [CrossRef]
- Santo, H.; Taylor, P.H.; Day, A.H.; Nixon, E.; Choo, Y.S. Current blockage and extreme forces on a jacket model in focused wave groups with current. J. Fluid Struct. 2018, 78, 24–35. [Google Scholar] [CrossRef] [Green Version]
- Sun, L.; Zang, J.; Chen, L.F.; Eatock Taylor, R.; Taylor, P.H. Regular waves onto a truncated circular column: A comparison of experiments and simulations. Appl. Ocean Res. 2016, 59, 650–662. [Google Scholar] [CrossRef] [Green Version]
- Ning, D.Z.; Zhao, X.L.; Teng, B.; Johanning, L. Wave diffraction from a truncated cylinder with an upper porous sidewall and an inner column. Ocean Eng. 2017, 130, 471–481. [Google Scholar] [CrossRef]
- Wang, Q.; Fang, Y.; Liu, H. An experimental study of run-up and loads on a vertical truncated cylinder in a solitary wave. Ocean Eng. 2021, 219, 108346. [Google Scholar] [CrossRef]
- Ocean Engineering Committee. Final Report and Recommendations to the 27th ITTC; Ocean Engineering Committee: Copenhagen, Denmark, 2014. [Google Scholar]
- Chen, L.F.; Zang, J.; Hillis, A.J.; Morgan, G.C.J.; Plummer, A.R. Numerical investigation of wave-structure interaction using OpenFOAM. Ocean Eng. 2014, 88, 91–109. [Google Scholar] [CrossRef] [Green Version]
- Stansberg, C.T.; Baarholm, R.; Kristiansen, T.; Hansen, E.W.M.; Rortveit, G. Extreme wave amplification and impact loads on offshore structures. In Proceedings of the Offshore Technology Conference, Houston, TX, USA, 2–5 May 2005; p. OTC-17487-MS. [Google Scholar]
- Baldock, T.; Swan, C.; Taylor, P.H. A Laboratory Study of Nonlinear Surface Waves on Water. Trans. Roy. Soc. A Math. Phys. Eng. Sci. 1996, 354, 649–676. [Google Scholar]
- Ning, D.Z.; Liang, C.; Chen, L.F.; Zhang, C.W. Numerical investigation on the propagation and evolution of focused waves over a sloping bed. Ocean Eng. 2022, 25, 111035. [Google Scholar] [CrossRef]
- Chen, L.F.; Stagonas, D.; Santo, H.; Buldakov, E.; Simons, R.R.; Taylor, P.H.; Zang, J. Numerical modelling of interactions of waves and sheared currents with a surface piercing vertical cylinder. Coast. Eng. 2019, 145, 65–83. [Google Scholar] [CrossRef] [Green Version]
- Gurley, K.R.; Kareem, A. Numerical experiments in ringing of offshore systems under viscous loads. In Proceedings of the 14th International Conference on Offshore and Arctic Engineering, Florence, Italy, 16–20 June 1996; p. 484. [Google Scholar]
- Beji, S. Applications of Morison’s Equation to Circular Cylinders of Varying Cross-Sections and Truncated Forms. Ocean Eng. 2019, 187, 106156. [Google Scholar] [CrossRef]
- Stoker, J.J. Water Waves: The Mathematical Theory with Applications; Interscience Publ., Inc.: New York, NY, USA, 1957. [Google Scholar]
Figure 1.
(a) Photograph of the wave flume used. (b) Close-up view of the model cylinder.

Figure 2.
A schematic diagram of the experimental setup and a violent wave event on the vertical cylinder showing a thin sheet of water wrapped around the upstream half of the cylinder (top left).
Figure 2.
A schematic diagram of the experimental setup and a violent wave event on the vertical cylinder showing a thin sheet of water wrapped around the upstream half of the cylinder (top left).

Figure 3.
Time histories for all four full signals that have the same linear envelope but different global phases. Top: measurements at WG1. Bottom: measurements at WG3. Here, Tp = 1 s and Ap = 0.07 m.
Figure 3.
Time histories for all four full signals that have the same linear envelope but different global phases. Top: measurements at WG1. Bottom: measurements at WG3. Here, Tp = 1 s and Ap = 0.07 m.
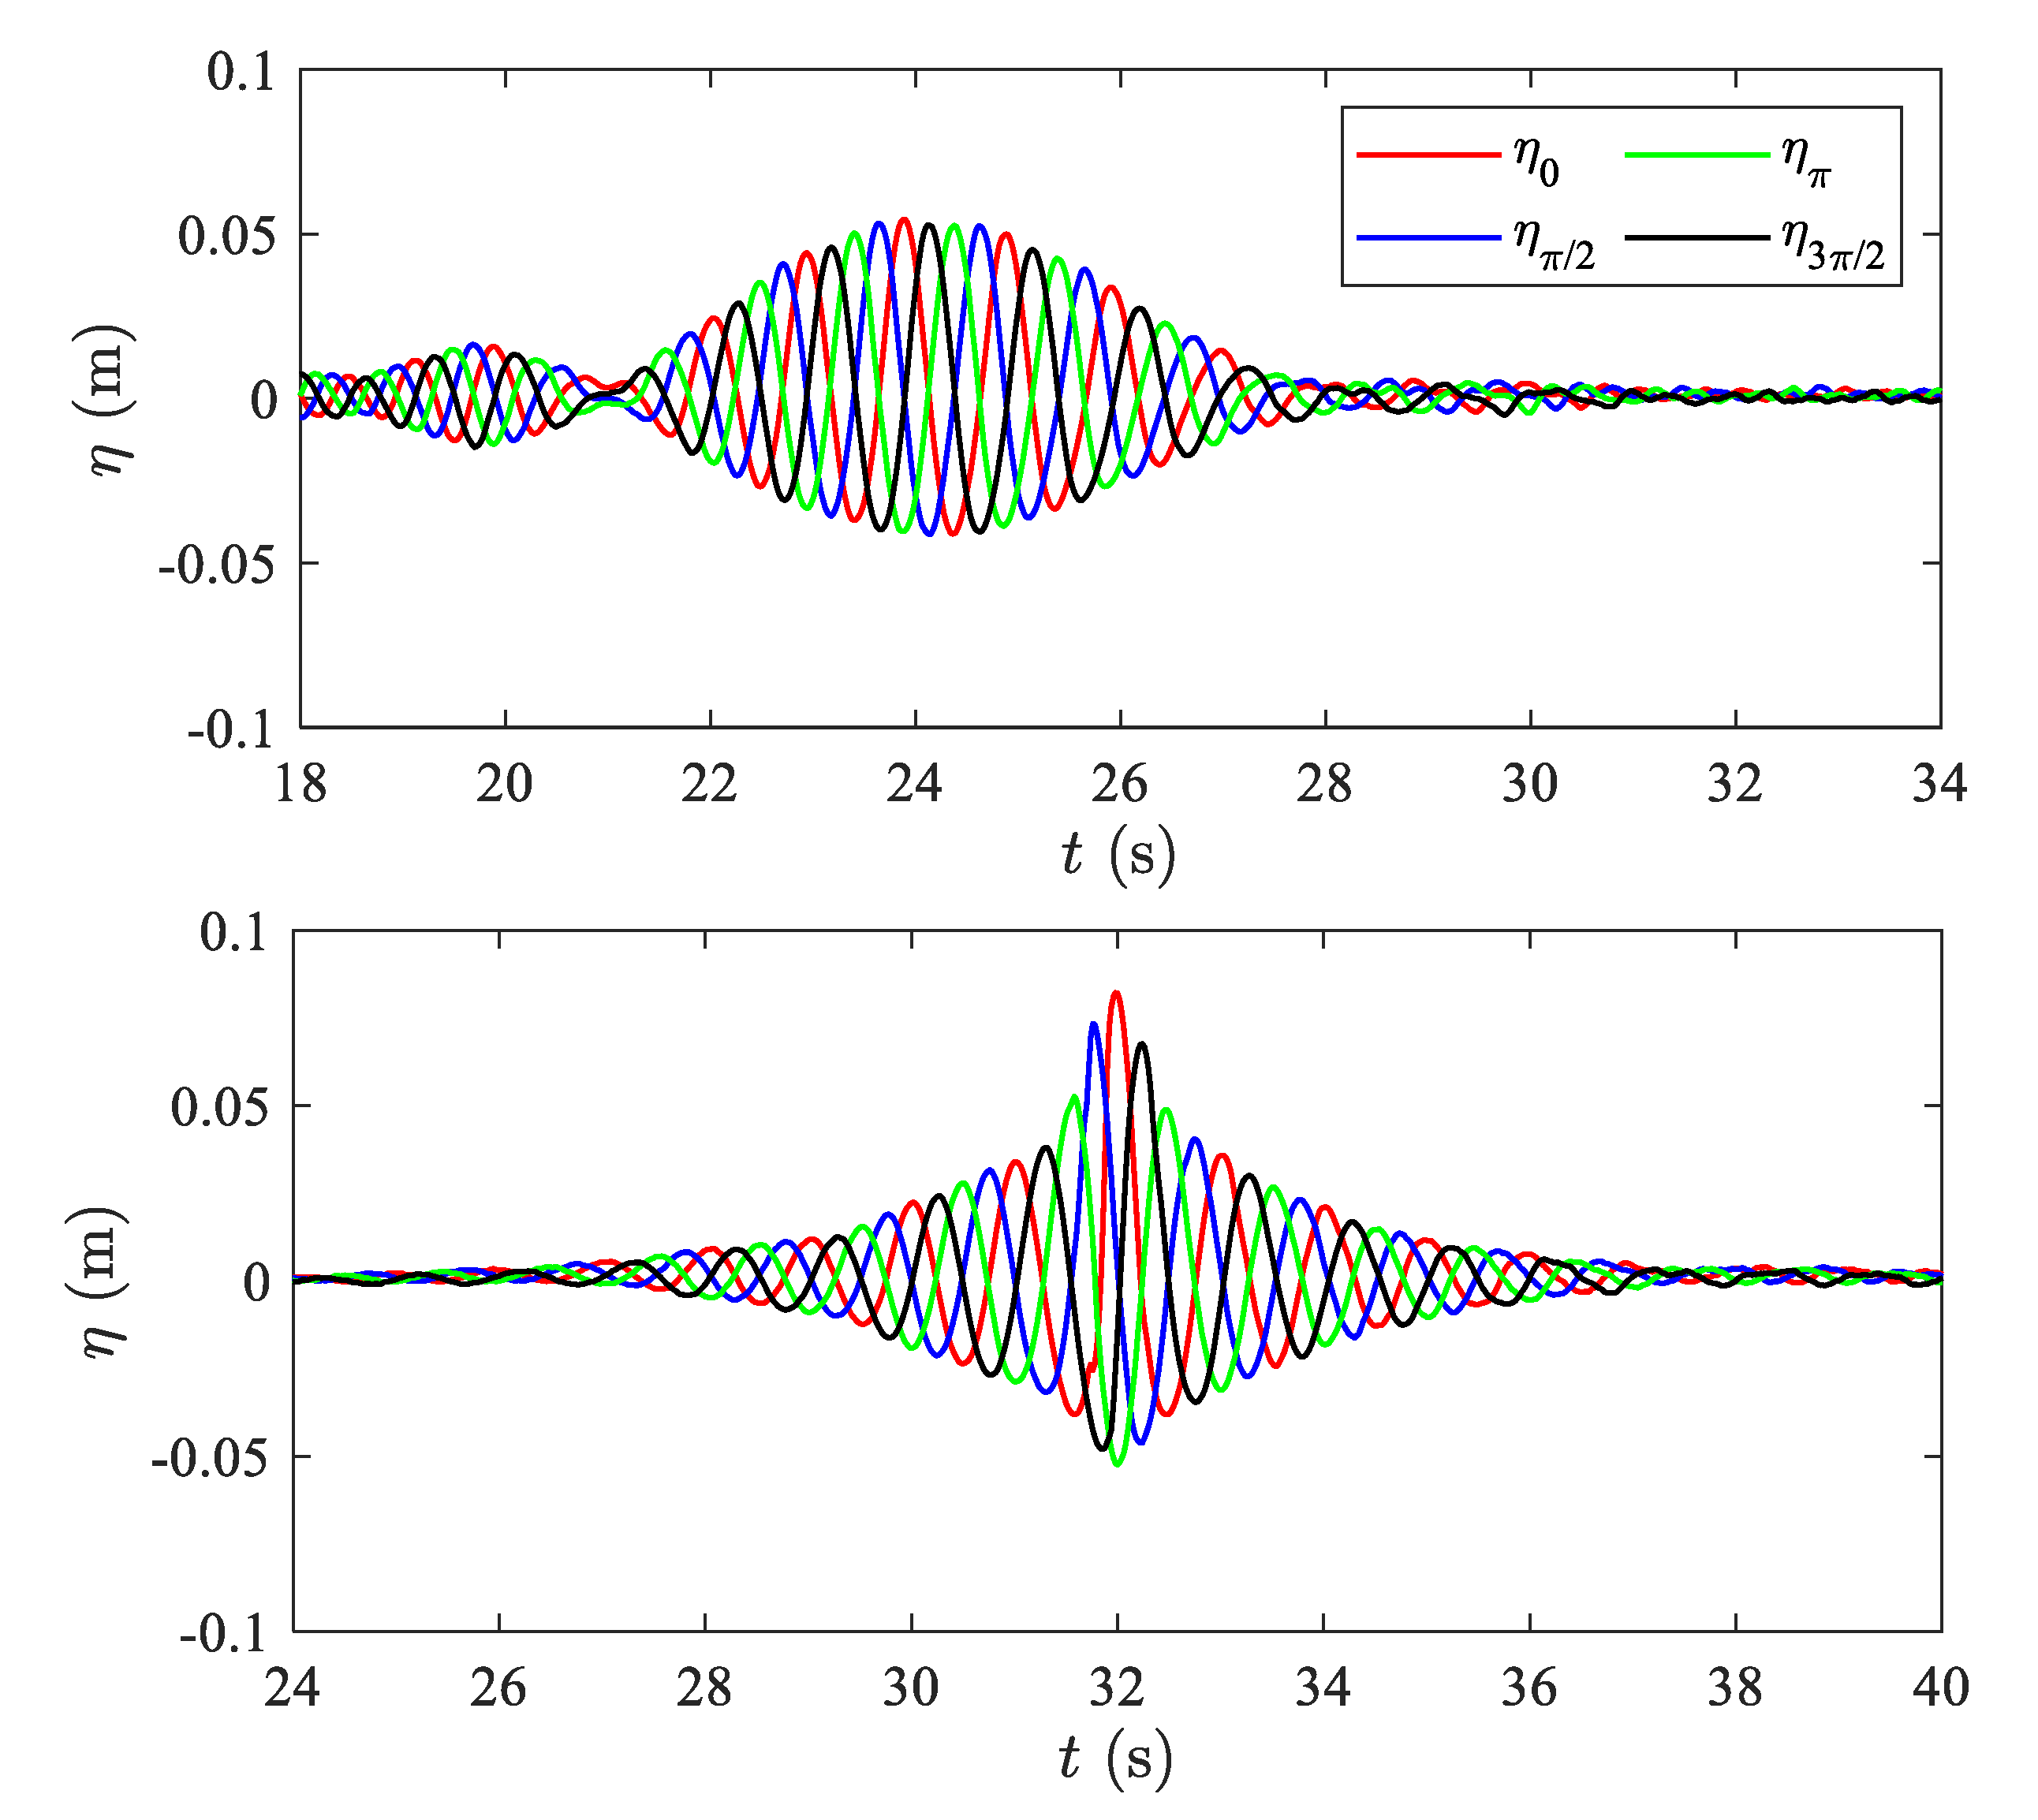
Figure 4.
Time history of the free surface elevation at the location of the model without the model in place; Tp = 2 s and Ap = 0.08 m.
Figure 4.
Time history of the free surface elevation at the location of the model without the model in place; Tp = 2 s and Ap = 0.08 m.
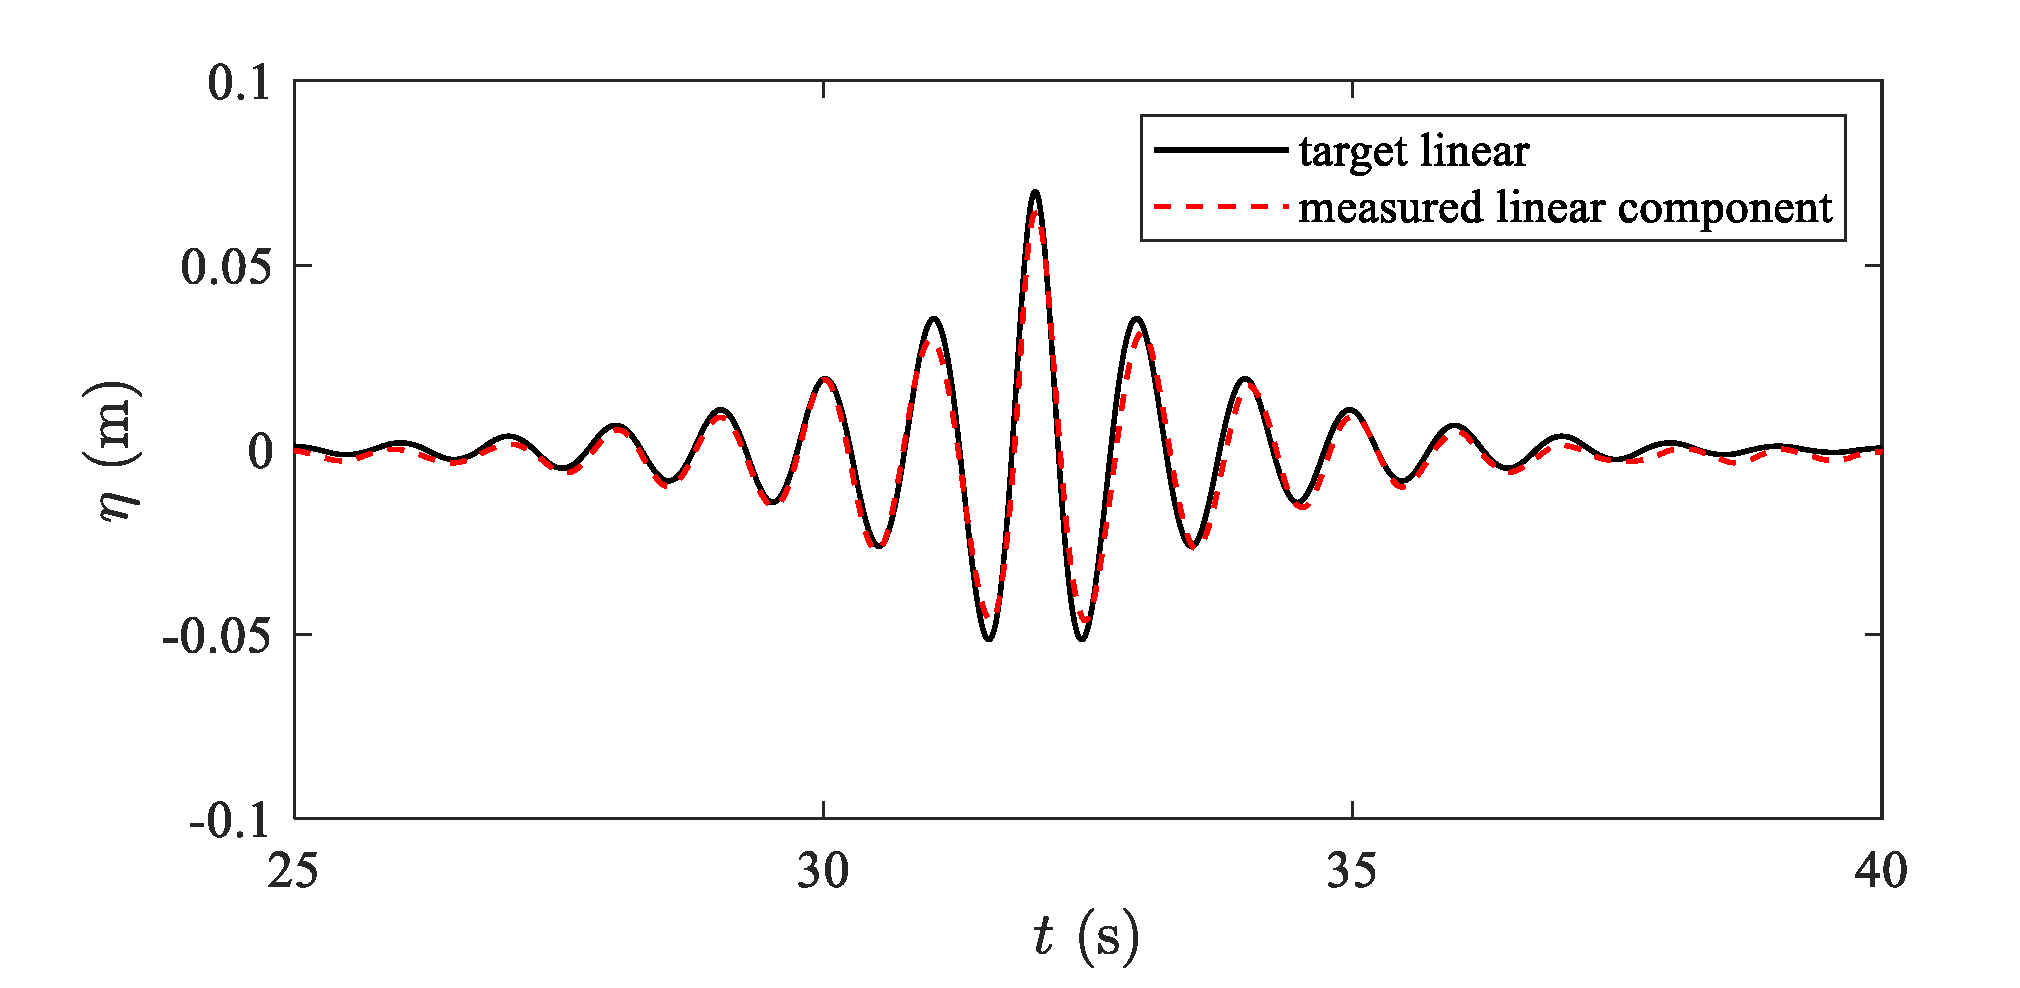
Figure 5.
Time histories of the free surface elevation and the wave impact force on the vertical truncated cylinder. From top to bottom are the free surface elevation measured at x = 2 m, 8.9 m, and the horizontal and vertical forces. Tp = 2 s, Ap = 0.08 m, and the air gap hag = 0 m.
Figure 5.
Time histories of the free surface elevation and the wave impact force on the vertical truncated cylinder. From top to bottom are the free surface elevation measured at x = 2 m, 8.9 m, and the horizontal and vertical forces. Tp = 2 s, Ap = 0.08 m, and the air gap hag = 0 m.

Figure 6.
Time histories of the free surface elevation at various locations (left) and the corresponding wave spectra (right). Here, Tp = 1 s, Ap = 0.07 m. From top to bottom are results at WG1, WG2 and WG3, respectively.
Figure 6.
Time histories of the free surface elevation at various locations (left) and the corresponding wave spectra (right). Here, Tp = 1 s, Ap = 0.07 m. From top to bottom are results at WG1, WG2 and WG3, respectively.
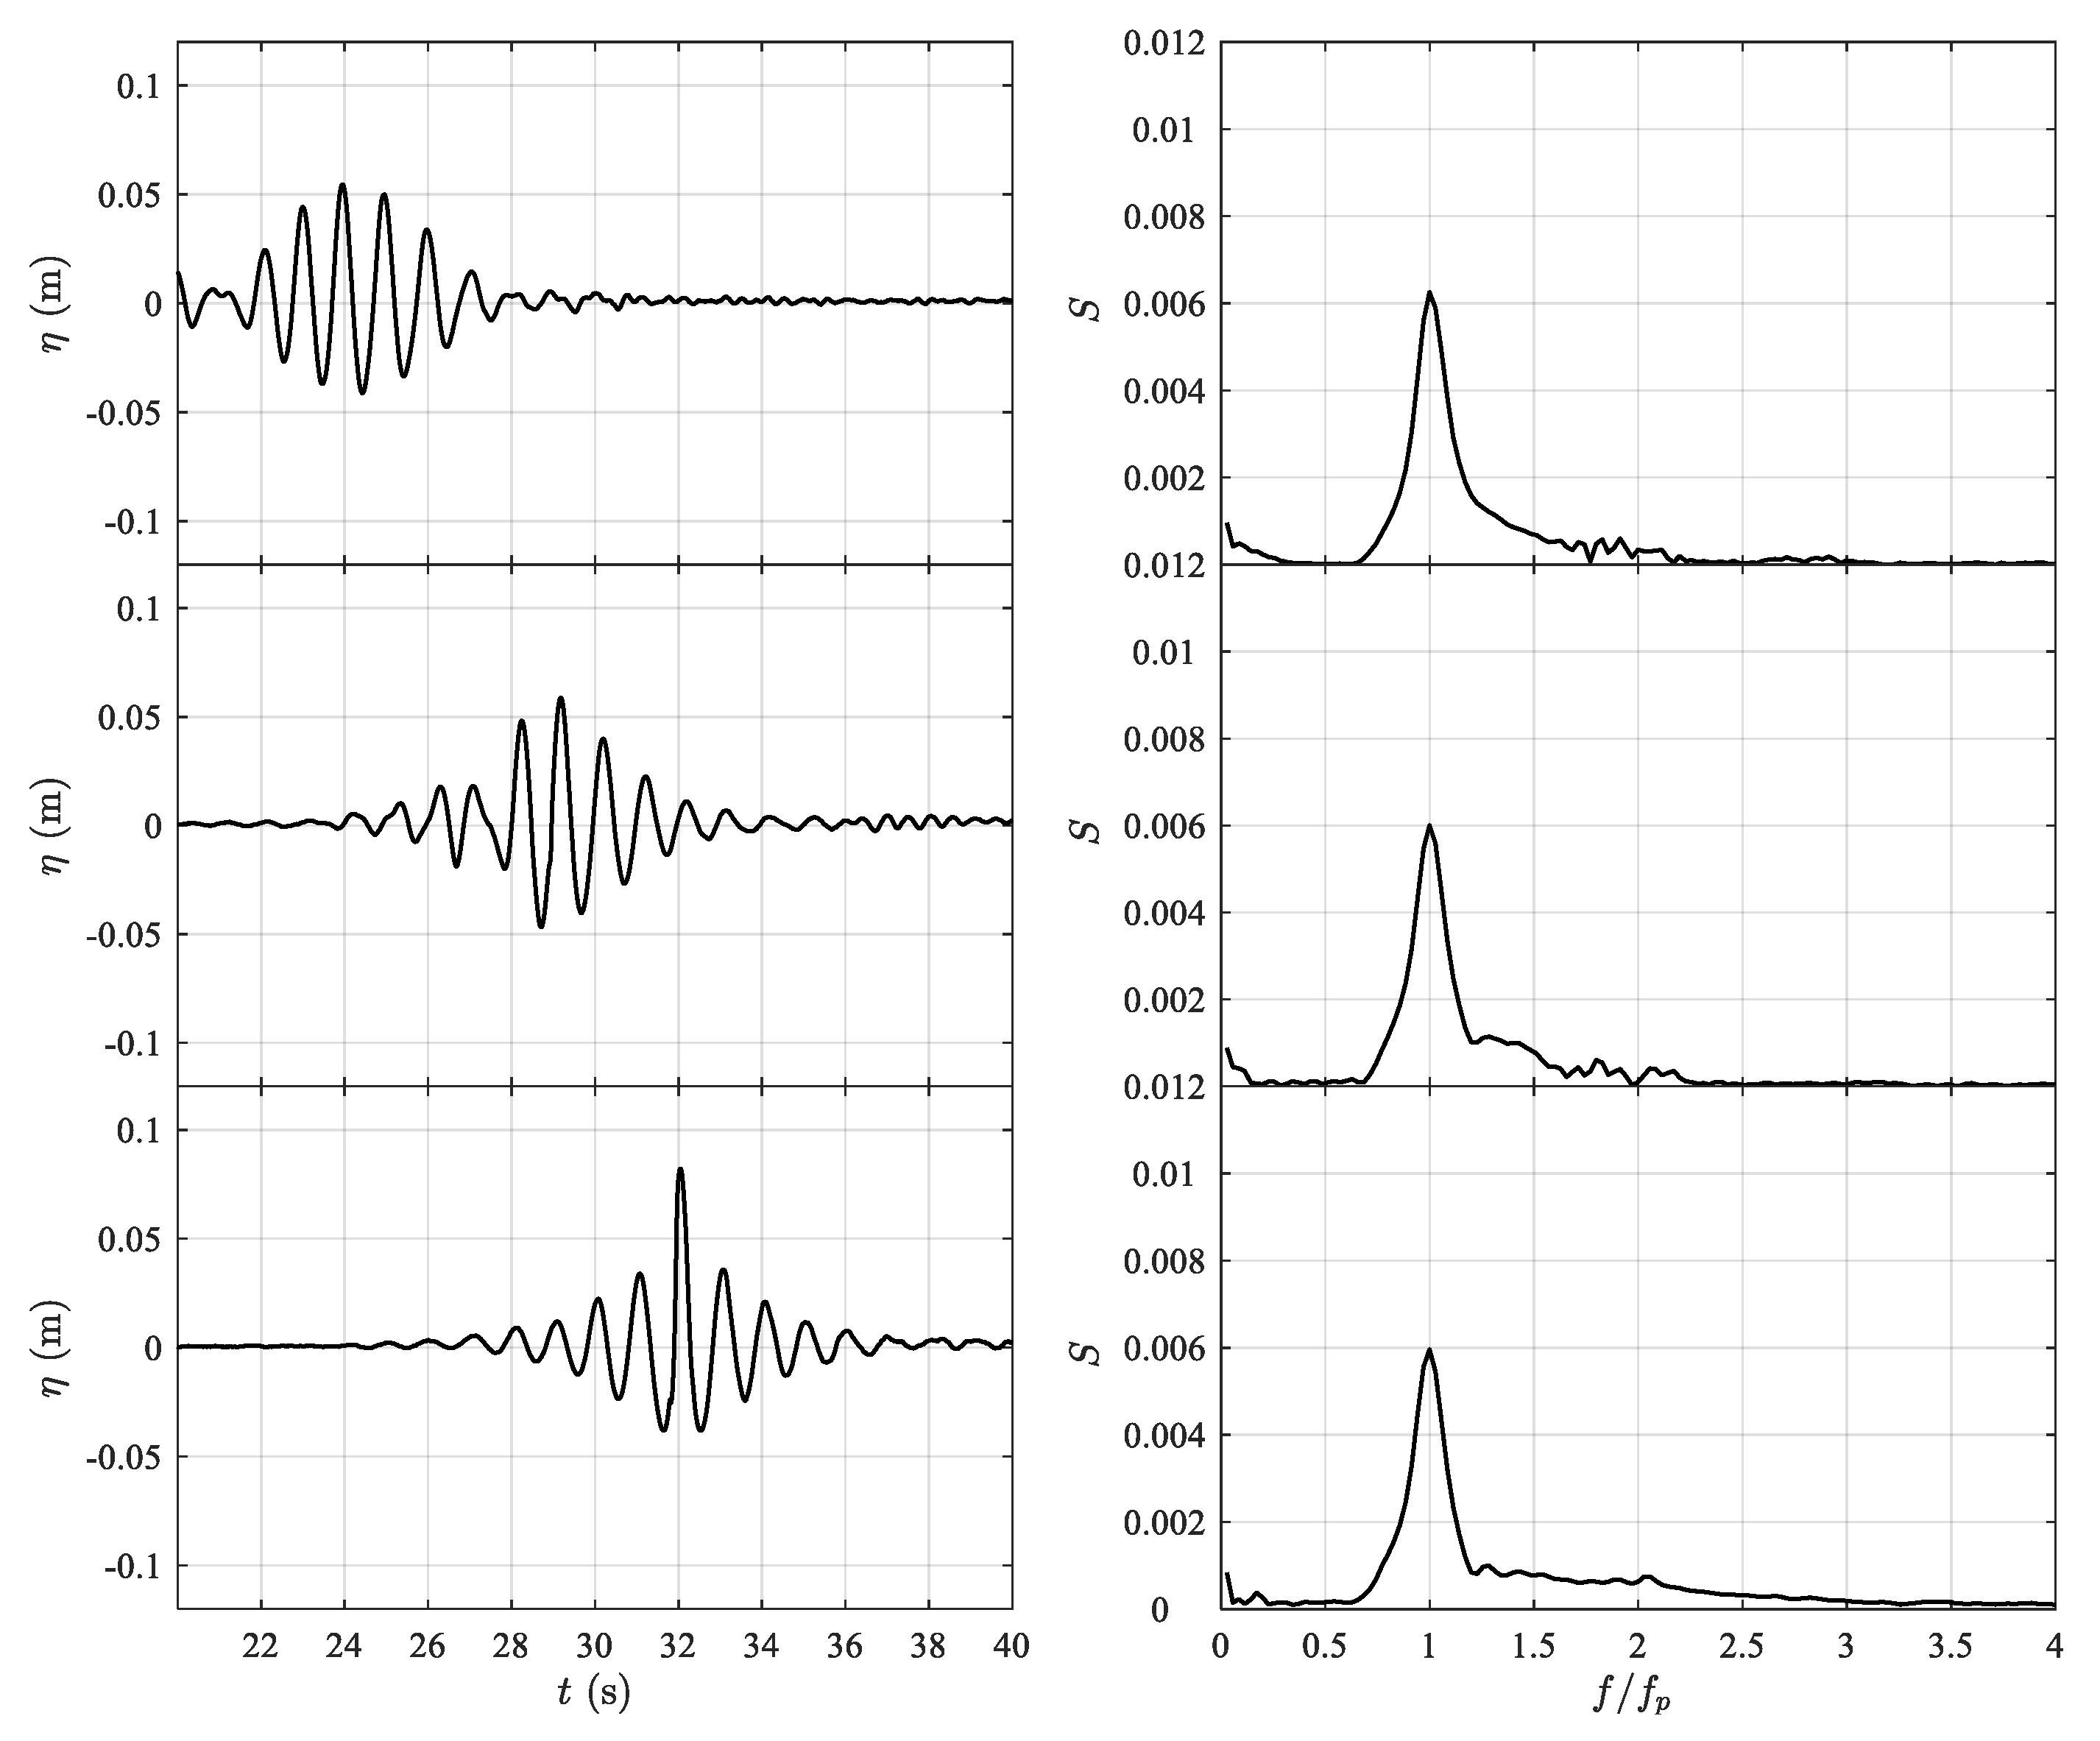
Figure 7.
Time histories of the free surface elevation at various locations (left) and the corresponding wave spectra (right). Here, Tp = 2 s, Ap = 0.08 m. From top to bottom are results at WG1, WG2 and WG3, respectively.
Figure 7.
Time histories of the free surface elevation at various locations (left) and the corresponding wave spectra (right). Here, Tp = 2 s, Ap = 0.08 m. From top to bottom are results at WG1, WG2 and WG3, respectively.

Figure 8.
Harmonic structure of the free surface elevation measured at WG3, the focus point. (Left): Tp = 1 s, Ap = 0.07 m. (Right): Tp = 2 s, Ap = 0.08 m. From top to bottom are results for 2nd order difference term, linear wave, 2nd order sum term, 3rd harmonic and 4th harmonic waves, respectively. Black lines: time histories, and red lines are the corresponding envelopes.
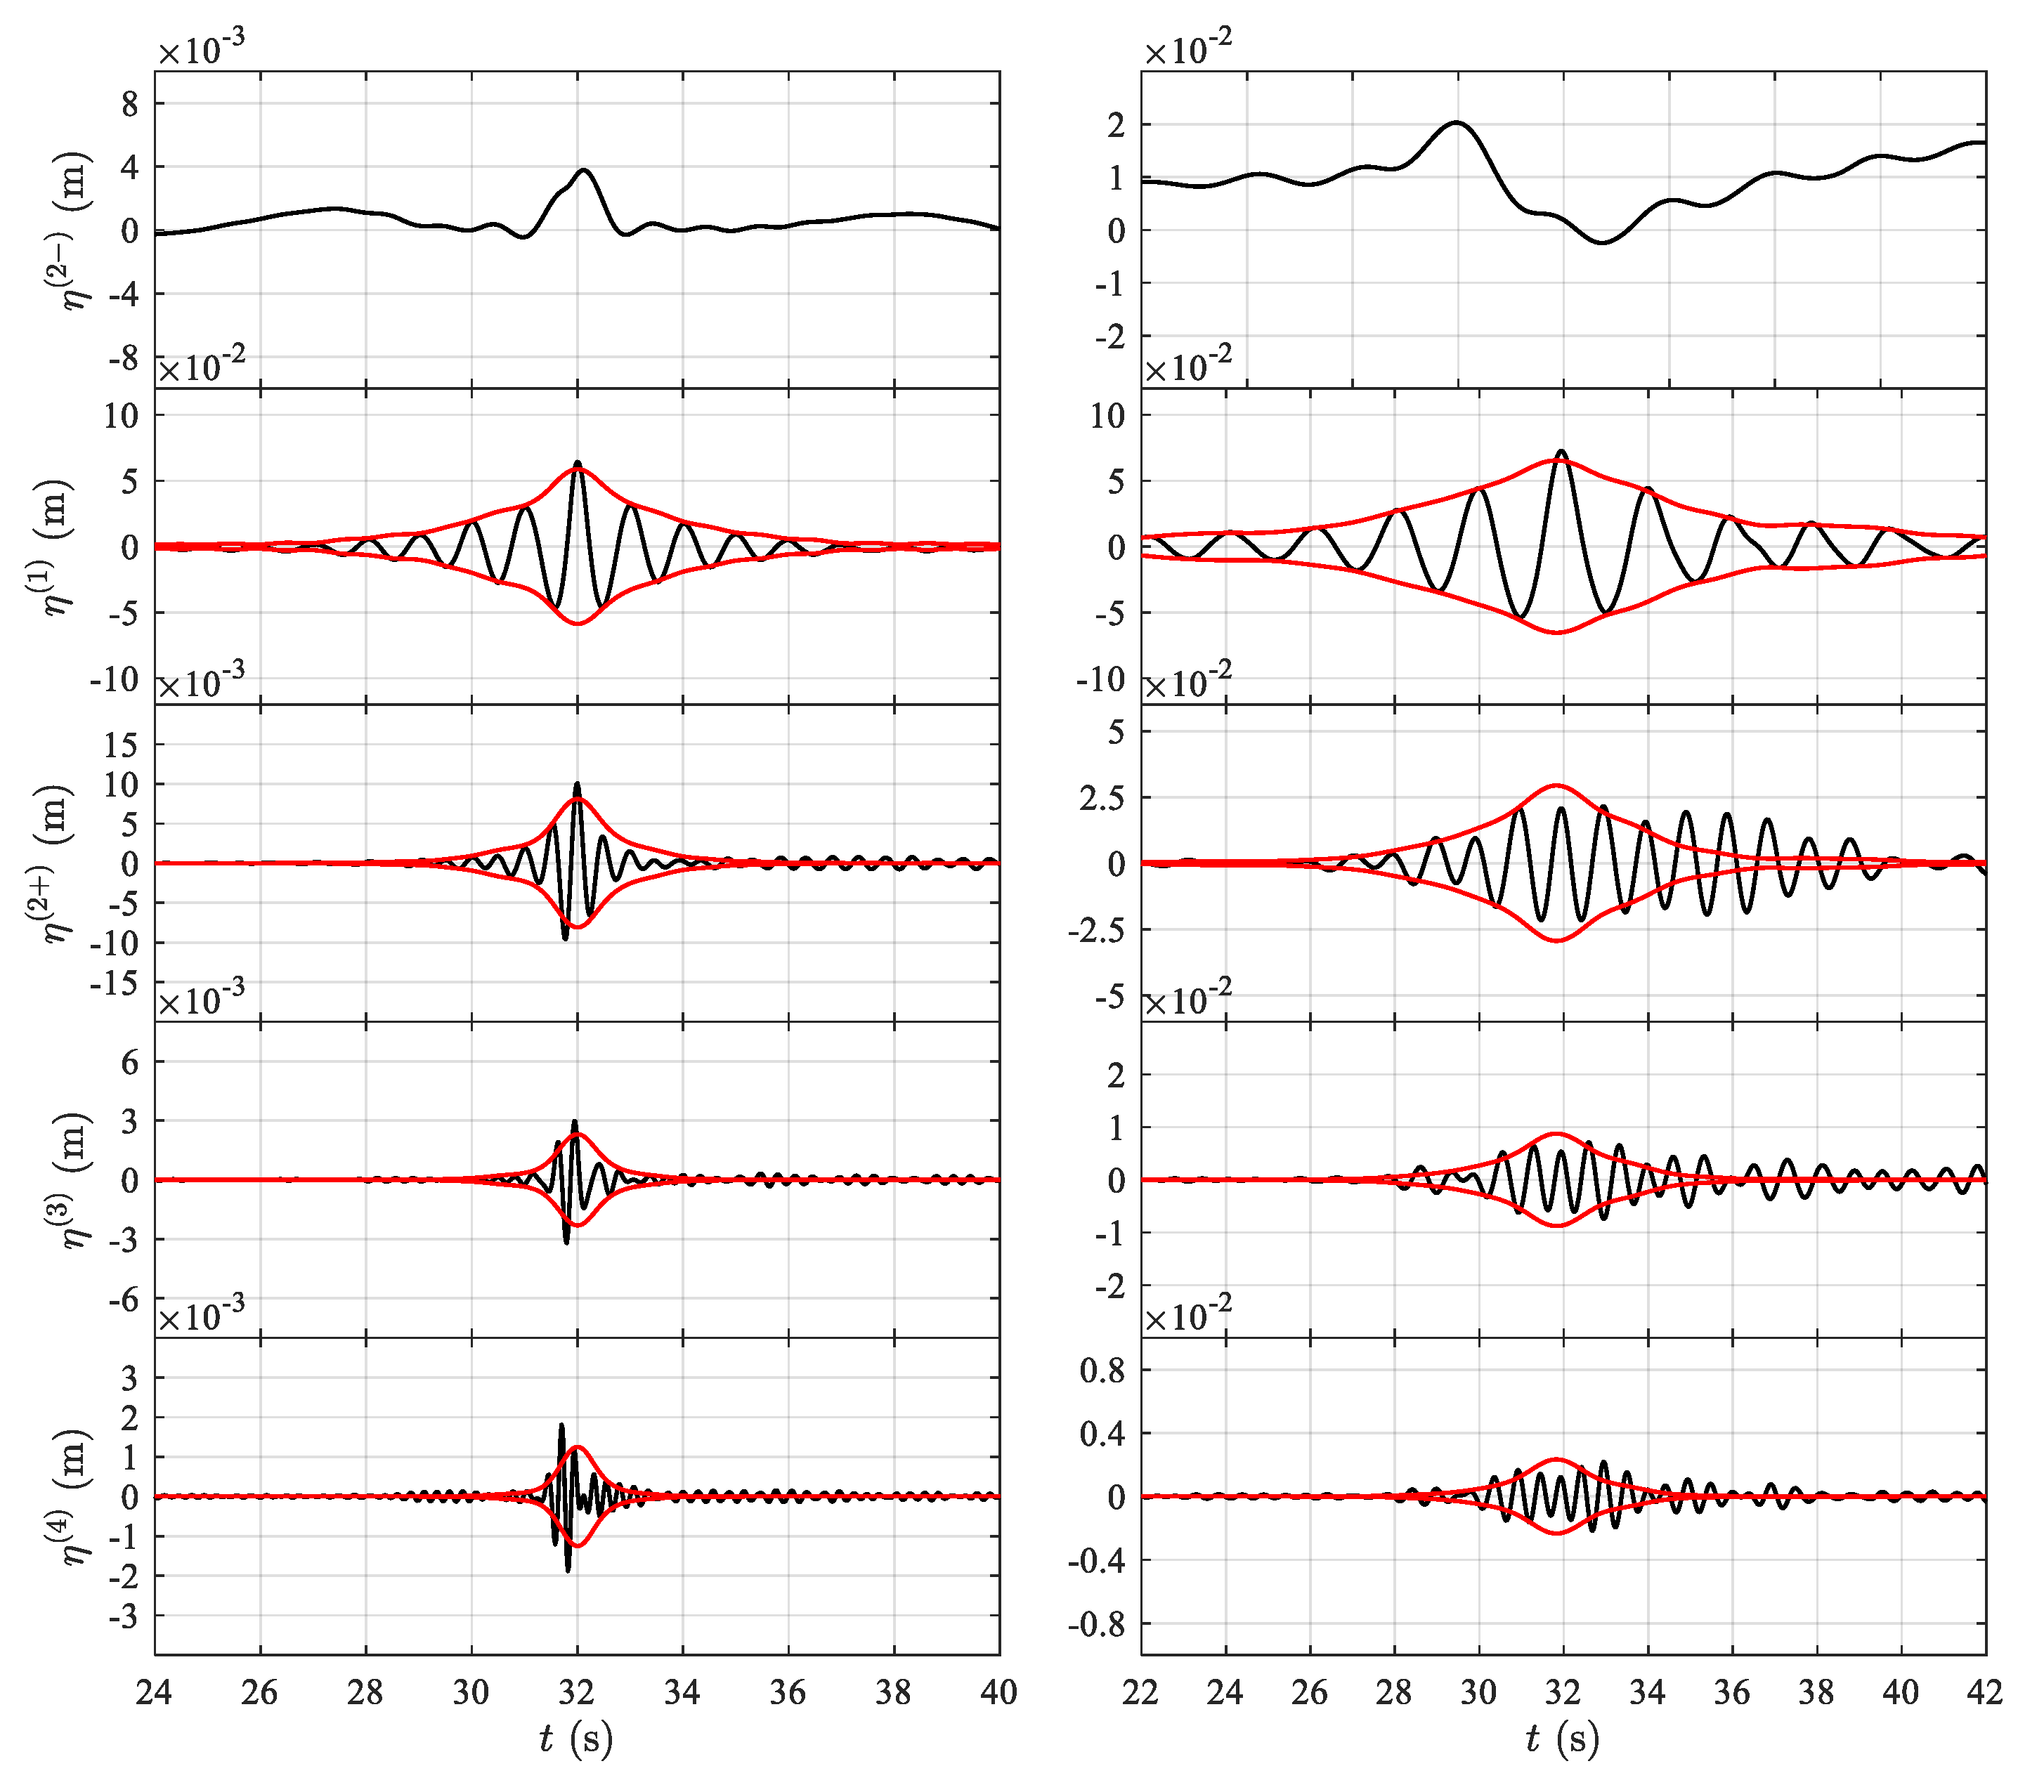
Figure 9.
Variation in the extracted harmonics with the Ursell number. (Left): linear wave component and 2nd-order harmonic wave. (Right): 3rd and 4th harmonics. Note the different scales in the y-axis.
Figure 9.
Variation in the extracted harmonics with the Ursell number. (Left): linear wave component and 2nd-order harmonic wave. (Right): 3rd and 4th harmonics. Note the different scales in the y-axis.
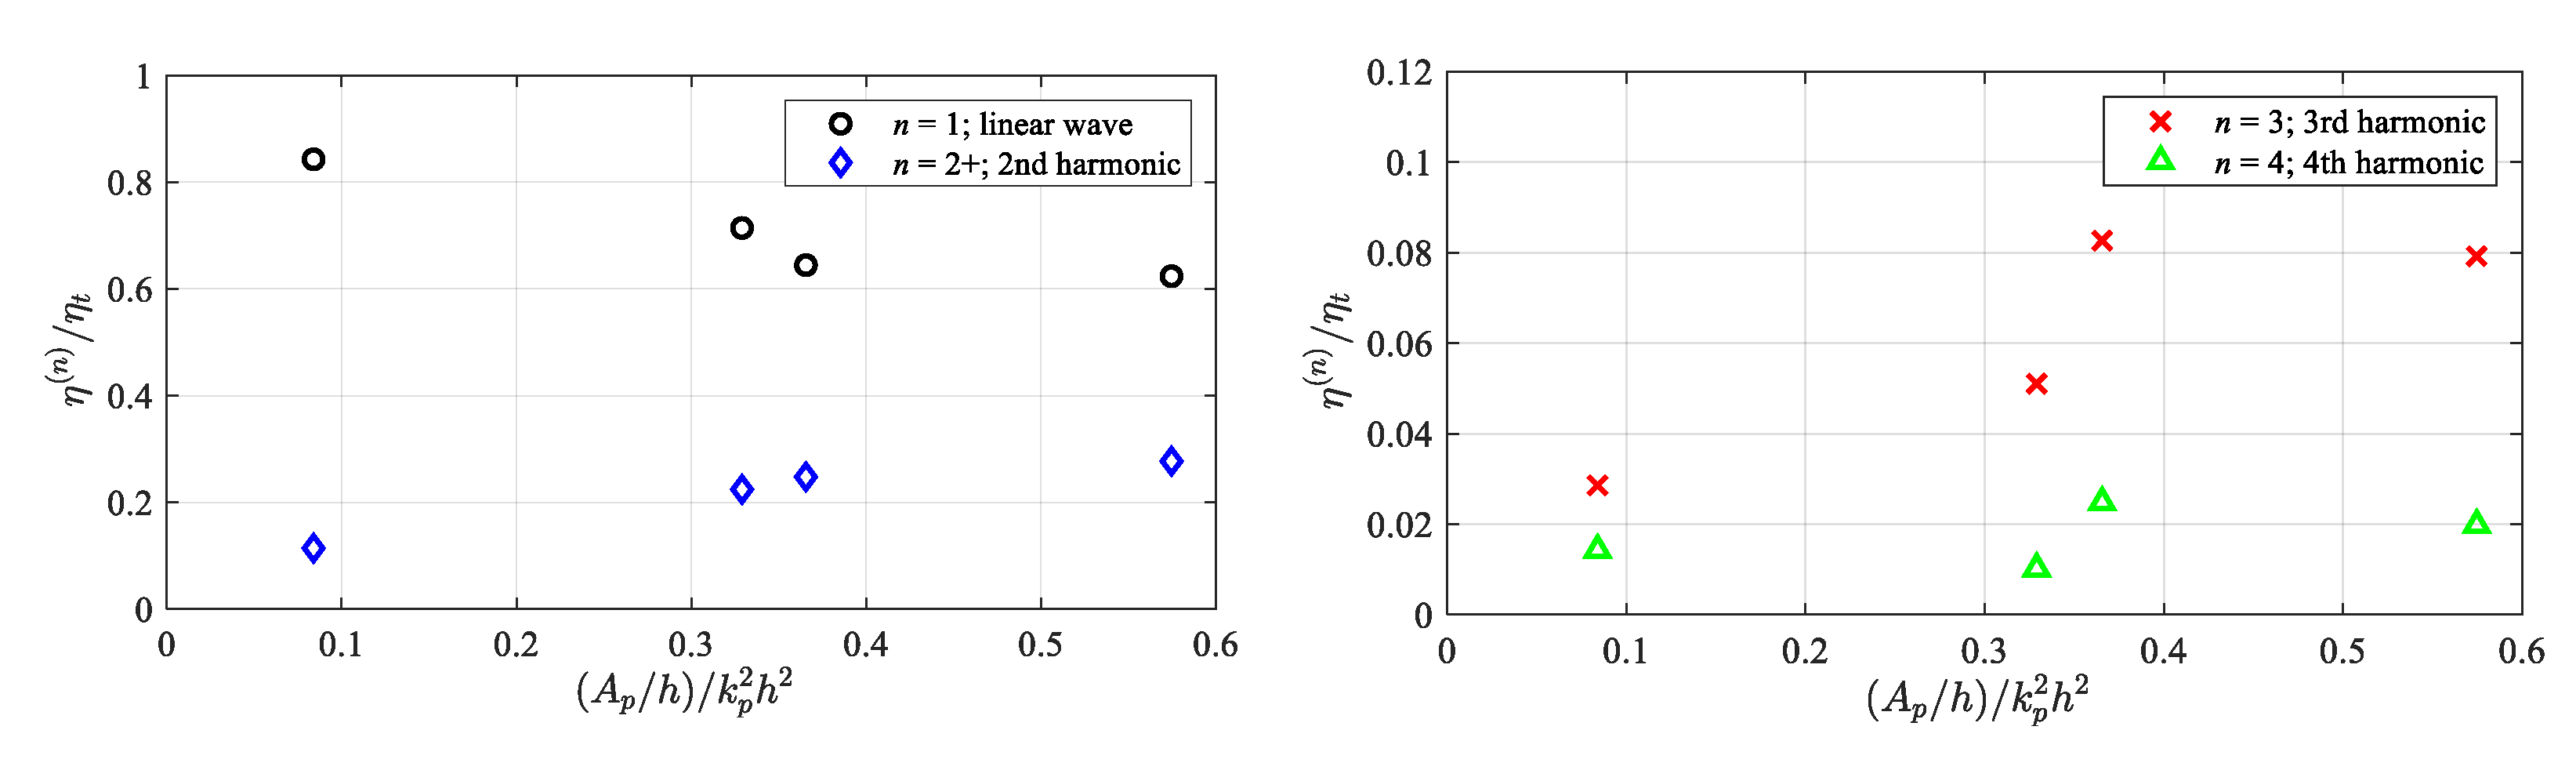
Figure 10.
Time histories of the disturbed free surface elevation at x = 8.9 m (top) and the horizontal (middle) and vertical (bottom) forces. The embedded subplots in the middle and bottom plots show the close-up views of the corresponding impact forces. Here, Tp = 1.5 s, Ap = 0.1 m, and the air gap hag = 0.06 m (red dashed line).

Figure 11.
Variation in the impact force on the truncated cylinder with the inundation level. (Left) horizontal forces. (Right) vertical forces.
Figure 11.
Variation in the impact force on the truncated cylinder with the inundation level. (Left) horizontal forces. (Right) vertical forces.

Figure 12.
Variation in the peak horizontal force with the inundation level. The horizontal force is made non-dimensional using ρg(AL)2hd.
Figure 12.
Variation in the peak horizontal force with the inundation level. The horizontal force is made non-dimensional using ρg(AL)2hd.

Table 1.
Incoming wave fields considered in this work.
| Tp (s) | h (m) | kp (m−1) | Ap (m) | R (m) | kpR | kpAp | h/λp | Ur |
|---|---|---|---|---|---|---|---|---|
| 1 | 0.35 | 4.41 | 0.07 | 0.0825 | 0.364 | 0.309 | 0.246 | 0.084 |
| 1.5 | 2.53 | 0.09 | 0.208 | 0.227 | 0.141 | 0.329 | ||
| 1.5 | 2.53 | 0.10 | 0.208 | 0.253 | 0.141 | 0.366 | ||
| 2 | 1.80 | 0.08 | 0.149 | 0.144 | 0.100 | 0.575 |
Disclaimer/Publisher’s Note: The statements, opinions and data contained in all publications are solely those of the individual author(s) and contributor(s) and not of MDPI and/or the editor(s). MDPI and/or the editor(s) disclaim responsibility for any injury to people or property resulting from any ideas, methods, instructions or products referred to in the content. |
© 2023 by the authors. Licensee MDPI, Basel, Switzerland. This article is an open access article distributed under the terms and conditions of the Creative Commons Attribution (CC BY) license (https://creativecommons.org/licenses/by/4.0/).
Share and Cite
MDPI and ACS Style
Liu, S.; Guo, X.; Yang, Y.; Lu, Y.; Chen, L. Extreme Wave Loading on a Vertical Circular Cylinder. Appl. Sci. 2023, 13, 8784. https://doi.org/10.3390/app13158784
AMA Style
Liu S, Guo X, Yang Y, Lu Y, Chen L. Extreme Wave Loading on a Vertical Circular Cylinder. Applied Sciences. 2023; 13(15):8784. https://doi.org/10.3390/app13158784
Chicago/Turabian StyleLiu, Shi, Xinran Guo, Yi Yang, Yatao Lu, and Lifen Chen. 2023. "Extreme Wave Loading on a Vertical Circular Cylinder" Applied Sciences 13, no. 15: 8784. https://doi.org/10.3390/app13158784
Note that from the first issue of 2016, this journal uses article numbers instead of page numbers. See further details here.