

A Multimodal Deep Learning Model Using Text, Image, and Code Data for Improving Issue Classification Tasks

1
Department of AI Convergence Engineering, Gyeongsang National University, 501 Jinjudaero, Jinju-si 52828, Gyeongsangnam-do, Republic of Korea
2
Department of Aerospace and Software Engineering, Gyeongsang National University, 501 Jinjudaero, Jinju-si 52828, Gyeongsangnam-do, Republic of Korea
*
Authors to whom correspondence should be addressed.
Appl. Sci. 2023, 13(16), 9456; https://doi.org/10.3390/app13169456
Submission received: 27 July 2023
/
Revised: 14 August 2023
/
Accepted: 16 August 2023
/
Published: 21 August 2023
(This article belongs to the Topic Software Engineering and Applications)
Abstract
:Issue reports are valuable resources for the continuous maintenance and improvement of software. Managing issue reports requires a significant effort from developers. To address this problem, many researchers have proposed automated techniques for classifying issue reports. However, those techniques fall short of yielding reasonable classification accuracy. We notice that those techniques rely on text-based unimodal models. In this paper, we propose a novel multimodal model-based classification technique to use heterogeneous information in issue reports for issue classification. The proposed technique combines information from text, images, and code of issue reports. To evaluate the proposed technique, we conduct experiments with four different projects. The experiments compare the performance of the proposed technique with text-based unimodal models. Our experimental results show that the proposed technique achieves a 5.07% to 14.12% higher F1-score than the text-based unimodal models. Our findings demonstrate that utilizing heterogeneous data of issue reports helps improve the performance of issue classification.
1. Introduction
For software maintenance, software developers utilize issue-tracking systems to quickly incorporate user requirements into their software products. While using the software products, users report bugs, feature suggestions, and other comments by creating issue reports. Developers can refer to the issue reports to make changes to the software products. However, the number of issue reports rapidly increases. In the case of active open-source software projects, hundreds of issue reports are accumulated daily. Manually managing such issue reports requires a significant amount of effort from developers.
Researchers have conducted studies on automatically classifying issue reports to systematically manage issue reports [1,2,3,4,5,6,7,8,9,10]. Some of them [1,2,3,6,7,9] focused on classifying issue reports into a few categories, such as bug or non-bug. For example, Kallis et al. [7] employed FastText to classify issue reports into three categories: Bug, Enhancement, and Question. Other studies attempt to classify issue reports into more categories [5,8,10]. However, all of those studies solely utilized a single modality, thereby missing out on the potential benefits of incorporating heterogeneous information from issue reports. As a result, those models struggled to attain a comprehensive understanding of the issue report due to the limitations imposed by the scarcity of information. Consequently, such a single modality hinders the potential for substantial enhancements in issue classification performance.
In this paper, we notice that issue reports contain various types of information, including textual titles, body contents, images, videos, and code. Figure 1 demonstrates an issue report that contains text, code, and images together. This is an example of an issue report in VS Code with issue number #147154. We expect that not only text data but also image and code data of issue reports can contribute to the performance of the issue classification, because the additional data can elaborate the representations of issue reports. Therefore, we propose MulDIC, a multimodal deep learning-based issue classification model that uses text, image, and code data of issue reports.
To evaluate the proposed model MulDIC, we conducted experiments to examine whether the proposed multimodal model, MulDIC, which combines text, image, and code data can improve the performance of issue classification. For the experiments, we selected four projects with many issue reports: VS Code, Kubernetes, Flutter, and Roslyn. With the four projects, we compared the performance of our proposed multimodal model with that of the state-of-the-art unimodal model proposed by Cho et al. [10]. Our experimental results showed that our proposed approach achieved a higher F1-score by 5.07% to 14.12% compared to the existing method, improving the issue report classification performance in all projects.
The contributions of our study are as follows:
- 1.
- We propose the first multimodal model that combines text, image, and code modalities for issue classification tasks.
- 2.
- We evaluate the effectiveness of our proposed multimodal model by comparing a text-based unimodal model in issue classification tasks.
- 3.
- We analyze the effect of image and code modality by experimenting with a combination of several different modalities.
- 4.
- We make the code and datasets we used for our experiment available on GitHub.
2. Related Works
We classify related works in this paper into two categories: studies on (1) classifying issue reports in open-source projects and (2) applying multimodal deep learning in software engineering and other domains.
2.1. Issue Report Classification
Researchers proposed machine learning techniques and deep learning techniques for classifying issue reports. Fan et al. [2] and Pandey et al. [3] classified issue reports into bug or non-bug using machine learning techniques. Zhu et al. [6], Kallis et al. [7], Kim et al. [8], Zhifang, Liao, et al. [9], and Cho et al. [10] used deep learning techniques for the same task.
Fan et al. [2] proposed a two-stage issue report classification approach by combining textual data of an issue report with developer information. In the first stage, the approach extracts semantic perplexity features from an issue report’s textual data using a text-based classification model such as support vector machines (SVM), naive Bayes, and logistic regression. In the second stage, the approach classifies issue reports into bug or non-bug by applying logistic regression to the textual data of an issue report and developer information. The two-stage approach showed an average F1-score of 75.21% in the first quartile.
Pandey et al. [3] proposed an approach to classify issue reports into bug or non-bug using the summary part of an issue report. For the classification, the approach applies machine learning algorithms of naive Bayes, linear discriminant analysis, support vector machine (SVM), and logistic regression. The authors experimented with three open-source projects to evaluate the approach’s Precision, Recall, F1-score, and accuracy. The results showed an F1-score ranged from 71.11% to 72.15%.
Zhu et al. [6] proposed a deep learning-based approach for classifying issue reports into bug or non-bug. The approach collects issue data from different issue tracking systems and pre-processes them. To detect and correct misclassified issues, the approach uses k-nearest neighbor algorithm. Then, the approach labels issues with bug or non-bug tags using an attention-based bi-directional long short-term memory network. To evaluate the approach, the authors used open-source projects such as Apache, JBoss, and Spring framework. Their experimental results showed a micro F1-score of 85.6%.
Kallis et al. [7] conducted a study that classifies issue reports using existing labeling techniques [11,12,13]. Kallis et al. [7] proposed TicketTagger, an automated system that assigns suitable labels to issue reports opened on GitHub projects. When a developer posts an issue report on GitHub, TicketTagger assigns one of Bug, Enhancement, or Question to the issue report. TicketTagger achieved an F1-score of 82.3% to 83.1%.
Cho et al. [10] proposed a deep-learning model for classifying issue reports into relevant user manuals using CNN and RNN models. They also conducted a comparison experiment on the task of categorizing issues into relevant labels, which resulted in an F1-score of 54.34% for Notepad++ (3 labels), 52.73% for Komodo (2 labels), and 67.14% for VS Code (2 labels). The data used in this study consist of the title and body text of issue reports and user manuals. The study demonstrated that the proposed model effectively classifies issue reports, compared to the state-of-the-art approach, TicketTagger [7], for issue report classification.
Kim et al. [8] proposed a CNN−based approach for classifying bug reports into Production or Test. The approach uses textual features extracted from source files and bug reports. The approach trains a source file classifier that classifies a source file into a production file or a test file using the name and contents of the source file. Then, the approach fine-tunes the source file classifier to classify a bug report into a production bug report or a test bug report using the title and content of a bug report. Their experimental results showed a macro F1-score of 83.9%.
Zhifang, Liao, et al. [9] proposed a GitHub issue report classification method named personal information fine-tuning network (PIFTNet). They utilized transfer learning and the submitter’s personal information to classify issue reports into bugs or non-bugs. The method involves fine-tuning the pre-training parameters in BERT and using nine traits reflecting submitter’s project familiarity and influence. Thus, it combines the text characteristics and the characteristics of the submitter’s personal information to construct the classification model. The experimental results showed the proposed method’s superiority, achieving an 85.55% F1-score.
Existing studies on classifying issue reports used only a single modality. This means that the studies did not use various types of information, including text, images, and code of issue reports together. In this paper, we propose MulDIC, an issue classification method using three modalities from the three different kinds of data (i.e., text, images, and code of issue reports). We also evaluate the effectiveness of using three modalities of issue reports by comparing the performance of our MulDIC model with that of Cho et al.’s CNN model [10]. We would like to note that the performance values reported by existing studies were based on different data from different projects with different evaluation methods.
2.2. Application of Multimodal Deep Learning
2.2.1. Application of Multimodal Techniques in the Field of Software Engineering
Several studies in software engineering proposed multimodal techniques and successfully achieved higher performance than the unimodal techniques. They utilized multimodal approaches in bug localization [14], code editing [15], and bug report triage [16].
Hoang et al. [14] proposed a multimodal bug localization approach called NetML. NetML comprises three main components: feature extraction, graph construction, and integrator. The feature extraction component extracts multimodal input features from a bug report and a method. The graph construction component computes the similarity graph among bug reports and methods. The integrator component combines the input features and the similarity graph to generate a ranked list of methods based on relevancy scores. The experimental evaluation with 355 real bugs showed that NetML successfully localizes significantly more bugs than the four baseline approaches.
Chakraborty et al. [15] proposed an automated code editing tool called MODIT based on a multimodal neural machine translator. MODIT uses three modalities of information: edit location, edit code context, and commit messages. Given a code fragment that needs to be edited, the surrounding method body, and a commit message, MODIT automatically generates a set of patches. The evaluation showed that MODIT achieves better accuracy than applying the existing deep learning models of CodeBERT, GraphCodeBERT, and CodeGPT for code editing.
Zhang et al. [16] proposed SusTriage, a multimodal deep learning-based bug report triage system. SusTriage extracts the textual data and metadata from bug reports. Using the extracted dataset, SusTriage builds three recommendation models that classify developers into core, active, and peripheral developers. Then, SusTriage combines the three models based on ensemble learning. Finally, given a pair of bug reports and developers, SusTriage recommends suitable developers to resolve the bug report. The evaluation with Eclipse and Mozilla bug report datasets showed that SusTriage significantly outperforms state-of-the-art techniques on both accuracy and sustainability.
In software engineering, researchers have applied multimodal deep learning to achieve state-of-the-art results. They incorporated supplementary information to enhance task performance. For instance, Zhang et al. [16] utilized textual data and metadata to enhance their model’s comprehension of bug reports, but they did not fully exploit the comprehensive nature of bug reports beyond textual information. In contrast to those studies, we propose MulDIC, which utilizes comprehensive information of an issue. MulDIC leverages three modalities of text, code, and image, considering the characteristics of each modality.
2.2.2. Application of Multimodal Techniques in Other Fields
Multimodal deep learning has been explored across diverse fields. Summaira, Jabeen, et al. [17] conducted an extensive study on multimodal deep learning, incorporating modalities such as image, video, text, audio, body gestures, facial expressions, and physiological signals. Among those, there have been studies applying multimodal deep learning combining images and text, including visual-based referred expression understanding and phrase localization [18,19], as well as image and video captioning [20,21,22], text-to-image generation [23,24,25], and visual question answering (VQA) [26,27,28,29,30]. Antol et al. [26] developed a multimodal deep learning model for the visual question answering (VQA) task. They employed a model with two channels: an image and a text (question) channel. The image channel used VGGNet for feature extraction, while the text channel utilized LSTM to embed the textual data. They then combined the two channels’ features through element-wise multiplication to transform the data into a shared space and obtain the final classification result.
Lopez-Fuentes et al. [31], Kim et al. [32], Audebert et al. [33], and Palani et al. [34] also developed multimodal models using both visual and text information. Lopez-Fuentes et al. [31] proposed a multimodal deep learning model that combines image data and text metadata to retrieve social media posts containing important information about floods. Their model uses a convolutional neural network (CNN) for extracting visual features and a bidirectional LSTM network for extracting semantic features from the text metadata. The experimental evaluation showed that combining these two types of information improves the performance of retrieving flood-related posts.
Kim et al. [32] proposed a multimodal deep learning approach to support interpreting the intended message of information graphics. An information graphic refers to the visual representation such as lines or bar graphs in a document or popular media. The multimodal model uses pixel and text data to classify information graphics into six intention categories validated as useful for people with visual impairments. For this, the model utilizes CNN−based layers for processing pixel information graphics and a bag of words (BOW) for handling OCR-extracted textual information. The authors showed that the proposed multimodal method performs the best among the compared methods.
Audebert et al. [33] considered the visual and text information extracted from images to classify digitized documents. Their approach involves processing the visual and text information separately using CNN−based layers. First, they trained a CNN−based layer for visual information with grayscale document images resized at 384 × 384. For textual information, they used Tesseract OCR to extract text from images and conducted text embedding using FastText to feed the results to the CNN−based layer. Finally, they concatenated the image and text CNN−based layers. The authors validated their approach on the Tobacco3482 and RVL-CDIP datasets. The experimental evaluation showed that their multimodal approach outperforms the existing single modality approaches.
Palani et al. [34] introduced CB-Fake, a multimodal deep learning framework designed to identify fake news at the early stage by analyzing both the textual and visual content of the news article. The CB-Fake model incorporates CapsNet to extract crucial visual features from images and employs the pre-trained BERT language model to capture context-rich textual features from news articles. These features are synergistically fused to create a richer data representation, subsequently fed into a classification layer to determine whether the news is fake or real.
Some studies considered other modalities besides visual and textual information. Oramas et al. [35] proposed an approach for classifying music genres from different data modalities, including audio, text, and images. Their method involves training deep neural networks to learn intermediate representations from audio tracks, text reviews, and cover art images. They conducted experiments on single and multi-label genre classification. The experiments showed that fusing different modalities yields better results than using individual ones in the music genre classification task.
Huang et al. [36] proposed a fusion method for emotion recognition using two modalities: facial expressions and electroencephalogram (EEG) signals. The method trains a facial expression classifier to identify four primary emotional states: happiness, neutral, sadness, and fear. Additionally, the method trains two support vector machine (SVM) classifiers to detect EEG signals for each of the four primary emotional states and three levels of emotional intensity, strong, moderate, and weak. Finally, the model combines the decisions from the two classifiers to recognize emotions. The study demonstrates that combining facial expressions and EEG data alleviates the limitations of using a single modality in emotion recognition tasks.
Tripathi et al. [37] proposed a multimodal emotion recognition framework using three modalities: text, speech, and motion capture data. The method employed the best individual models for each modality and fused the three modalities through fully connected layers. The experiment with the IEMOCAP dataset [38] showed that the proposed approach achieves a more robust and accurate emotion detection than approaches with a single modality.
The studies above demonstrated the effectiveness of utilizing multimodal models in various tasks. In particular, the multimodal models in the studies outperformed the existing single-modality models. However, as far as we know, we are the first to propose the multimodal-based approach for issue classification tasks. Additionally, while previous studies have explored the combination of different modalities, none of them specifically utilized text, images, and code. Our approach leverages the characteristics of the three modalities of text, code, and image. Therefore, we combine the three modalities to capture comprehensive information in issue reports, including textual description, relevant code snippets, and accompanying visual content.
3. The Proposed Multimodal Model
Section 3.1 provides the overview of our proposed approach. Section 3.2 describes the pre-processing of different kinds of data. Section 3.3 explains the process of extracting features from text, images, and code. Section 3.4 explains the concatenation of several feature vectors.
3.1. Overview
We propose MulDIC, a multimodal model for classifying issue reports. The proposed model’s architecture is illustrated in Figure 2. In the illustration, “FC” represents “Fully-Connected”. As shown in Figure 2, the input data consist of three modalities: text, image, and code. The approach MulDIC preserves the distinctive features inherent to each modality by using CNN channels.
The proposed model, MulDIC, consists of a total of four stages:
- 1.
- To prepare the input data, MulDIC pre-processes text, image, and code data, respectively.
- 2.
- MulDIC processes the pre-processed text, image, and code data with respective CNN−based channels. The second stage generates three feature vectors corresponding to three modalities of text, image, and code data.
- 3.
- MulDIC uses an element-wise multiplication operation that combines the feature vectors generated from all modality data. Then, the proposed model has text, image, and code representations in a common representation space.
- 4.
- MulDIC performs a Softmax operation on the representations.
As a result, an issue report will be classified into one of two categories: “bug” or “feature”, as shown in Figure 2. Because we experiment with the feasibility of performance improvement by adopting a multimodal model in issue classification, we limit the classification of issue reports to only two “bug” and “feature” categories in this paper.
3.2. Stage 1: Data Pre-Processing
3.2.1. Text Pre-Processing
Text pre-processing involves extracting the useful information from raw text data and normalizing it to make it suitable for further analysis or modeling tasks. Figure 3 illustrates an example describing the text pre-processing procedure. Our proposed model pre-processes the text in the following order:
- 1.
- Case-folding: The model converts all words to lowercase to ensure case insensitivity for all text.
- 2.
- Tokenization: The model first splits the text in a document into individual sentences. The model then tokenized all sentences into a sequence of tokens by using the word_tokenize of the NLTK module in Python.
- 3.
- Stop-word removal: Stop-words are common words frequently occurring in all documents but do not provide meaningful information [39]. In order to retain only meaningful word tokens from the data, the model removes stop-words. We used the stop-words predefined in the NLTK module in Python and eliminated stop-words from all generated tokens. Additionally, we removed non-alphabetic tokens such as numbers.
3.2.2. Code Pre-Processing
Code data have a different structure and format from natural language in the text modality. To preserve the unique characteristics of code data, we apply pre-processing techniques that are specific to the code. Figure 4 is an example of the code pre-processing, and the model pre-processes the code in the following order:
- 1.
- Comment removal: The proposed model removes comments from the code to separate natural language from the code.
- 2.
- Special token replacement: To maintain the structure of the code, the model uses special tokens such as ‘\n’ and ‘\t’ to represent the indentation and line breaks that carry structural meaning in programming languages.
- 3.
- Case-folding: The model converts all words to lowercase to ensure case insensitivity for all code.
- 4.
- Tokenization: The model splits the code in a document into individual sentences. The model then tokenizes all sentences into a sequence of tokens by using the SpaceTokenizer of the NLTK module in Python.
3.2.3. Image Pre-Processing
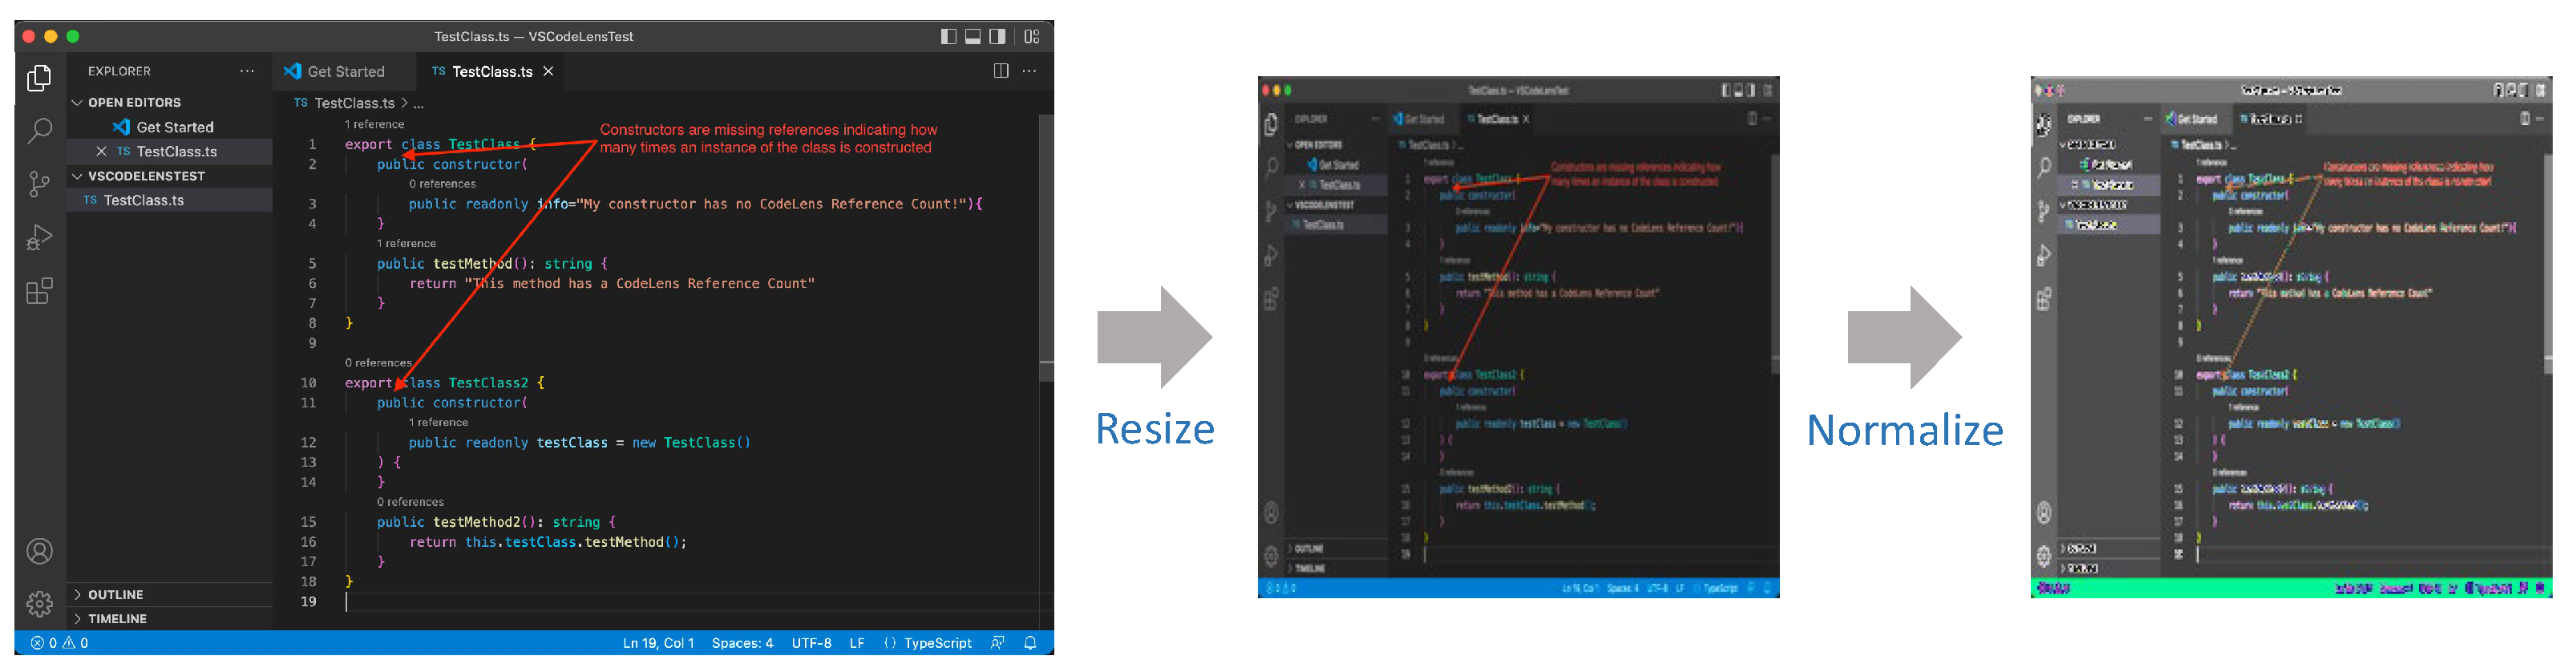
Image pre-processing is a process that standardizes the image data to facilitate learning and improve the performance of the model. Our proposed model pre-processes images through two main steps. Figure 5 shows an example of the image pre-processing.
- 1.
- Resize: The task involves resizing the image data to a consistent size. Since the collected images may have varying sizes, resizing them to a uniform size is necessary. We use the transforms module from Torchvision to resize all images to the size of 258 × 258.
- 2.
- Normalize: Next, the proposed model normalizes the image data to ensure a consistent distribution and scale of features. To achieve this, the model uses the transforms module to normalize the pixel values of the images so that they fall within the range of (−1 to 1).
3.3. Stage 2: Feature Extraction
Feature extraction is the process of extracting feature vectors from pre-processed data. The model first embeds the pre-processed data for feature extraction and then extracts important features through several layers.
First, we use an embedding layer to vectorize the pre-processed text and code data tokens. The embedding layer is a technique for generating random vectors that can represent tokens [10]. The text and code embedding is to represent the input data as a set of embedded tokens with zero padding. As the image data are vectorized during the pre-processing stage, the image data are not embedded in this stage.
Second, the embedded or vectorized text, image, and code data undergo computations through their respective CNN−based channels. We used the same CNN−based channel for text and code data. Figure 6 represents the structure of the CNN−based text and code channels.
The model in Figure 6 consists of four kernels of size (2, vector size), (3, vector size), (4, vector size), and (5, vector size), respectively. These kernels perform convolution operations with 64 output channels. The model also maintains three other layers: max-pooling, concatenation, and fully connected layers. The results of the convolutional operations go through a max-pooling layer and concatenation layer, resulting in a single vector. Then, a fully connected layer applies ReLU to the single vector, returning only positive values and performing linear operations. Finally, the features of the text or code data are extracted.
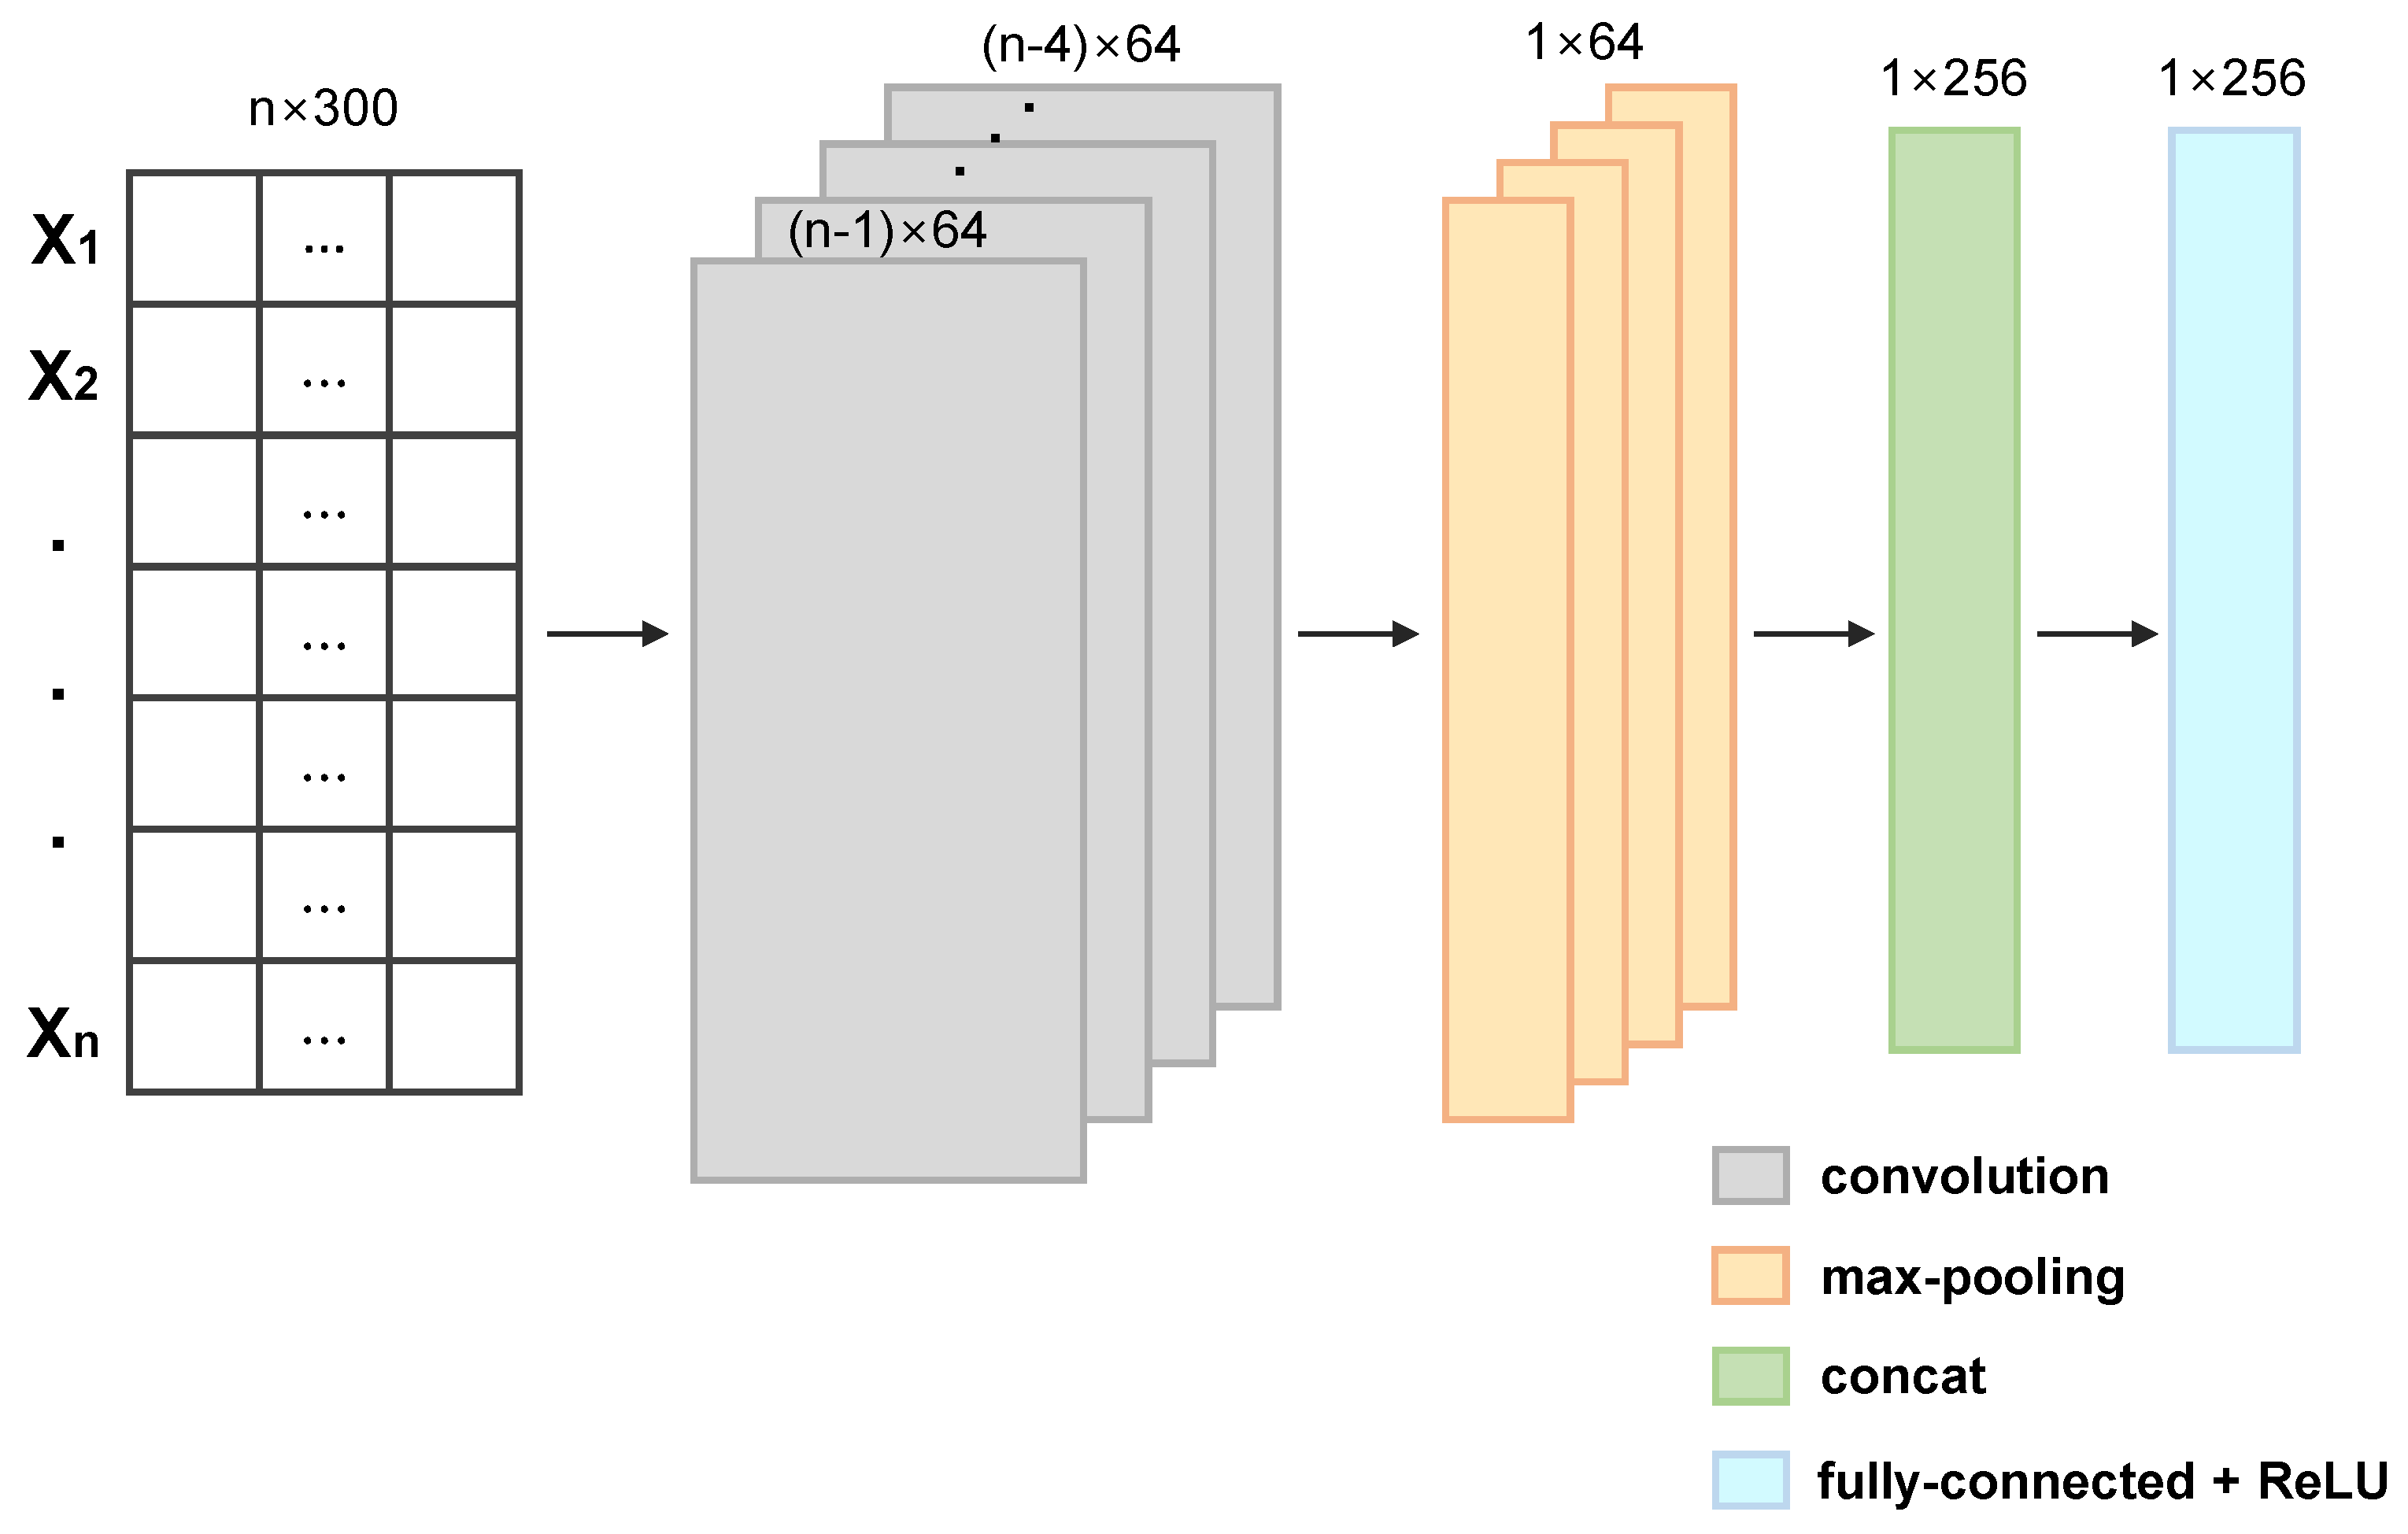
Meanwhile, we used another CNN−based channel for image data. Figure 7 illustrates the structure of the CNN−based image channel. The model in Figure 7 receives inputs of size (258 × 258). The model also maintains three convolution layers with a kernel size of (5, 5) followed by the ReLU operation. The model also applies a max-pooling operation twice with a kernel size of (5, 5). After the final max-pooling operation, the results go through a fully connected layer. Finally, it extracts the image features in a feature size of (1 × 1 × 256). Now, we obtain all of the representation vectors from the input data of each single modality.
3.4. Stage 3: Concatenation of Feature Vectors (FUSION)
Fusion refers to the process of integrating information extracted from different sources of single-modal data into a unified multimodal representation. In this process, the model combines and represents modality-specific feature vectors in a common space to understand the relationships and meanings between the data. We can fuse vectorized features from different information sources using simple operations such as weighted sum, element-wise multiplication, and concatenation [40]. In this study, the model uses the element-wise multiplication operation proposed by Antol, Stanislaw, et al. [26] as the fusion method. We chose the element-wise multiplication because it is an entry-level multimodal fusion technique which is simple to implement. The fused vector is fed into the next layer.
3.5. Stage 4: Classification into ‘Bug’ or ‘Feature’
Classification is the process of classifying the fused multimodal representation vector into ‘bug’ or ‘feature’. In this process, the proposed model outputs the final result of the issue report classification task, which is the main task of the model. The model receives the multimodal representation vector passed from the previous step and applies a fully connected layer and Softmax operation producing a class-specific probability output normalized between [0, 1], which can be either a ‘bug’ or ‘feature’. Here, the model is trained with CrossEntropyLoss as the loss function. Although the model performs binary classification, it utilizes the Softmax operation to facilitate future extension to multiclass classification if needed.
4. Experimental Setup
4.1. Research Questions
We aim to investigate whether a multimodal model can improve the performance of issue classification through our experiments. Specifically, we focus on the data types in the issue reports, namely, text, image, and code, to determine if each data type contributes to the improvement. To guide our research, we formulated the following detailed research questions:
- 1.
- RQ1. Does a multimodal model that combines text and image improve the performance of issue classification?
- 2.
- RQ2. Does a multimodal model that combines text and code data improve the performance of issue classification?
- 3.
- RQ3. Does a multimodal model that combines text, image, and code data improve the performance of issue classification?
4.2. Datasets
4.2.1. Project Selection
For our experiment, we selected open-source projects publicly available on GitHub. The reason for choosing open-source projects on GitHub is that GitHub provides an integrated issue management system, and users frequently submit issue reports on this platform. We investigated active projects on GitHub and sorted them based on the number of issue reports. After sorting many projects based on the number of issues, we manually investigated the top 100 projects. Among these projects, we investigated the labels attached to issue reports, and we chose projects that maintain ‘bug’ and ‘feature’ labels or the corresponding labels. We specifically chose projects that had issue reports labeled as either ‘bug’ or ‘feature’ since our proposed model aims to perform binary classification of issue reports into these classes.
Additionally, we verified whether issue reports simultaneously contained text, image, and code because we considered multimodal techniques for issue classification (as shown in Figure 1). Selecting issue reports that contain all three types of data is important to examine the impact of each data type on issue classification for the same issue report.
We finally chose the top four projects that met our selection criteria. The four projects are VS Code, Kubernetes, Flutter, and Roslyn. Table 1 presents the number of issue reports per label for each project on GitHub. The total number of issue reports for each selected project is as follows: VS Code (160,218 issues), Kubernetes (115,035 issues), Flutter (118,576 issues), and Roslyn (66,464 issues). Among them, the number of issue reports with the labels ‘bug’ or ‘feature’ is as follows: VS Code (48,427 issues), Kubernetes (18,243 issues), Flutter (23,004 issues), and Roslyn (16,706 issues).
Each project’s issue reports have unique characteristics. In the case of VS Code, the issue reports primarily focus on development environment-related issues, with many reports addressing problems encountered during task execution. For Kubernetes, many issue reports are related to container management and orchestration. Furthermore, there are specific platform-related issues that are reported when running Kubernetes. In Flutter’s case, many issue reports pertain to mobile app development, covering topics such as UI, compatibility, and app performance. Lastly, in the case of Roslyn, there is a significant number of issue reports related to C# and VB.NET code analysis. These reports include problems such as static code analysis, code optimization, and the discovery of potential bugs. In this experiment, we collected data from projects with these heterogeneous characteristics.
4.2.2. Data Collection
The process of collecting issue reports for each project, namely, VS Code, Kubernetes, Flutter, and Roslyn, was as follows. We collected issue reports labeled as ‘bug’ or ‘feature’. We collected these labels to compare the classification performance of our proposed model with that of the existing method, a CNN−based approach that showed good performance (Cho et al. [10]). Additionally, we collected issue reports for each project that had at least one image and at least one code snippet present. The ‘Original Data’ column of Table 2 represents the collected data.
For VS Code, we collected a total of 2331 data samples. Among them were 1351 samples labeled as ‘bug’ and 980 samples labeled as ‘feature’. In the case of Kubernetes, we collected 1014 data samples, with 866 samples labeled as ‘bug’ and 148 samples labeled as ‘feature’. As for Flutter, we collected 2820 data samples, consisting of 2061 ‘bug’ samples and 759 ‘feature’ samples. Lastly, we collected 1604 data samples for Roslyn, including 1341 bug and 263 feature samples.
4.2.3. Data Sampling
The collected data showed significant class imbalance across all projects. Such data imbalance can negatively impact the classification process by ignoring the characteristics of the minority class and biasing towards the majority class [41,42]. To address this issue, we can consider upsampling and downsampling. Downsampling reduces the quantity of data in the majority category to match the number of samples in the minority category. Downsampling offers advantages such as (1) freedom from overfitting compared to upsampling and (2) reduced computation time. Additionally, there is a high probability that users will not re-report issue reports related to outdated data. Therefore, (3) the loss of information due to data removal is not significant. Therefore, to mitigate the data imbalance problem, we apply downsampling. We retain all the data from the ‘feature’ class, while for the ‘bug’ class, we use a subset of the most recent data, matching the number of samples in the ‘feature’ class. The resulting dataset used for each experiment is as shown in the fourth column of Table 2, with an equal number of samples for each label. We used an 80:20 training/test split on this dataset. For example, out of 1960 issue reports, 1568 were used as a training set, and 392 were used as a testing set for the VS Code project.
4.3. Models
In the experiment, we compared the existing unimodal deep learning model that utilizes only text data with MulDIC which is our proposed multimodal deep learning model. We aimed to investigate the contributions of image and code data in issue report classification by conducting three experiments: Text-Image, Text-Code, and Text-Image-Code. In these experiments, we used the Text Only model, which solely relies on text data, as the baseline for comparison. The experiment involves four models: Text Only, MulDIC, MulDIC, and MulDIC. In the rest of this paper, MulDIC refers to MulDIC. We will provide detailed descriptions of each model in the following subsections.
4.3.1. Unimodal Model
- Text OnlyThe Text Only model utilizes only the text data from issue reports to classify them into bug or feature categories. The model uses downsampled issue report data for each project, as shown in Table 2. We used the Text Only model as the baseline for comparison with the multimodal models.
4.3.2. Multimodal Models
- MulDICThe MulDIC model utilizes text and image data from issue reports to classify them into bug or feature categories. Similarly to the baseline model, the model uses each project’s downsampled issue report data. We compared the performance of the Text Only model (baseline), which uses only text data, and the MulDIC model, which uses text and image data.
- MulDICThe MulDIC model utilizes text and code data from issue reports to classify them. Similarly, we employed downsampled issue report data for model training. We compared the performance of the Text Only model (baseline) and the MulDIC model, which utilizes text and code data.
- MulDICThe MulDIC model represents the final proposed model in this study, which utilizes the text, image, and code data from issue reports. Similarly, we employed each project’s downsampled issue report data for classification into relevant labels. We compared the performance of the Text Only model (baseline) and the MulDIC model, which utilizes text, image, and code data. Additionally, we compared the performance of the MulDIC model with that of the MulDIC and MulDIC models.
4.4. Experimental Design
In this study, we conducted experiments to find answers to the research question set in Section 4.1. To accomplish this, we compared three proposed models (MulDIC, MulDIC, and MulDIC) with the baseline model (Text Only). We conducted all experiments on a per-project basis.
First, we performed modality-specific pre-processing on the sampled data to train the baseline and proposed models (see Section 3.2). We used the pre-processed data as input for each model, and the data used by each model are consistent across modalities. After inputting the data into the model, we extracted features for each modality (refer to Section 3.3). In the case of the three proposed multimodal models, we combined the extracted features from each modality (see Section 3.4). Next, we classified the received feature vectors into their respective classes and measured their performance by comparing the results to the ground truth (see Section 3.5). We performed this process for all models and compared the results obtained to evaluate the effectiveness of the proposed models.
To evaluate the value of multimodal models utilizing image and code data, we compared the classification performance of three proposed models with the baseline model. In the MulDIC and MulDIC models, we assessed the individual contributions of image and code data. In the MulDIC model, we examined the value of using image and code together. Furthermore, we compared the MulDIC model with the MulDIC and MulDIC models to evaluate the effectiveness of leveraging heterogeneous modalities.
4.5. Evaluation Metrics
The evaluation metrics used to measure the classification performance are Precision, Recall, and F1-score. We calculated these metrics for each class and utilized the weighted average based on the data distribution of each class. We calculated each evaluation metric as follows:
In the above equations, represents the i-th class, which consists of two categories: ‘bug’ and ‘feature’. is the ratio of issues predicted as correctly out of all the issues predicted as . is the ratio of issues correctly predicted as out of all the actual issues. F1-score is the harmonic mean of Precision and Recall.
5. Results
We present the overall results of the experiments conducted in this study in Figure 8. According to Figure 8, the multimodal model MulDIC which combined all three different kinds of data, text, image, and code showed the highest F1-score. We will discuss the details of the results in the following subsections.
5.1. RQ1. Results of the Text-Image Experiment
We first conducted the experiment that compared the Text Only model with the multimodal model that combined text and image data of issue reports. Table 3 shows the result. In Table 3, the “Project” column represents the target projects for the experiments, and “Model” indicates the experimental models. The “Precision”, “Recall”, and “F1-score” columns represent the performance evaluation metrics for each experimental model, with all values expressed in percentage (%) and rounded to two decimal places. Additionally, we highlighted the highest scores for each project in bold. The first row per each project in Table 3 corresponds to the Precision, Recall, and F1-score values of the Text Only model. The second row per each project in Table 3 corresponds to the Precision, Recall, and F1-score values of the the multimodal model MulDIC which combined text and image data.
With regard to the Precision values that are shown in the third column of Table 3, the Text Only model yielded a Precision of 68.45% and the MulDIC model a Precision of 79.60% for the VS Code project. The difference was 11.15%. In the case of Kubernetes, the Text Only model yielded a Precision of 66.91%, while the MulDIC model a Precision of 68.35%. The difference was 1.44%. For Flutter, the Text Only model yielded a Precision of 67.70%, while the MulDIC model yielded a Precision of 69.79%. The difference was 2.09%. For Roslyn, the Text Only model yielded a Precision of 62.92%, while the MulDIC model yielded a Precision of 66.13%. The difference was 3.21%. The MulDIC model outperformed the Text Only model across four different projects in terms of Precision.
With regard to the Recall values that are shown in the fourth column of Table 3, the Text Only model achieved a Recall of 68.27% for VS Code, 66.10% for Kubernetes, 67.66% for Flutter, and 62.86% for Roslyn. In comparison, the MulDIC model achieved a Recall of 77.92% for VS Code, 68.33% for Kubernetes, 69.41% for Flutter, and 66.04% for Roslyn. The MulDIC model made improvements in Recall of 9.65%, 2.23%, 1.75%, and 3.18% for VS Code, Kubernetes, Flutter, and Roslyn, when compared to the Text Only model.
With regard to the F1-scores that are shown in the fifth column of Table 3, the Text Only model achieved an F1-score of 68.36% for VS Code, 66.50% for Kubernetes, 67.68% for Flutter, and 62.89% for Roslyn. In comparison, the MulDIC model achieved an F1-score of 78.75% for VS Code, 68.34% for Kubernetes, 69.60% for Flutter, and 66.08% for Roslyn. The MulDIC model made improvements in F1-score of 10.39%, 1.84%, 1.92%, and 3.19% for VS Code, Kubernetes, Flutter, and Roslyn, when compared to the Text Only model.
These results indicate that the image data in issue reports are helpful in the issue classification task. This means that images are useful information for classifying issue reports. Therefore, when the model considers the text and image data of an issue report together, it gains a better understanding of the issue report.
5.2. RQ2. Results of the Text-Code Experiment
Second, we conducted the experiment that compared the Text Only model with the multimodal model which combined text and code data of issue reports. Table 4 showed the result. The second row of Table 4 per each project corresponds to the results of the Text-Code experiment.
The Precision values of the MulDIC model were 68.11% for VS Code, 79.97% for Kubernetes, 68.68% for Flutter, and 66.06% for Roslyn. The MulDIC model demonstrated a Precision improvement of 13.06%, 0.98%, and 3.14% for Kubernetes, Flutter, and Roslyn, compared to the Text Only model. However, when it comes to the VS Code project, the Precision value of the Text Only model is 0.34% higher than that of the MulDIC model.
The Recall values of MulDIC were 67.77% for VS Code, 78.33% for Kubernetes, 68.42% for Flutter, and 66.04% for Roslyn. The MulDIC model made improvements in Recall of 12.23%, 0.76%, and 3.18% for Kubernetes, Flutter, and Roslyn, respectively, when compared to the Text Only model. However, in VS Code, the performance of MulDIC is 0.50% lower than the Text Only model.
The F1-score values MulDIC were 67.94% for VS Code, 79.14% for Kubernetes, 68.55% for Flutter, and 66.05% for Roslyn. For Kubernetes, Flutter, and Roslyn, the MulDIC model showed an improvement of 12.64%, 0.87%, and 3.16% in the F1-score compared to the Text Only model. However, in the case of VS Code, The F1-score of MulDIC is −0.42% lower than that of the Text Only model.
We also compared the performance of MulDIC with that of MulDIC. In terms of Precision, MulDIC outperformed MulDIC in Kubernetes with 11.62% difference, while MulDIC outperformed MulDIC over the other three projects, VS Code, Flutter, and Roslyn with 11.49%, 1.11%, and 0.07% differences. MulDIC and MulDIC followed the same trend in terms of Recall and F1-score.
These results indicate that the code data in the issue reports can contribute to the issue classification task. This implies that code also provides valuable information for classifying issue reports. Consequently, integrating the text and code data of an issue report in the model enhances its comprehension of the issue report.
5.3. RQ3. Results of the Text-Image-Code Experiment
The fourth row of Table 5 per each project corresponds to the results of the Text-Image-Code experiment.
First, when compared to the Text Only model, all of the Precision, Recall, and F1-score values of the MulDIC model are higher than those of the Text Only model. The MulDIC models showed Precision improvements of 11.95%, 14.34%, 9.15%, and 5.03% for VS Code, Kubernetes, Flutter, and Roslyn. MulDIC demonstrated Recall improvements of 11.43%, 13.90%, 8.00%, and 5.07% for VS Code, Kubernetes, Flutter, and Roslyn. MulDIC made F1-score improvements of 11.69%, 14.12%, 8.57%, and 5.05% for VS Code, Kubernetes, Flutter, and Roslyn.
Second, when compared to the MulDIC model, all of the Precision, Recall, and F1-score values of the MulDIC model are still higher than those of MulDIC. The Precision improvements of MulDIC are 0.80%, 12.90%, 7.06%, and 1.82% for VS Code, Kubernetes, Flutter, and Roslyn. The Recall improvements are 1.78%, 11.67%, 6.25%, and 1.89% for VS Code, Kubernetes, Flutter, and Roslyn. The F1-score improvements are 1.30%, 12.28%, 6.65%, and 1.86% for VS Code, Kubernetes, Flutter, and Roslyn.
Last, when compared to the MulDIC model, the Precision, Recall, and F1-score values of the MulDIC model are higher than those of MulDIC across all projects, VS Code, Kubernetes, Flutter, and Roslyn. The Precision improvements of MulDIC are 12.29%, 1.28%, 8.17%, and 1.89% for VS Code, Kubernetes, Flutter, and Roslyn. The Recall improvements are 11.93%, 1.67%, 7.24%, and 1.89% for VS Code, Kubernetes, Flutter, and Roslyn. The F1-score improvements are 12.11%, 1.48%, 7.70%, and 1.89% for VS Code, Kubernetes, Flutter, and Roslyn.
These findings indicate that incorporating multiple modalities leads to significant performance improvements. The results of this experiment demonstrate the synergistic effect of using heterogeneous modalities in classifying issue reports.
5.4. Results of Statistical Testing
As shown in Table 5, the MulDIC model exhibited the highest performance across all projects in this experiment. This indicates the potential to generalize and apply this model to various open-source projects on GitHub. In this section, we conducted a Mann–Whitney U-test [43] to verify the statistical significance of the results by comparing the classification accuracy levels between the MulDIC model and the baseline model for all projects. Since the data in the experiment results did not follow a normal distribution, we adopted the non-parametric statistical test, Mann–Whitney U-test. The hypotheses set for this test are as follows:
H0 (null hypothesis).
The averaged performance of a unimodal model is equal to that of a multimodal model.
H1 (alternative hypothesis).
The averaged performance of a unimodal model is not equal to that of a multimodal model.
Table 6 presents the test results for the individual and overall projects. The p-values for the individual projects (VS Code, Kubernetes, Flutter) and the total project (Total) were very close to 0.00, indicating significantly lower values than the significance level criterion of 0.05 for the hypothesis test. Therefore, we rejected the null hypothesis (H0) and accepted the alternative hypothesis (H1). In other words, there is a significant difference between the baseline and proposed models, and the proposed approach is statistically significant. Furthermore, we calculated this test’s effect size [43] to determine practical significance. The effect sizes ranged from 0.2 to 0.5 in most projects, generally considered moderate. This indicates that the difference between the proposed model and the baseline model is statistically significant and practically significant.
The test results for Roslyn showed a marginal difference, with the acceptance of the null hypothesis (H0) and a small effect size. This is understandable, considering the degree of performance improvement of the model. Roslyn had the slightest improvement among the four projects, with a 5.07% increase in the F1-score. However, in deep learning models, such a level of performance improvement and difference between models is significant. The test results for Roslyn showed a marginal difference according to the criteria of the statistical test, but in terms of performance experiments, it achieved a practically significant improvement. Additionally, the total project’s validation results and effect size indicate that the proposed model is statistically and practically significant. Therefore, we expect our proposed model to perform well when applied to other open-source projects.
6. Discussion
6.1. Synergistic Effects of Using Multiple Modalities
In our experiments, the MulDIC model, which combines information from text, image, and code data, showed the significant performance improvement of 5.07~14.12% F1-score, compared to the Text Only model. The MulDIC model showed an F1-score improvement of 1.84~10.39%, compared to the Text Only model. On the other hand, the MulDIC model showed an F1-score improvement of 12.64% for the Kubernetes project, but showed a decrease of 0.42% for the VS Code project. The MulDIC model significantly outperformed the MulDIC and MulDIC models across all projects. These results demonstrate the synergistic effect of a multimodal model. Here, the synergistic effect refers to the phenomenon where using different information sources together produces better results than using individual sources alone.
Since the three modalities of an issue report contain different information, considering them together allows us to obtain more heterogeneous and rich information. To illustrate the information of three modalities, Figure 1 shows the contents of issue report #147154 (https://github.com/microsoft/vscode/issues/147154, accessed on 15 August 2023). In the issue report, the textual information specifies the conditions where the bug occurs and steps to reproduce. The code information provides the code lines typed by a reporter, when s/he faced the bug. The image information shows the buggy result in the situation. The MulDIC model uses all of these different kinds of information for classifying an issue report and successfully classifies issue report #147154 as a bug.
6.2. Discussion on the Text-Code Experiment for VS Code
As we already discussed in Section 6.1, the MulDIC model applied to the VS Code project showed no performance improvement. For the VS Code project, the MulDIC model achieved an F1-score of 67.94%, while the Text Only model achieved a 68.36% F1-score. Therefore, we conjectured and investigated various factors that could be related to the inability of the MulDIC model.
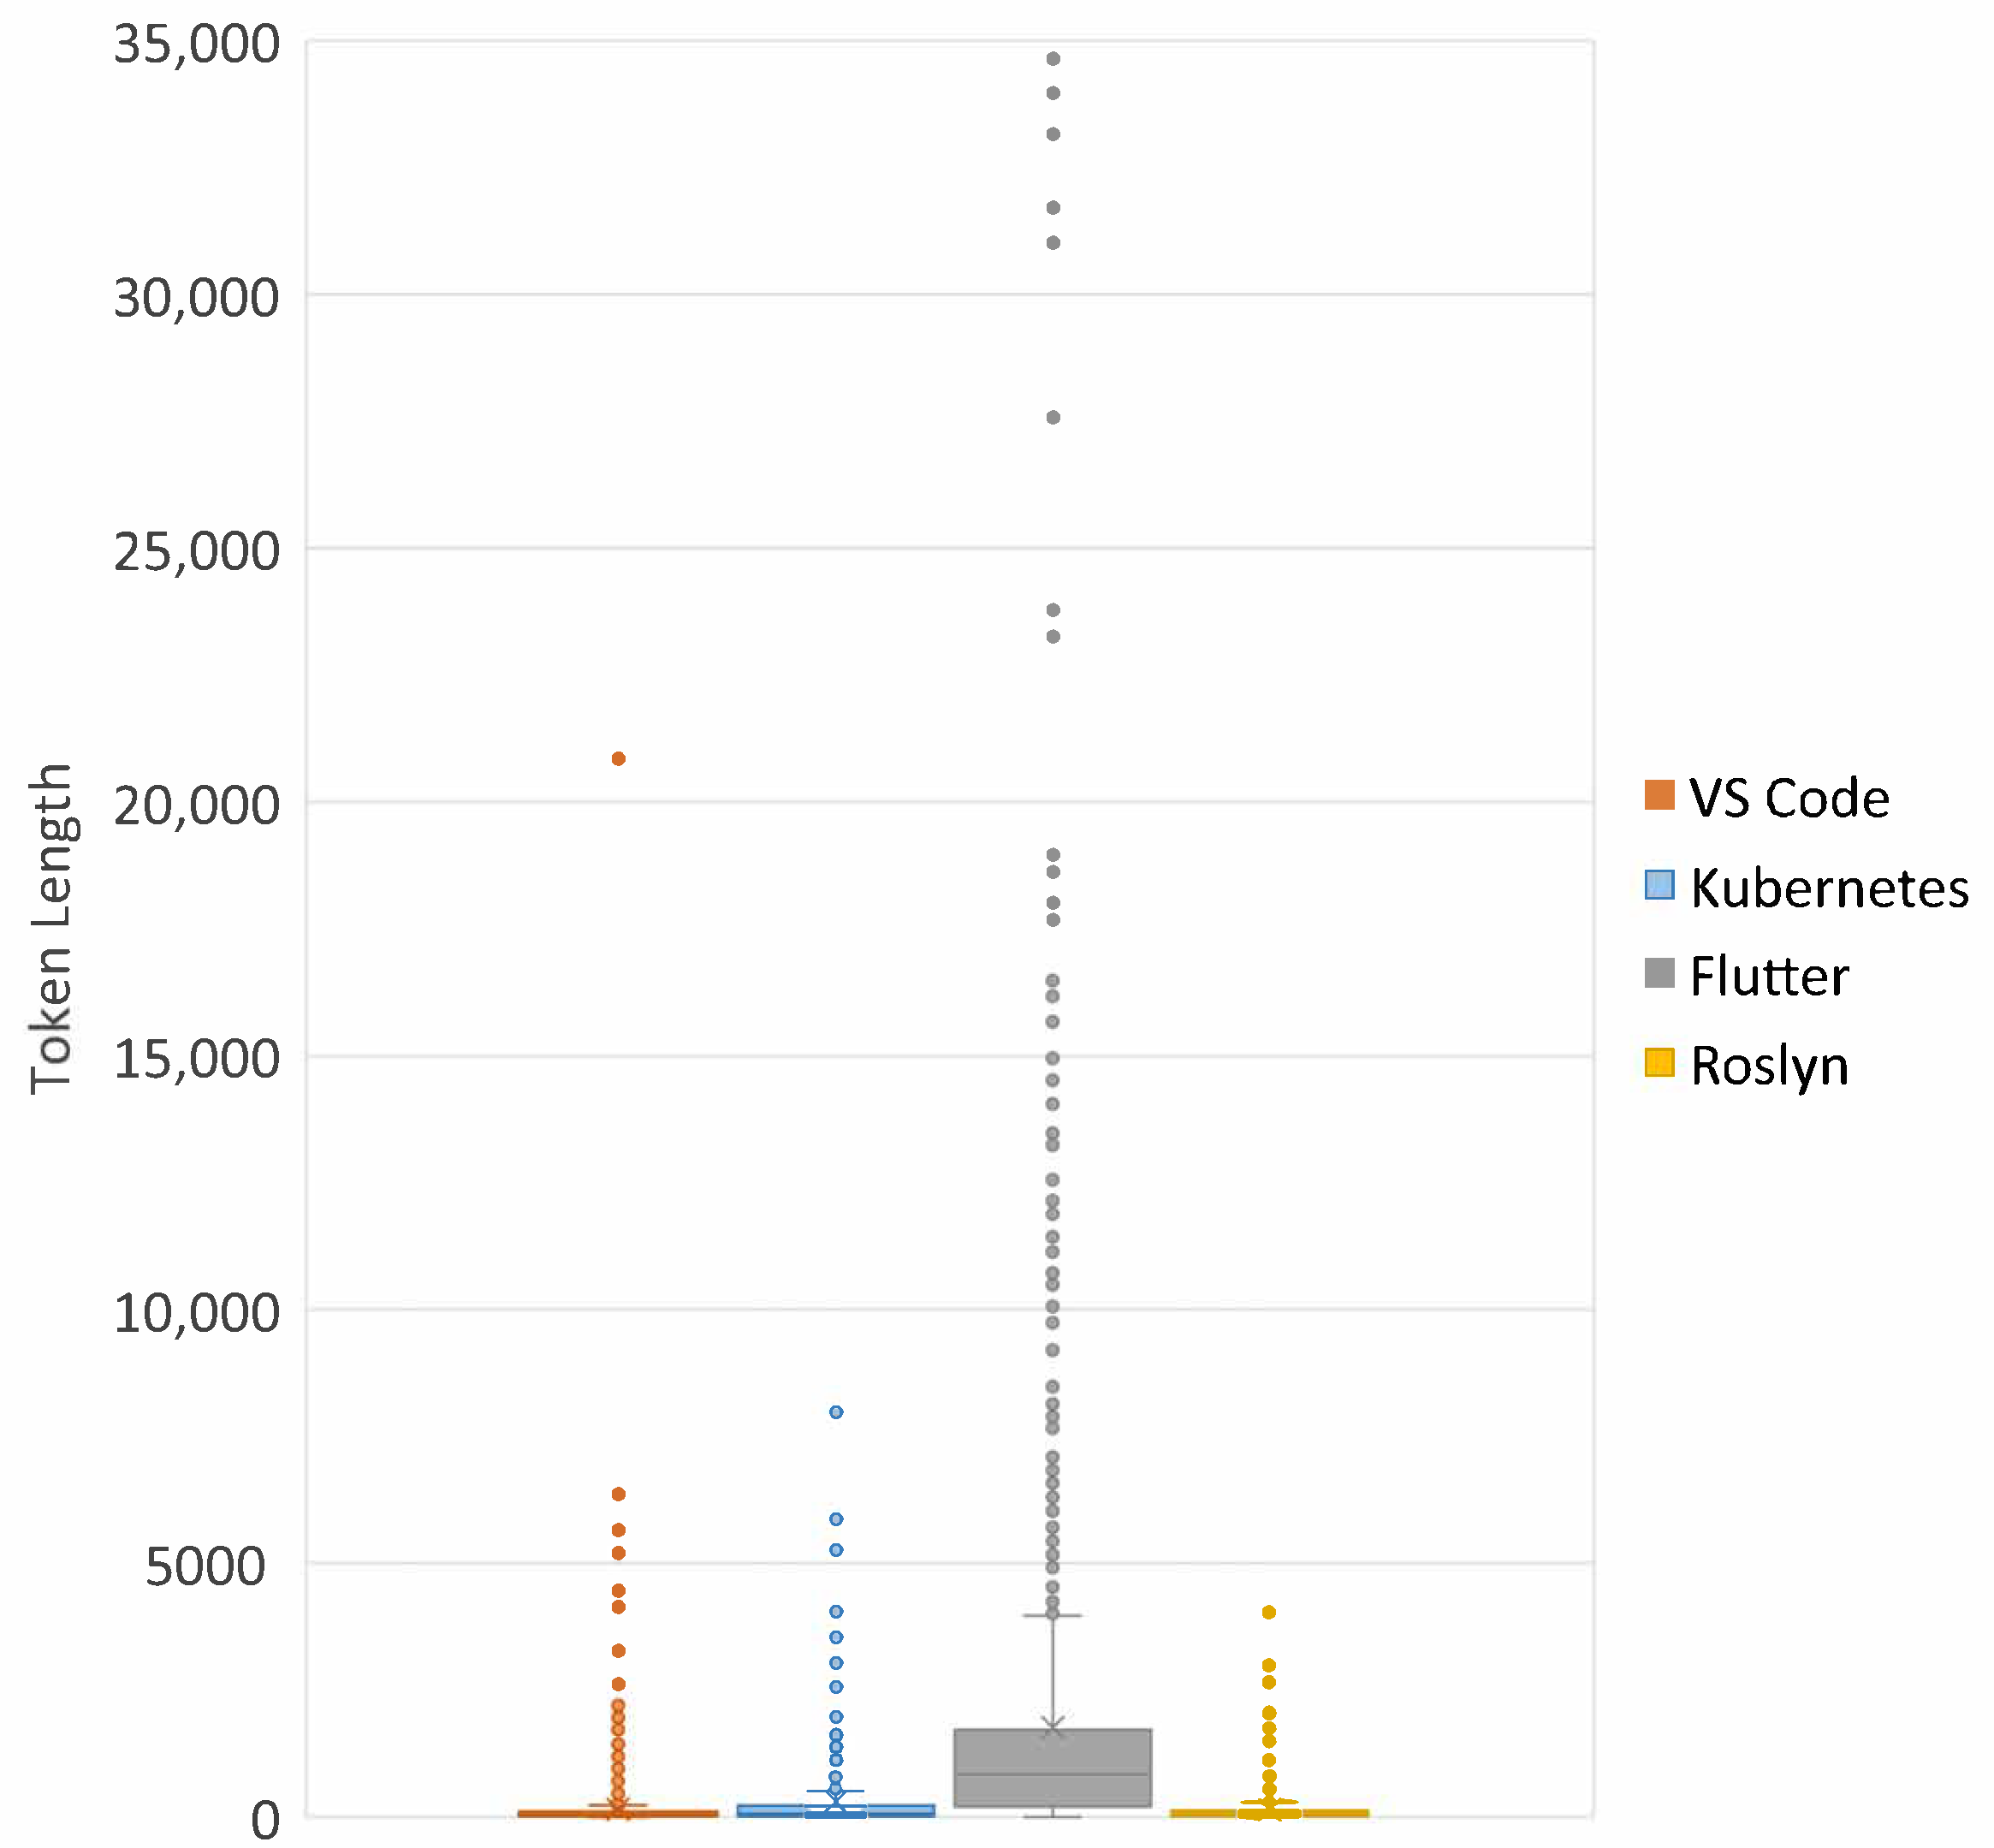
First, we investigated the token length of code data, because we set the maximum input length of code data to the value corresponding to each project’s third quartile of the token length of the entire code data. If the input token length is short, the model cuts off substantial data, resulting in significant data loss. On the other hand, if the length is long, the model can create excessively sparse vectors, which can hinder training efficiency. We investigated the statistics of token length for code data across different projects in the form of a boxplot, as shown in Figure 9. A different color represents each project, and the vertical axis represents the length of the tokens. We found that the IQR (InterQuartile Range) of VS Code is the smallest among the projects, so we estimated that VS Code had less data loss than other projects. We concluded that the token length of code data is not the factor that affected the exceptional case.
Second, when we trained the issue classification models used in our experiments, we assigned the same learning weights to each modality of text, image, and code. This arbitrary weight assignment can be a factor affecting the model performance. For instance, in the case of the VS Code project, if the textual data may be much more informative than the code data, then the Text Only model can achieve a high performance compared to the MulDIC model. In addition, typically, a multimodal model shares information through interconnections between modalities. If the connectivity among modalities is weak, it can decrease the model performance. Therefore, we conjecture that our weight assignment affected the connectivity among modalities and so the MulDIC model for the VS Code project had a weak connectivity between the text and code modalities, hindering the synergistic effect.
Lastly, the difference in the quality of the data can be another factor affecting the model performance. Data quality is a crucial factor affecting the model performance. However, since our experimental projects have issue reports written in different ways by different groups of contributors, the data quality will be different depending on products. Therefore, we conjecture that the low-quality nature of the source data in VS Code had a negative effect on the model.
6.3. Implication and Future Work
The implications of our study for researchers, developers, companies, or users are as follows. First, researchers can develop issue classification techniques based on the multimodal model proposed in this paper. For example, we applied the multimodal model to binary issue classification. We believe this approach can be extended to research trends involving multi-class and multi-label classification techniques. Second, developers can save time in reviewing issue reports by using automated issue classification techniques. Developers need to classify issues related to their software into related tasks for efficient maintenance. Automated issue classification can reduce developers’ time spent in reading individual issue reports and help developers to avoid misclassification of software-related issues. To be practical, high performance of issue classification is crucial, and our multimodal model demonstrates its capability to improve the performance of automated issue classification. Finally, companies can employ automated techniques to classify issue reports, which can help identify systematic issue trends of the software systems. Our multimodal model can contribute to making the trends more accurate.
In the future, we would like to explore state-of-the-art feature extraction techniques and fusion methods. First, while we used CNN−based channels to extract modality features for text, image, and code data in this paper, we observed that each modality has its own state-of-the-art feature extraction models. For example, for text data, we see that the state-of-the-art model is based on BERT, and for code data, we see that the state-of-the-art model is CodeBERT [44]. For images, we can consider computer vision models utilizing Transformers. By adopting state-of-the-art feature extraction models, we expect to improve the performance of issue classification. Second, we would like to experiment with several multimodal fusion methods, which merge the representation vectors of the three modalities. In this paper, we employed an entry-level multimodal fusion technique, namely, element-wise multiplication, which lacks interaction between the features of modalities. In the future, we will apply the latest methods based on bilinear pooling, such as Multimodal Compact Bilinear Pooling (MCB) [28], Multimodal Low-rank Bilinear Pooling (MLB) [29], Multimodal Tucker Union (MUTAN) [27], and Multimodal Factorized Bilinear Pooling (MFB) [45].These techniques aim to optimize feature interaction while minimizing computational complexity. We will examine whether the different fusion methods can contribute to the performance of issue classification.
7. Threats to Validity
We can divide the threats to the validity of the experiment into internal validity threats and external validity threats.
7.1. Internal Threats to Validity
Regarding internal validity threats, first, the text pre-processing step may not be able to identify all the tags or special characters used in the document. However, since we applied the same pre-processing algorithm with previous studies, the comparison with those studies is fair. Second, the code comments we excluded during the pre-processing stage can be a threat that affects the validity of the experimental results. However, mixing multiple types of data within a modality can decrease the quality of the extracted feature vectors. For this reason, we decided to remove comments from the code. Third, when selecting a representative image for each issue report, we chose only the first image among the attached images. This may result in omitting high-quality images that better represent an issue report. However, Jiang, Shuo, et al. [46] achieved the best performance using a similar approach of selecting a single image. Furthermore, we applied the same selection policies for all the subject products.
7.2. External Threats to Validity
Regarding external validity threats, first, our four experimental subjects are not enough to generalize the experimental results. However, we tried to mitigate this threat by selecting projects from various domains that are actively evolving with many issue reports. Second, we only used projects from GitHub repositories, excluding other issue-tracking systems. This can also affect the generality of the experimental results. However, because GitHub is a very popular open-source repository for developers and has been extensively used in existing research, experimenting with projects obtained from the GitHub repositories is reasonable. Finally, as we stated in Section 3.3, the embedding layer used for extracting feature vectors from the textual data has randomness. Hence, our experimental results may change each time. To mitigate this issue, we used the identical set of data for each project across all models.
8. Conclusions
Issue reports contain textual and other modalities, such as images and code. With this in mind, we proposed MulDIC, a multimodal deep learning model that effectively classifies issue reports using text, image, and code data. To assess the effectiveness of MulDIC and investigate the impact of each modality on the issue report classification task, we conducted experiments. Remarkably, the MulDIC model, which utilized text, image, and code data, demonstrated superior performance with 5.07~14.12% improvement in the F1-score, compared to the baseline models. When it comes to the impact of each modality, the image modality with the text modality consistently improved the performance of issue classification tasks. Meanwhile, the code modality mostly improved the performance of issue classification tasks, but not in all of the cases. The combination of all three modalities outperformed any combinations of two modalities. These results indicate that leveraging multimodal approaches considering heterogeneous content types of issue reports can enhance the performance of issue report classification and that the combination of text, image, and code modalities can yield synergistic effects.
In future research, we plan to continue exploring additional aspects of a multimodal model by considering the characteristics of issue reports and their heterogeneous contents. First, our proposed model is limited in processing each modality using a CNN−based channel and merging the modality-specific representation vectors through element-wise multiplication. We will explore state-of-the-art multimodal models that can increase the expressive power of each modality and the combination of these text, image, and code modalities. For example, by applying state-of-the-art fusion methods for combining text, image, and code data, we could improve the performance of issue classification tasks. In addition, we could consider adding new modalities or data in future investigations. Second, we applied our proposed model to four different projects, and in one case, a combination of text and code modalities yielded lower performance than that of a Text Only modality. To increase the reliability of our study, we plan to extend our experimental data to include a large number of software projects. Applying our proposed model to more projects will yield more consistent and reliable results.
Author Contributions
Conceptualization, C.K. and S.L.; methodology, C.K.; software, C.K.; validation, C.K. and S.L.; formal analysis, C.K. and S.L.; investigation, S.L.; resources, C.K.; data curation, C.K.; writing—original draft preparation, C.K.; writing—review and editing, C.K., S.L. and P.J.; visualization, C.K.; supervision, S.L. and P.J.; project administration, S.L.; funding acquisition, S.L. All authors have read and agreed to the published version of the manuscript.
Funding
This research was funded by the basic Science Research Program through the National Research Foundation of Korea (NRF) funded by the Ministry of Education (NRF-2021R1A2C1094167, RS-2023-00209720). This research was also funded by the “Leaders in INdustry-university Cooperation 3.0” Project, supported by the Ministry of Education and National Research Foundation of Korea (LINC3.0-2022-11, 1345356213).
Institutional Review Board Statement
Not applicable.
Informed Consent Statement
Not applicable.
Data Availability Statement
Our issue report datasets are publicly available at https://github.com/chang26/MulDIC, accessed on 15 August 2023.
Conflicts of Interest
The authors declare no conflict of interest. The funders had no role in the design of the study; in the collection, analyses, or interpretation of data; in the writing of the manuscript; or in the decision to publish the results.
Abbreviations
The following abbreviations are used in this manuscript:
| MDPI | Multidisciplinary Digital Publishing Institute |
| MulDIC | Multimodal Deep learning-based Issue Classification model |
| MulDIC | MulDIC using Text and Image |
| MulDIC | MulDIC using Text and Code |
| MulDIC | MulDIC using Text, Image, and Code |
| SVM | Support Vector Machines |
| CNN | Convolutional Neural Network |
| RNN | Recurrent Neural Network |
| MODIT | Multimodal Neural Machine Translation-Based Automatic Code Editing |
| BERT | Bidirectional Encoder Representations from Transformer |
| GPT | Generative pre-trained transformer |
| SusTriage | Sustainable Bug Triage with Multimodal Ensemble Learning |
| VQA | Visual Question Answering |
| VGGNet | Visual Geometry Group Net |
| LSTM | Long Short-Term Memory |
| BOW | Bag Of Words |
| OCR | Optical Character Recognition |
| RVL-CDIP | Ryerson Vision Lab Complex Document Information Processing |
| EEG | Electro Encephalo Graphy |
| IEMOCAP | Interactive Emotional Dyadic Motion Capture |
| FC | Fully-Connected |
| NLTK | Natural Language Toolkit |
| ReLU | Rectified Linear Unit |
| UI | User Interface |
| VB.NET | Visual Basic .NET |
| IQR | InterQuartile Range |
References
- Pandey, N.; Sanyal, D.K.; Hudait, A.; Sen, A. Automated classification of software issue reports using machine learning techniques: An empirical study. Innov. Syst. Softw. Eng. 2017, 13, 279–297. [Google Scholar] [CrossRef]
- Fan, Q.; Yu, Y.; Yin, G.; Wang, T.; Wang, H. Where is the road for issue reports classification based on text mining? In Proceedings of the 2017 ACM/IEEE International Symposium on Empirical Software Engineering and Measurement (ESEM), Toronto, ON, Canada, 9–10 November 2017; pp. 121–130. [Google Scholar]
- Pandey, N.; Hudait, A.; Sanyal, D.K.; Sen, A. Automated classification of issue reports from a software issue tracker. In Proceedings of the Progress in Intelligent Computing Techniques: Theory, Practice, and Applications: Proceedings of ICACNI 2016, Rourkela, Odisha, India, 22–24 September 2016; Springer: Berlin/Heidelberg, Germany, 2018; Volume 1, pp. 423–430. [Google Scholar]
- Panichella, A. A systematic comparison of search algorithms for topic modelling—A study on duplicate bug report identification. In Proceedings of the Search-Based Software Engineering: 11th International Symposium, SSBSE 2019, Tallinn, Estonia, 31 August–1 September 2019; Proceedings 11. Springer: Berlin/Heidelberg, Germany, 2019; pp. 11–26. [Google Scholar]
- Lu, M.; Liang, P. Automatic classification of non-functional requirements from augmented app user reviews. In Proceedings of the 21st International Conference on Evaluation and Assessment in Software Engineering, Karlskrona Sweden, 15–16 June 2017; pp. 344–353. [Google Scholar]
- Zhu, Y.; Pan, M.; Pei, Y.; Zhang, T. A bug or a suggestion? an automatic way to label issues. arXiv 2019, arXiv:1909.00934. [Google Scholar]
- Kallis, R.; Di Sorbo, A.; Canfora, G.; Panichella, S. Ticket tagger: Machine learning driven issue classification. In Proceedings of the 2019 IEEE International Conference on Software Maintenance and Evolution (ICSME), Cleveland, OH, USA, 29 September–4 October 2019; pp. 406–409. [Google Scholar]
- Kim, M.; Kim, Y.; Lee, E. Deep learning-based production and test bug report classification using source files. In Proceedings of the ACM/IEEE 44th International Conference on Software Engineering: Companion Proceedings, Pittsburgh, PA, USA, 22–24 May 2022; pp. 343–344. [Google Scholar]
- Zhifang, L.; Kun, W.; Qi, Z.; Shengzong, L.; Yan, Z.; Jianbiao, H. Classification of open source software bug report based on transfer learning. Expert Syst. 2022, e13184. [Google Scholar] [CrossRef]
- Cho, H.; Lee, S.; Kang, S. Classifying issue reports according to feature descriptions in a user manual based on a deep learning model. Inf. Softw. Technol. 2022, 142, 106743. [Google Scholar] [CrossRef]
- Antoniol, G.; Ayari, K.; Di Penta, M.; Khomh, F.; Guéhéneuc, Y.G. Is it a bug or an enhancement? A text-based approach to classify change requests. In Proceedings of the 2008 Conference of the Center for Advanced Studies on Collaborative Research: Meeting of Minds, Richmond Hill, ON, Canada, 27–30 October 2008; pp. 304–318. [Google Scholar]
- Herzig, K.; Just, S.; Zeller, A. It’s not a bug, it’s a feature: How misclassification impacts bug prediction. In Proceedings of the 2013 35th International Conference on Software Engineering (ICSE), San Francisco, CA, USA, 18–26 May 2013; pp. 392–401. [Google Scholar]
- Zhou, Y.; Tong, Y.; Gu, R.; Gall, H. Combining text mining and data mining for bug report classification. J. Softw. Evol. Process. 2016, 28, 150–176. [Google Scholar] [CrossRef]
- Hoang, T.; Oentaryo, R.J.; Le, T.D.B.; Lo, D. Network-clustered multi-modal bug localization. IEEE Trans. Softw. Eng. 2018, 45, 1002–1023. [Google Scholar] [CrossRef]
- Chakraborty, S.; Ray, B. On multi-modal learning of editing source code. In Proceedings of the 2021 36th IEEE/ACM International Conference on Automated Software Engineering (ASE), Melbourne, Australia, 15–19 November 2021; pp. 443–455. [Google Scholar]
- Zhang, W.; Zhao, J.; Wang, S. SusTriage: Sustainable Bug Triage with Multi-modal Ensemble Learning. In Proceedings of the IEEE/WIC/ACM International Conference on Web Intelligence and Intelligent Agent Technology, Melbourne, Australia, 14–17 December 2021; pp. 441–448. [Google Scholar]
- Summaira, J.; Li, X.; Shoib, A.M.; Li, S.; Abdul, J. Recent advances and trends in multimodal deep learning: A review. arXiv 2021, arXiv:2105.11087. [Google Scholar]
- Yu, L.; Poirson, P.; Yang, S.; Berg, A.C.; Berg, T.L. Modeling context in referring expressions. In Proceedings of the Computer Vision–ECCV 2016: 14th European Conference, Amsterdam, The Netherlands, 11–14 October 2016; Proceedings, Part II 14. Springer: Berlin/Heidelberg, Germany, 2016; pp. 69–85. [Google Scholar]
- Plummer, B.A.; Wang, L.; Cervantes, C.M.; Caicedo, J.C.; Hockenmaier, J.; Lazebnik, S. Flickr30k entities: Collecting region-to-phrase correspondences for richer image-to-sentence models. In Proceedings of the IEEE International Conference on Computer Vision, Santiago, Chile, 7–13 December 2015; pp. 2641–2649. [Google Scholar]
- Johnson, J.; Karpathy, A.; Fei-Fei, L. Densecap: Fully convolutional localization networks for dense captioning. In Proceedings of the IEEE Conference on Computer Vision and Pattern Recognition, Las Vegas, NV, USA, 27–30 June 2016; pp. 4565–4574. [Google Scholar]
- Xu, J.; Mei, T.; Yao, T.; Rui, Y. Msr-vtt: A large video description dataset for bridging video and language. In Proceedings of the IEEE Conference on Computer Vision and Pattern Recognition, Las Vegas, NV, USA, 27–30 June 2016; pp. 5288–5296. [Google Scholar]
- You, Q.; Jin, H.; Wang, Z.; Fang, C.; Luo, J. Image captioning with semantic attention. In Proceedings of the IEEE Conference on Computer Vision and Pattern Recognition, Las Vegas, NV, USA, 27–30 June 2016; pp. 4651–4659. [Google Scholar]
- Yan, X.; Yang, J.; Sohn, K.; Lee, H. Attribute2image: Conditional image generation from visual attributes. In Proceedings of the Computer Vision–ECCV 2016: 14th European Conference, Amsterdam, The Netherlands, 11–14 October 2016; Proceedings, Part IV 14. Springer: Berlin/Heidelberg, Germany, 2016; pp. 776–791. [Google Scholar]
- Reed, S.; Akata, Z.; Yan, X.; Logeswaran, L.; Schiele, B.; Lee, H. Generative adversarial text to image synthesis. In Proceedings of the International Conference on Machine Learning, New York City, NY, USA, 19–24 June 2016; pp. 1060–1069. [Google Scholar]
- Xu, T.; Zhang, P.; Huang, Q.; Zhang, H.; Gan, Z.; Huang, X.; He, X. Attngan: Fine-grained text to image generation with attentional generative adversarial networks. In Proceedings of the IEEE Conference on Computer Vision and Pattern Recognition, Salt Lake City, UT, USA, 18–23 June 2018; pp. 1316–1324. [Google Scholar]
- Antol, S.; Agrawal, A.; Lu, J.; Mitchell, M.; Batra, D.; Zitnick, C.L.; Parikh, D. Vqa: Visual question answering. In Proceedings of the IEEE International Conference on Computer Vision, Santiago, Chile, 7–13 December 2015; pp. 2425–2433. [Google Scholar]
- Ben-Younes, H.; Cadene, R.; Cord, M.; Thome, N. Mutan: Multimodal tucker fusion for visual question answering. In Proceedings of the IEEE International Conference on Computer Vision, Venice, Italy, 22–29 October 2017; pp. 2612–2620. [Google Scholar]
- Fukui, A.; Park, D.H.; Yang, D.; Rohrbach, A.; Darrell, T.; Rohrbach, M. Multimodal compact bilinear pooling for visual question answering and visual grounding. arXiv 2016, arXiv:1606.01847. [Google Scholar]
- Kim, J.H.; On, K.W.; Lim, W.; Kim, J.; Ha, J.W.; Zhang, B.T. Hadamard product for low-rank bilinear pooling. arXiv 2016, arXiv:1610.04325. [Google Scholar]
- Liang, W.; Jiang, Y.; Liu, Z. GraghVQA: Language-guided graph neural networks for graph-based visual question answering. arXiv 2021, arXiv:2104.10283. [Google Scholar]
- Lopez-Fuentes, L.; van de Weijer, J.; Bolanos, M.; Skinnemoen, H. Multi-modal Deep Learning Approach for Flood Detection. MediaEval 2017, 17, 13–15. [Google Scholar]
- Kim, E.; McCoy, K.F. Multimodal deep learning using images and text for information graphic classification. In Proceedings of the 20th International ACM SIGACCESS Conference on Computers and Accessibility, Galway, Ireland, 22–24 October 2018; pp. 143–148. [Google Scholar]
- Audebert, N.; Herold, C.; Slimani, K.; Vidal, C. Multimodal deep networks for text and image-based document classification. In Proceedings of the Machine Learning and Knowledge Discovery in Databases: International Workshops of ECML PKDD 2019, Würzburg, Germany, 16–20 September 2019; Proceedings, Part I. Springer: Berlin/Heidelberg, Germany, 2020; pp. 427–443. [Google Scholar]
- Palani, B.; Elango, S.; Viswanathan K, V. CB-Fake: A multimodal deep learning framework for automatic fake news detection using capsule neural network and BERT. Multimed. Tools Appl. 2022, 81, 5587–5620. [Google Scholar] [CrossRef] [PubMed]
- Oramas, S.; Barbieri, F.; Nieto Caballero, O.; Serra, X. Multimodal deep learning for music genre classification. Trans. Int. Soc. Music. Inf. Retr. 2018, 1, 4–21. [Google Scholar] [CrossRef]
- Huang, Y.; Yang, J.; Liao, P.; Pan, J. Fusion of facial expressions and EEG for multimodal emotion recognition. Comput. Intell. Neurosci. 2017, 2017, 2107451. [Google Scholar] [CrossRef] [PubMed]
- Tripathi, S.; Tripathi, S.; Beigi, H. Multi-modal emotion recognition on iemocap dataset using deep learning. arXiv 2018, arXiv:1804.05788. [Google Scholar]
- Busso, C.; Bulut, M.; Lee, C.C.; Kazemzadeh, A.; Mower, E.; Kim, S.; Chang, J.N.; Lee, S.; Narayanan, S.S. IEMOCAP: Interactive emotional dyadic motion capture database. Lang. Resour. Eval. 2008, 42, 335–359. [Google Scholar] [CrossRef]
- Sarica, S.; Luo, J. Stopwords in technical language processing. PLoS ONE 2021, 16, e0254937. [Google Scholar] [CrossRef]
- Zhang, C.; Yang, Z.; He, X.; Deng, L. Multimodal intelligence: Representation learning, information fusion, and applications. IEEE J. Sel. Top. Signal Process. 2020, 14, 478–493. [Google Scholar] [CrossRef]
- Ali, H.; Salleh, M.M.; Saedudin, R.; Hussain, K.; Mushtaq, M.F. Imbalance class problems in data mining: A review. Indones. J. Electr. Eng. Comput. Sci. 2019, 14, 1560–1571. [Google Scholar] [CrossRef]
- Thabtah, F.; Hammoud, S.; Kamalov, F.; Gonsalves, A. Data imbalance in classification: Experimental evaluation. Inf. Sci. 2020, 513, 429–441. [Google Scholar] [CrossRef]
- Arcuri, A.; Briand, L. A practical guide for using statistical tests to assess randomized algorithms in software engineering. In Proceedings of the 33rd International Conference on Software Engineering, Honolulu, HI, USA, 21–28 May 2011; pp. 1–10. [Google Scholar]
- Feng, Z.; Guo, D.; Tang, D.; Duan, N.; Feng, X.; Gong, M.; Shou, L.; Qin, B.; Liu, T.; Jiang, D.; et al. Codebert: A pre-trained model for programming and natural languages. arXiv 2020, arXiv:2002.08155. [Google Scholar]
- Yu, Z.; Yu, J.; Fan, J.; Tao, D. Multi-modal factorized bilinear pooling with co-attention learning for visual question answering. In Proceedings of the IEEE International Conference on Computer Vision, Venice, Italy, 22–29 October 2017; pp. 1821–1830. [Google Scholar]
- Jiang, S.; Hu, J.; Magee, C.L.; Luo, J. Deep learning for technical document classification. IEEE Trans. Eng. Manag. 2022, 1–17. [Google Scholar] [CrossRef]
Figure 1.
Example of an issue report in VS Code.

Figure 2.
Overall Structure of the Proposed Model, MulDIC.

Figure 3.
Example of text pre-processing.

Figure 4.
Example of code pre-processing.

Figure 5.
Example of image pre-processing.

Figure 6.
CNN−based text and code channels.

Figure 7.
CNN−based image channels.

Figure 8.
Performance comparison of models across projects.

Figure 9.
Token length statistics for code data.


Table 1.
The total number of data per project.
| Project | Total Number of Issues | Label | Num |
|---|---|---|---|
| VS Code | 160,218 | Bug | 28,353 |
| Feature | 20,074 | ||
| Total | 48,427 | ||
| Kubernetes | 115,035 | Bug | 13,059 |
| Feature | 5184 | ||
| Total | 18,243 | ||
| Flutter | 118,576 | Bug | 13,037 |
| Feature | 9967 | ||
| Total | 23,004 | ||
| Roslyn | 66,464 | Bug | 12,882 |
| Feature | 3824 | ||
| Total | 16,706 |
Table 2.
Sampled Data Distribution per Label.
| Project | Label | Original Data | Down-Sampled Data |
|---|---|---|---|
| VS Code | Bug | 1351 (58%) | 980 (50%) |
| Feature | 980 (42%) | 980 (50%) | |
| Total | 2331 | 1960 | |
| Kubernetes | Bug | 866 (85%) | 148 (50%) |
| Feature | 148 (15%) | 148 (50%) | |
| Total | 1014 | 296 | |
| Flutter | Bug | 2061 (73%) | 759 (50%) |
| Feature | 759 (27%) | 759 (50%) | |
| Total | 2820 | 1518 | |
| Roslyn | Bug | 1341 (84%) | 263 (50%) |
| Feature | 263 (16%) | 263 (50%) | |
| Total | 1604 | 526 |
Table 3.
Experimental results that compared MulDIC with the Text Only model.
| Project | Model | Precision | Recall | F1-Score |
|---|---|---|---|---|
| VS Code | Text Only | 68.45 | 68.27 | 68.36 |
| MulDIC | 79.60 | 77.92 | 78.75 | |
| Kubernetes | Text Only | 66.91 | 66.10 | 66.50 |
| MulDIC | 68.35 | 68.33 | 68.34 | |
| Flutter | Text Only | 67.70 | 67.66 | 67.68 |
| MulDIC | 69.79 | 69.41 | 69.60 | |
| Roslyn | Text Only | 62.92 | 62.86 | 62.89 |
| MulDIC | 66.13 | 66.04 | 66.08 |
Table 4.
Experimental results that compared MulDIC with the Text Only model.
| Project | Model | Precision | Recall | F1-Score |
|---|---|---|---|---|
| VS Code | Text Only | 68.45 | 68.27 | 68.36 |
| MulDIC | 68.11 | 67.77 | 67.94 | |
| Kubernetes | Text Only | 66.91 | 66.10 | 66.50 |
| MulDIC | 79.97 | 78.33 | 79.14 | |
| Flutter | Text Only | 67.70 | 67.66 | 67.68 |
| MulDIC | 68.68 | 68.42 | 68.55 | |
| Roslyn | Text Only | 62.92 | 62.86 | 62.89 |
| MulDIC | 66.06 | 66.04 | 66.05 |
Table 5.
Experimental results that compared MulDIC with other models.
| Project | Model | Precision | Recall | F1-Score |
|---|---|---|---|---|
| VS Code | Text Only | 68.45 | 68.27 | 68.36 |
| MulDIC | 79.60 | 77.92 | 78.75 | |
| MulDIC | 68.11 | 67.77 | 67.94 | |
| MulDIC | 80.40 | 79.70 | 80.05 | |
| Kubernetes | Text Only | 66.91 | 66.10 | 66.50 |
| MulDIC | 68.35 | 68.33 | 68.34 | |
| MulDIC | 79.97 | 78.33 | 79.14 | |
| MulDIC | 81.25 | 80.00 | 80.62 | |
| Flutter | Text Only | 67.70 | 67.66 | 67.68 |
| MulDIC | 69.79 | 69.41 | 69.60 | |
| MulDIC | 68.68 | 68.42 | 68.55 | |
| MulDIC | 76.85 | 75.66 | 76.25 | |
| Roslyn | Text Only | 62.92 | 62.86 | 62.89 |
| MulDIC | 66.13 | 66.04 | 66.08 | |
| MulDIC | 66.06 | 66.04 | 66.05 | |
| MulDIC | 67.95 | 67.93 | 67.94 |
Table 6.
Results of Mann–Whitney U-test and Effect Size.
| Project | Mann–Whitney U test p-Value | Effect Size |
|---|---|---|
| VS Code | 2.2 × 10⁻¹⁶ (<0.05) | 0.2733451 |
| Kubernetes | 4.73 × 10⁻⁵ (<0.05) | 0.4217934 |
| Flutter | 2.2 × 10⁻¹⁶ (<0.05) | 0.2554626 |
| Roslyn | 0.159 (>0.05) | 0.1209764 |
| Total | 2.2 × 10⁻¹⁶ (<0.05) | 0.2564514 |
Disclaimer/Publisher’s Note: The statements, opinions and data contained in all publications are solely those of the individual author(s) and contributor(s) and not of MDPI and/or the editor(s). MDPI and/or the editor(s) disclaim responsibility for any injury to people or property resulting from any ideas, methods, instructions or products referred to in the content. |
© 2023 by the authors. Licensee MDPI, Basel, Switzerland. This article is an open access article distributed under the terms and conditions of the Creative Commons Attribution (CC BY) license (https://creativecommons.org/licenses/by/4.0/).
Share and Cite
MDPI and ACS Style
Kwak, C.; Jung, P.; Lee, S. A Multimodal Deep Learning Model Using Text, Image, and Code Data for Improving Issue Classification Tasks. Appl. Sci. 2023, 13, 9456. https://doi.org/10.3390/app13169456
AMA Style
Kwak C, Jung P, Lee S. A Multimodal Deep Learning Model Using Text, Image, and Code Data for Improving Issue Classification Tasks. Applied Sciences. 2023; 13(16):9456. https://doi.org/10.3390/app13169456
Chicago/Turabian StyleKwak, Changwon, Pilsu Jung, and Seonah Lee. 2023. "A Multimodal Deep Learning Model Using Text, Image, and Code Data for Improving Issue Classification Tasks" Applied Sciences 13, no. 16: 9456. https://doi.org/10.3390/app13169456
Note that from the first issue of 2016, this journal uses article numbers instead of page numbers. See further details here.