Article

Delamination Localization in Multilayered CFRP Panel Based on Reconstruction of Guided Wave Modes

by
Mastan Raja Papanaboina
1,*,
Elena Jasiuniene
1,2,
Vykintas Samaitis
1,
Liudas Mažeika
1 and
Paulius Griškevičius
3
1
Prof. K. Baršauskas Ultrasound Research Insititute, Kaunas University of Technology, K. Baršausko St. 59, LT-51423 Kaunas, Lithuania
2
Department of Electronics Engineering, Kaunas University of Technology, Studentu St. 50, LT-51368 Kaunas, Lithuania
3
Department of Mechanical Engineering, Kaunas University of Technology, Studentu St. 56, LT-51424 Kaunas, Lithuania
*
Author to whom correspondence should be addressed.
Appl. Sci. 2023, 13(17), 9687; https://doi.org/10.3390/app13179687
Submission received: 2 August 2023 / Revised: 19 August 2023 / Accepted: 24 August 2023 / Published: 27 August 2023
(This article belongs to the Special Issue Application of Ultrasonic Non-destructive Testing)

Abstract

:
Multi-layered composite materials are being used in various engineering fields, such as aerospace, automobile, and wind energy, because of their superior material properties. Due to various impact loads during the service life of composite structures, different types of defects can occur, such as matrix cracking, fiber breakage, delaminations, etc. In this research, a novel SHM technique for delamination detection and localization using a minimum number of sensors is proposed. The analytical, numerical, and experimental analysis of GW was performed to increase the probability of detection and localization of delaminations in CFRP material. A new analytical model was developed, which enables identifying converted and transmitted modes in the presence of multiple GW modes. A 2D FFT-based spatial filtering was used to filter the GW modes. The dominant A0 mode was separated to inspect the delamination. Phase velocity is one of the important features in GW inspection to localize the delamination. A phase spectrum approach was developed to reconstruct the phase velocity dispersion of the GW modes in case material properties are unknown.

1. Introduction

Multilayered composite materials are extensively used in aerospace and other engineering fields because of their impressive material properties, such as high stiffness, low weight, and corrosive resistance. As a result, the implementation of these materials contributes to reducing aircraft weight, improving fuel economy, and decreasing flight operation costs [1,2,3,4,5]. Various failure mechanisms can affect composite structures during manufacturing due to design errors or overheating or during service due to static overload, shock, and fatigue. Common defects in composites are fiber failure, buckling, matrix cracking, and delamination [6,7,8,9,10]. If these defects are not detected in composite materials, they can lead to catastrophic structural failure. Fiber failure is relatively straightforward to detect when the composite structure experiences static and dynamic loads. Matrix damage takes different forms, such as voids or cracks within the fibers of the lamina or as a single intralaminar defect within a composite layer. Buckling is another form of failure, commonly appearing as a shear or compression failure.
Delamination is a crucial failure mechanism and represents one of the significant vulnerabilities in multilayered composites. If these types of defects are not detected, delamination can propagate through the composite laminates. Delamination in composite structures can significantly compromise their stiffness, potentially leading to complete structural failure. Therefore, it is important to monitor multilayered composite structures to reduce maintenance costs.
Guided wave structural health monitoring (GSHM) can be used to ensure the structural integrity of composites [11]. The following tasks can be achieved, such as damage detection, localization, and quantification [12,13,14,15,16]. Baseline-dependent SHM techniques require data from both defect-free and defective specimens. On the other hand, baseline-independent SHM techniques can detect damages by monitoring the structural response obtained from external forces [17,18,19,20,21]. The structural integrity and reliability of the system can be achieved by implementing an appropriate maintenance procedure. CQ Gómez Muñoz proposed a baseline-dependent SHM technique using a single transmitter and multiple sensors to monitor defects up to 4 m despite significant attenuation due to the honeycomb structure [22]. An in situ SHM technique by Omar Mabrok Bouzid, based on GW acoustic emission and wireless sensor network to monitor and localize impact damages [23]. The baseline independent active SHM technique using thin PZT sensors was presented by K. Diamanti to monitor disbonds. However, operational conditions such as vibrations, loading conditions, and environmental conditions such as temperature and humidity can influence the signals [24,25,26,27,28,29,30,31].
GW inspections have received significant attention in the non-destructive field due to their high sensitivity and their ability to travel a long distance. However, the interpretation of GW signals is complex, especially when dealing with unknown materials. Inspection of composite materials is challenging due to their anisotropic properties [32,33,34,35,36,37]. Numerous research studies have shown that guided wave inspection is used to identify and assess impact damage, delamination, and other types of defects presented in multilayered composites. A GW inspection method was proposed by Wang and Xinyan to detect and measure the delamination caused by the low-velocity impact on multi-layered composite material [38]. Naresh Kumar presented a guided wave inspection method to determine delamination by analyzing the local response from the composite material using a single transmitter and receiver [39]. Several factors that influence the guided wave propagation in composites are the multilayered structure, anisotropic properties, specimen boundaries, mode dispersion, distortion, multiple overlapped modes, and mode conversion [40,41,42,43,44,45].
The phase and group velocities of guided waves are important features to inspect the structure. These features are dependent on the ply direction, elastic properties, and the product of frequency-thickness [46]. A phase velocity technique was proposed by Renaldas Raišutis to detect, locate, and size the through-thickness hole in composite material by measuring phase velocity variation within the defect region [47]. Chongcong Tao presented a technique to evaluate matrix cracking and fiber damage caused by cycle loads by monitoring a significant drop in the speed of phase velocity [48]. S.C. Rosalie proposed a technique to monitor the delamination growth between the laminates by monitoring group velocity variation in the multilayered composite [49].
Identification of guided wave modes in the presence of low amplitude, converted, and overlapped modes has been a long-standing problem. Zero-crossing and Hilbert transform methods were used to calculate the ToF of well-isolated modes to determine the location of delamination. However, the challenges arise when ToF needs to be determined using zero-crossing and Hilbert transform techniques due to phase shift, signal-to-noise ratio, distorted signal, and significant dispersion caused by anisotropic material properties [50,51,52].
In this study, the semi-analytical finite element method was used to obtain dispersion curves to calculate the guided wave mode velocity at various frequencies. The GW tuning curves were obtained to evaluate the dominant mode and the optimal excitation frequency for inspection. A 2D FFT-based spatial filtering was used to filter the GW modes from the B-scan data. To separate the specific mode, a frequency-dependent bandpass filter with a cosine-tapered window was used to eliminate the S 0 mode in the frequency wavenumber domain. A phase spectrum approach was used to obtain the phase velocity of A 0 mode. Then the analytical GW modes were reconstructed following different propagation scenarios such as reflected, converted, and overlapped modes. By selecting the A 0 mode, analytical modeling, numerical simulation, and experiments were performed to detect and estimate the location of the delamination. The objective of this research is to present a novel analytical model to locate the delamination in the presence of reflected, converted, overlapped, and low-amplitude GW modes. A phase velocity reconstruction approach was proposed to reconstruct the velocity of unknown materials from the baseline reference data. An efficient SHM technique was developed to detect and localize the delamination in the multi-layered CFRP material with a minimum number of sensors.
Theoretical analysis of GW interaction with delamination analytical, numerical, and experimental analysis of GWs to increase the probability of detection in CFRP material was used. The quantitative and qualitative analysis for the estimation of delamination position is assessed.

2. Materials and Methods
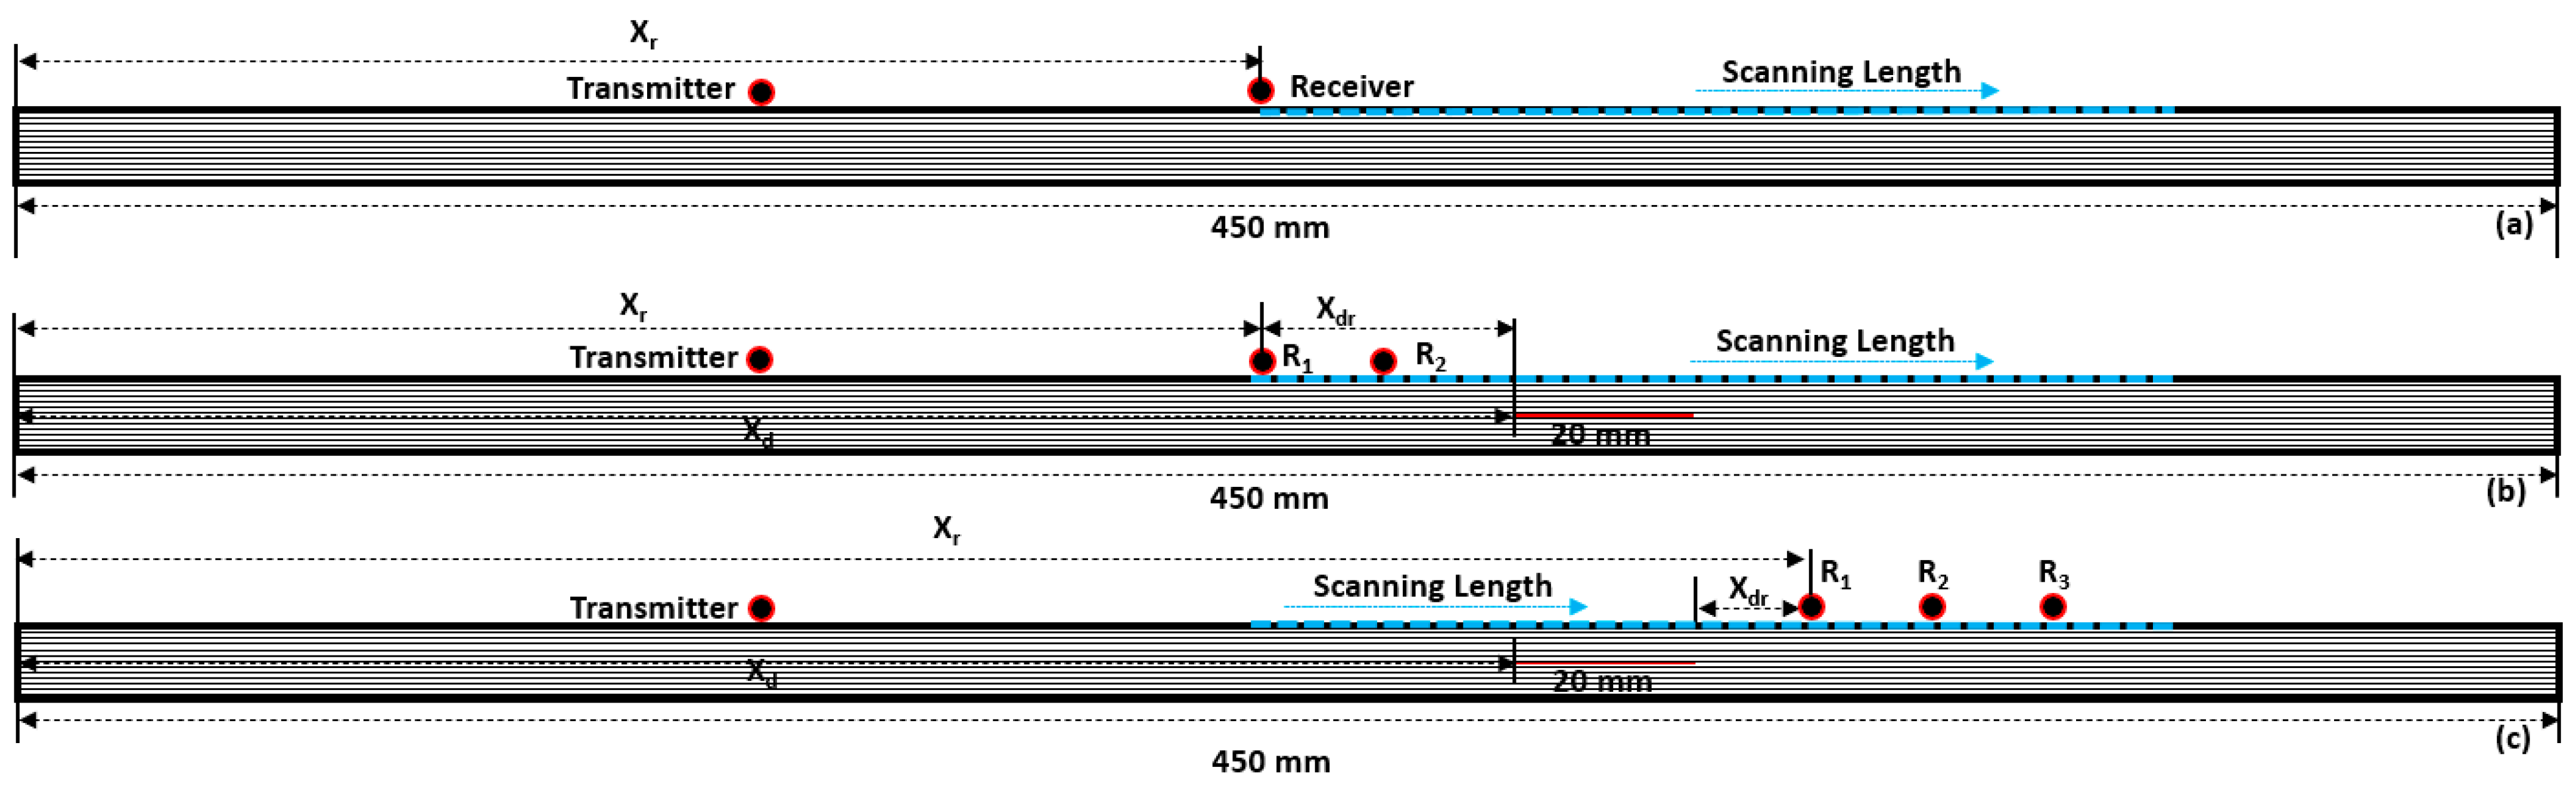
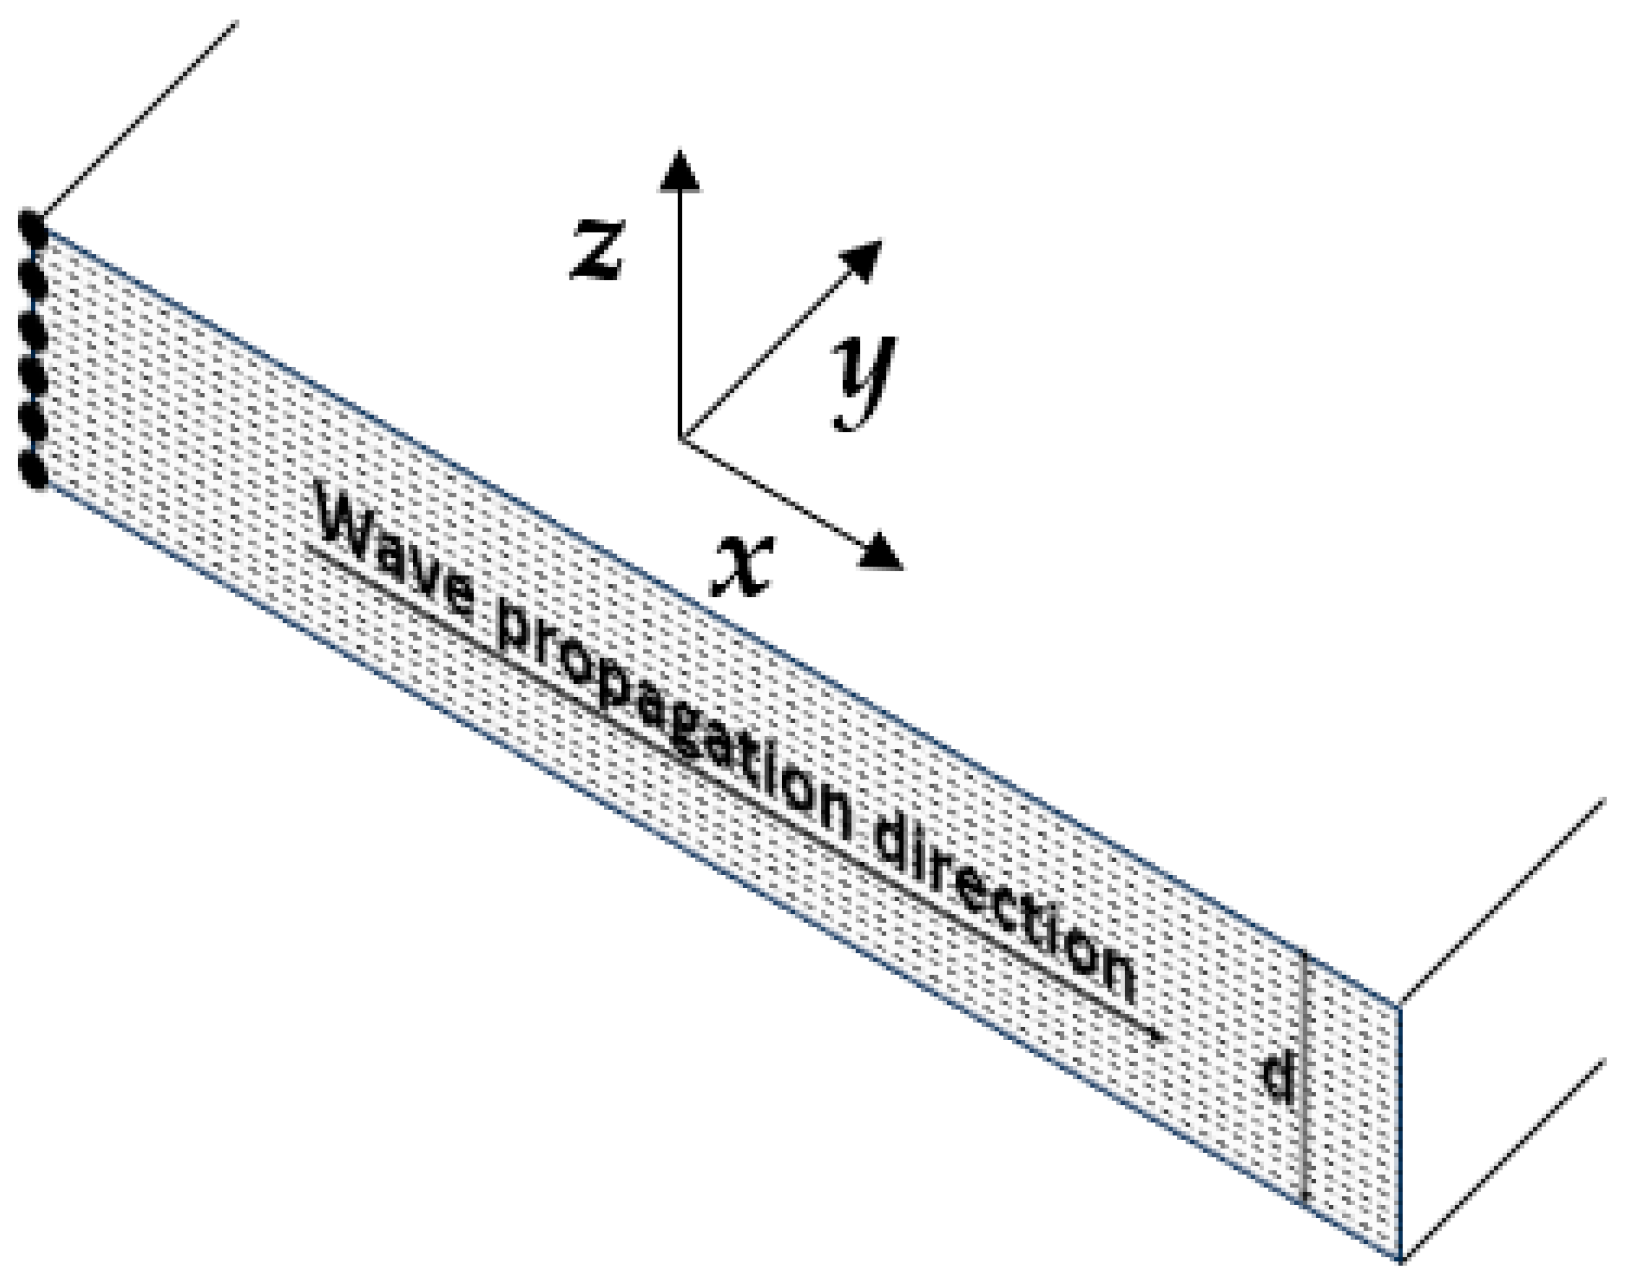
2.1. Modeling Setup

For inspection, a multilayered CFRP plate measuring 450 mm in length and 3.5 mm in thickness was selected. The investigated sample was manufactured from 18 plies of carbon fiber, and the orientation of the plies are (−45°, 0°, +45°, 0°, 90°, 0°, −45°, 0°, and +45°)2. The mechanical properties of the CFRP used in the numerical simulation are presented in Table 1. Here, E is Young’s modulus, G is the shear modulus, ν is the Poisson’s ratio, ρ c is the density of CFRP, and t p l y is the ply thickness. In this 2D model, the x-axis is along the fibers, the y-axis is along the thickness of the CFRP plate, and the z-axis is assumed to be infinitely long.
The location of delamination was analyzed in two cases by placing the receivers before and after the delamination. In case 1, two receivers were placed at distances of 10 mm and 20 mm from the leading edge of the delamination. In case 2, three receivers were placed at distances of 10 mm, 20 mm, and 30 mm from the trailing edge of the delamination. The through-thickness location of the delamination (Xh) was 1.7 mm. The cases studied, the delamination and receiver position, and distances are presented in Table 2.
The 2D simulation was performed to analyze a GW interaction with a delamination-type defect with a length of 20 mm. The delamination was located at 250 mm along the longitudinal direction and 1.7 mm in the thickness direction, as shown in Figure 1. The transmitter-receiver configuration was used to perform the inspection. A normal force was applied at the point-type excitation source to propagate the A0 mode. To minimize the distortion of guided waves, a point-type excitation was selected. The excitation source was placed at 70 mm from the leading edge of the CFRP plate.

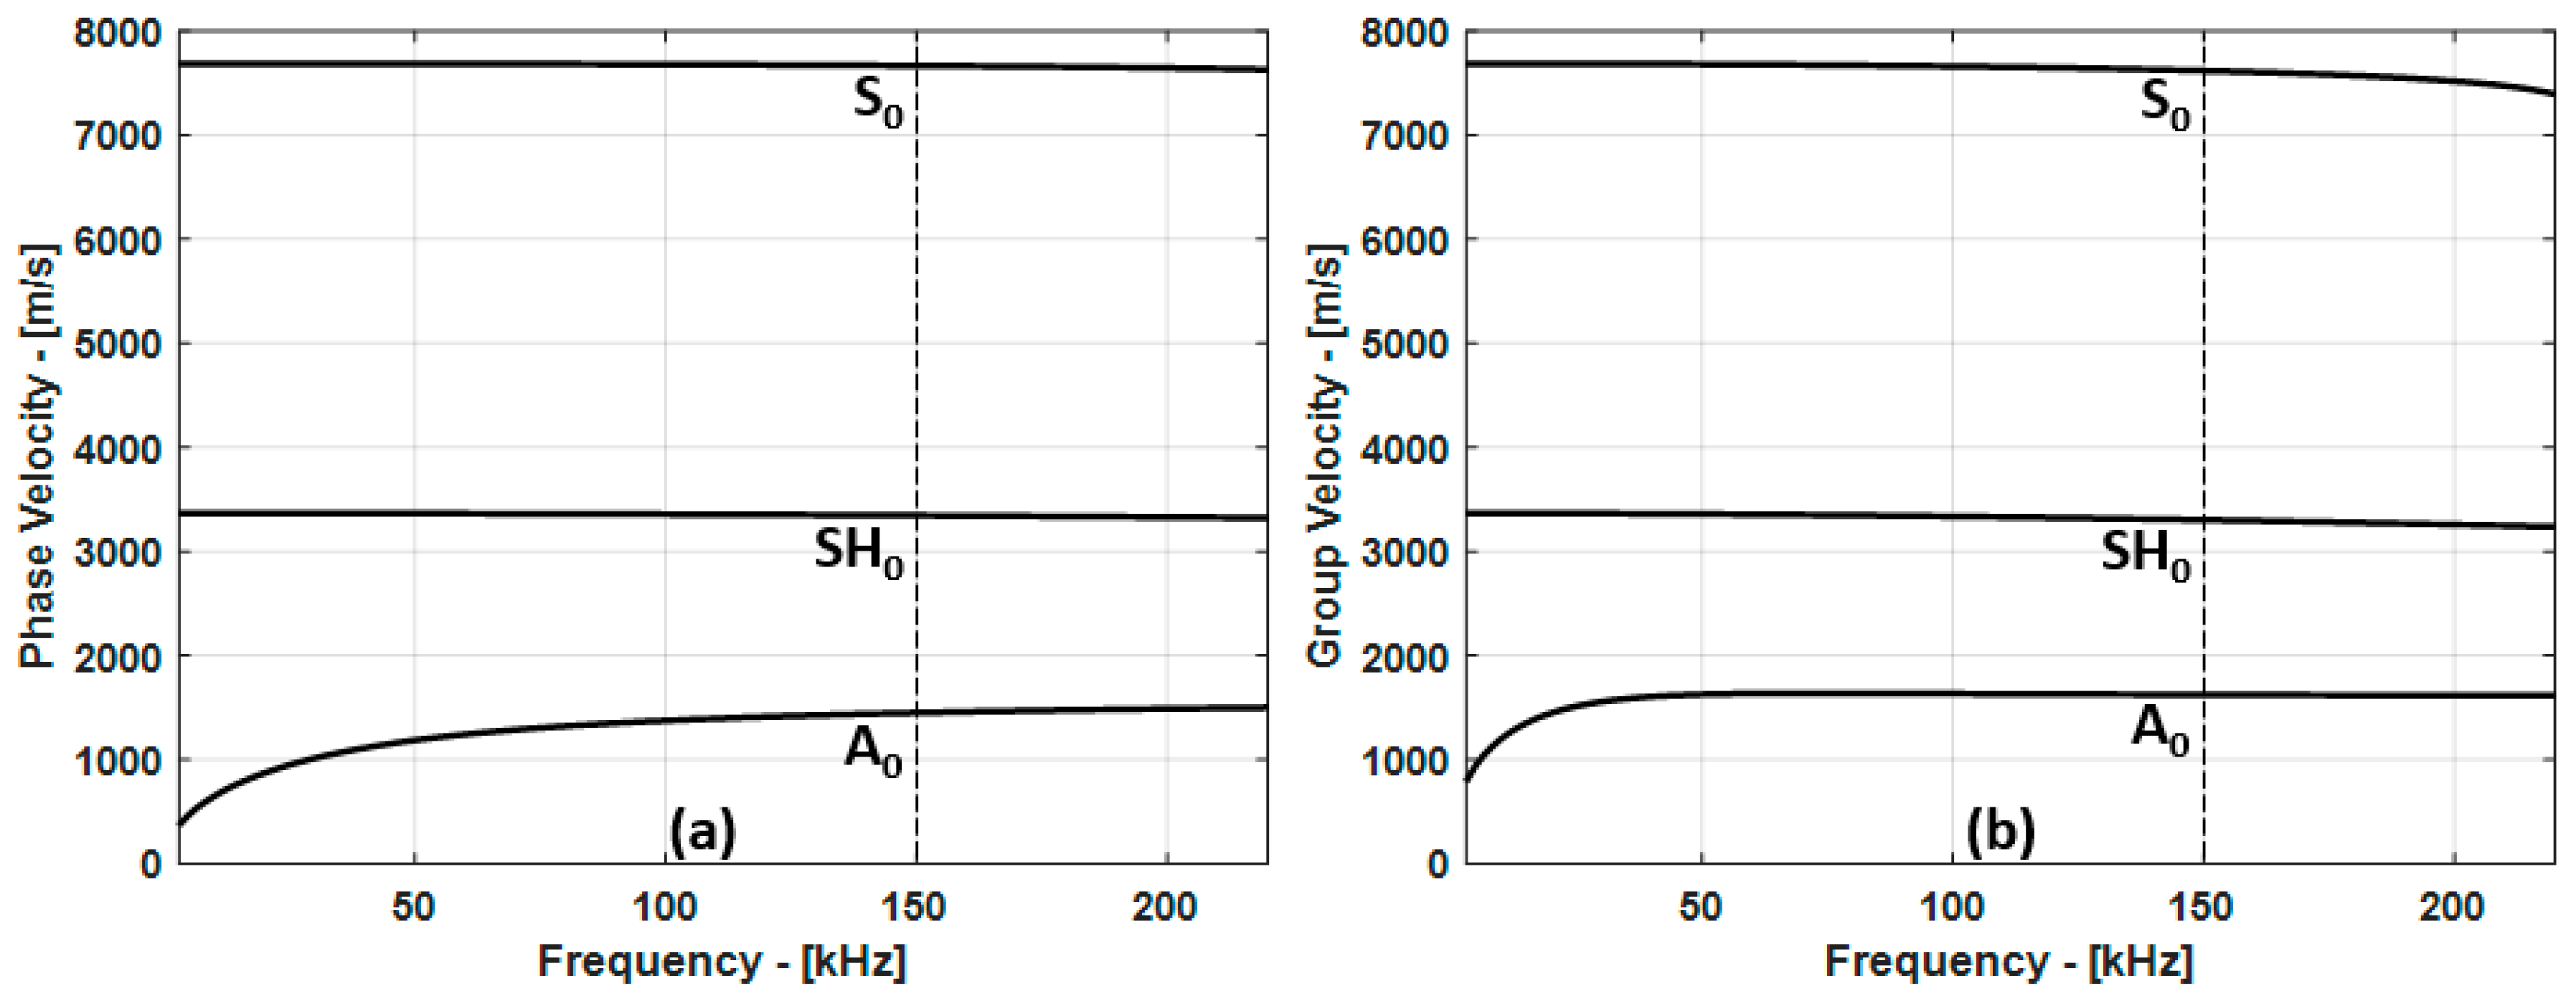
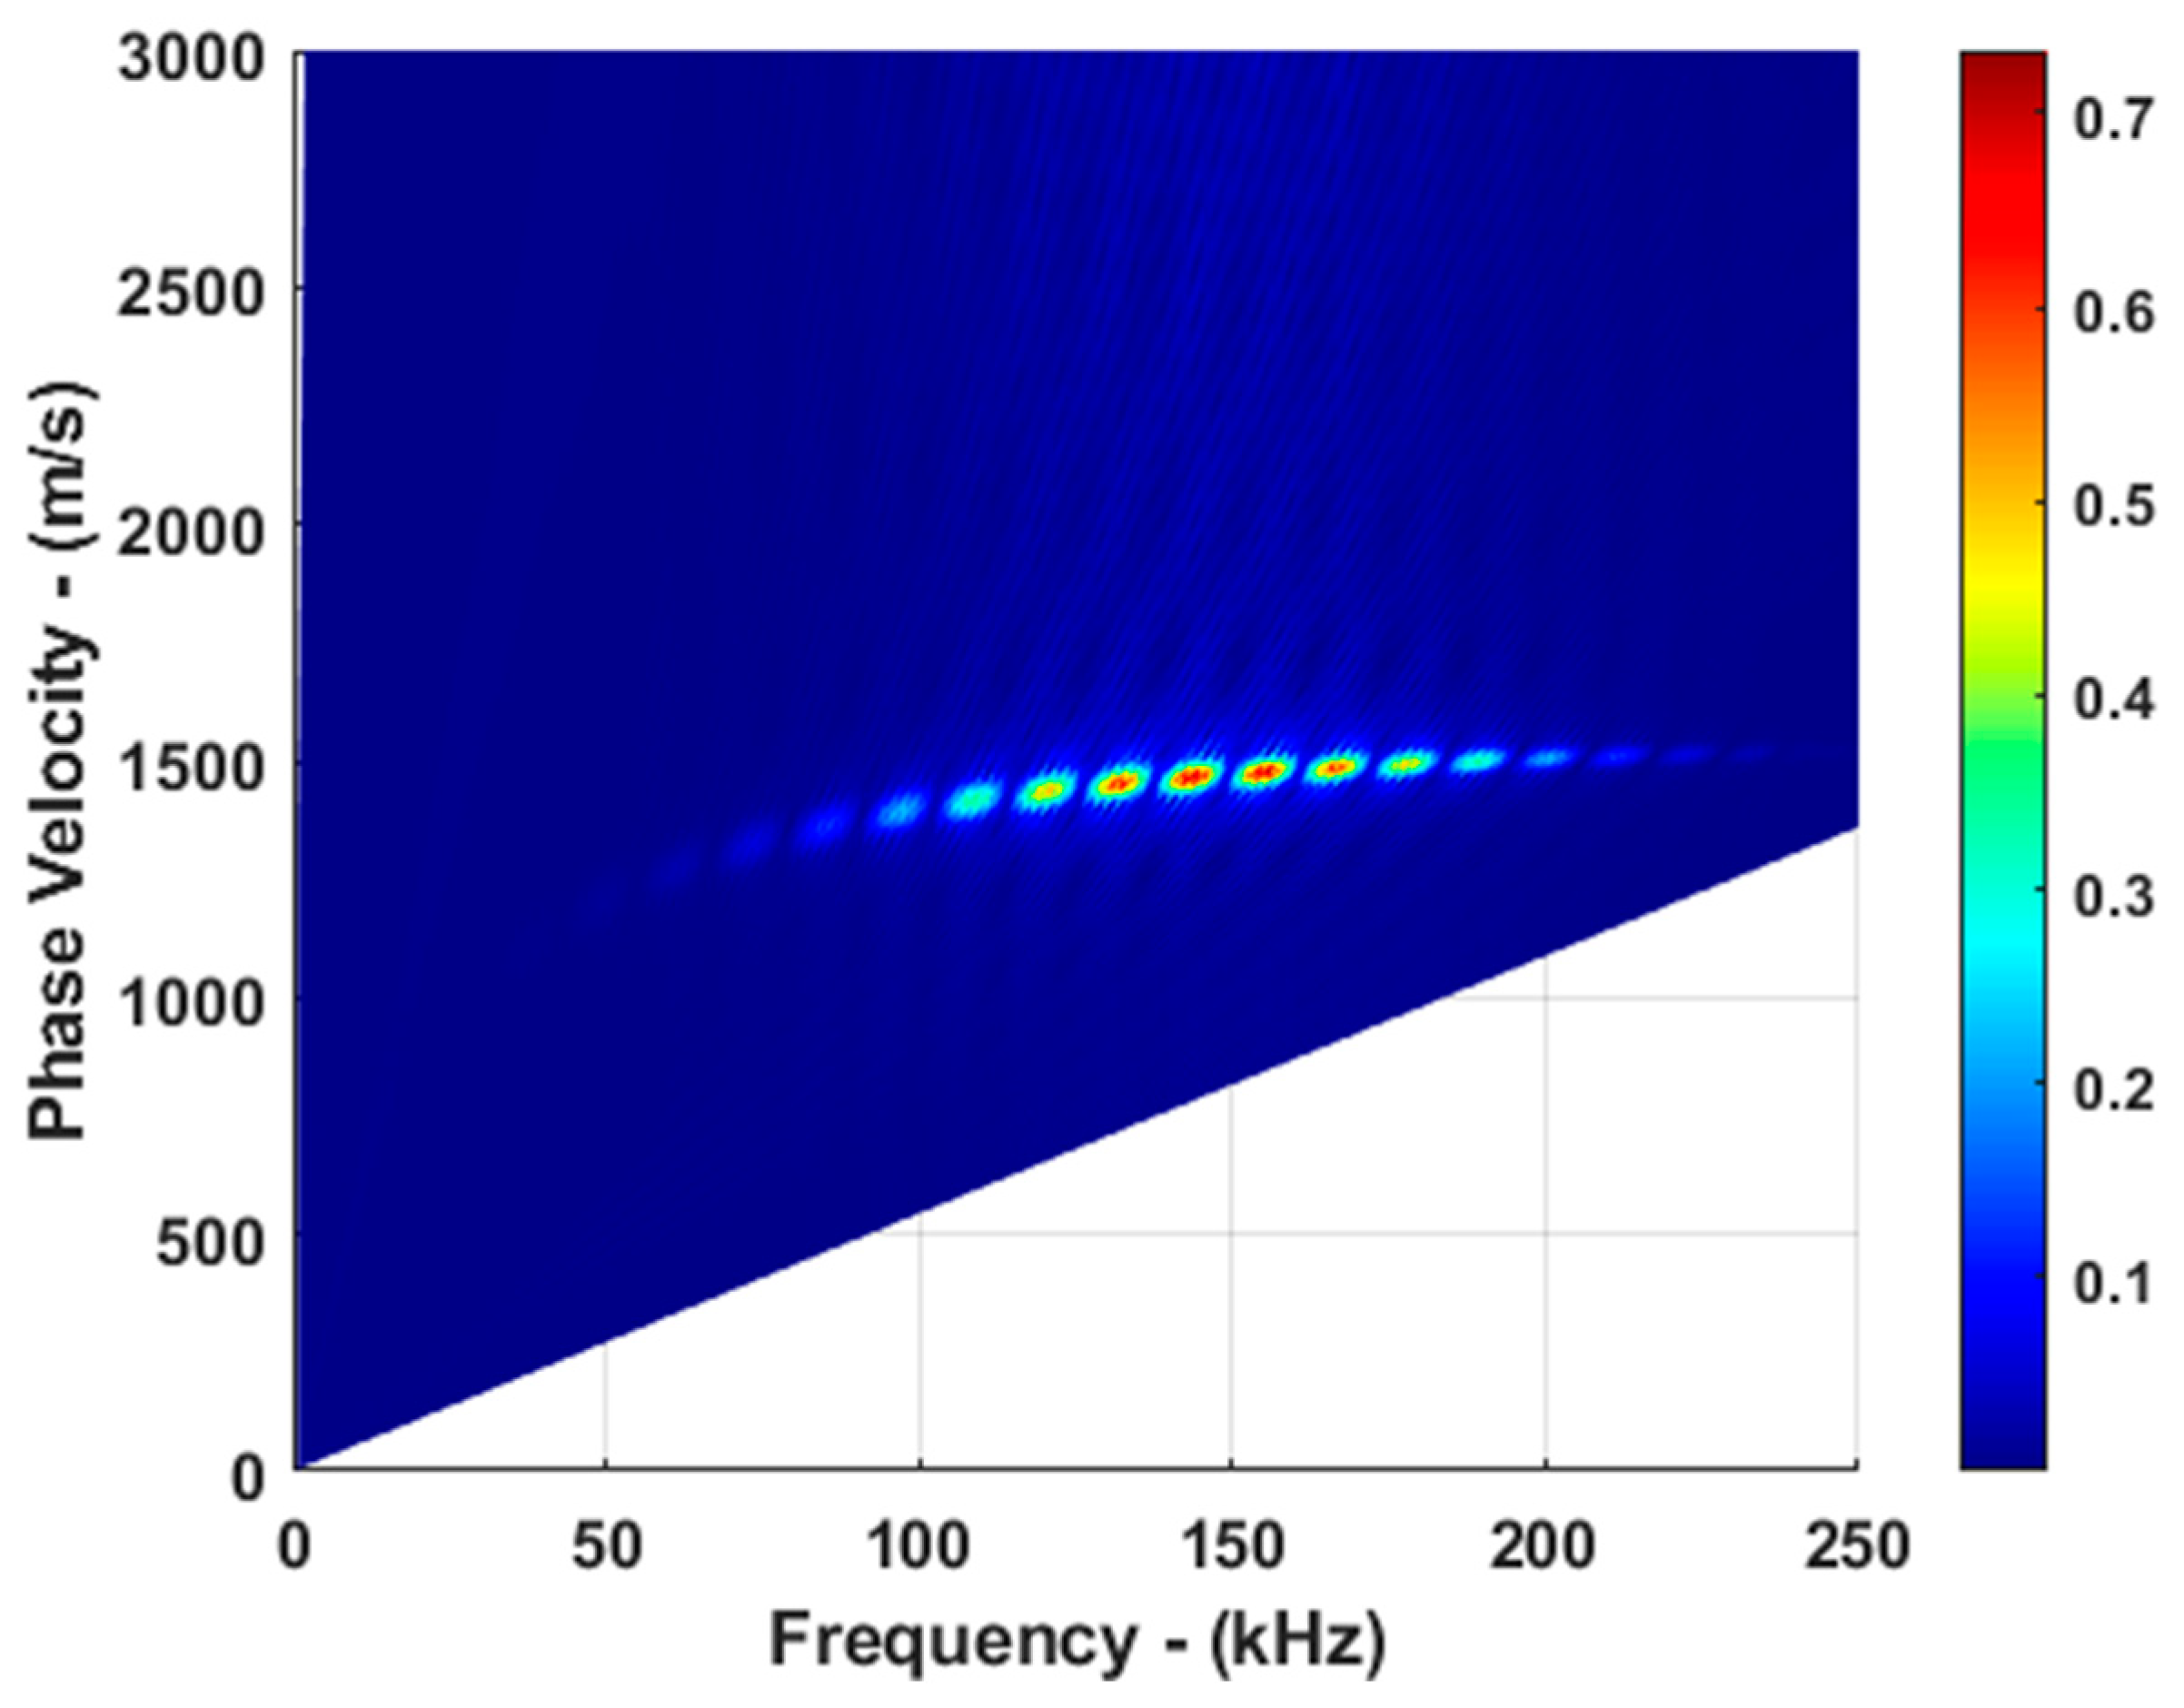
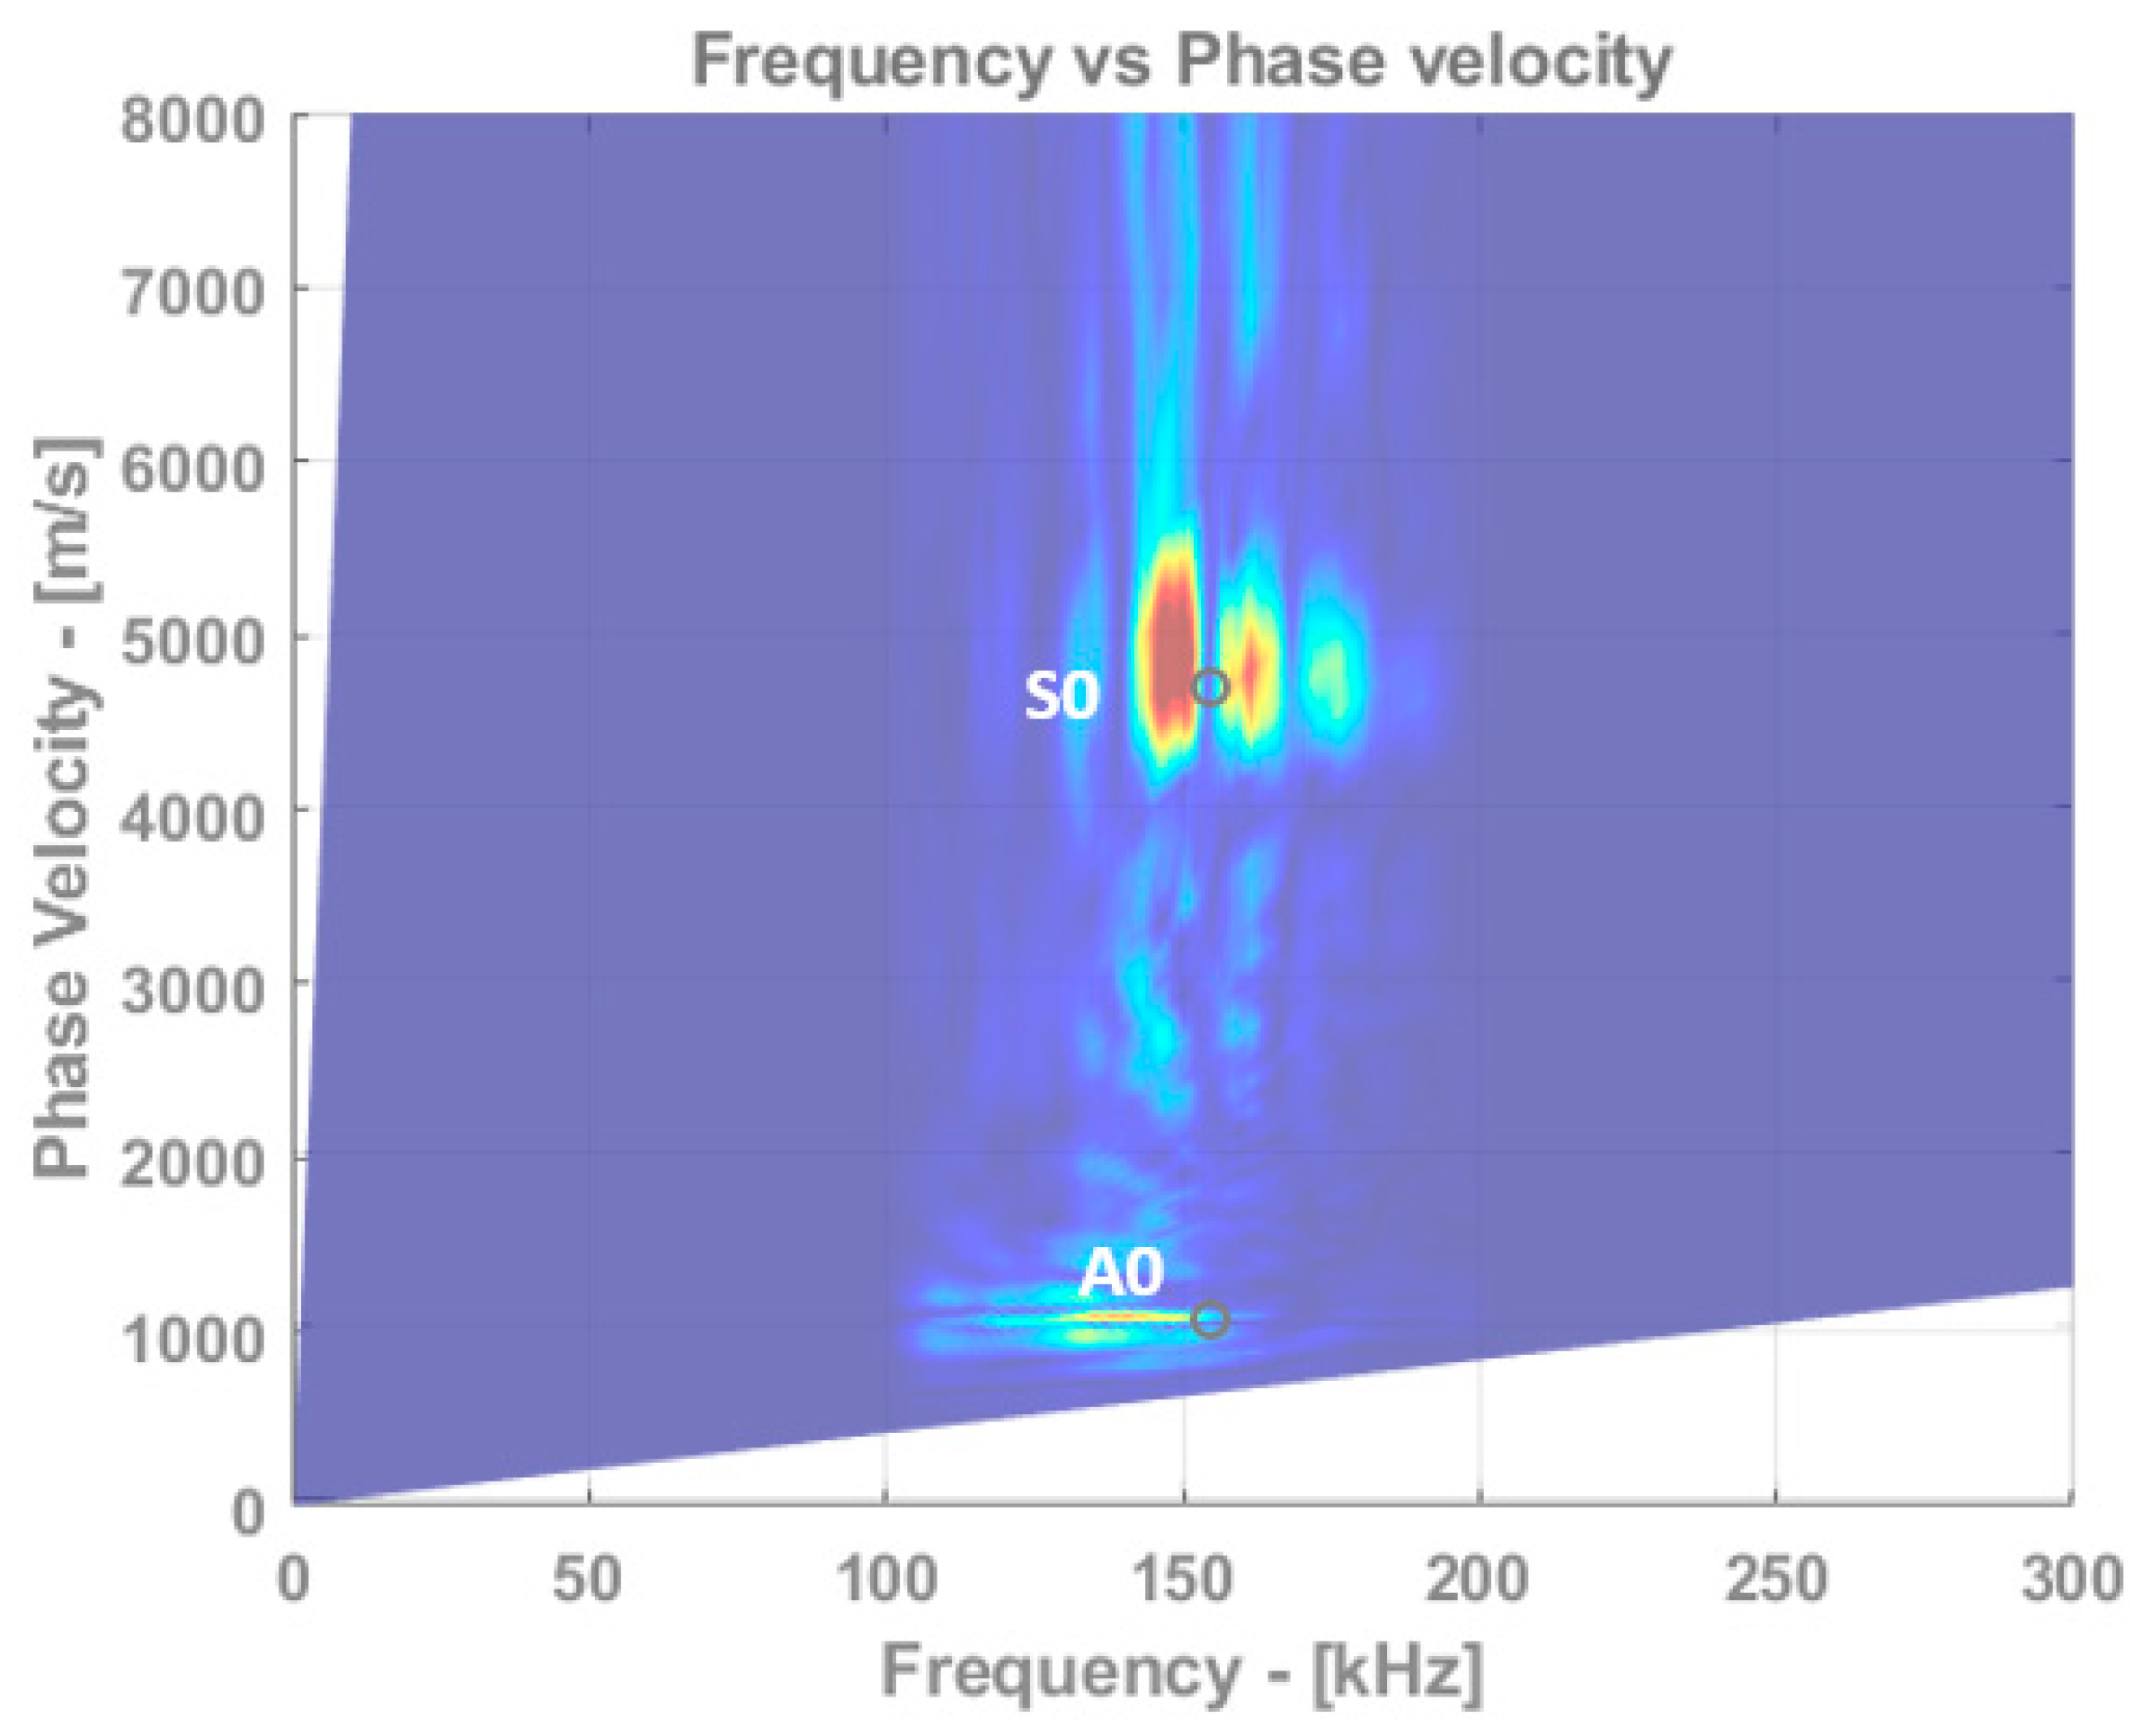
2.2. Guided Wave Dispersion Curves

Obtaining dispersion curves is an important task for the selection of appropriate GW modes and the excitation frequency for the inspection. The SAFE method is a fundamental technique used to compute the dispersion curves of guided waves. In this method, a 2D arbitrary plate is divided into elements in the thickness direction, and the x-axis corresponds to the wave propagation direction, as shown in Figure 2.
The governing equation of the plain strain model for wave propagation in an elastic medium using the SAFE method can be represented by the following equation [56]:
λ + μ · u + μ 2 u = ρ 2 u t 2     ,
where λ is the Lamé constant, µ is the shear modulus, ρ is the density, and t is the time. The u x ,   u y ,   and   u z   are symmetric, shear horizontal, and asymmetric displacement vectors.
In this study, it was assumed that the plate’s width is infinitely long along the y-axis. A totla of 36 elements are assigned in the z-axis, the thickness of the plate is discretized into elements, and each element is 0.097 mm. In this multilayered CFRP plate, each ply is assigned two elements. Each ply had a thickness of 0.194 mm, and the thickness of 18 plies of CFRP plate was 3.5 mm.
The purpose of the SAFE method was to determine the phase velocity, c p h ( f ) , and group velocity, c g ( f ) , at various frequencies. The dispersion curves obtained for the CFRP plate under investigation are presented in Figure 3a,b. Based on the dispersion curves, it can be observed that at a frequency of 150 kHz, the A0 mode phase and group velocities are 1450 m/s and 1623 m/s, respectively. The S0 mode phase and group velocities are 7664 m/s and 7616 m/s, respectively.
The maximum amplitude of each mode varies depending on the excitation frequency. At higher frequencies, the guided wave modes exhibit higher-order modes with smaller wavelengths. However, this results in complex signal interpretation because of dispersion, as multiple modes are superimposed on each other. By selecting the frequency range of 150 kHz, only fundamental modes were exhibited, and higher-order modes should not be present.

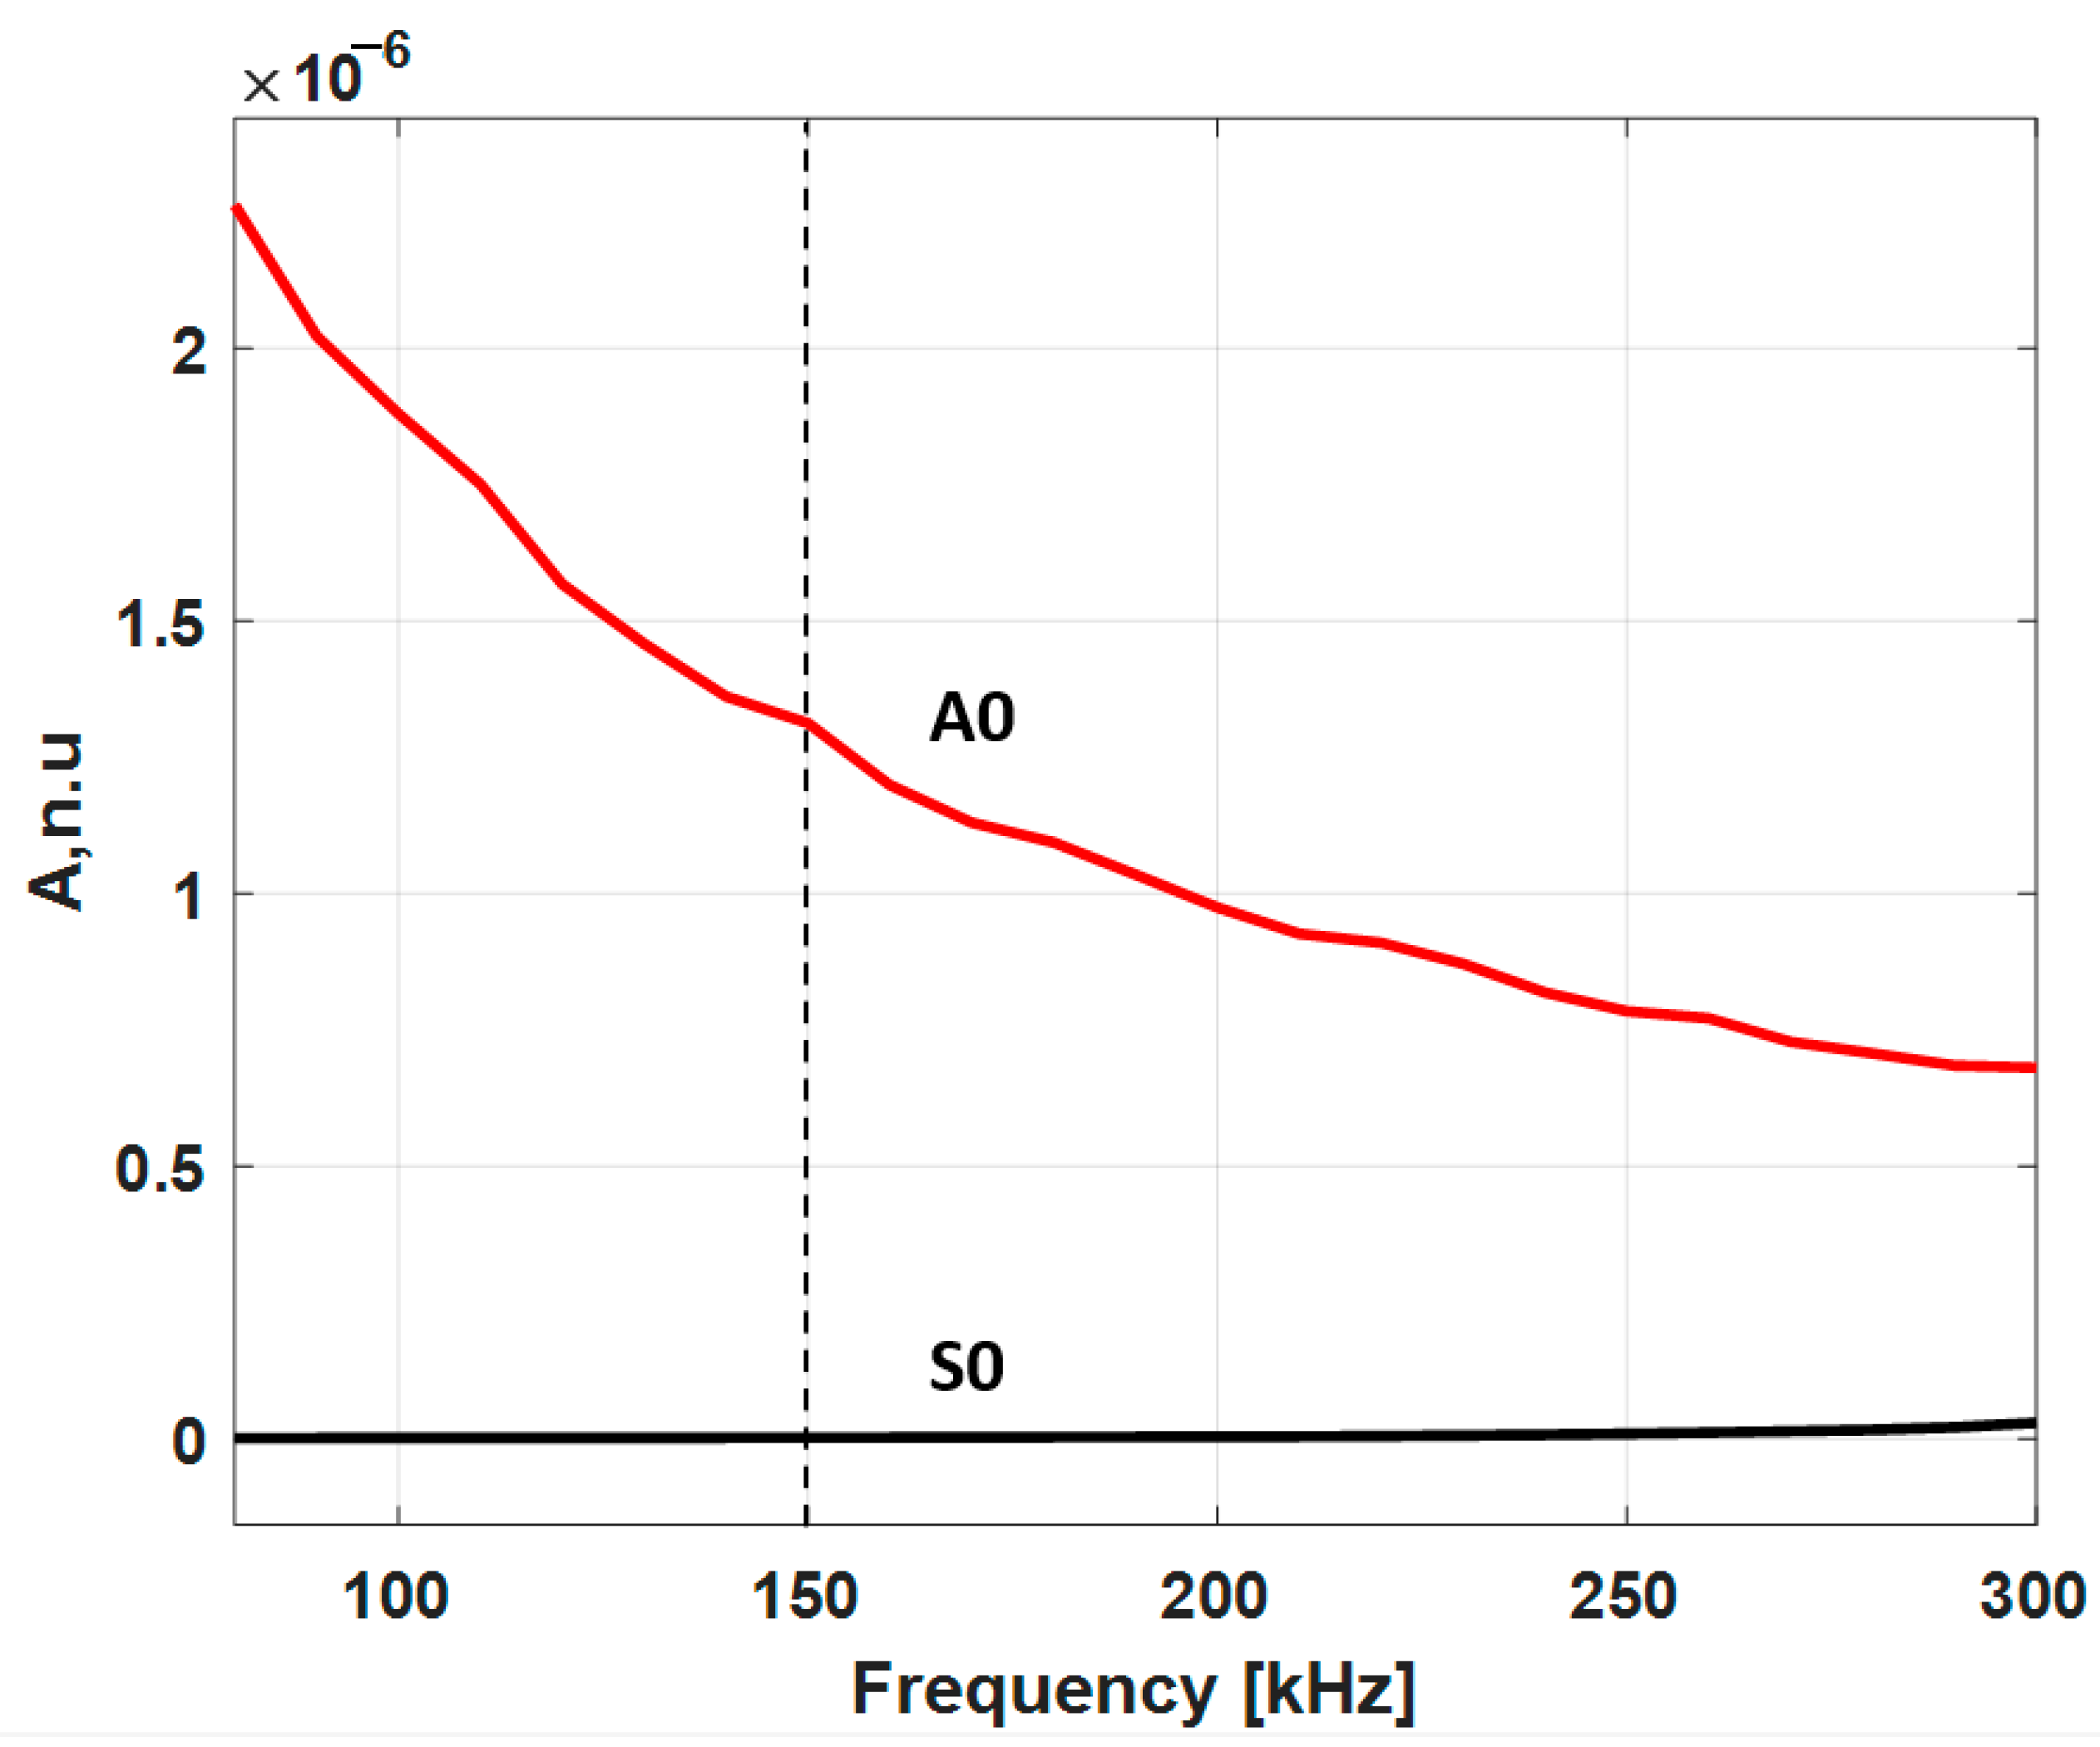
2.3. Guided Wave Frequency Tuning Curves

In GW inspection, fundamental or higher-order modes can be selected for the inspection according to dispersion curves. The dispersion curves obtained give only velocity and frequency, but the sensitive mode cannot be selected. For this purpose, GW tuning curves are important to select sensitive mode and optimal frequency for the inspection.
To obtain the frequency tuning curves, the simulation was carried out in COMSOL with a contact transducer having similar properties to those of the transducer used in the experiments. Figure 4 shows the schematic diagram of the inspection setup. GW excited with an excitation frequency range from 10 to 300 kHz on a 3.5 mm CFRP plate. The maximum displacements of both S0 and A0 were calculated for each 10 kHz frequency step. The maximum displacements of the GW modes are presented in Figure 5. Frequency tuning curves are used to select the optimal GW mode for the inspection.
The A0 mode is sensitive to delamination-type defects and is also sensitive to the length of the delamination. The displacements of the A0 mode are higher than those of the S0 mode at 150 kHz frequency and are dominant. Therefore, the A0 mode is selected for inspection.

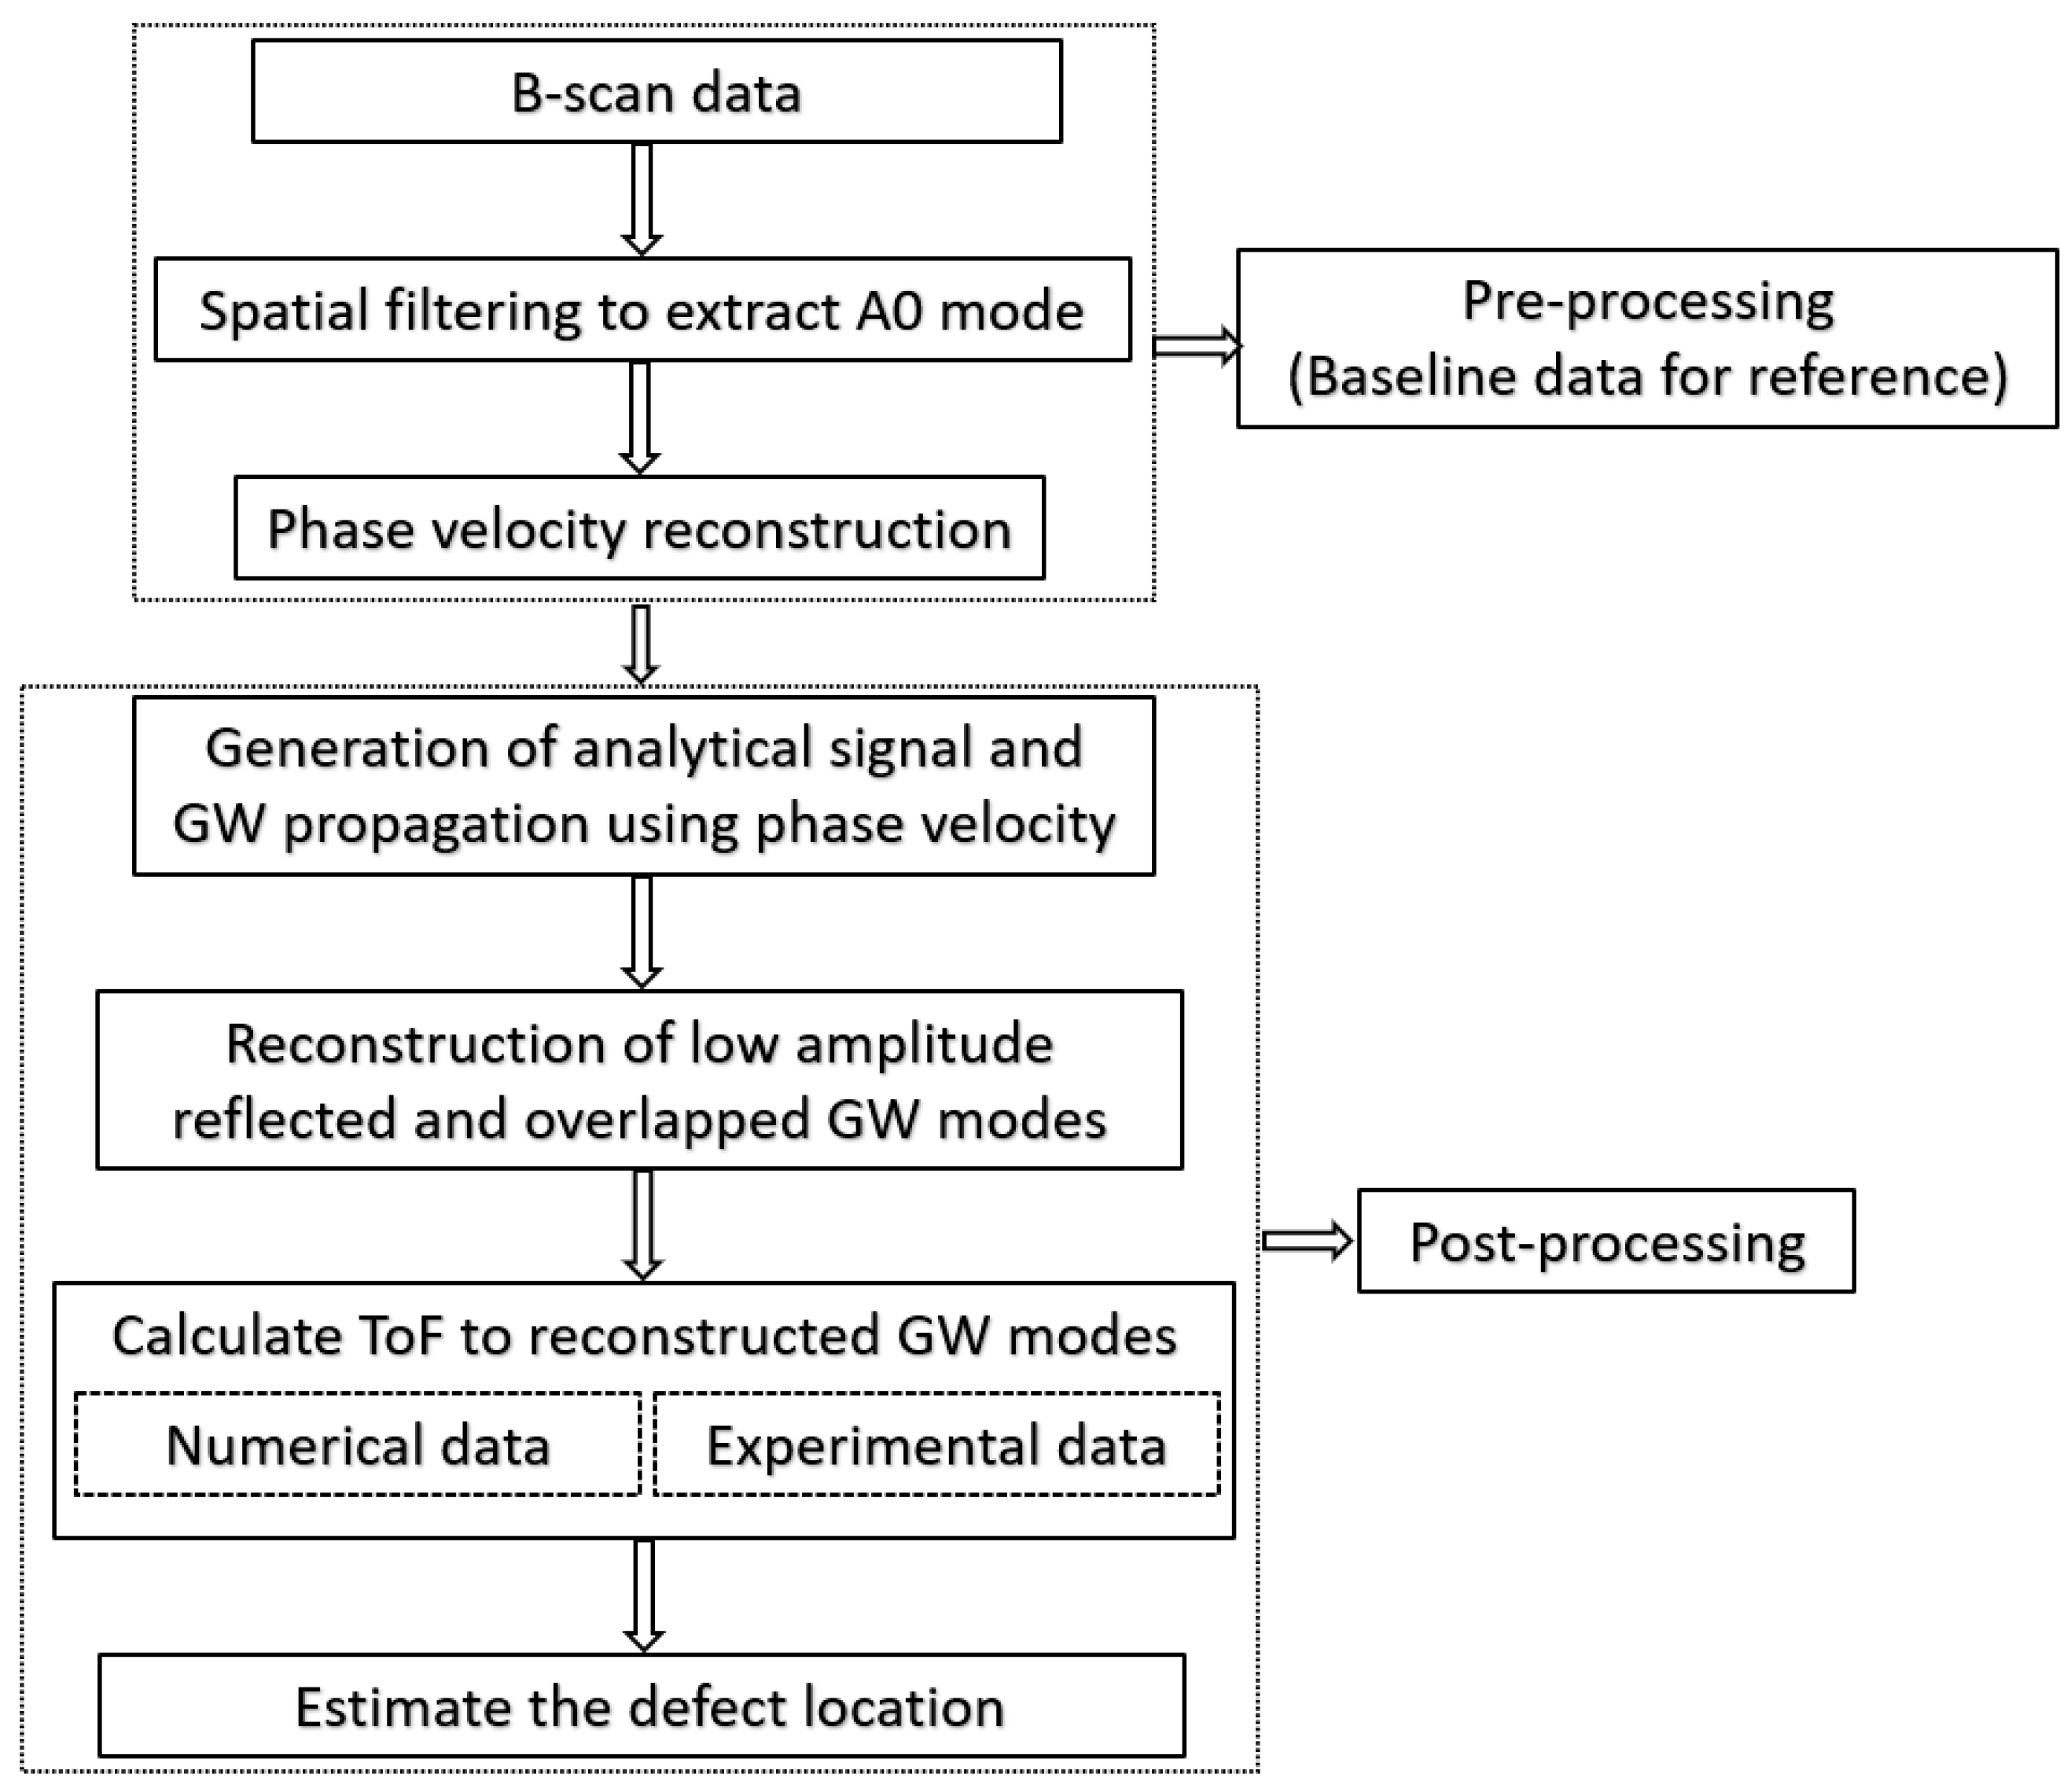
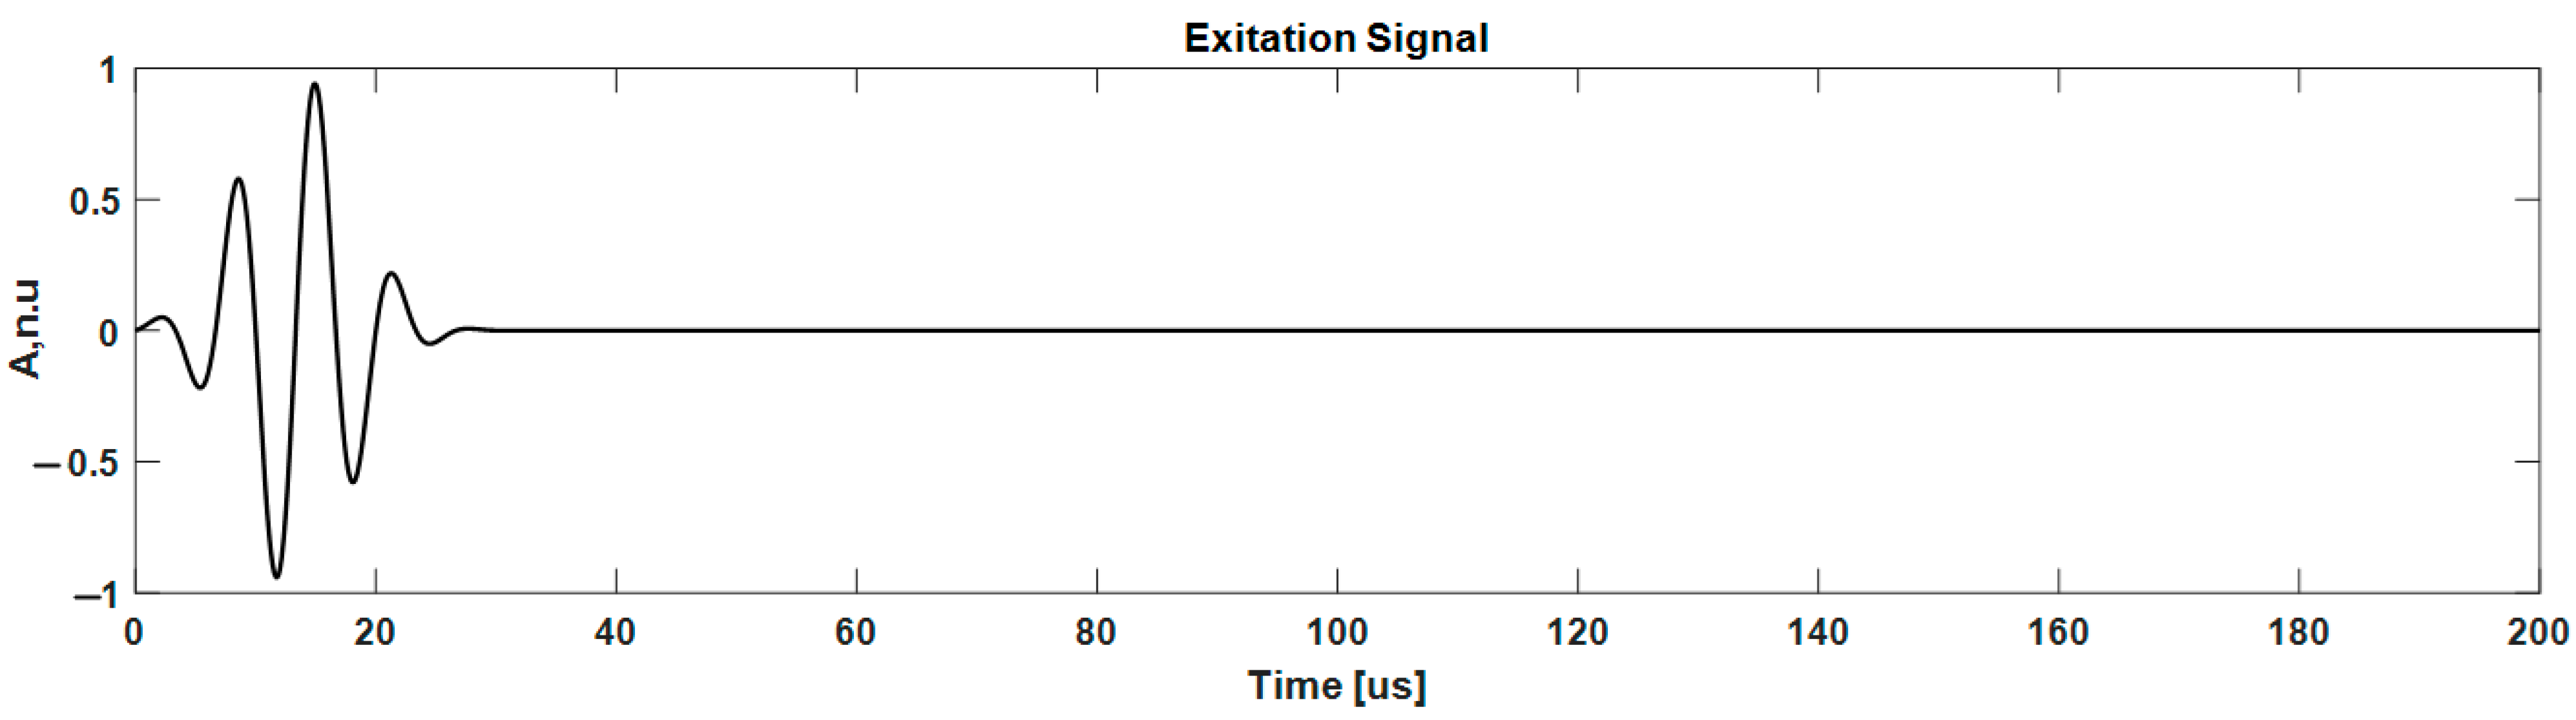
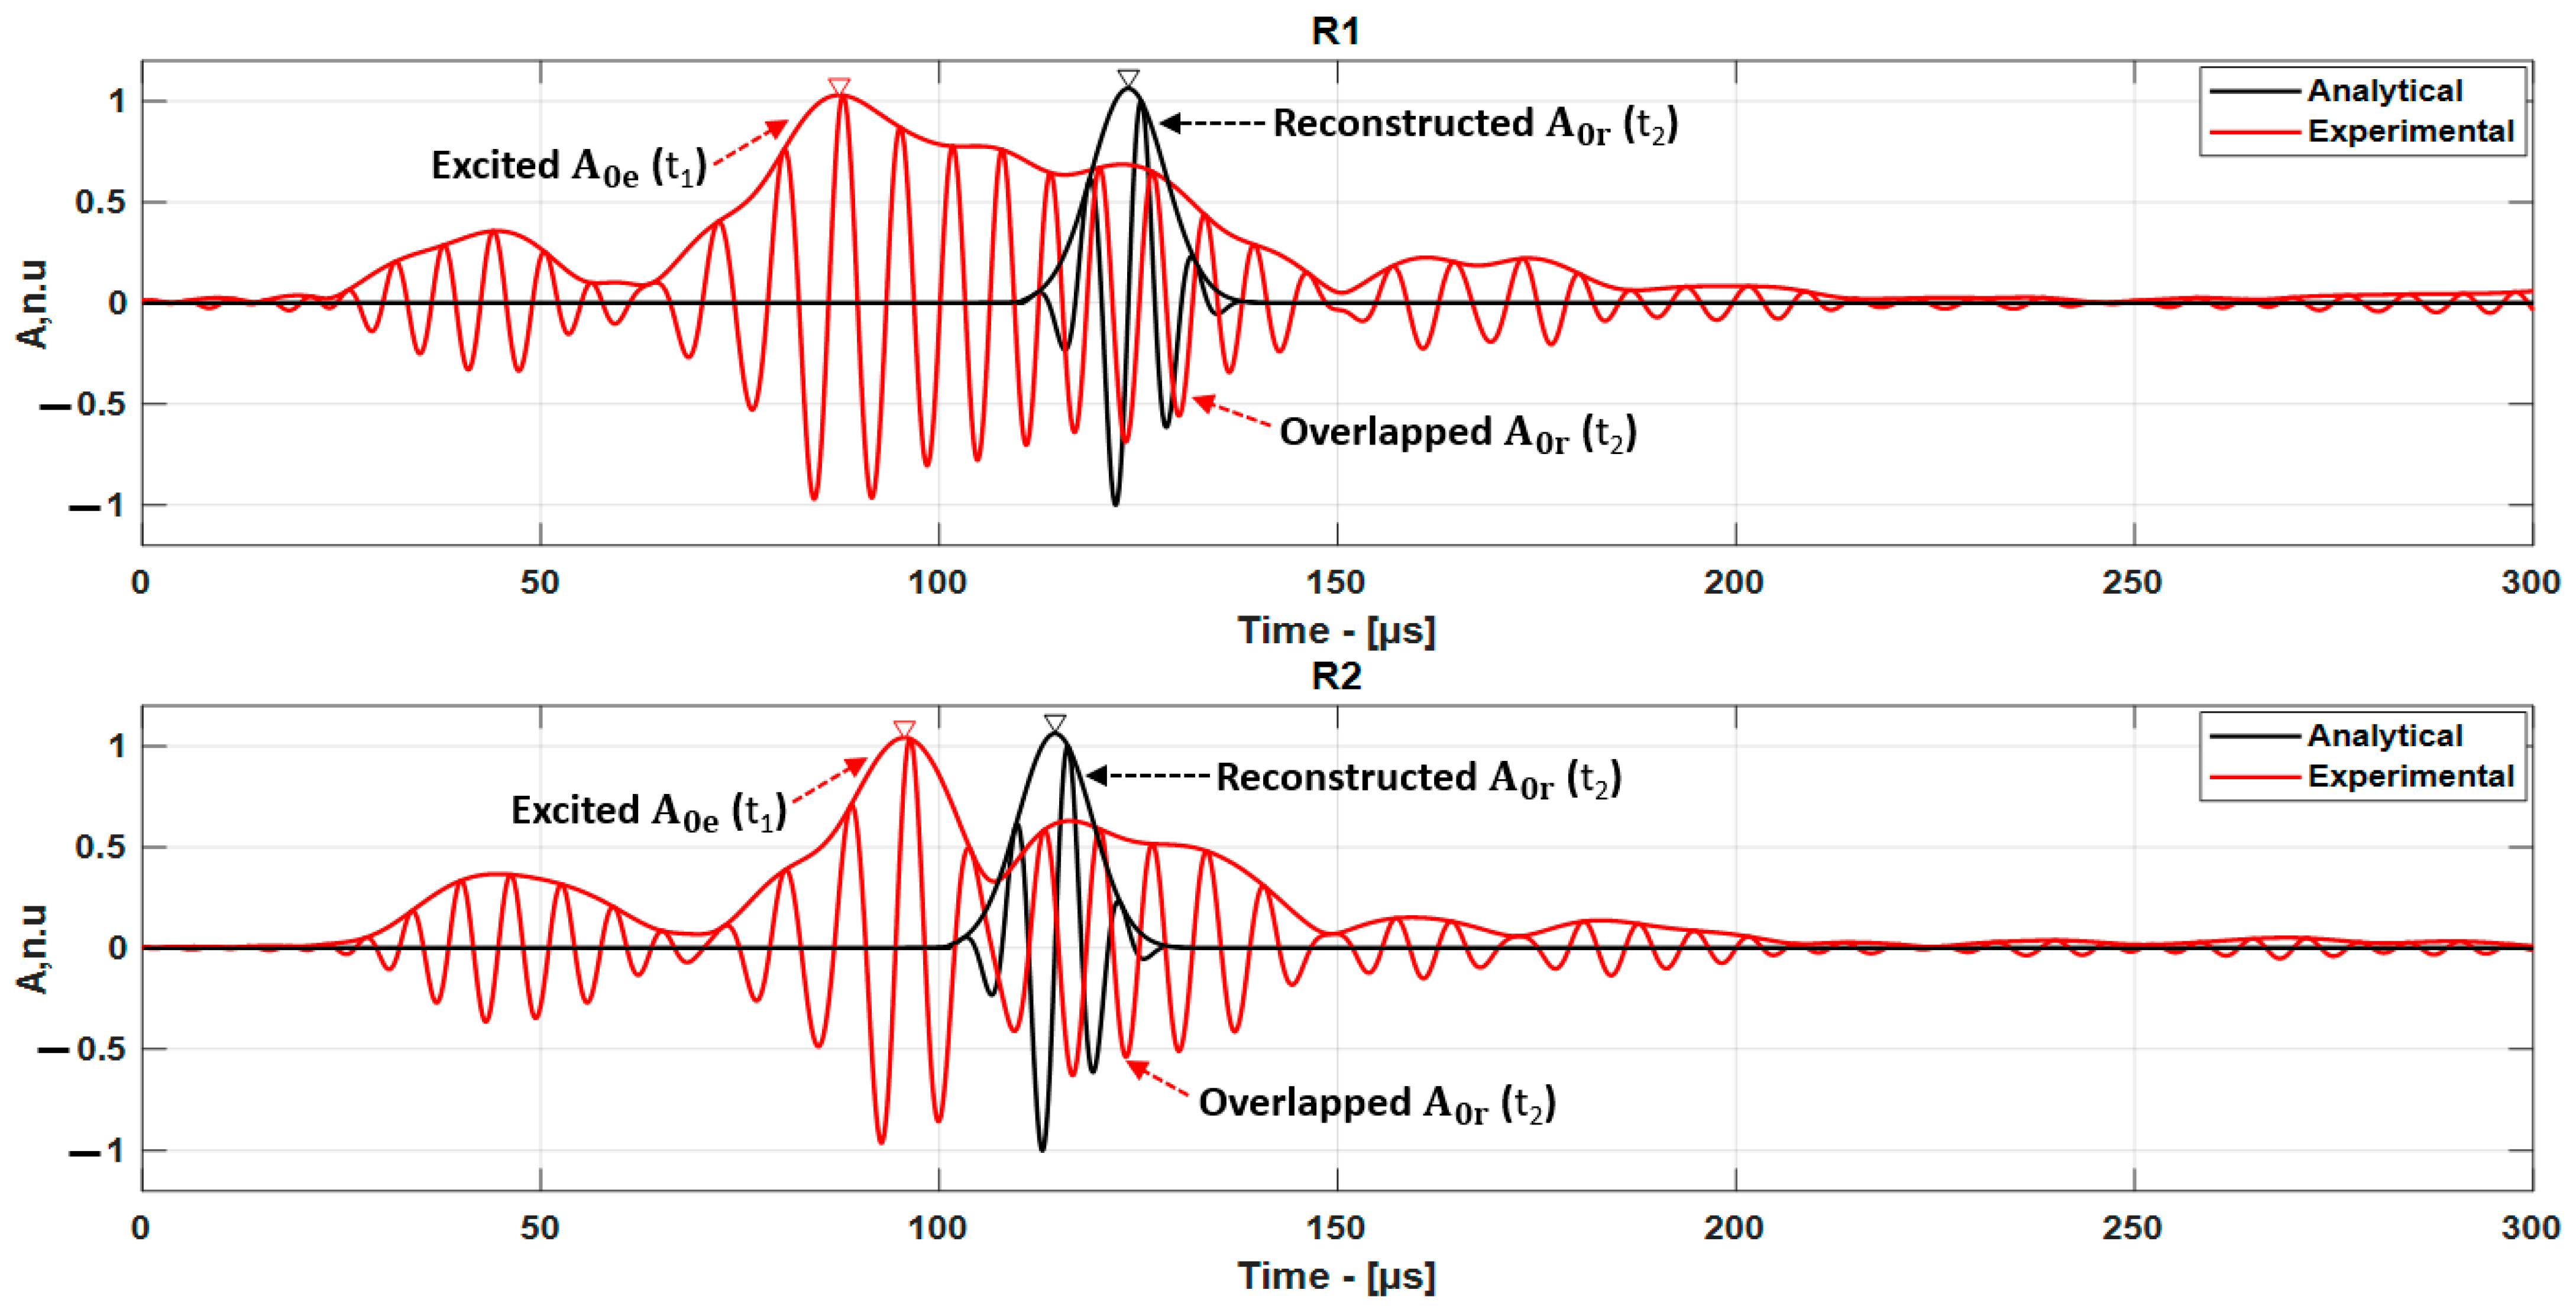
2.4. Reconstruction of GW Modes

The working procedure of the combined phase spectrum and analytical model is presented in Figure 6.
The proposed analytical model is divided into two steps: one is pre-processing, whereas B-scan data refer to baseline data obtained prior to installing the sensors to reconstruct the phase velocity of GW modes. Another is post-processing, whereas GW mode was reconstructed to measure the defect location. The first step in this method is to perform 2D FFT on B-scan data obtained from the inspection. A 2D FFT-based spatial filtering was used to filter the GW modes from the B-scan data. To separate the mode of interest, a frequency-dependent bandpass filter with cosine-tapered window was used to eliminate the S 0 mode in the frequency wavenumber domain. Then, the A 0 mode was extracted for further analysis. In this analysis, the zero-crossing technique was used to calculate the ToF along the 200 mm scanning length with a 1 mm step. The threshold level T L is assigned to define the zero crossing points to calculate the ToF of A 0 mode. The first and second half period of the signal which exceeds the defined threshold value can be expressed by the following equation [57]:
n 1 = m i n a r g [ u ( t n ) > T L ]  
where, T L is the threshold value, n is the number of periods and, u ( t n ) is the signal.
The phase velocity of the A 0 mode is calculated by the following equation:
C p h = d x d t
where dx = x 1 x 2 is the distance, dt = t 1 t 2 is the ToF, C p h is the phase velocity.
Once the phase velocity of A 0 mode is obtained, and the analytical signal was generated to reconstruct possible GW modes. The excitation signal used in the analytical model is presented in Figure 7. The excitation signal is generated in the form of the Hanning window function by the following equation [58]:
V = A . sin ω t .   s i n 2 ω t 2 N . t < 2 N π ω
where A is the amplitude of the excitation signal, ω = 2 π f is the angular frequency, t is the time, and N is the number of cycles.

2.5. Numerical Simulation of Guided Waves

Numerous mock-up trials are necessary for the experimental evaluation of each GW propagation scenario for various inspection setups, different types of flaws, loading, and environmental conditions. Numerical simulation of guided waves is an effective method to understand the propagation of GW and the interaction of various modes with delamination in composite materials.
In this 2D model, the x-axis represents the length of the plate, the y-axis represents the thickness of the plate, and the z-axis is infinitely long. The velocity of the guided wave varies due to anisotropic properties and ply direction. Numerical simulation using a 3D model could model guided wave propagation in all directions. However, 20 elements per wavelength criterion in 3D modeling of ultrasonic GW propagation would consume a significant amount of time and computational resources.
Therefore, in this research, a numerical simulation of GW propagation was performed using the 2D plane strain model. The simulation involved 3750 time steps, with each step lasting 0.08 s. The duration of the propagation of the GW in the simulation was 300 µs. In the finite element method (FEM), the mesh size and shape are key features. The simulation was performed using CPE4R-type elements, which are quadrilateral elements specifically designed for plain-strain models. These elements offer faster hourglass control and faster integration, resulting in reduced mesh deformation and a finer mesh.
The accuracy of the GW simulation depends on the mesh size. A finer mesh gives accurate results but increases computation time. Twenty elements per wavelength (λ) criterion was selected to maintain the balance between accuracy and computation time. Therefore, the mesh size was 0.6 mm.
By applying normal force to the excitation zone, the fundamental asymmetrical ( A 0 ) mode was excited. The input signal was a three-cycle sine wave with a driving frequency of 150 kHz. The selected frequency provides an optimal balance between dispersion, attenuation, and mode complexity. To extract the A 0 mode, signals were recorded on the plate surface at every 0.6 mm, and the corresponding B-scan data were obtained. The B-scan data were then subjected to a 2D fast Fourier transform to determine the phase velocity at each frequency, as shown in Figure 8.
The dispersion characteristics of the guided waves in the CFRP plate were obtained using a 2D fast Fourier transform. The propagation of guided waves along the plate is represented by u(x,t) in terms of distance and time and was transformed into the wavenumber, k, at each frequency using the 2D FFT method [59]:
H ( k , f ) = + + u ( x , t ) e j ( k x + ω t ) d x d t
where x is the distance, t is the time, ω is the angular frequency, and k is the wavenumber.

3. Results and Discussion

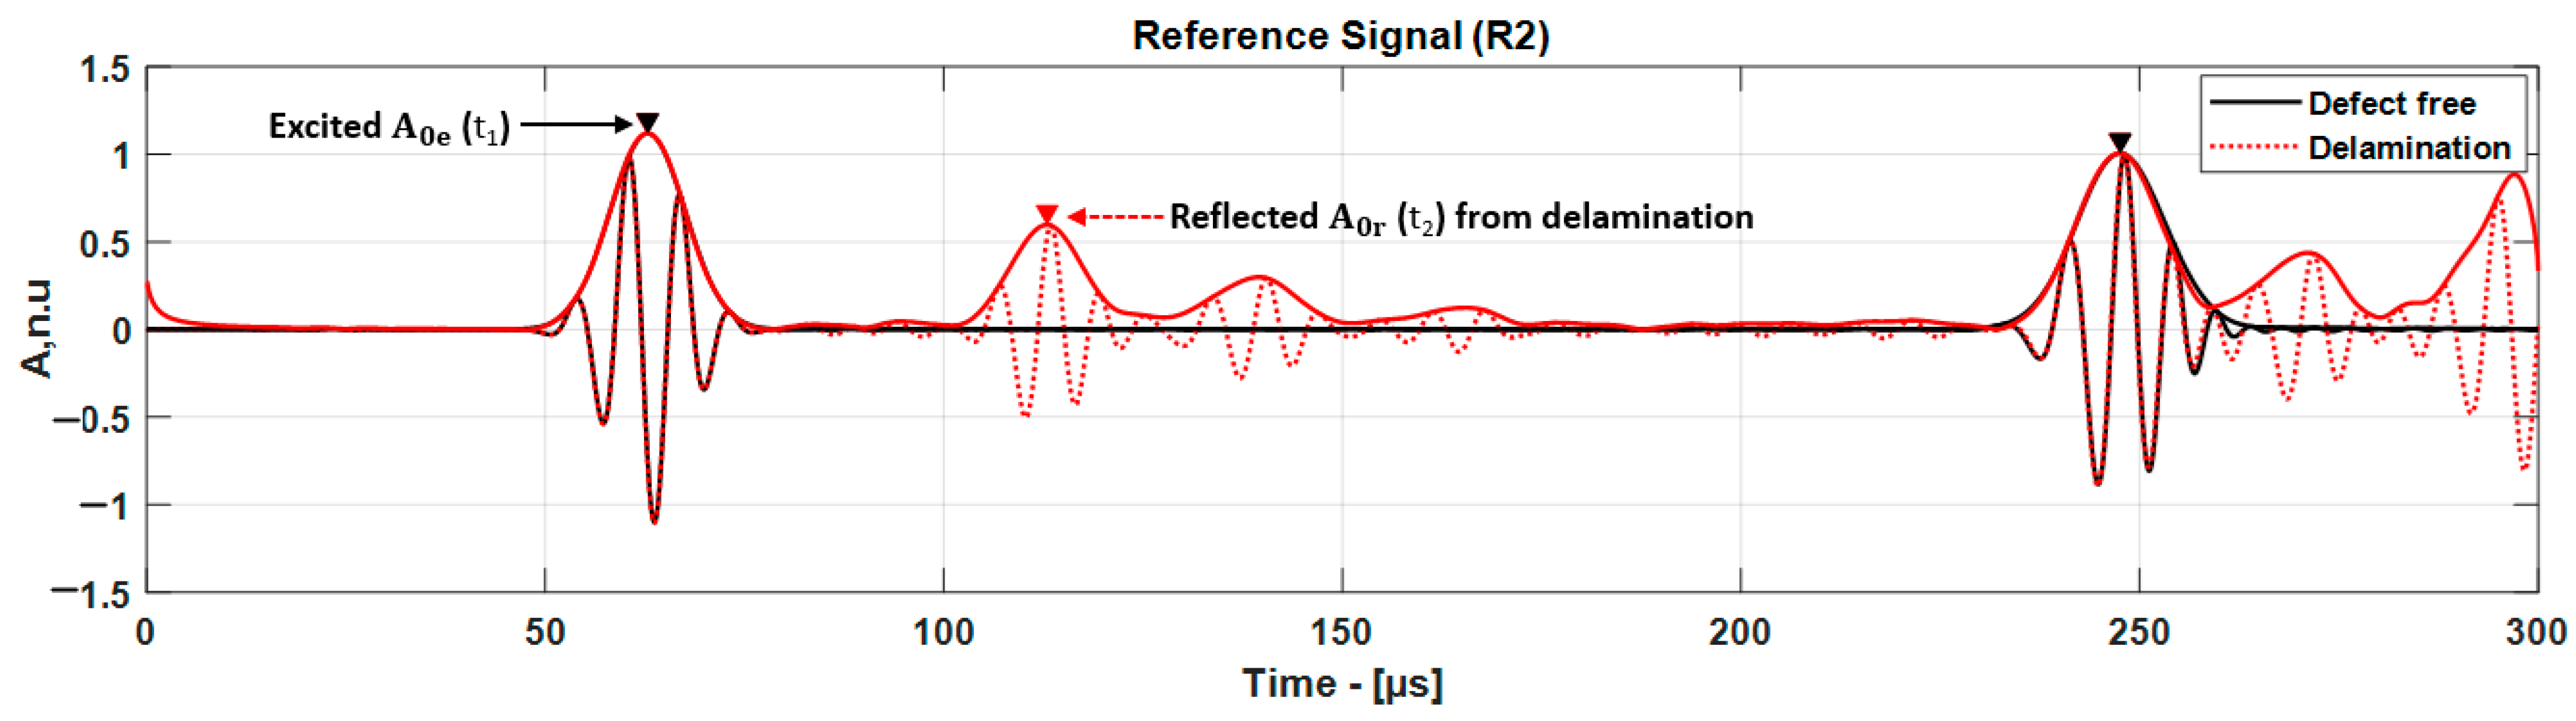
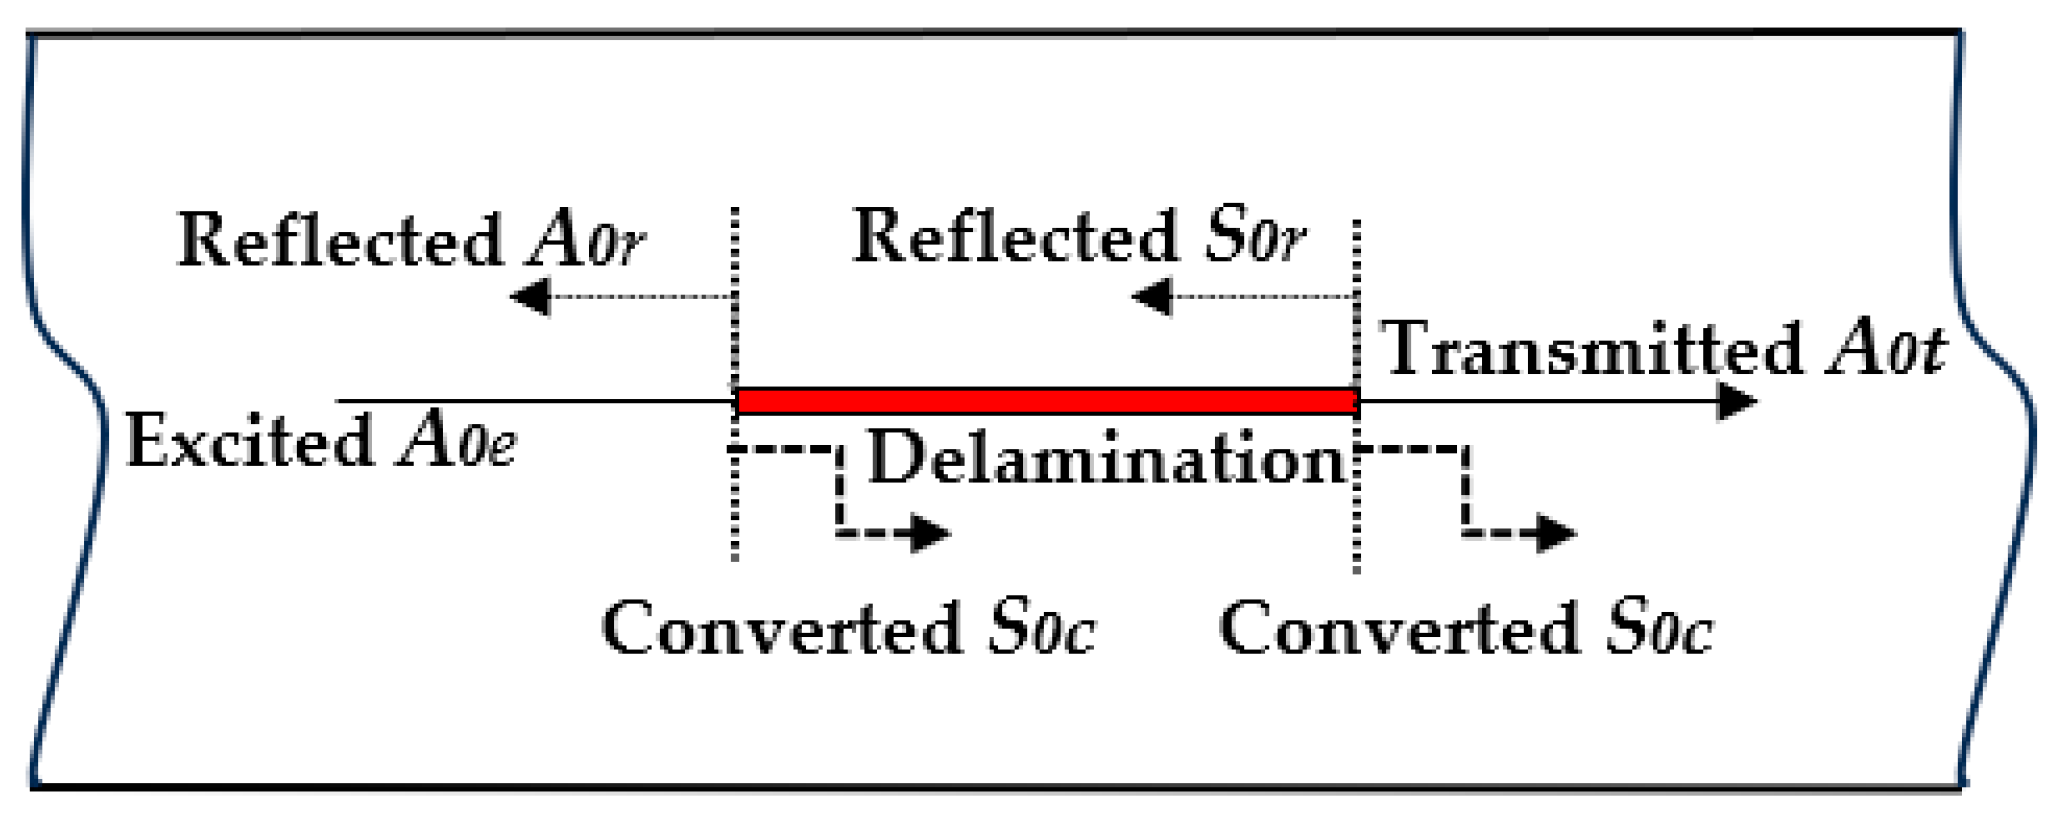
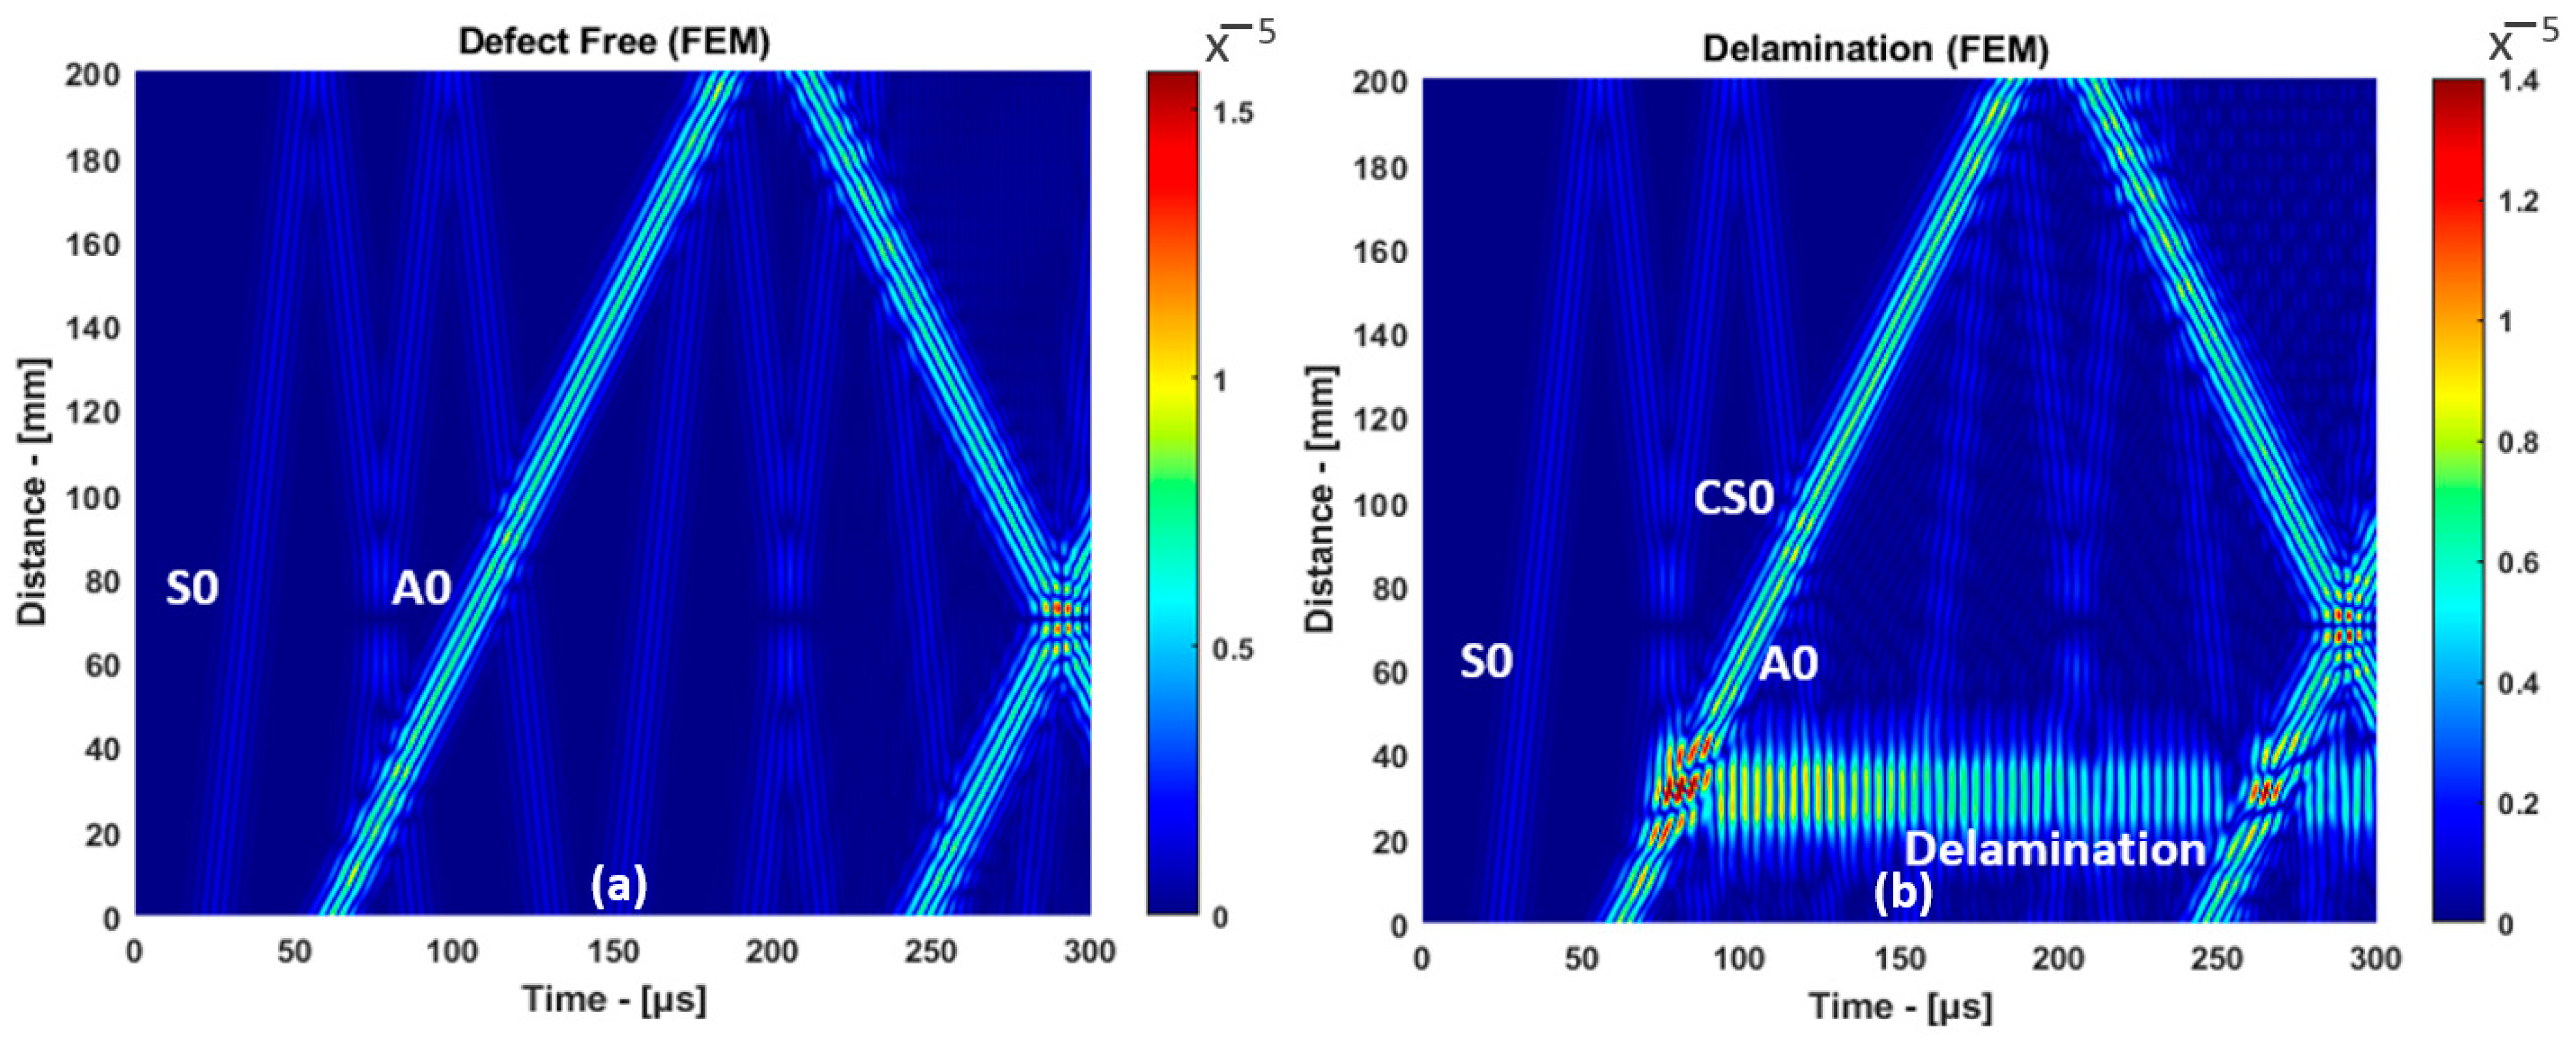
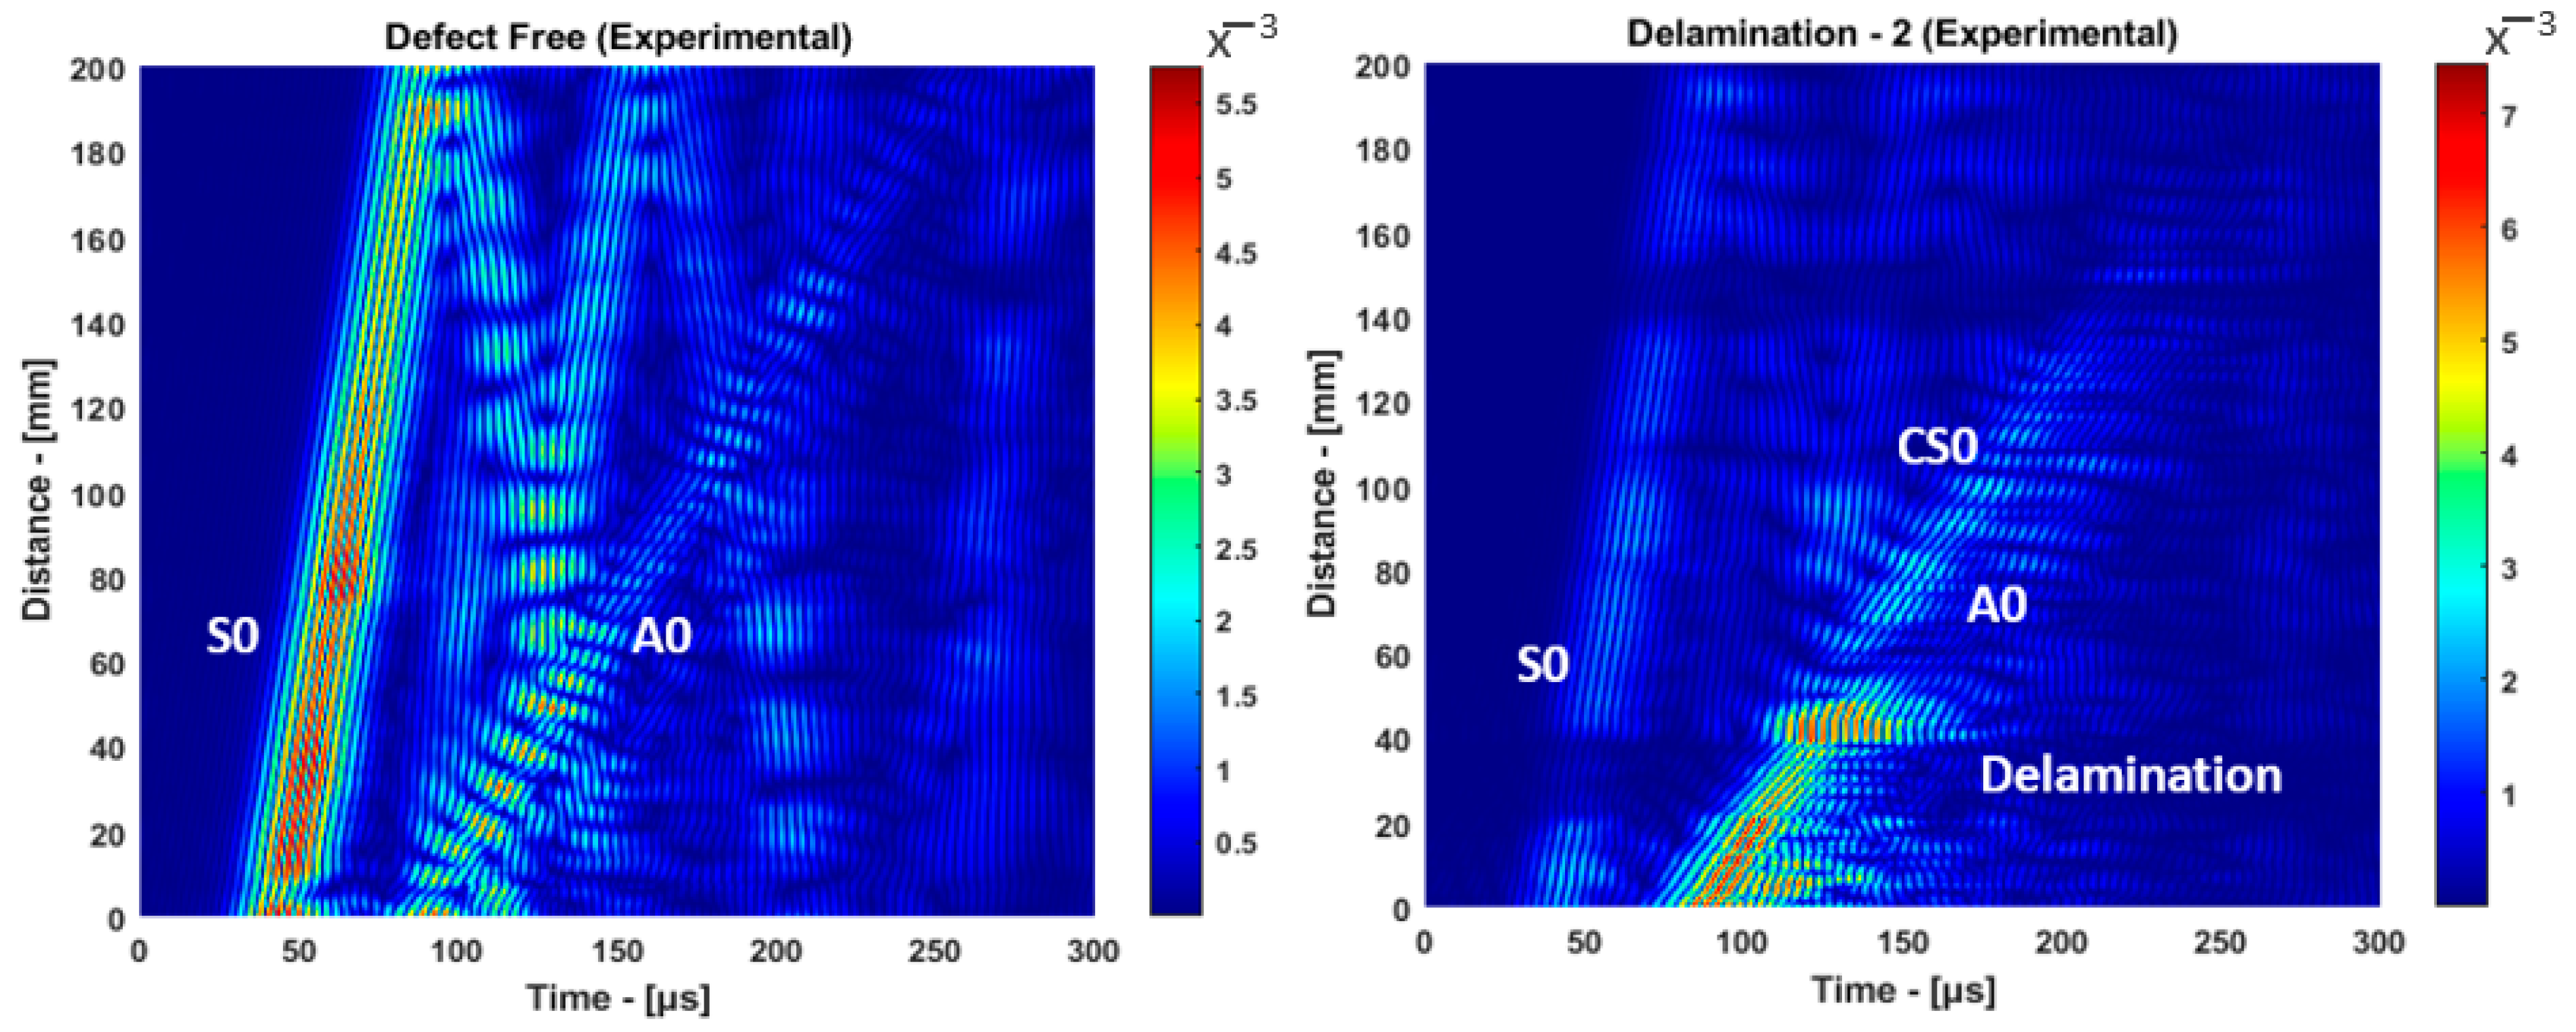
3.1. Guided Wave Interaction with Delamination

For reference, the defect-free signal is required to be compared with the signal in case of delamination. Then, the reference location of delamination is estimated by calculating the ToF between t 1 and t 2 as shown in Figure 9.
The low amplitude reflected and overlapped converted modes can be reconstructed by considering the estimated reference location using the defect-free signal and phase velocity from the phase spectrum approach. Using the analytical model, targeted modes can be reconstructed at any distance with an accurate time of flight. By comparing the analytical signal with the numerical or experimental signal, the defect location can be estimated.
After interaction with delamination, guided waves are reflected, transmitted, and converted to other modes, as shown in Figure 10. Part of excited A 0 e mode is reflected at the leading edge of the delamination, i.e., A 0 r mode, and another part of the excited A 0 e is converted into S 0 mode. i.e., S 0 c mode.
In this study, the A0 mode is dominant, and the S0 mode has a lower amplitude. Therefore, the out-of-plane displacement component of guided waves is extracted for analysis, as shown in Figure 11.
In the case of defect-free, both S0 and A0 modes are reflected from the leading and trailing edge of the plate. In the case of delamination, the A0 mode is reverberated multiple times within the delamination due to the displacement profile of the A0 mode being perpendicular to the delamination. The reflection coefficient of the S0 mode is lower compared to the A0 mode because the displacement profile of the S0 mode is parallel to the delamination.

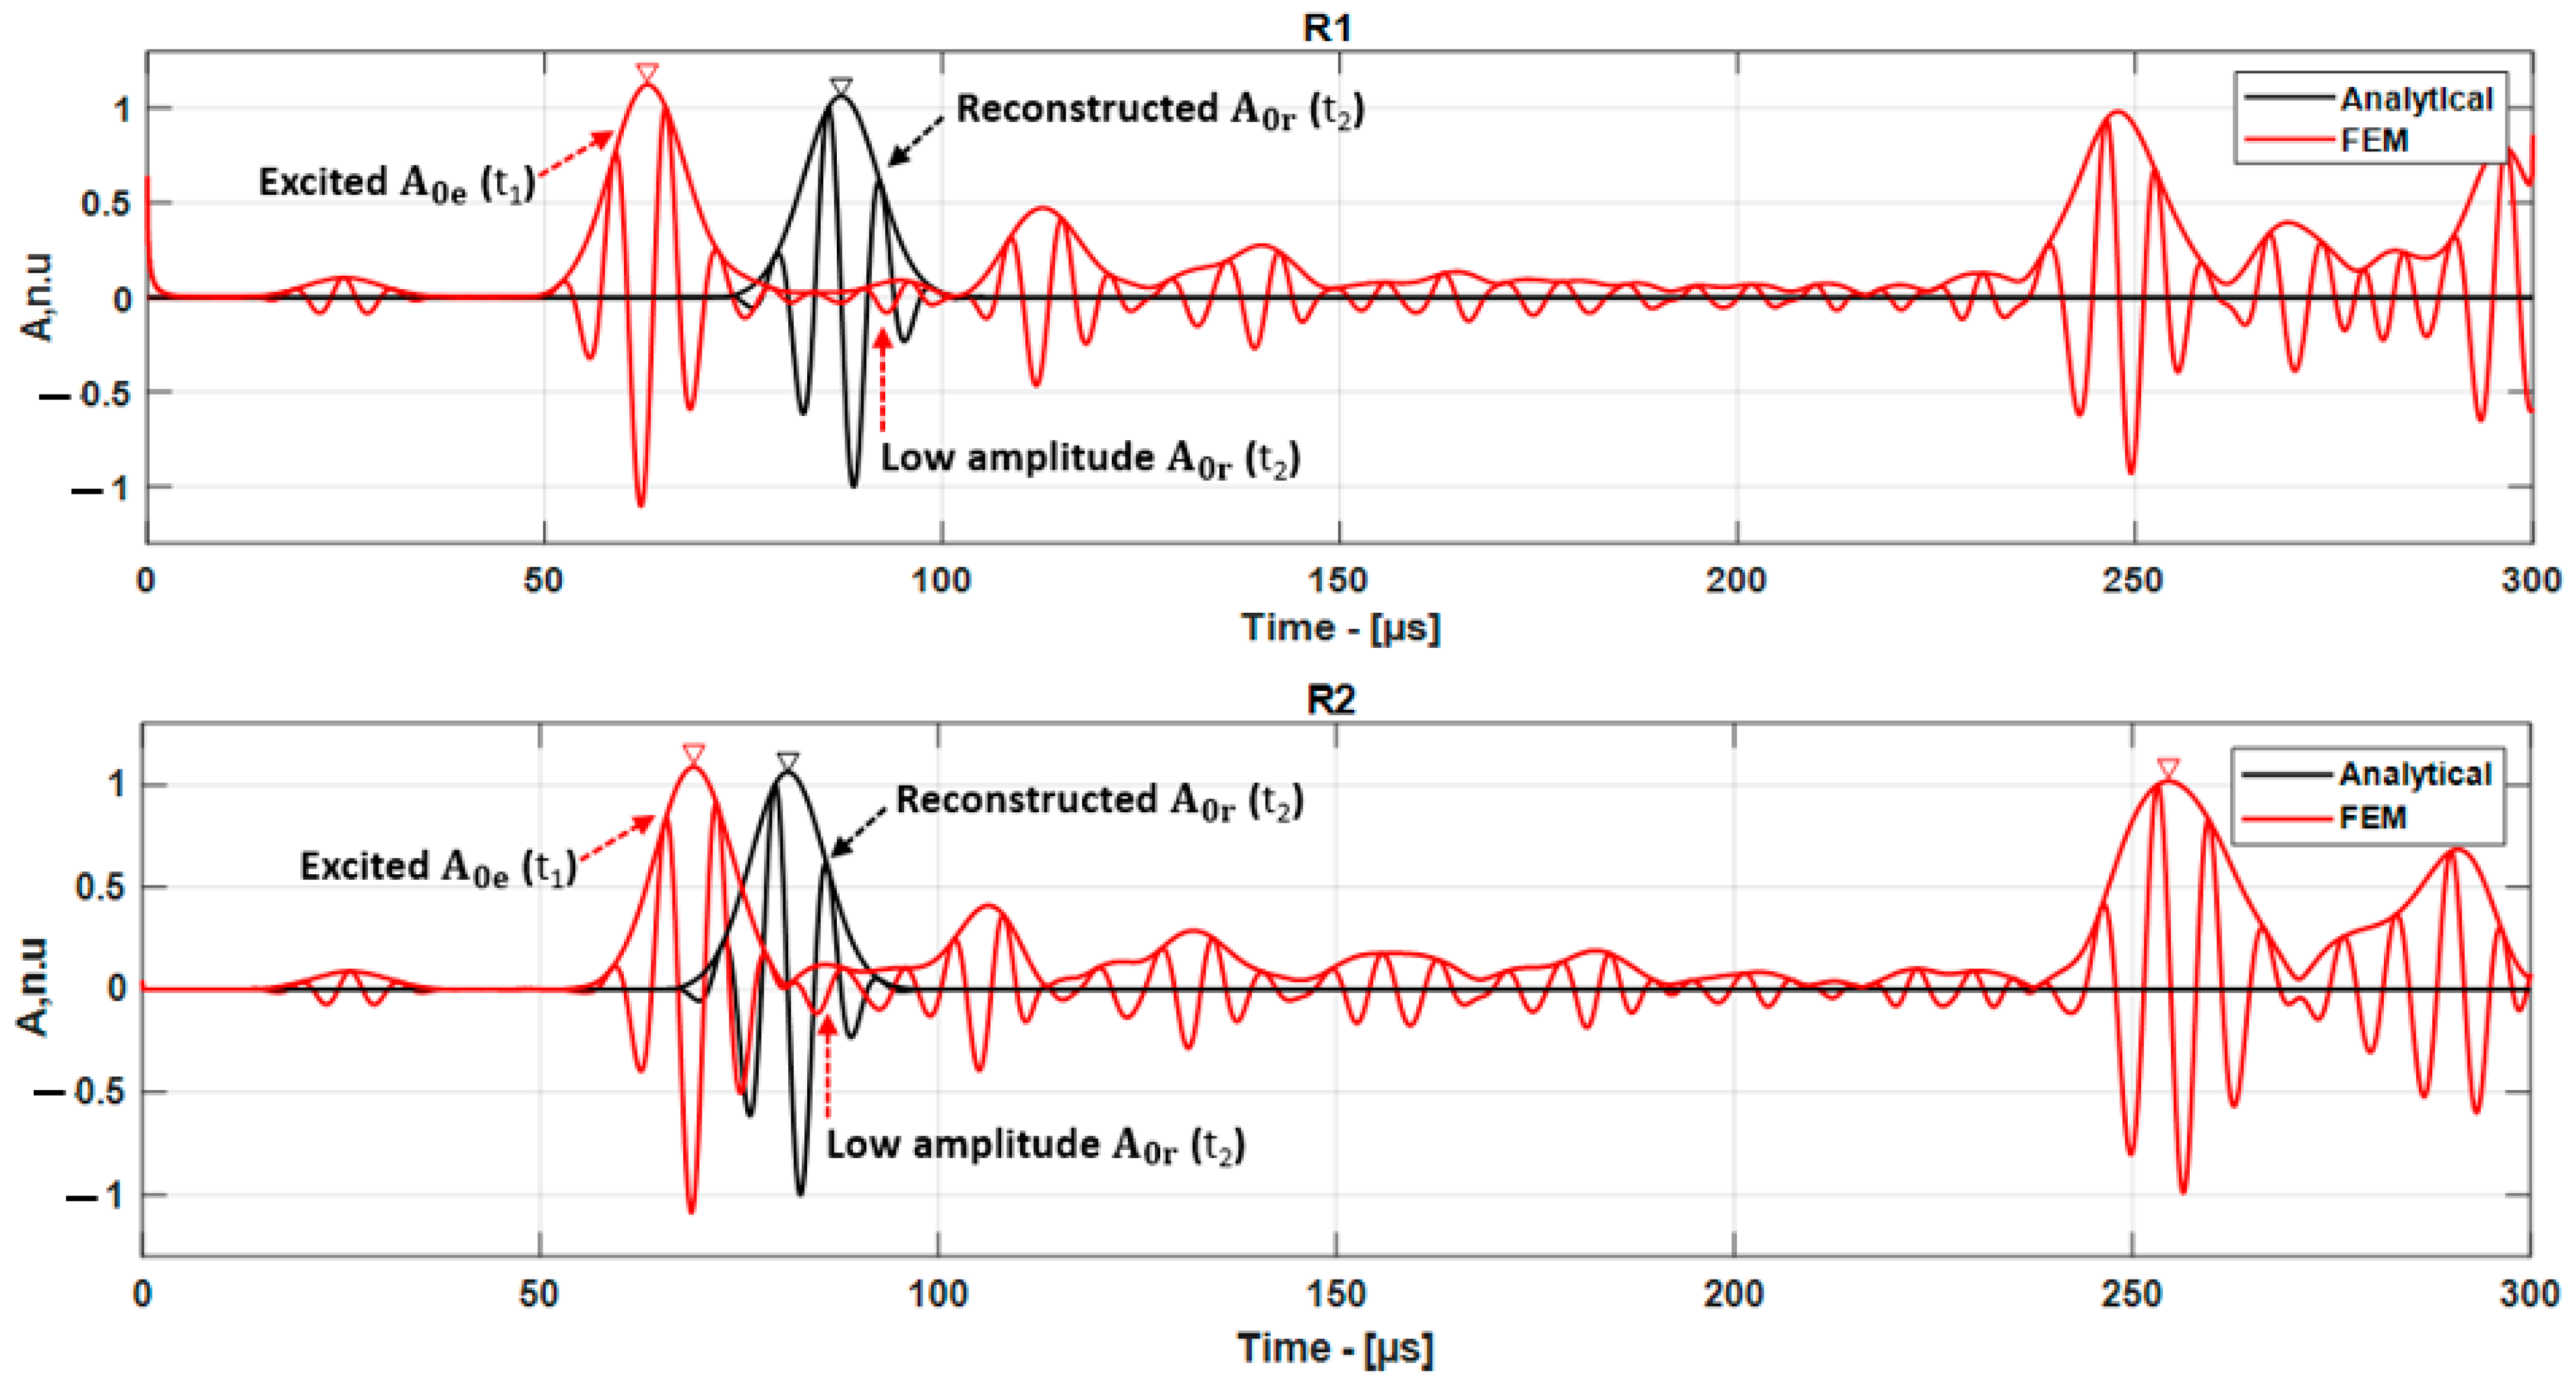
3.2. Localization of Delamination Using an Analytical Model

The interaction of guided waves with the delamination located at 250 mm was analyzed. To determine the position of the delamination (Xd), two different receiver positions were used. The GW signals were received (Xr) at 20 mm and 10 mm from the leading edge of the delamination. In this specific scenario, the A0 mode, which is reflected from the leading edge of the delamination, was analyzed for the purpose of localizing the delamination.
During the analysis of the reflected A0 mode from the delamination, the A0 mode that is initially excited and propagates directly to the receiver is referred to as the direct A0 mode (t1). Similarly, the reflection from the leading edge of the delamination is denoted as t2. Taking into account the time of flight (ToF) between t1 and t2, it is possible to determine the location of the delamination.
During guided wave inspection, the reflection coefficients of the excited A 0 e mode change based on the delamination position within the specimen thickness. As a result, the reflection obtained from the leading edge of the delamination tends to have a lower amplitude. Delamination estimation using these lower amplitude modes is complex. For this reason, an analytical model was developed to match the lower amplitude A 0 r   mode, and then the ToF of the reflected mode (t2) is estimated.
Figure 12 shows the Hilbert envelope of the asymmetrical mode of guided wave signals received at various receiver positions. The envelope of the guided wave signal, represented by H(t), is obtained using the Hilbert transform and can be expressed using the following equation [45]:
H t = H i l b e r t x t
By calculating the time of flight (ToF) between t 1 and t 2 , the delamination location can be estimated based on the time difference between direct and reflected A 0 mode.
X e = t · c g 2   ,
where c g is the group velocity and t = t 2 t 1 is the time difference between direct and reflected A 0 mode.
The distance from the receiver to delamination estimated using an analytical model is presented in Table 3. In this case, the location of the delamination was estimated by taking into account the reflection from the leading edge of the delamination. The absolute error to estimate the delamination location was calculated by considering the difference between the actual and measured value by the following equation:
ε a = |   D a D m |
where ε a is the absolute error, and Da and Dm are the actual and measured values, respectively.
In the case where the delamination is between the excitation source and the receiver, GW signals were received at distances of 280 mm, 290 mm, and 300 mm from the leading edge of the CFRP plate. The distance between the delamination and the receiver (Xdr) was measured as 10 mm, 20 mm, and 30 mm. In this case, when the A 0 mode propagates above and below the delamination, part of it is transmitted A 0 and part of it is converted into S 0 mode. The converted S 0 mode is received at the receiver as the first wave packet (t1), while the transmitted A 0 mode continues to propagate within the delamination and is received as the second wave packet (t2), as shown in Figure 13.
Analyzing the guided wave (GW) signals becomes challenging due to the differing velocities of the converted S0 modes combined with the transmitted A0 mode or other modes. Estimation of delamination location in case of overlapped modes is complex. For this reason, an analytical model was developed to match the overlapped modes, and then the ToF of the converted S0 mode (t2) can be estimated.
The delamination location (Xd) can be estimated by calculating the ToF between the converted S0 mode and the transmitted A0 mode. The estimated distance from the delamination to the receiver and the absolute error of the estimated delamination position are presented in Table 4.

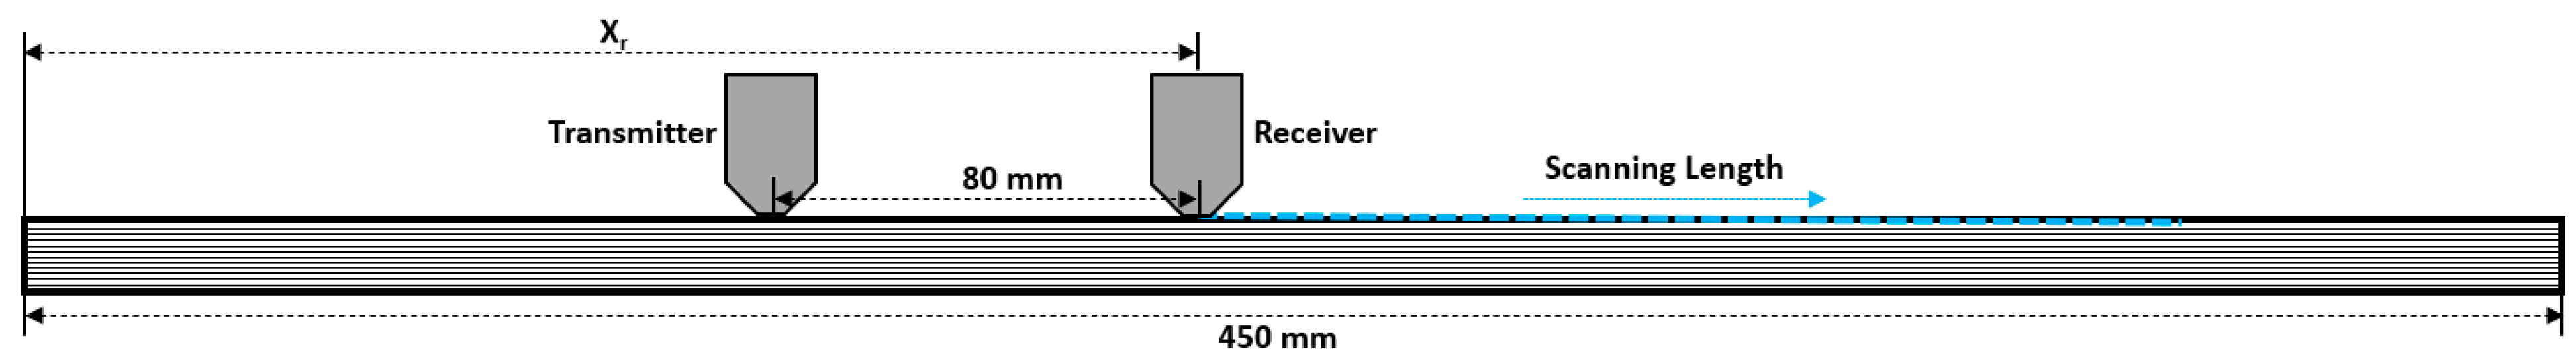
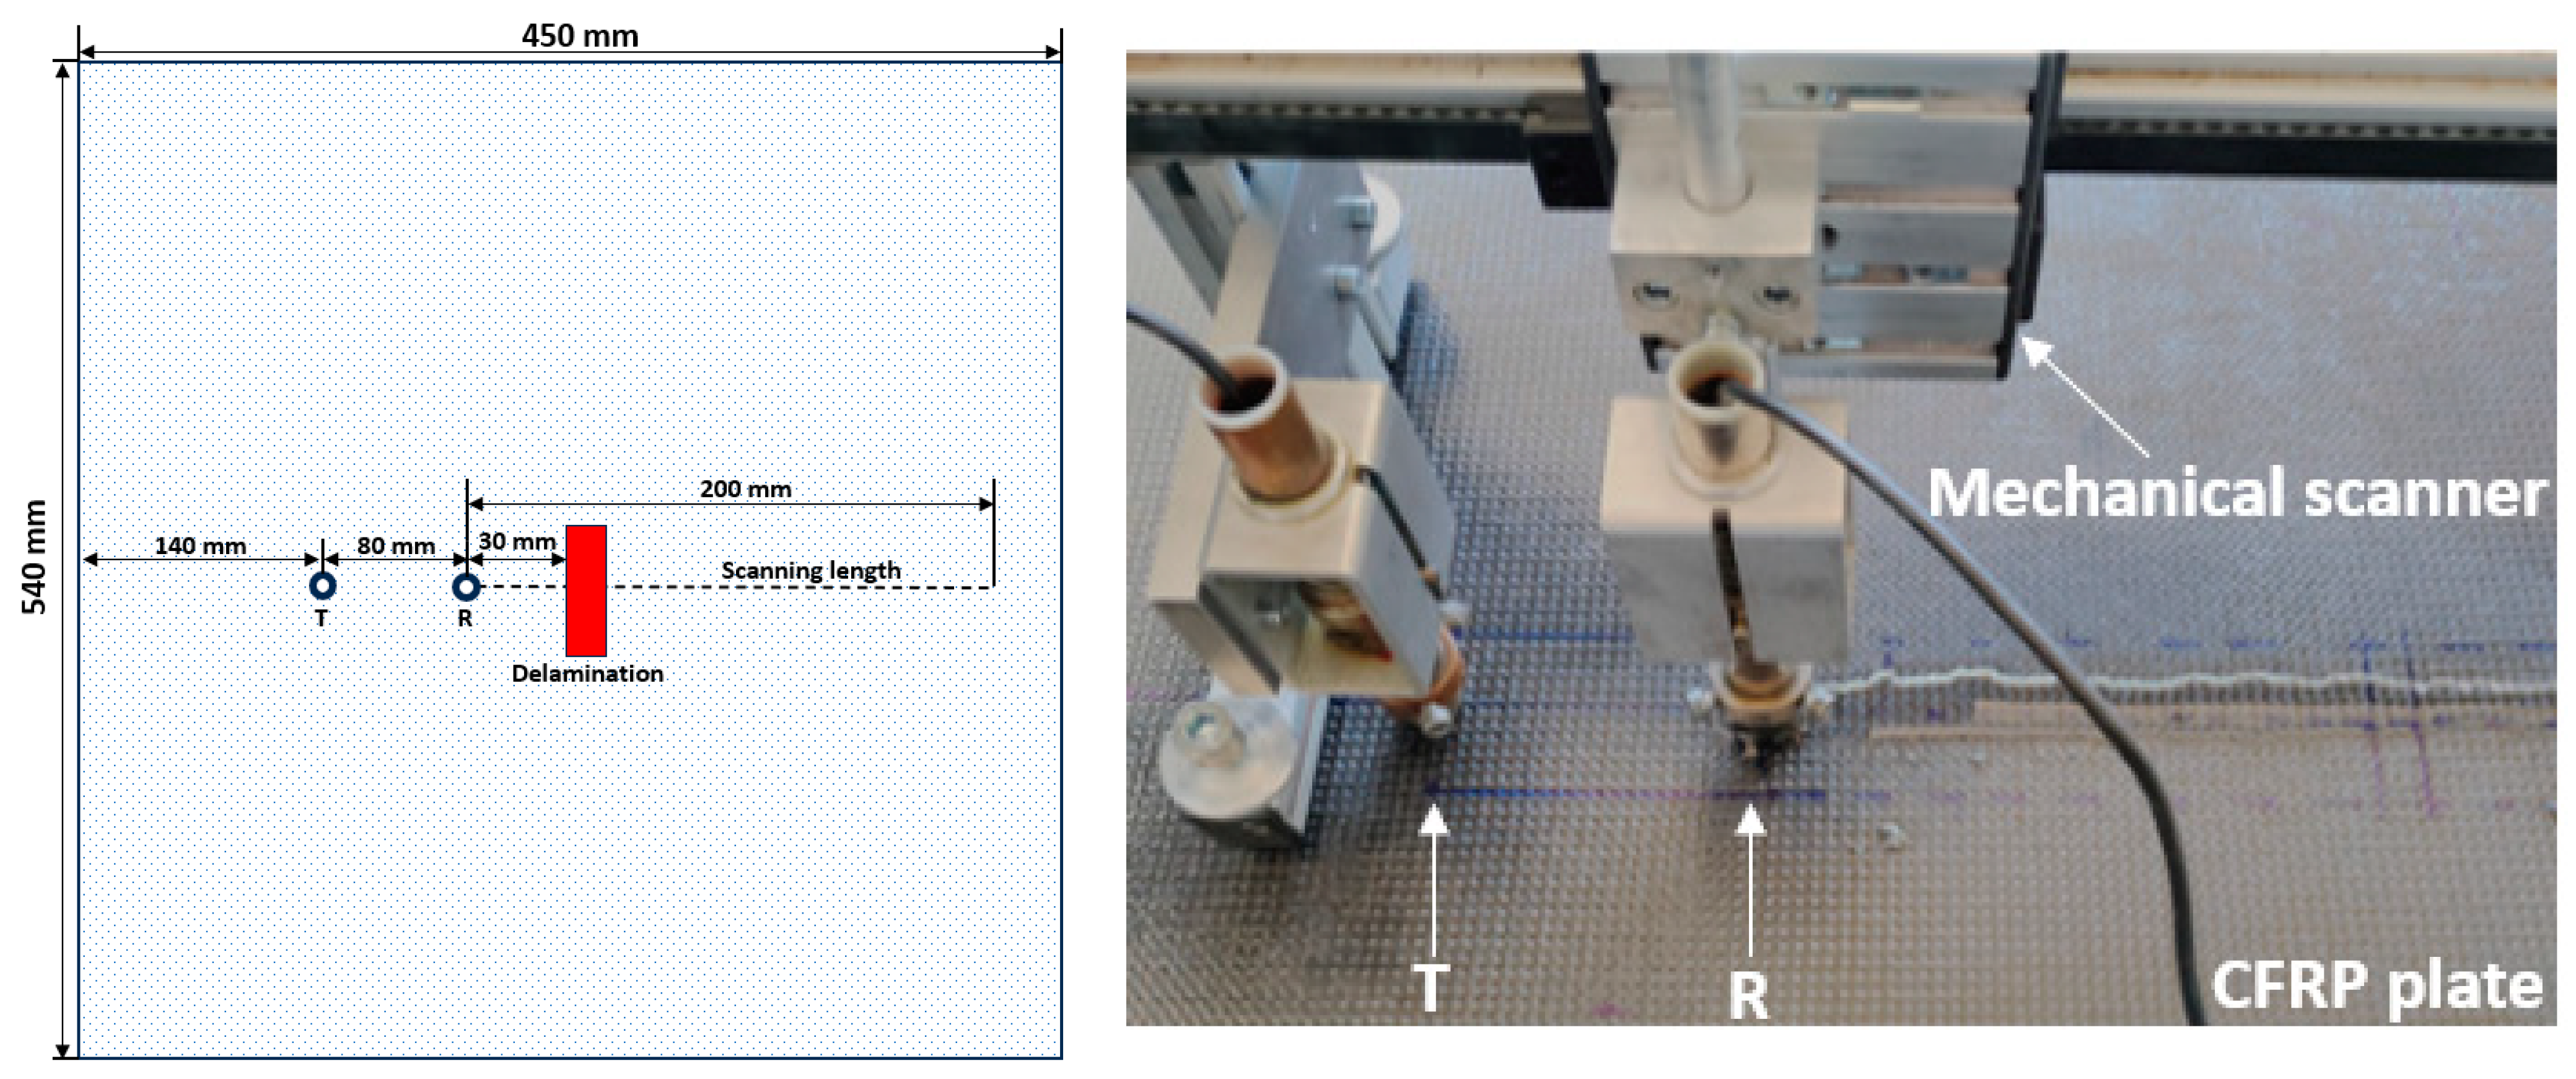
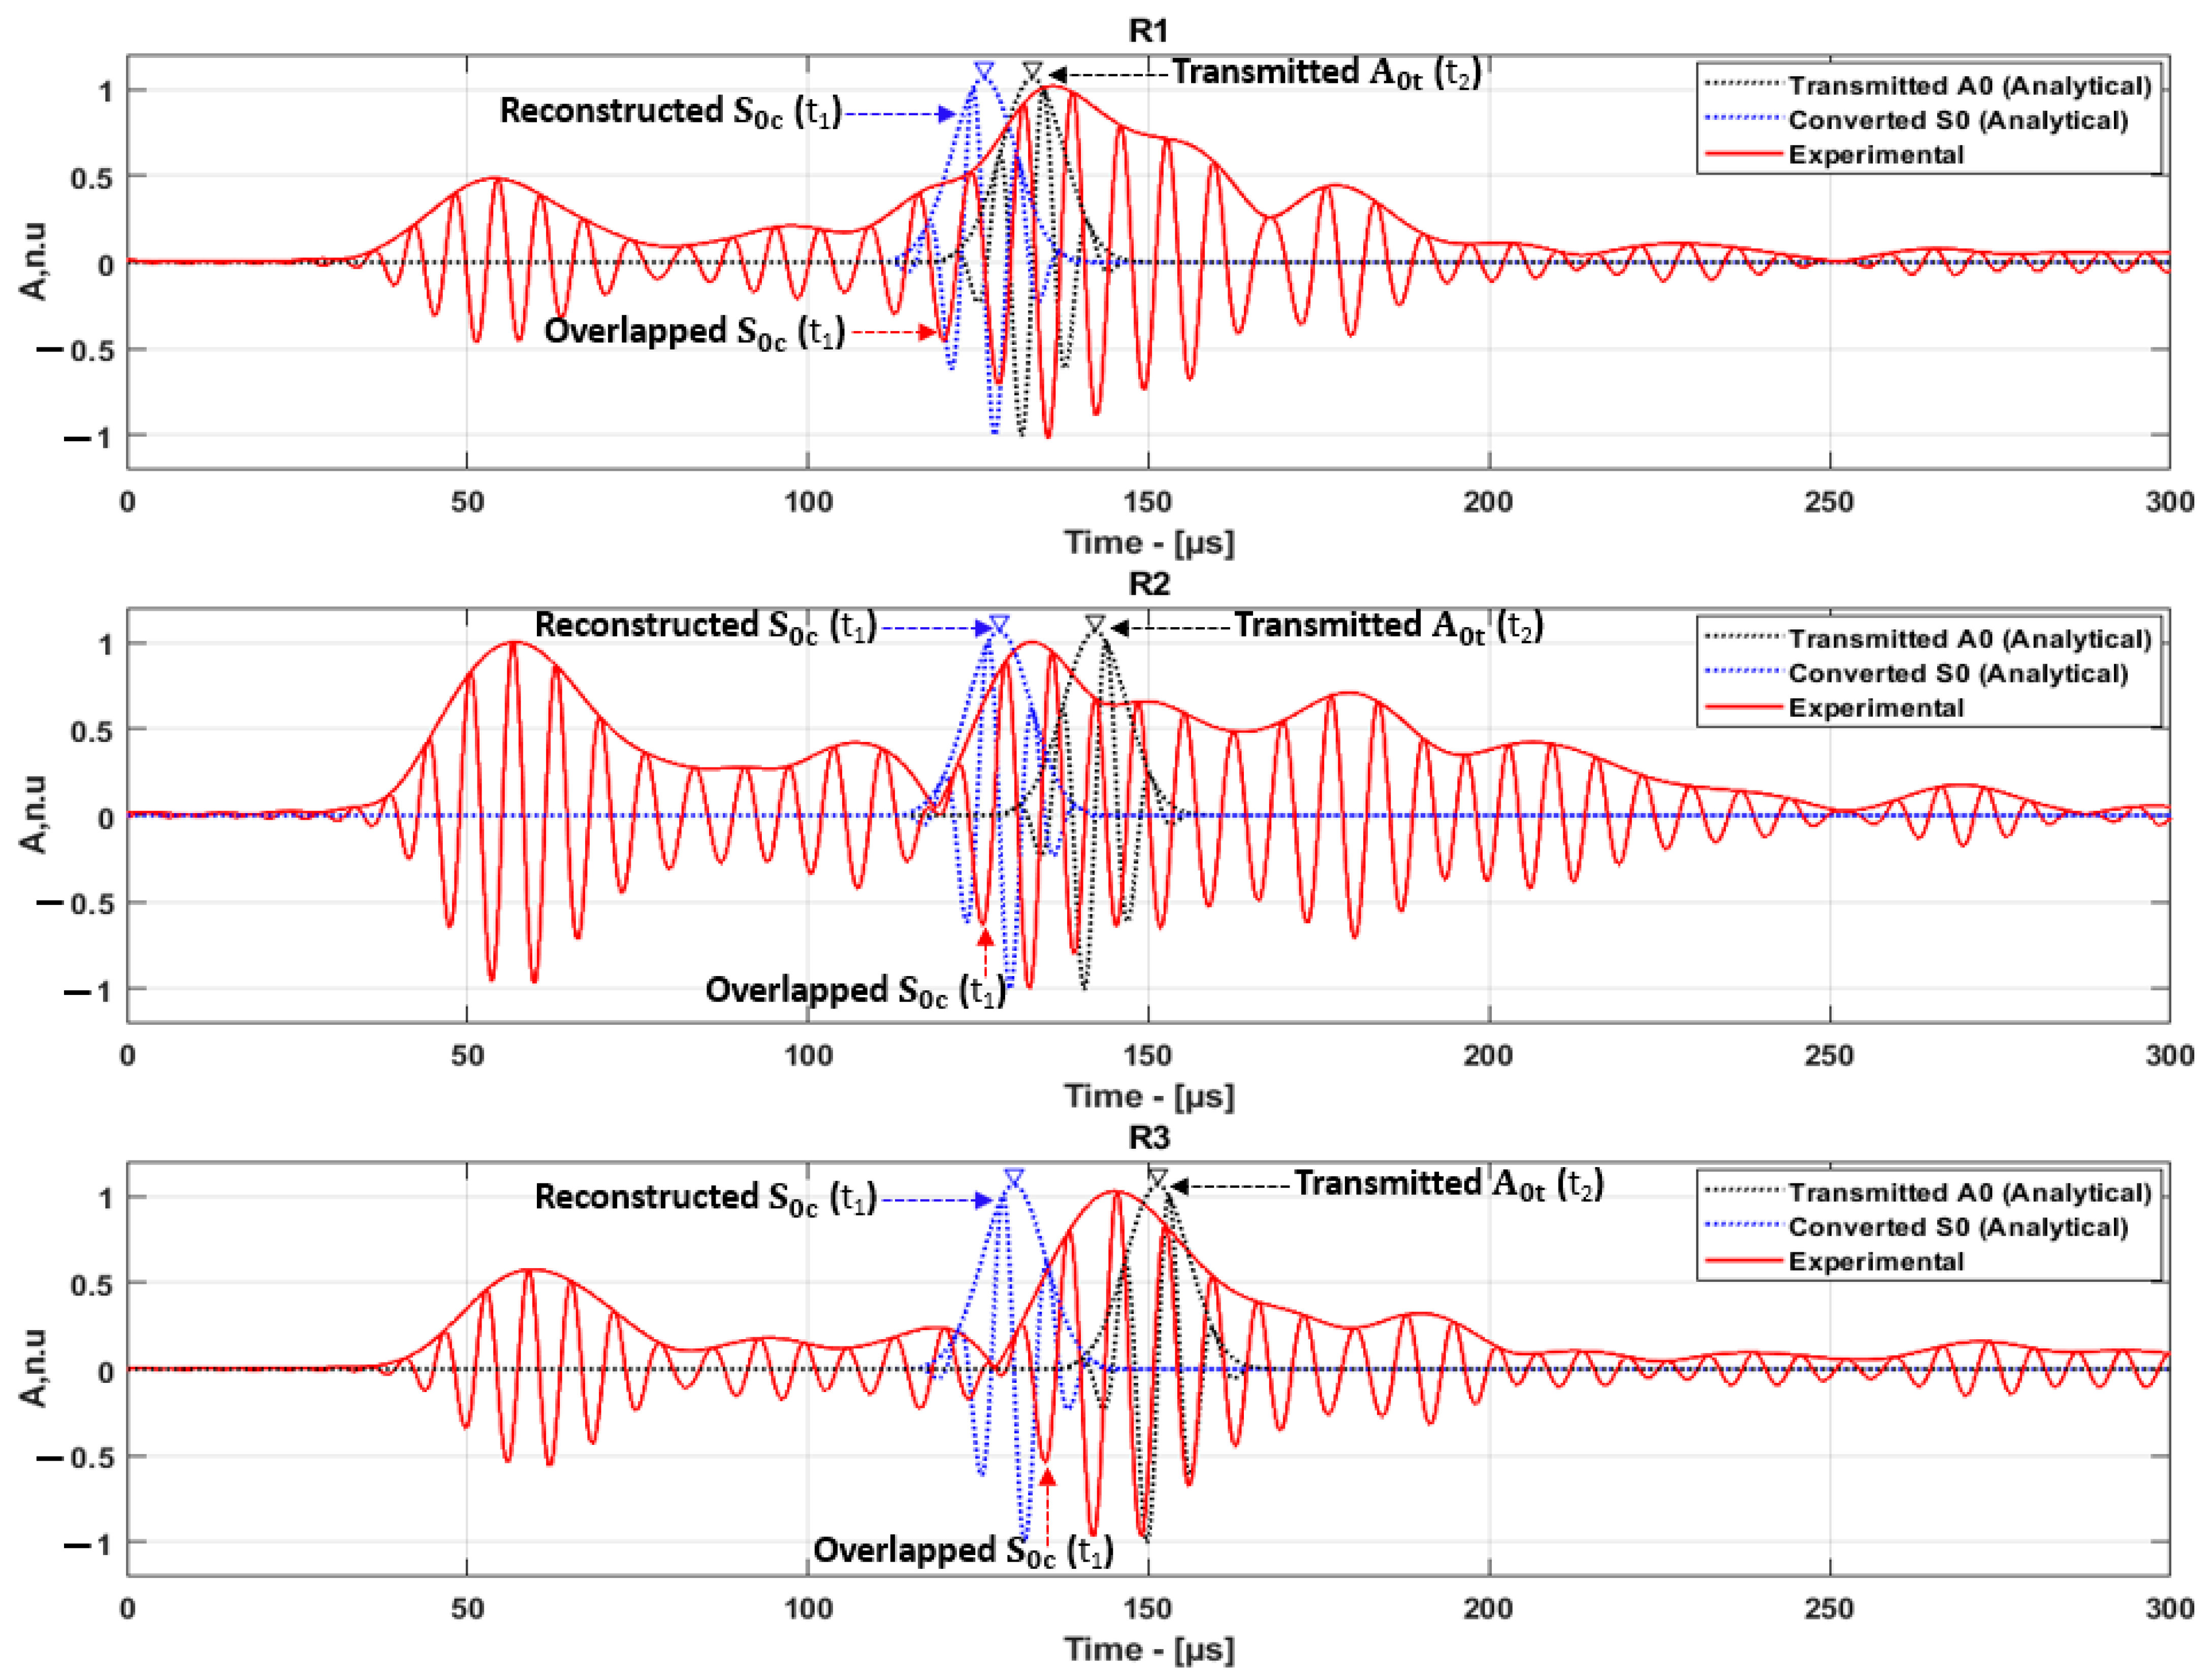
4. Experimental Investigation

The experimental inspection focused on a multilayer CFRP plate with dimensions of 540 mm in length, 450 mm in width, and 3.5 mm in thickness. The unknown characteristics of the CFRP material were intentionally selected to verify the developed phase spectrum approach and analytical model. A 60 × 20 mm rectangular Teflon tape was inserted between 9 and 10 plies of the CFRP plate, i.e., 1.7 mm in the through-thickness of the plate. GW inspection was performed using a contact transmitter and receiver inspection setup, as shown in Figure 14.
The phase velocity dispersion of the A0 mode obtained using the two-dimensional fast Fourier transform and phase spectrum approach is presented in Figure 15.

Experimental Analysis Using Contact Transducers

The contact transducer setup (a pair of transmitter-receivers) developed by Ultrasound Institute; Kaunas University of Technology was used to analyze the CFRP plate with 20 mm delamination in a contact manner. The schematic experimental setup is presented in Figure 13. −6 dB bandwidth and wideband contact piezo ceramic transducers with a conical protection layer of 0.2 mm diameter were used to excite and receive the GW signals.
Glycerol was used to have good contact between the transducers and the test object. The transducer was excited with 200 V, and signals were recorded at each 1 mm along the scanning length of 200 mm. The initial distance between the transmitter and receiver was 80 mm. The scanning was performed in both the defect-free and defective regions on the CFRP plate. The B-scan images of guided wave propagation along the length of the plate with respect to time for both defect-free and defective regions are presented in Figure 16.
In case the delamination is positioned after both the transmitter and the receiver; the GW signals are reflected from the leading edge of the delamination. In this specific case, the A 0 mode, which was reflected from the leading edge of the delamination, was analyzed to determine the delamination position.
While analyzing the reflected A 0 mode obtained from the delamination is initially excited and propagates directly to the receiver, which is referred to as the direct A 0 mode (t1). The guided wave reflected from the leading edge of the delamination is denoted as t2. The time of flight (ToF) between t1 and t2 and the location of the delamination can be determined.
In the GW inspection, reflection coefficients of excited A 0 e mode depends on the location of the delamination in the thickness direction of the specimen. Consequently, the reflection acquired from the leading edge of the delamination has a lower amplitude and, in addition, is superimposed with other modes reflected from the edges of the sample. Delamination estimation using lower amplitude and overlapped modes is complex. Thus, an analytical model was developed to identify the lower amplitude and overlapped modes, and then the ToF of the reflected mode (t2) can be estimated. The guided wave signals transmitted A 0 and reflected A 0 are presented in Figure 17.
The measured distance from the receiver to the delamination is presented in Table 5. The absolute error of the delamination location was calculated by considering the difference between the actual and the measured values.
In the case when the delamination is located between the excitation source and the receiver, GW signals were received at distances of 280 mm, 290 mm, and 300 mm from the leading edge of the CFRP plate. In this case, the excited A 0 mode propagates within the delamination, further divided into converted S 0 and transmitted A 0 modes. The converted S 0 mode is received at the receiver as the first wave packet (t1), while the transmitted A 0 mode is received as the second wave packet (t2), as shown in Figure 18.
The complexity in signal interpretation arises from the varying velocities of the converted S0 modes when combined with the transmitted A0 mode or other modes. Estimation of delamination location using such type of overlapped modes is complex. For this reason, an analytical model was used to match the overlapped modes, and then the ToF of the converted S0 mode (t2) was estimated.
The delamination location (Xd) was estimated by calculating ToF between converted S0 mode and transmitted A0 mode. The estimated distance from delamination to the receiver and the absolute error of the estimated delamination position are presented in Table 6.

5. Conclusions

In this article, an effective GW inspection setup was proposed to locate the delamination in the multilayered CFRP material. This method has the advantage of locating the delamination either in between the excitation and receiver positions or even between the receiver and the boundary of the sample. The guided waves are excited with a single excitation source, and several receiver positions are used to locate the delamination in the longitudinal direction. Thus, the proposed inspection setup has the advantage of locating the delamination with the minimum number of sensors.
The A0 mode was selected for the inspection by analyzing dispersion curves and frequency tuning curves. GW mode selection based on dispersion curves provides only the velocity of a particular mode at different frequencies. Therefore, the selection of GW modes following dispersion curves is not accurate and is limited. The use of frequency tuning curves has the advantage of selecting dominant modes and optimal frequencies for the inspection. Thus, the A0 mode was selected for the inspection because it has a dominant amplitude compared to the S0 mode and is sensitive to a delamination-type defect.
Phase velocity is one of the important features in detecting and locating the delamination. Phase velocity estimation of GW modes in composite materials with unknown properties is difficult. For this reason, a phase spectrum approach was developed to estimate the phase velocity of GW modes. The estimated phase velocity of the A0 mode is further used in the developed analytical model.
The excited GW is reflected, converted, and overlapped with other modes when it encounters delamination. Analysis of GW modes in the presence of low amplitude, converted, and overlapped modes is difficult. For this reason, a novel analytical model was developed to locate the delamination in the presence of low amplitude and overlapped modes.
The analytical model developed was verified with five different scenarios using numerical and experimental investigations. In the case of numerical results, the delamination position was estimated with an average absolute error of 2.8 mm from the actual position of delamination. In the case of experimental results, the delamination position was estimated with an average absolute error of 2.6 mm from the actual position of delamination.

Author Contributions

Conceptualization, M.R.P., E.J. and V.S.; methodology, M.R.P.; software, M.R.P., V.S. and L.M.; validation, E.J., V.S., L.M. and P.G.; formal analysis, M.R.P. and E.J.; investigation, M.R.P.; data curation, M.R.P. and E.J.; writing—original draft preparation, M.R.P.; writing—review and editing, E.J., V.S., L.M. and P.G.; visualization, M.R.P.; supervision, E.J.; project administration, E.J. and P.G.; funding acquisition, E.J. and P.G. All authors have read and agreed to the published version of the manuscript.

Funding

This research has received funding from the Research Council of Lithuania (LMTLT), agreement No S-MIP-23-122, and is based upon work from COST Action 18203—Optimized Design for Inspection (ODIN), supported by COST (European Cooperation in Science and Technology).

Institutional Review Board Statement

Not applicable.

Informed Consent Statement

Not applicable.

Data Availability Statement

Not applicable.

Conflicts of Interest

The authors declare no conflict of interest.

References

  1. Parveez, B.; Kittur, M.I.; Badruddin, I.A.; Kamangar, S.; Hussien, M.; Umarfarooq, M.A. Scientific Advancements in Composite Materials for Aircraft Applications: A Review. Polymers 2022, 14, 5007. [Google Scholar]
  2. Dursun, T.; Soutis, C. Recent developments in advanced aircraft aluminium alloys. Mater. Des. 2014, 56, 862–871. [Google Scholar]
  3. Sajan, S.; Selvaraj, D.P. A review on polymer matrix composite materials and their applications. Mater. Today Proc. 2021, 47, 5493–5498. [Google Scholar]
  4. Trzepieciński, T.; Batu, T.; Kibrete, F.; Lemu, H.G. Application of Composite Materials for Energy Generation Devices. J. Compos. Sci. 2023, 7, 55. [Google Scholar]
  5. El Etri, H.; Korkmaz, M.E.; Gupta, M.K.; Gunay, M.; Xu, J. A state-of-the-art review on mechanical characteristics of different fiber metal laminates for aerospace and structural applications. Int. J. Adv. Manuf. Technol. 2022, 123, 2965–2991. [Google Scholar]
  6. Senthil, K.; Arockiarajan, A.; Palaninathan, R.; Santhosh, B.; Usha, K. Defects in composite structures: Its effects and prediction methods—A comprehensive review. Compos. Struct. 2013, 106, 139–149. [Google Scholar]
  7. Endalew, A.M.; Woo, K.; Kim, I.-G.; Choi, D.; Kim, H.-S. Buckling and delamination growth behavior of composite laminates with circular initial delamination. J. Mech. Sci. Technol. 2021, 35, 2561–2574. [Google Scholar]
  8. Fehri, M.; Vivet, A.; Keller, C.; Dammak, F.; Haddar, M. A characterization of the damage process under buckling load in composite reinforced by flax fibres. J. Compos. Sci. 2020, 4, 85. [Google Scholar]
  9. Suriani, M.J.; Rapi, H.Z.; Ilyas, R.A.; Petrů, M.; Sapuan, S.M. Delamination and Manufacturing Defects in Natural Fiber-Reinforced Hybrid Composite: A Review. Polymers 2021, 13, 1323. [Google Scholar] [CrossRef]
  10. Fu, Y.; Yao, X. A review on manufacturing defects and their detection of fiber reinforced resin matrix composites. Compos. Part C Open Access 2022, 8, 100276. [Google Scholar]
  11. Samaitis, V.; Jasiūnienė, E.; Packo, P.; Smagulova, D. Structural Health Monitoring Damage Detection Systems for Aerospace; Springer International Publishing: Berlin/Heidelberg, Germany, 2021; pp. 1–3. [Google Scholar]
  12. Hervin, F.; Fromme, P. Anisotropy influence on guided wave scattering for composite structure monitoring. Struct. Health Monit. 2022, 22, 2626–2640. [Google Scholar] [CrossRef]
  13. Yang, K.; Kim, S.; Harley, J.B. Guidelines for effective unsupervised guided wave compression and denoising in long-term guided wave structural health monitoring. Struct. Health Monit. 2022, 22, 2516–2530. [Google Scholar] [CrossRef]
  14. Yang, Z.; Yang, H.; Tian, T.; Deng, D.; Hu, M.; Ma, J.; Gao, D.; Zhang, J.; Ma, S.; Yang, L.; et al. A review on guided-ultrasonic-wave-based structural health monitoring: From fundamental theory to machine learning techniques. Ultrasonics 2023, 133, 107014. [Google Scholar] [CrossRef]
  15. Draudvilienė, L.; Meškuotienė, A.; Raišutis, R.; Griškevičius, P.; Stasiškienė, Ž.; Žukauskas, E. The Usefulness and Limitations of Ultrasonic Lamb Waves in Preventing the Failure of the Wind Turbine Blades. Appl. Sci. 2022, 12, 1773. [Google Scholar] [CrossRef]
  16. Giannakeas, I.N.; Khodaei, Z.S.; Aliabadi, M.H. An up-scaling temperature compensation framework for guided wave–based structural health monitoring in large composite structures. Struct. Health Monit. 2022, 22, 777–798. [Google Scholar] [CrossRef]
  17. Chai, Y.; Wang, Y.; Liu, Q.; Qing, X. Structural health dynamic monitoring for gear transmission based on guided waves. Smart Mater. Struct. 2023, 32, 035025. [Google Scholar] [CrossRef]
  18. Yu, L.; Tian, Z. Lamb wave Structural Health Monitoring Using a Hybrid PZT-Laser Vibrometer Approach. Struct. Health Monit. 2013, 12, 469–483. [Google Scholar] [CrossRef]
  19. Ju, M.; Dou, Z.; Li, J.-W.; Qiu, X.; Shen, B.; Zhang, D.; Yao, F.-Z.; Gong, W.; Wang, K. Piezoelectric Materials and Sensors for Structural Health Monitoring: Fundamental Aspects, Current Status, and Future Perspectives. Sensors 2023, 23, 543. [Google Scholar] [CrossRef]
  20. Tang, L.; Li, Y.; Bao, Q.; Hu, W.; Wang, Q.; Su, Z.; Yue, D. Quantitative identification of damage in composite structures using sparse sensor arrays and multi-domain-feature fusion of guided waves. Measurement 2023, 208, 112482. [Google Scholar] [CrossRef]
  21. Liu, Y.; Hong, X.; Zhang, B. Contact delamination detection of anisotropic composite plates using non-elliptical probability imaging of nonlinear ultrasonic guided waves. Struct. Health Monit. 2022, 22, 276–295. [Google Scholar] [CrossRef]
  22. Muñoz, C.Q.G.; Marquez, F.P.G.; Crespo, B.H.; Makaya, K. Structural health monitoring for delamination detection and location in wind turbine blades employing guided waves. Wind Energy 2019, 22, 698–711. [Google Scholar] [CrossRef]
  23. Bouzid, O.M.; Tian, G.Y.; Cumanan, K.; Moore, D. Structural Health Monitoring of Wind Turbine Blades: Acoustic Source Localization Using Wireless Sensor Networks. J. Sens. 2015, 2015, 139695. [Google Scholar] [CrossRef]
  24. Ha, S.; Lonkar, K.; Mittal, A.; Chang, F.-K. Adhesive Layer Effects on PZT-induced Lamb Waves at Elevated Temperatures. Struct. Health Monit. 2010, 9, 247–256. [Google Scholar] [CrossRef]
  25. Thielicke, B.; Gesang, T.; Wierach, P. Reliability of piezoceramic patch sensors under cyclic mechanical loading. Smart Mater. Struct. 2003, 12, 993–996. [Google Scholar] [CrossRef]
  26. Salmanpour, M.S.; Khodaei, Z.S.; Aliabadi, M.H. Airborne Transducer Integrity under Operational Environment for Structural Health Monitoring. Sensors 2016, 16, 2110. [Google Scholar] [CrossRef]
  27. Gorgin, R.; Luo, Y.; Wu, Z. Environmental and operational conditions effects on Lamb wave based structural health monitoring systems: A review. Ultrasonics 2020, 105, 106114. [Google Scholar] [CrossRef]
  28. Yang, K.; Kim, S.; Yue, R.; Yue, H.; Harley, J.B. Long-term guided wave structural health monitoring in an uncontrolled environment through long short-term principal component analysis. Struct. Health Monit. 2021, 21, 1501–1517. [Google Scholar] [CrossRef]
  29. Sofi, T.; Gude, M.R.; Wierach, P.; Martin, I.; Lorenzo, E. An Efficient Procedure for Bonding Piezoelectric Transducers to Thermoplastic Composite Structures for SHM Application and Its Durability in Aeronautical Environmental Conditions. Sensors 2023, 23, 4784. [Google Scholar] [CrossRef]
  30. Ma, C.-C.M.; Yur, S.-W. Environmental Effect on the Water Absorption and Mechanical Properties of Carbon Fiber Reinforced PPS and PEEK Composites. J. Thermoplast. Compos. Mater. 1989, 2, 281–292. [Google Scholar] [CrossRef]
  31. Gall, M.; Thielicke, B.; Schmidt, I. Integrity of piezoceramic patch transducers under cyclic loading at different temperatures. Smart Mater. Struct. 2009, 18, 104009. [Google Scholar] [CrossRef]
  32. Baid, H.; Schaal, C.; Samajder, H.; Mal, A. Dispersion of Lamb waves in a honeycomb composite sandwich panel. Ultrasonics 2015, 56, 409–416. [Google Scholar] [CrossRef]
  33. Putkis, O.; Dalton, R.; Croxford, A. The anisotropic propagation of ultrasonic guided waves in composite materials and implications for practical applications. Ultrasonics 2016, 65, 390–399. [Google Scholar] [CrossRef]
  34. Mustapha, S.; Ye, L. Leaky and non-leaky behaviours of guided waves in CF/EP sandwich structures. Wave Motion 2014, 51, 905–918. [Google Scholar] [CrossRef]
  35. Yu, Y.; Liu, X.; Wang, Y.; Wang, Y.; Qing, X. Lamb wave-based damage imaging of CFRP composite structures using autoencoder and delay-and-sum. Compos. Struct. 2023, 303, 116263. [Google Scholar] [CrossRef]
  36. Zhang, H.; Lin, J.; Hua, J.; Zhang, T.; Tong, T. Attention-based interpretable prototypical network towards small-sample damage identification using ultrasonic guided waves. Mech. Syst. Signal Process. 2023, 188, 109990. [Google Scholar] [CrossRef]
  37. Panda, R.S.; Rajagopal, P.; Balasubramaniam, K. Rapid guided wave inspection of complex stiffened composite structural components using non-contact air-coupled ultrasound. Compos. Struct. 2018, 206, 247–260. [Google Scholar] [CrossRef]
  38. Wang, X.; He, J.; Guo, W.; Guan, X. Three-dimensional damage quantification of low velocity impact damage in thin composite plates using phased-array ultrasound. Ultrasonics 2020, 110, 106264. [Google Scholar] [CrossRef]
  39. Kumar, S.N.; Srikanth, K.; Subbaratnam, B.; Jena, S.P. Damage Detection in Composite Materials Using Lamb Wavemethod. IOP Conf. Ser. Mater. Sci. Eng. 2020, 998, 012066. [Google Scholar] [CrossRef]
  40. Eremin, A.A.; Golub, M.V.; Fomenko, S.I.; Evdokimov, A.A.; Nets, P.A. Multi-Layered and Homogenized Models for In-Plane Guided Wave Excitation, Sensing, and Scattering in Anisotropic Laminated Composites. Appl. Sci. 2023, 13, 1698. [Google Scholar] [CrossRef]
  41. Yu, X. Identification of Damage in Composite Structures Based on Feature Guided Ultrasonic Waves. Ph.D. Thesis, Nanyang Technological University, Singapore, 2018. [Google Scholar]
  42. Feng, T.; Khodaei, Z.S.; Aliabadi, M.H.F. Influence of Composite Thickness on Ultrasonic Guided Wave Propagation for Damage Detection. Sensors 2022, 22, 7799. [Google Scholar] [CrossRef]
  43. Lugovtsova, Y.; Bulling, J.; Boller, C.; Prager, J. Analysis of Guided Wave Propagation in a Multi-Layered Structure in View of Structural Health Monitoring. Appl. Sci. 2019, 9, 4600. [Google Scholar] [CrossRef]
  44. Sikdar, S.; Banerjee, S. Guided wave based nondestructive analysis of localized inhomogeneity effects in an advanced sandwich composite structure. Compos. Part B Eng. 2019, 176, 107195. [Google Scholar] [CrossRef]
  45. Papanaboina, M.R.; Jasiuniene, E.; Žukauskas, E.; Mažeika, L. Numerical Analysis of Guided Waves to Improve Damage Detection and Localization in Multilayered CFRP Panel. Materials 2022, 15, 3466. [Google Scholar] [CrossRef]
  46. Samaitis, V.; Mažeika, L. Guided Wave Phase Velocity Dispersion Reconstruction Based on Enhanced Phased Spectrum Method. Materials 2022, 15, 1614. [Google Scholar] [CrossRef]
  47. Raišutis, R.; Tiwari, K.A.; Žukauskas, E.; Tumšys, O.; Draudvilienė, L. A Novel Defect Estimation Approach in Wind Turbine Blades Based on Phase Velocity Variation of Ultrasonic Guided Waves. Sensors 2021, 21, 4879. [Google Scholar] [CrossRef]
  48. Tao, C.; Ji, H.; Qiu, J.; Zhang, C.; Wang, Z.; Yao, W. Characterization of fatigue damages in composite laminates using Lamb wave velocity and prediction of residual life. Compos. Struct. 2017, 166, 219–228. [Google Scholar] [CrossRef]
  49. Rosalie, S.C.; Chiu, W.K.; Chan, A.; Rose, F.; Rajic, N. Ultrasonic tomographic reconstruction for damage detection in aluminium and glare plate-like structures. Aust. J. Mech. Eng. 2006, 3, 39–44. [Google Scholar] [CrossRef]
  50. Angrisani, L.; Moriello, R.S.L. Estimating ultrasonic time-of-flight through quadrature demodulation. IEEE Trans. Instrum. Meas. 2006, 55, 54–62. [Google Scholar] [CrossRef]
  51. Fang, Z.; Su, R.; Hu, L.; Fu, X. A simple and easy-implemented time-of-flight determination method for liquid ultrasonic flow meters based on ultrasonic signal onset detection and multiple-zero-crossing technique. Measurement 2020, 168, 108398. [Google Scholar] [CrossRef]
  52. Fang, Z.; Hu, L.; Mao, K.; Chen, W.; Fu, X. Similarity Judgment-Based Double-Threshold Method for Time-of-Flight Determination in an Ultrasonic Gas Flowmeter. IEEE Trans. Instrum. Meas. 2017, 67, 24–32. [Google Scholar] [CrossRef]
  53. Shin, D.; Kim, H.; Lee, J. Numerical analysis of the damage behavior of an aluminum/CFRP hybrid beam under three point bending. Compos. Part B Eng. 2013, 56, 397–407. [Google Scholar] [CrossRef]
  54. Kim, Y.A.; Woo, K.; Cho, H.; Kim, I.-G.; Kim, J.-H. High-Velocity Impact Damage Behavior of Carbon/Epoxy Composite Laminates. Int. J. Aeronaut. Space Sci. 2015, 16, 190–205. [Google Scholar] [CrossRef]
  55. Woo, K.; Kim, I.-G.; Kim, J.H.; Cairns, D.S. Numerical Simulation of High Velocity Impact of Circular Composite Laminates. Int. J. Aeronaut. Space Sci. 2017, 18, 236–244. [Google Scholar] [CrossRef]
  56. Han, L.; Dai, L. Three-dimensional shear and compressional wave propagation of multiple point sources in fluid-saturated elastic porous media. Proc. Inst. Mech. Eng. Part K J. Multi-Body Dyn. 2013, 228, 3–18. [Google Scholar] [CrossRef]
  57. Papanaboina, M.R.; Jasiuniene, E. The defect identification and localization using ultrasonic guided waves in aluminum alloy. In Proceedings of the 2021 IEEE 8th International Workshop on Metrology for AeroSpace (MetroAeroSpace), Naples, Italy, 23–25 June 2021; pp. 490–493. [Google Scholar]
  58. Asokkumar, A.; Venkat, R.S.; Boller, C. Identification of Key Performance Indicators for SHM in Structures of Increasing Complexity Based on Artificial Neural Networks. In Proceedings of the 11th International Symposium on NDT in Aerospace, Paris, France, 13–15 November 2019. e-Journal of Nondestructive. [Google Scholar]
  59. Ma, Z.; Yu, L. Lamb wave imaging with actuator network for damage quantificationin aluminum plate structures. J. Intell. Mater. Syst. Struct. 2021, 32, 182–195. [Google Scholar] [CrossRef]
Figure 1. Guided wave inspection setup of CFRP panel: defect-free (a), receiver position before the delamination (b), and receiver position after the delamination (c).
Applsci 13 09687 g001
Figure 2. Schematic diagram of the 2D model used in the SAFE method.
Applsci 13 09687 g002
Figure 3. Guided wave dispersion curves in the CFRP panel: phase velocity versus frequency (a) and group velocity versus frequency (b).
Applsci 13 09687 g003
Figure 4. The schematic diagram of the inspection setup used to obtain frequency tuning curves.
Applsci 13 09687 g004
Figure 5. Displacements of S0 and A0 modes in 3.5 mm of the CFRP plate.
Applsci 13 09687 g005
Figure 6. The flow chart of the proposed analytical model.
Applsci 13 09687 g006
Figure 7. Generated excitation signal for the analytical model.
Applsci 13 09687 g007
Figure 8. The fundamental A 0 mode phase velocity dispersion.
Applsci 13 09687 g008
Figure 9. Reference signal and envelope of the defect-free and delamination samples to estimate the location of the delamination.
Applsci 13 09687 g009
Figure 10. Guided wave propagation scenario while interacting with delamination.
Applsci 13 09687 g010
Figure 11. B-scan images of guided wave propagation: defect-free (a) and delamination (b).
Applsci 13 09687 g011
Figure 12. GW signal received in case the delamination is located further than the receiver.
Applsci 13 09687 g012
Figure 13. Guided wave signal when the delamination is between excitation source and receiver.
Applsci 13 09687 g013
Figure 14. Schematic diagram and photo of the experimental setup with contact transducers.
Applsci 13 09687 g014
Figure 15. Phase velocity dispersion of A0 mode obtained from 2D FFT and phase spectrum approach.
Applsci 13 09687 g015
Figure 16. B-scan images of the defect-free and delaminated zones obtained using contact inspection.
Applsci 13 09687 g016
Figure 17. GW signal received in case delamination was after receiver point.
Applsci 13 09687 g017
Figure 18. GW signal received in the case when delamination is between the excitation source and the receiver.
Applsci 13 09687 g018
Table 1. The material properties of the CFRP [53,54,55].
Property UnitsValue
Density ρckg/m31544
Thickness tplymm0.194
Young’s modulusE1GPa131
E2 = E3GPa8
Shear modulusG12 = G13GPa4.5
G23GPa3.5
Poisson’s ratioν12 = ν13-0.29
ν23-0.47
Table 2. Delamination position in the longitudinal direction.
CaseDelamination Position
(Xd) (mm)
Distance between Edge of the Sample and Receiver (Xr) (mm)Distance between Delamination and Receiver (Xdr) (mm)
1-125023020
1-225024010
2-125028010
2-225029020
2-325030030
Table 3. Delamination position estimation using analytical model.
CaseReceiverDistance from Delamination to Receiver (mm)Propagation Time t2t1 (µs)ToF (dt) (µs)Estimated Distance (mm)Absolute Error
1-1R12087.2 − 62.824.419.80.2
1-2R21081.1 − 69.211.99.60.4
Table 4. Localization of delamination when the delamination is between transmitter and receiver.
CaseReceiverDistance from Delamination to Receiver (mm)Propagation Time t2t1 (µs)ToF (dt) (µs)Estimated Distance (mm)Absolute Error
2-1R11092.4 − 88.446.43.6
2-2R22099.5 − 89.410.116.33.7
2-3R330105.6 − 91.114.523.56.5
Table 5. Localization of delamination when the delamination after excitation and receiver.
CaseReceiverDistance from Delamination to Receiver (mm)Propagation Time t2t1 (µs)ToF (dt) (µs)Estimated Distance (mm)Absolute Error
1-2R120123.7 − 87.436.319.70.3
1-3R210114.5 − 95.618.910.20.2
Table 6. Localization of delamination when the delamination is between excitation and receiver.
CaseReceiverDistance from Delamination to Receiver (mm)Propagation Time t2t1 (µs)ToF (dt) (µs)Estimated Distance (mm)Absolute Error
2-1R110136 − 125.8 10.2110.8
2-2R220142.1 − 128 14.115.34.7
2-3R330151.3 − 130.2 21.122.97.1
Disclaimer/Publisher’s Note: The statements, opinions and data contained in all publications are solely those of the individual author(s) and contributor(s) and not of MDPI and/or the editor(s). MDPI and/or the editor(s) disclaim responsibility for any injury to people or property resulting from any ideas, methods, instructions or products referred to in the content.

