Abstract
This study investigates the sealing performance of a combined sealing structure under extremely high and low temperature conditions, considering potential issues like high-temperature aging and low-temperature brittle fracture, which can lead to sealing failure. EPDM rubber underwent uniaxial compression tests at high, low, and normal temperatures, then the sealing performance under extreme working conditions was compared with that under normal temperature conditions. Additionally, the influences of gasket parameters and gas pressure on the sealing performance were analyzed. The result shows that compared with the normal temperature conditions, the maximum von Mises stress is reduced by 65% and the effective sealing length and the maximum contact pressure is reduced by 40% under the high temperature conditions, while the maximum von Mises stress is increased by 7 times and the maximum contact pressure is increased by a remarkable 7 times under the low temperature conditions. In the range of 10–100 MPa, the increase in gas pressure aggravates the O-ring stress concentration and improves the sealing performance relatively. When the thickness of gasket is 0.85–1.05 mm, the stress concentration of the O-ring is lighter and the sealing performance is better.
1. Introduction
The O–ring is a commonly used structure suitable for both dynamic and static sealing applications. Its simple design and excellent sealing performance have led to it being widely utilized in various industrial sealing structures [1]. The structure and performance of the sealing ring play a critical role in the operation, efficiency, and lifespan of mechanical equipment [2]. For O–rings to function effectively, they must possess sufficient toughness and high-pressure resistance. In extreme conditions, such as high and low temperatures, rubber O–rings need to exhibit high thermal stability and low-temperature resistance. As sealing requirements evolve towards high pressure and wide temperature ranges, there is a growing demand for improved sealing characteristics in sealing structures. Under extreme working conditions, the sealing structure may encounter challenges during reciprocating motion, leading to potential failures in meeting the sealing demands of high-pressure systems [3]. The degradation of the sealing performance in the sealing structure may lead to sealing failure, not only reducing the operational lifespan of the equipment but also potentially resulting in severe safety incidents and causing significant economic losses [4]. To address these issues, scholars continue to study the existing sealing structure, aiming to optimize its mechanical and sealing performance to meet the diverse demands of various scenarios [5].
Several scholars have extensively researched the sealing performance, friction, and fracture behavior of O–rings in static sealing structures. György, S. et al. [6] identified two critical locations where O–rings may experience failure in static sealing structures. Wu, D. et al. [7] introduced a novel stress analysis model for O–rings, effectively revealing the stress distribution in static sealing structures with different material properties. Liang, B. et al. [8] proposed a reliability-based method to analyze the influence of the randomness of rubber material parameters on the performance of O–rings in static sealing structures. Cheng, H. et al. [9] studied the effects of various factors such as working pressure, precompression ratio, chamfer, and thickness of wear-resistant rings on the sealing performance of static sealing structures. Nicolin, I. et al. [10] developed a physical–mathematical model to better understand the contact between the O–ring and the sealing surface, shedding light on the sealing and wear behavior of static sealing structures. Karaszkiewicz, A. et al. [11] derived an engineering equation for solving sealing performance, friction, and design issues of O–rings in static sealing structures. Szczypinski–Sala, W. et al. [12] compared the sealing performance of rubber material O–rings with graphite powder filler O–rings in static sealing structures. The result shows that the addition of graphite powder effectively reduced the friction in static sealing structures. Furthermore, Yamabe, J. et al. [13] used a self-developed durability device to investigate the fracture behavior of O–rings in static sealing structures exposed to cyclic high-pressure hydrogen.
Several scholars have conducted valuable research on the sealing performance and friction of non-O–ring seals within static sealing structures. For instance, Zhou, C. et al. [14] investigated the sealing performance of a static sealing structure consisting of a rubber D–ring and a wedge ring. They made a comprehensive comparison between the sealing performance of the D–ring and the O–ring, analyzing crucial factors such as the wedge ring, hydrogen pressure, and expansion. Similarly, Junjie, H. et al. [15] utilized finite element simulation to analyze the static sealing structure of a hydraulic system at work. Through their analysis, they obtained valuable insights into the changes in sealing performance of the lip seal under different working temperatures. Furthermore, Chen, G. et al. [16] focused on studying the sealing failure mechanism of static sealing structures in high-pressure and high-flow water valves. Their research involved a thorough analysis of the influence of pressure, surface friction coefficient, and other factors on the sealing performance of U–rings. Zhang, L. et al. [17] proposed a butterfly rubber ring seal as a solution to address the issue of seal failure on the groove side of the rubber ring in static sealing structures, offering an innovative approach to improve sealing reliability. Kim, B. et al. [5] explored the effects of sealing pressure, motion speed, and ambient temperature on the sealing performance and friction of U–rings in static seal structures. Liu, X. et al. [18] conducted simulations of the complete process of the lip seal ring, and effectively analyzed the sealing performance of the static seal structure in the whole working process.
Scholars have conducted significant research on the sealing performance, friction, and surface wear of O–rings in dynamic sealing structures. For example, Zhang, J. et al. [19] investigated the effects of pre-compression, fluid pressure, and coefficient of friction on the sealing performance of O–rings in dynamic seal structures. In another study, Zhang, M. et al. [20] conducted reciprocating sealing experiments on a dynamic seal structure using a reciprocating sealing test rig. They measured the surface morphology and surface wear of O–rings before and after the tests using an electron microscope.
In conclusion, scholars have extensively investigated various aspects of dynamic and static sealing, including friction, wear, and other characteristics of combined sealing structures applied in different scenarios. However, the performance of sealing rings may be compromised under extreme conditions of high and low temperatures, leading to potential issues such as high-temperature aging and low-temperature brittle fracture. Therefore, it is essential to conduct research on the dynamic sealing performance of combined sealing structures under extreme working conditions. In this study, a finite element model of the axial propulsion combined seal structure is established to address the practical application scenario of axial propulsion compression seal rings. Uniaxial compression tests are conducted to obtain the compressive stress–strain curves of EPDM at high, low, and normal temperatures. The material parameters of the EPDM constitutive model are accurately determined through fitting. Using the static structure analysis module of Ansys 2021 R1 software, the sealing performance of the combined sealing structure is analyzed in three operating states, and the differences in sealing performance under extreme working conditions are compared. Additionally, the influence of gasket fillet, gasket thickness, gasket surface friction coefficient, and working pressure on the sealing performance of the combined sealing structure are analyzed. These analyses provide valuable insights and serve as a basis for the structural design of dynamic seals for combined sealing structures.
2. Combined Seal Structure and Material Parameters
2.1. Structure Parameters
As shown in Figure 1, the combined sealing structure in this study comprises four components: a rubber O–ring, a gasket, a piston, and a steel shell. To protect the O–ring from potential damage during installation and ensure optimal sealing performance, an introductory angle θ is incorporated at the bottom end of the steel shell. The pertinent structural parameters are shown in Table 1.
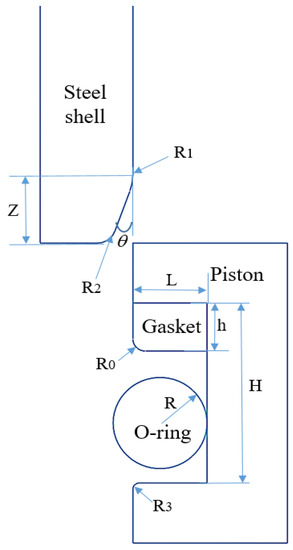
Figure 1.
Combined sealing structure section view.

Table 1.
Structural parameters of combined sealing structure.
2.2. Combined Seal Structure Operating State
As shown in Figure 2, the combined sealing structure in this study comprises three distinct operating states: installation, inflation, and deflation. Figure 2a shows the installation process of the combined sealing structure. During this process, the gasket is placed into the groove of the piston, then the O–ring is deformed and installed in the groove. Finally, the steel shell moves 6 mm downwards to the station at the speed of V0 = 6 mm/s, and the rubber O–ring is compressed.
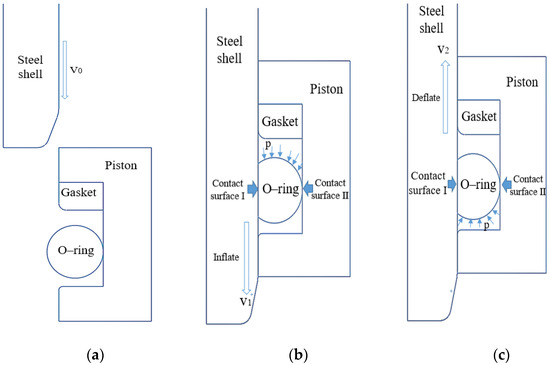
Figure 2.
Three operating states of the combined sealing structure: (a) installation; (b) inflation; (c) deflation.
The inflation state of the combined sealing structure is shown Figure 2b. The steel shell initiates inflation after moving 2 mm downwards to the lower station at the speed of V1 = 2 mm/s. The exposed boundary of the upper half of the O–ring is subjected to gas pressure and moves downward. On the other hand, the deflation state of the combined sealing structure is shown in Figure 2c. In this state, the steel shell initiates deflation after moving 2 mm upwards to the upper station at the speed of V2 = 2 mm/s. The exposed boundary of the lower half of the O–ring is subjected to gas pressure and moves upward to contact with the gasket. The function of the gasket is to optimize the stress characteristics of the O–ring.
Under the function of gas pressure, the O–ring is in close contact with the piston groove and the surface of the steel shell. There are two primary sealing surfaces based on the operating state of the combined sealing structure. The contact surface between the left side of the O–ring and the steel shell is denoted as contact surface I, while the contact surface between the right side of the O–ring and the piston is denoted as contact surface II.
2.3. Material Parameters
Rubber is a typical nonlinear material and exhibits complex properties that require suitable constitutive models for accurate description. Numerous scholars have conducted experimental research to establish constitutive models to capture the nonlinear behavior of rubber materials. Some commonly used rubber material constitutive models [21,22,23] include the Neo–Hookean model, Lord–Shulman model, Mooney–Rivlin model, Yeoh model, and Ogden model. Among these models, the Mooney–Rivlin (M–R) model stands out for its ability to accurately describe the real properties of rubber materials, which has been extensively validated through numerous experiments [24]. The M–R constitutive model demonstrates high accuracy under small and medium strain, making it particularly suitable for stress levels below 30% (compression). Considering that this study focuses on an O–ring with a maximum compressive strain of 25%, the three-parameter M–R model fits well with the compressive stress–strain curve. Therefore, the three-parameter M–R model is adopted, with its strain energy density function represented as follows [25]:
where W is the strain energy density, I1 and I2 are the first and second strain tensor invariants, and C10, C20, and C11 are M–R coefficients.
W = C10 (I1 − 3) + C 01 (I2 − 3) + C 11 (I1 − 3)2
In this study, EPDM rubber was chosen as the material for the O–ring. Uniaxial compression tests were conducted on the EPDM material using an electronic universal testing machine, as shown in Figure 3. The tests were carried out at three different temperatures: 15 °C, –60 °C, and 130 °C. During the experiments, the EPDM sample was placed in the electronic universal testing machine, and it was compressed to 25% of the maximum strain at a speed of 10 mm/min. Subsequently, the specimen was rebounded at the same speed. This compression and rebound process was repeated four times for each sample at the specified temperatures. The stress–strain experimental data at the low temperature, normal temperature, and high temperature were obtained through repeated compression and rebound tests, as shown in Figure 4. The fitting curves of the M-R constitutive models at the three temperatures are shown in Figure 5, and the material parameters of the EPDM materials at the three temperatures are shown in Table 2. In addition to the O–ring, the material parameters of the combined sealing structure are shown in Table 3 [26,27].
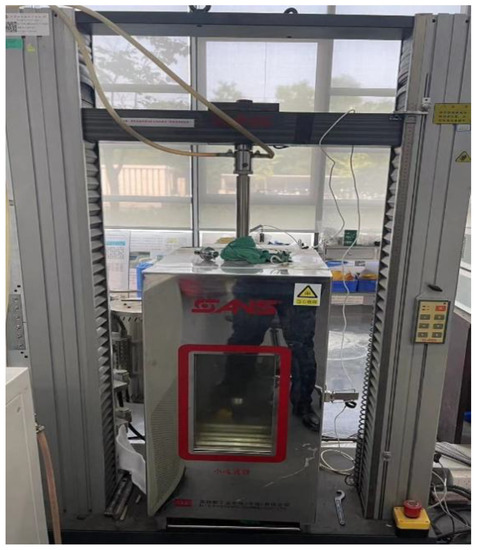
Figure 3.
Electronic universal testing machine.
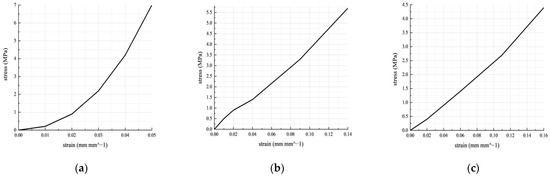
Figure 4.
The stress–strain experimental data: (a) −60 °C; (b) 15 °C; (c)130 °C.
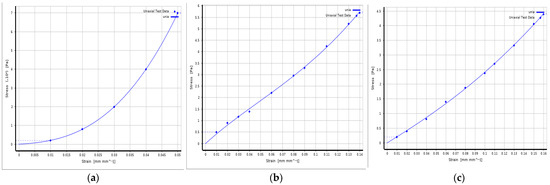
Figure 5.
The fitting curves of M–R model: (a) −60 °C; (b) 15 °C; (c)130 °C.
Table 2.
M–R model parameters at three temperatures for EPDM.
Table 3.
Material parameters of combined sealing structure except O–ring.
3. Finite Element Analysis
3.1. Finite Element Model
The finite element model of the combined sealing structure is shown in Figure 6. The rubber O–ring is discretized using four-node quadrilateral elements to account for the incompressibility of rubber materials. In order to ensure higher accuracy while reducing computation time, local mesh refinement is applied to the critical regions that may come into contact. During mesh independence verification analysis, it is found that when the mesh number is between 5555 and 20,000, the stress and contact pressure calculation data error is less than 5%. Consequently, the finite element model with 5555 meshes is chosen, striking a balance between calculation efficiency and accuracy. This carefully chosen mesh size ensures reliable results without compromising the computational efficiency, making it suitable for investigating the dynamic sealing performance of the combined sealing structure.
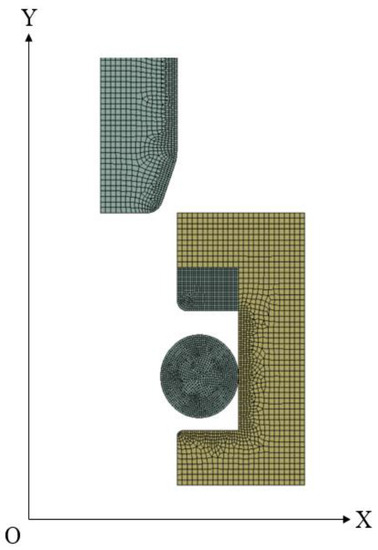
Figure 6.
Finite element model of the combined seal.
3.2. Loads and Boundary Conditions
Four contact pairs are established for the finite element analysis: the O–ring and the gasket, the O–ring and the steel shell, the O–ring and the piston, and the gasket and the piston. In the contact analysis setting, the contact type is chosen as Frictional or Bonded, with Asymmetric selected for contact behavior. The augmented Lagrange method is employed for advanced rubber material detection at Gauss points. In terms of the contact surfaces, the hard material surface is designated as the target surface, while the soft one (rubber) is treated as the contact surface. The Coulomb friction model is adopted, with specific friction coefficients set at f = 0.1 between the O–ring and the steel parts, f = 0.04 between the gasket and the steel parts, and f = 0.02 between the O–ring and the gasket [14]. It is assumed that the friction coefficient of 316 stainless steel and polyethylene does not change with temperature at the limit temperature.
During the simulation of the combined sealing structure’s operating state, the piston remains fixed and the steel shell moves relative to the piston. Load steps are set in finite element analysis:
- The piston is fully constrained in displacement throughout all stages;
- Installation stage of 15 °C: The steel shell is displaced in the negative Y-axis direction to reach the initial installation position, completing the installation pre-compression of the O–ring;
- Inflation stage of 15 °C: The steel shell is displaced in the negative Y-axis direction to reach the lower position, then 70 MPa gas pressure is applied to the upper half of the exposed O–ring;
- Inflation stage of 130 °C: The steel shell is displaced in the negative Y-axis direction to reach the lower position, then 87.5 MPa gas pressure is applied to the upper half of the exposed O–ring;
- Deflation stage of 15 °C: The steel shell is displaced in the positive Y-axis direction to reach the upper position, then 70 MPa gas pressure is applied to the lower half of the exposed O–ring;
- Deflation stage of −60 °C: The steel shell is displaced in the positive Y-axis direction to reach the upper position, then 56 MPa gas pressure is applied to the lower half of the exposed O–ring.
4. Results and Discussion
The sealing performance of the O–ring depends on the contact pressure that develops between the O–ring and the surfaces with which it comes into contact, and the initial leakage appears once the maximum contact pressure is lower than the pressure difference across the seal [28,29]. In this paper, the difference between the inflation and deflation state of the O–ring is that the O–ring is stressed on the upper side or the lower side, so the criterion of sealing performance in the inflation state and the deflation state remains unchanged. At 15 °C and 70 MPa, both in the inflated and deflated states, the maximum contact pressures on contact surfaces I and II exceed 70 MPa. At 130 °C and 87.5 MPa in the inflated state, the maximum contact pressures on contact surfaces I and II exceed 87.5 MPa. Additionally, at −60 °C and 56 MPa in the deflated state, the maximum contact pressures on contact surfaces I and II exceed 56 MPa. In all these cases, the O–ring can achieve effective sealing. In addition, when the von Mises stress is increases, the possibility that a crack or the loss of elasticity appears in the O–ring is also increased [30,31].
To comprehensively investigate the sealing performance of the combined sealing structure, this study simulates the installation, inflation, and deflation state of the combined sealing structure at 15 °C and 70 MPa, the inflation state at 130 °C and 87.5 MPa, and the deflation state at −60 °C and 56 MPa. The von Mises stress and contact pressure obtained from the simulation results are analyzed to gain insights into the sealing performance. Moreover, the influences of the gas pressure, gasket surface friction coefficient, gasket fillet, and gasket thickness on the sealing performance of the combined sealing structure are investigated.
4.1. Simulation Results
4.1.1. Installation Status Results
Figure 7a shows the von Mises stress of the O–ring in the installation state. In the installation state at 15 °C and 0.1 MPa, two areas of high stress are observed in the middle of the O–ring, with the left side experiencing more severe stress concentration. This phenomenon is attributed to the compression pressure and shear force generated on contact surface I during axial propulsion. The results show that there will be stress concentration in the O–ring during work, and it is necessary to consider the stress characteristics of the O–ring.
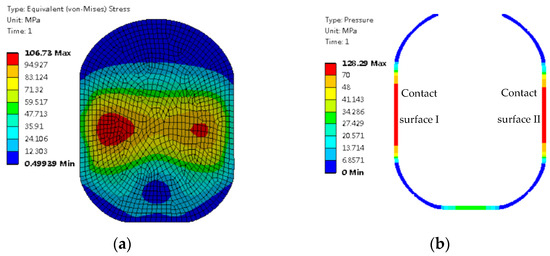
Figure 7.
O–ring in the installation state: (a) von Mises stress; (b) contact pressure.
Figure 7b shows the contact pressure of the O–ring in the installation state. In the installation state at 15 °C and 0.1 MPa, contact surface I and contact surface II generate contact pressure that ensures sealing of the contact surfaces. This shows that the rubber material can be closely fitted with the contact surface to achieve a good sealing effect.
4.1.2. Results under Normal Temperature Conditions
Figure 8a shows the von Mises stress of the O–ring in the inflation state. Compared with the installation state at 15 °C and 0.1 MPa, the von Mises stress concentration area at 15 °C and 70 MPa was moved down from the middle, and the maximum von Mises stress increased by 7%.
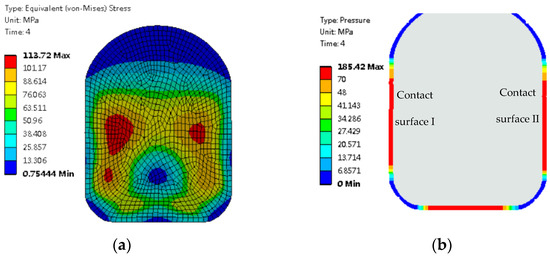
Figure 8.
O–ring in the inflation state: (a) von Mises stress; (b) contact pressure.
Figure 8b shows the contact pressure of the O–ring in the inflation state. Most of the contact pressures on the O–ring contact surfaces I and II are greater than 70 MPa, indicating that the O–ring can realize the sealing function in the inflated state. Compared with the installation condition at 15 °C and 0.1 MPa, the effective sealing length of the O–ring contact surfaces I and II is extended, indicating that the sealing performance is improved in the inflated state at 15 °C and 70 MPa.
Figure 9a shows the von Mises stress of the O–ring in the deflation state. Compared with the inflation state at 15 °C and 70 MPa, the von Mises stress concentration area in the aerated state moved upward from the center, and the maximum von Mises stress increased by 6%.
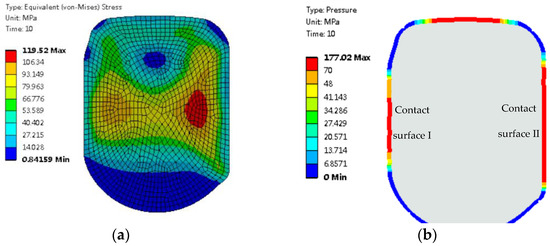
Figure 9.
O–ring in the deflation state: (a) von Mises stress; (b) contact pressure.
Figure 9b shows the contact pressure of the O–ring in the deflation state. Most of the contact pressures on the O–ring contact surfaces I and II are greater than 70 MPa, indicating that the O–ring can realize the sealing function in the deflation state. Compared with the inflation state at 15 °C and 70 MPa, the effective sealing length of contact surface I in the deflation state is reduced by 60% at 15 °C and 70 MPa, while the effective sealing length of contact surface II remains nearly unchanged. The reduction in contact length indicates a decrease in the contact area of the sealing surface, indicating a slightly decreased sealing performance of contact surface I in the deflation state at 15 °C and 70 MPa.
4.1.3. Results under Extreme Temperature Conditions
Figure 10 shows the von Mises stress of the O–ring in the inflation state under two distinct working conditions. Compared with the deflation state at 15 °C and 70 MPa, the high-stress area in the deflation state at 130 °C and 87.5 MPa no longer maintains a symmetrical distribution in the middle of the O–ring; it shifts downward towards the left and right lower corners of the O–ring. Significantly, the maximum von Mises stress of the O–ring decreases by 65% under this specific working condition. The results show that in the inflation state at 130 °C and 87.5 MPa, the stress concentration of the O–ring is reduced and it is less susceptible to damage.
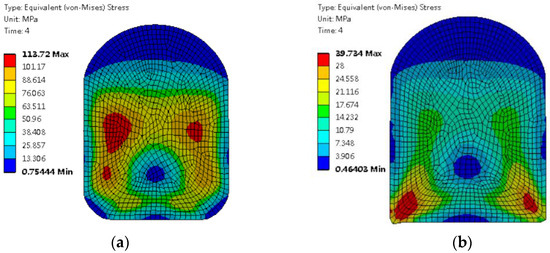
Figure 10.
von Mises stress of the O–ring in the inflation state under two working conditions: (a) 15 °C and 70 MPa; (b) 130 °C and 87.5 MPa.
Figure 11 shows the contact pressure of the O–ring in the inflation state under two different working conditions. Both contact surface I and contact surface II under the two working conditions can realize the sealing function. Compared with the inflatable condition at 15 °C and 70 MPa, the maximum contact pressure of contact surfaces I and II at 130 °C and 87.5 MPa is reduced by 40%, and the effective sealing lengths of contact surfaces I and II are both reduced by approximately 20%. The results show that the sealing performance of the O–ring is influenced by the working conditions, and the sealing effect is weakened in the inflation state at 130 °C and 87.5 MPa.
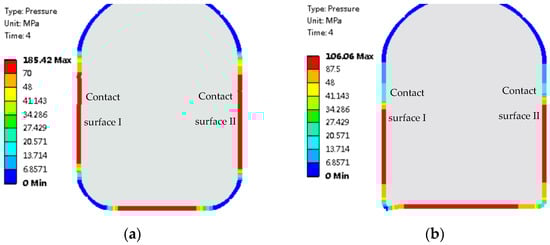
Figure 11.
Contact pressure of the O–ring in the inflation state under two working conditions: (a) 15 °C and 70 MPa; (b) 130 °C and 87.5 MPa.
Figure 12 shows the von Mises stress of the O–ring in the deflation state under two different working conditions. Compared with the deflation state at 15 °C and 70 MPa, the von Mises stress of the O–ring at −60 °C and 56 MPa is symmetrically distributed in the middle. In addition, the stress concentration is serious, and the maximum von Mises stress increases by 7 times. The results show that the stress concentration of the O–ring in the deflation state at −60 °C and 56 MPa is much more serious than that in the deflation state at 15 °C and 70 MPa.
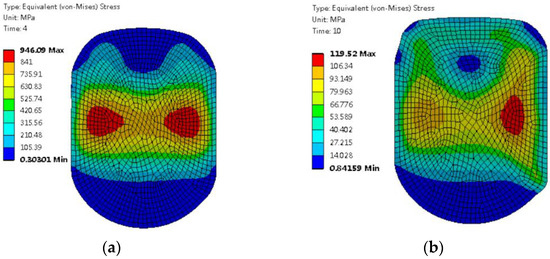
Figure 12.
von Mises stress of the O–ring in the deflation state under two working conditions: (a) −60 °C and 56 MPa; (b) 15 °C and 70 MPa.
Figure 13 shows the contact pressure of the O–ring in the deflation state under two different working conditions. Both contact surface I and contact surface II under the two working conditions can realize the sealing function. Compared with the deflation state at 15 °C and 70 MPa, the maximum contact pressure on contact surfaces I and II in the deflation state at −60 °C and 56 MPa increases by a remarkable 7 times, with the effective sealing length of contact surface I doubling. The contact pressure and sealing length of the contact surface directly determine the sealing performance of the seal. The results show the outstanding sealing performance of the rubber O–ring in the deflation state at −60 °C and 56 MPa.
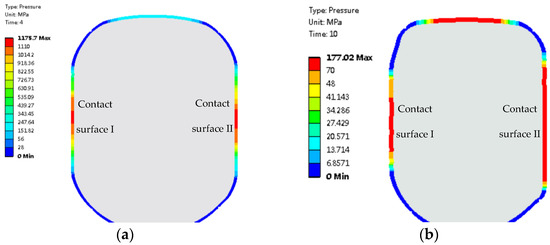
Figure 13.
Contact pressure of the O–ring in the deflation state under two working conditions: (a) −60 °C and 56 MPa; (b) 15 °C and 70 MPa.
To improve the clarity and completeness of presentation, as well as to provide a more informative and accurate depiction of the contact stress distribution at −60 °C, we have added Figure 14 to this paper. Figure 14a depicts the contact area of contact surface I and contact surface II of the sealing ring. Figure 14b illustrates the inner diameters of the effective sealing areas for contact surface I and contact surface II, which are 7 mm and 8.2 mm, respectively. In Figure 14c, the effective sealing lengths of the cross-sections for contact surface I and contact surface II are shown to be 0.7 mm and 0.76 mm, respectively. At this point, the maximum reaction forces along the X-axis for contact surface I and contact surface II are 35,796 N and 41,539 N, respectively.
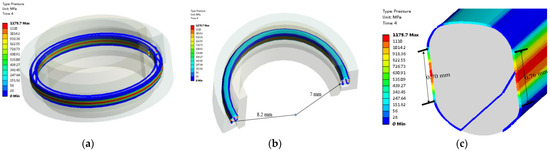
Figure 14.
The O–ring in the deflation state at −60 °C and 56 MPa: (a) the contact area of contact surface I and contact surface II; (b) the inner diameters of contact surface I and contact surface II; (c) the effective sealing lengths of contact surface I and contact surface II.
4.2. Discussion
4.2.1. Effect of Gas Pressure
This section analyzes the influence of gas pressure increases from 10 MPa to 100 MPa at 15 °C on O–ring performance. Figure 15a shows the maximum von Mises stress curves of the O–ring under various gas pressures. When the gas pressure is below 33 MPa, the inflation-state O–ring endures greater stress and is more susceptible to damage. Conversely, when the gas pressure surpasses 33 MPa, the deflation-state O–ring endures greater stress and is more susceptible to damage. As the gas pressure increases, the von Mises stress of the O–ring experiences a significant rise in both the inflation and deflation states, indicating that higher gas pressure accelerates the damage of the O–ring. Notably, the maximum von Mises stress increases at a faster rate in the deflation state, indicating a higher damage rate in this state.
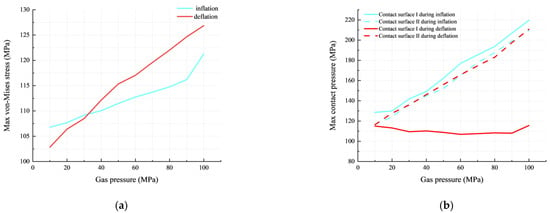
Figure 15.
Influence of gas pressure on O–ring performance: (a) max von Mises stress; (b) max contact pressure.
Figure 15b shows the maximum contact pressure curve of the O–ring under various gas pressures. The maximum contact pressures of contact surfaces I and II are greater than the corresponding gas pressure, indicating that the O–ring effectively realizes the sealing function within the pressure range of 10–100 MPa. With the gas pressure increases from 10 MPa to 100 MPa at 15 °C, the contact pressure of contact surface I in the deflation state remains consistently lower than the other three situations (contact surface I inflation, contact surface II inflation, and contact surface II deflation), indicating relatively poorer sealing performance in this situation. Furthermore, the maximum contact pressure of the three situations increases approximately linearly, aligning with the experimental results of Kim, H. et al. [32]. The maximum contact pressure of contact surface I in the deflation state experiences minor fluctuations around 10%. In summary, the increase in gas pressure (10–100 MPa) has a negligible influence on the sealing performance of contact surface I in the deflation state, while significantly improving the sealing performance of the other three conditions.
4.2.2. Influence of Gasket Surface Friction Coefficient
The O–ring is in contact with the gasket only in the deflation state, so the change of the surface friction coefficient of the gasket only affects the performance of the O–ring in the deflation state. Figure 16a shows the maximum von Mises stress curves of the O–ring under various gasket surface friction coefficients. As the surface friction coefficient of the gasket increases from 0.01 to 0.1 at 15 °C and 70 MPa, the maximum von Mises stress in the deflation state consistently larger than that in the inflation state. The results show a higher probability of O–ring damage in the deflated state. Additionally, the increase in von Mises stress in the deflation state is almost negligible, indicating that the influence of the friction coefficient on the von Mises stress in the deflation state can be disregarded.
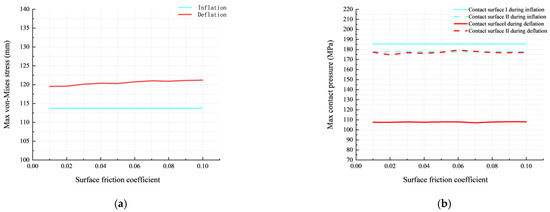
Figure 16.
Influence of surface friction coefficient on O–ring performance: (a) max von Mises stress; (b) max contact pressure.
Figure 16b shows the maximum contact pressure curves of the O–ring under various gasket surface friction coefficients. The maximum contact pressures of both contact surfaces I and II are greater than 70 MPa, indicating that the O–ring effectively achieves its sealing function across a wide surface friction coefficient range. As the friction coefficient of the gasket surface increases from 0.01 to 0.1 at 15 °C and 70 MPa, the maximum contact pressure in the deflation state of contact surface I consistently remains lower than the other three situations (inflation contact surface I, inflation contact surface II, and deflation contact surface II), indicating relatively poorer sealing performance in the deflation state of contact surface I. Furthermore, the maximum contact pressure of contact surface I in the deflation state remains unchanged, while the maximum contact pressure of contact surface II in the deflation state fluctuates by approximately 3%. The results show that the influence of the surface friction coefficient on the sealing performance in the deflation state can be ignored. In summary, the influence of the surface friction coefficient on the performance of the combined sealing structure is found to be negligible.
4.2.3. Effect of Gasket Fillet
The O–ring is only in contact with the gasket in the deflation state, so the change in the gasket fillet only affects the performance of the O–ring in the deflation state. Figure 17a shows the maximum von Mises stress curves of the O–ring with various gasket fillets. As the gasket fillet increases from 0 to 0.4 mm at 15 °C and 70 MPa, the maximum von Mises stress in the deflation state consistently surpasses that in the inflation state. The results show a higher likelihood of O–ring damage in the deflation state. Additionally, the increase in von Mises stress in the deflation state is almost negligible, indicating that the influence of the gasket fillet on the von Mises stress in the deflation state can be disregarded.
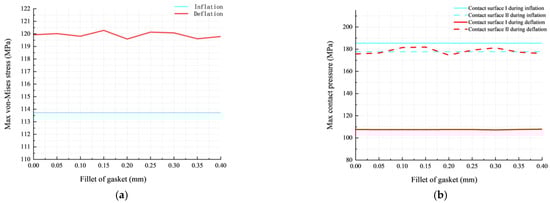
Figure 17.
Influence of gasket fillet on O–ring performance: (a) max von Mises stress; (b) max contact pressure.
Figure 17b shows the maximum contact pressure curves of the O–ring with various gasket fillets. The maximum contact pressures of both contact surfaces I and II are greater than 70 MPa, indicating effective sealing performance across a wide range of gasket fillets. As the gasket fillet increases from 0 to 0.4 mm at 15 °C and 70 MPa, the maximum contact pressure in the deflation state of contact surface I consistently remains lower than the other three situations (inflation contact surface I, inflation contact surface II, and deflation contact surface II), indicating relatively poorer sealing performance in the deflation state of contact surface I. Furthermore, the maximum contact pressure of contact surface I in the deflation state remains almost unchanged, while the maximum contact pressure of contact surface II fluctuates by approximately 3% in the deflation state. The result shows that the influence of the gasket fillet on the sealing performance in the deflation state can be ignored. In summary, the influence of the gasket fillet on the performance of the combined sealing structure is found to be negligible.
4.2.4. Effect of Gasket Thickness
The O–ring is only in contact with the gasket in the deflation state, so the change in the gasket thickness only affects the performance of the O–ring in the deflation state. Figure 18a shows the maximum von Mises stress curves of the O–ring with various gasket thicknesses. When the thickness of the gasket is within the range of 0.85–1.05 mm, the von Mises stress of the O–ring in the inflation state is greater and more likely to be damaged. In other ranges (0.3–0.85 mm or 1.05–1.2 mm), the von Mises stress of the O–ring in the deflation state is greater and more likely to be damaged. Additionally, as the gasket thickness increases from 0.3 mm to 1.2 mm at 15 °C and 70 MPa, the maximum von Mises stress of the O–ring in the deflation state initially experiences a sharp decrease from 137 MPa to 113 MPa, followed by a gradual rise to 116 MP. The results show that increasing the gasket thickness can effectively reduce the stress concentration of the O–ring, but excessive gasket thickness (more than 0.9 mm in this study) will aggravate the stress concentration.
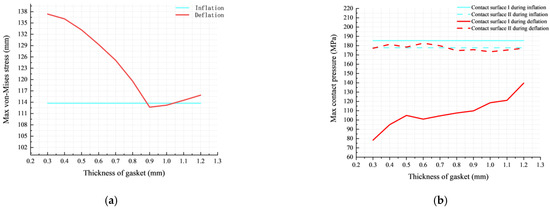
Figure 18.
Influence of gasket thickness on O–ring performance: (a) max von Mises stress; (b) max contact pressure.
Figure 18b shows the maximum contact pressure curves of O–rings with various gasket thicknesses. The maximum contact pressures of both contact surfaces I and II are greater than 70 MPa, indicating effective sealing performance across a wide range of gasket thicknesses. It can be clearly seen that as the gasket thickness increases from 0.3 mm to 1.2 mm, the gap between the contact pressure of contact surface I in the deflation state and the other three situations (inflation contact surface I, inflation contact surface II, and deflation contact II) gradually decreases. The results show that when the thickness of the gasket increases from 0.3 mm to 1.2 mm, although the sealing performance of surface I is always relatively poor in the deflated state, the gap between the sealing performance here and in the other three situations gradually diminishes. Furthermore, the maximum contact pressure of contact surface I in the deflation state increases from the minimum of 78 MPa to about 140 MPa, while the maximum contact pressure of contact surface II in the deflation state fluctuates by less than 3%. The results show that in the deflation state, the gasket thickness has a significant effect on the sealing performance of contact surface I, while the effect on the sealing performance of contact surface II is negligible.
In summary, based on the influence of gasket thickness on maximum von Mises stress and maximum contact pressure, the optimal range is determined to be between 0.85 mm and 1.05 mm. Within this range, the stress concentration of the O–ring is lighter and the sealing performance of the combined sealing structure is better.
5. Conclusions
- (1)
- In this study, a finite element model of the axial propulsion combined seal structure is established. Compressive stress–strain curves of EPDM at −60 °C, 15 °C, and 130 °C are obtained through uniaxial compression tests, and material parameters for the EPDM constitutive model at three temperatures are determined through fitting. The numerical simulations of the combined sealing structure provide valuable insights, revealing that the stress concentration of the O–ring is similar in both the inflation and deflation states at 15 °C and 70 MPa, but the sealing performance of the O–ring in the inflation state is better than that in the deflation stage.
- (2)
- The investigation into the sealing performance of the combined sealing structure under extreme working conditions reveals significant findings. Compared with the inflation state at 15 °C and 70 MPa, the maximum von Mises stress is reduced by 65% at 130 °C and 87.5 MPa, the maximum contact pressure of contact surfaces I and II is reduced by 40%, and the effective sealing lengths of contact surfaces I and II are both reduced by approximately 20%. Conversely, the von Mises stress is increased by 7 times in the deflation state at −60 °C and 56 MPa, and the maximum contact pressure on contact surfaces I and II is increased by a remarkable 7 times, with the effective sealing length of contact surface I doubling.
- (3)
- The investigation into the influence of gas pressure on the sealing performance of the combined sealing structure at 15 °C reveals significant findings. The von Mises stress of the O–ring increases significantly in both the inflation and deflation state, but the increase is more rapid in the deflation state. Interestingly, the increase in gas pressure (10–100 MPa) has a negligible influence on the sealing performance of contact surface I in the deflation state, while significantly improving the sealing performance of the other three conditions (contact surface I inflation, contact surface II inflation, and contact II deflation).
- (4)
- The investigation into the influence of gasket parameters on the sealing performance of the combined sealing structure at 15 °C and 70 MPa reveals significant findings. Increasing the gasket thickness can effectively reduce the stress concentration of the O–ring, but excessive gasket thickness (more than 0.9 mm in this study) will aggravate the stress concentration. The maximum contact pressure of contact surface I in the deflation state is significantly improved, while the effect of gasket thickness on the sealing performance of contact surface II in the deflation state is negligible. Based on the influence of gasket thickness on von Mises stress and contact pressure, the optimal range is determined to be between 0.85 mm and 1.05 mm. Within this range, the stress concentration of the O–ring is lighter, resulting in better sealing performance for the combined sealing structure. In addition, the friction coefficient of the gasket surface and the fillet of gasket have negligible influence on the structural performance of the combined sealing structure.
In this paper, the performance changes of an EPDM rubber O–ring under extreme working conditions are obtained. The stress concentration phenomenon of the EPDM rubber O-ring is lighter under high temperature conditions, but the sealing performance is decreased. At low temperatures, the stress concentration is serious, but the sealing performance is better. These conclusions provide reference for the selection of rubber materials for extreme temperature environments. Additionally, the influence of the gasket fillet, gasket thickness, gasket surface friction coefficient, and working pressure on the sealing performance of the combined sealing structure are analyzed. These analyses provide valuable insights and serve as a basis for the structural design of dynamic seals for combined sealing structures.
Author Contributions
Software, S.Z. and X.X.; methodology, S.Z. and Z.L.; investigation, X.M.; resources, J.L.; data curation, Y.L.; writing—original draft preparation, S.Z.; writing—review and editing, X.X.; project administration, D.W. and X.L. All authors have read and agreed to the published version of the manuscript.
Funding
This research was supported by National Key Research and Development program of China (2019YFB1504805) and Science and Technology Program of CSEI (2022key10) and CSEI secondary discipline (2021XKTD009).
Institutional Review Board Statement
Not applicable.
Informed Consent Statement
Not applicable.
Data Availability Statement
Not applicable.
Conflicts of Interest
The authors declare no conflict of interest.
References
- De, W. New exploration of rubber seal application in petrochemical test device. Rubber Sci. Technol. 2003, 16, 15–17. [Google Scholar]
- Zhang, M.; Suo, S.; Guo, F.; Jia, X.; Meng, G. Research of Forward Design Method of Contact Dynamic Seal. In Proceedings of the IOP Conference Series Materials Science and Engineering, Dalian, China, 1–3 July 2018. [Google Scholar] [CrossRef]
- Jun, W.; Runze, L. Sealing Performance Analysis of O–ring Assembly Based on Permeation Boundary. Mach. Tools Hydraul. 2020, 48, 1–6+29. [Google Scholar] [CrossRef]
- Miao, Z.; Jian, S. Experimental Study of Friction and Wear Interface Performance of Reciprocating Seal based on Sterling Seal. Chin. Hydraul. Pneum. 2019, 11, 99–104. [Google Scholar]
- Kim, B.; Suh, J.; Lee, B.; Chun, Y.; Hong, G.; Park, J.; Yu, Y. Numerical Analysis via Mixed Inverse Hydrodynamic Lubrication Theory of Reciprocating Rubber Seal Considering the Friction Thermal Effect. Appl. Sci. 2022, 13, 153. [Google Scholar] [CrossRef]
- György, S.; Károly, V. Large Strain Viscoelastic Material Model for Deformation, Stress and Strain Analysis of O–rings. J. Neurosurg. Sci. 2018, 62, 148–157. [Google Scholar] [CrossRef]
- Wu, D.; Wang, S.; Wang, X. A novel stress distribution analytical model of O–ring seals under different properties of materials. J. Mech. Sci. Technol. 2017, 31, 289–296. [Google Scholar] [CrossRef]
- Liang, B.; Yang, X.; Wang, Z.; Su, X.; Liao, B.; Ren, Y.; Sun, B. Influence of Randomness in Rubber Materials Parameters on the Reliability of Rubber O–Ring Seal. Materials 2019, 12, 1566. [Google Scholar] [CrossRef]
- Cheng, H.; Chen, X.; Chen, X.; Liu, H. Research on Key Factors of Sealing Performance of Combined Sealing Ring. Appl. Sci. 2022, 12, 714. [Google Scholar] [CrossRef]
- Nicolin, I.; Nicolin, B.A. Physico–mathematical model of the contact between the sealing O–ring and the sealing surfaces. INCAS Bull. 2019, 11, 229–237. [Google Scholar] [CrossRef]
- Karaszkiewicz, A. Geometry and contact pressure of an O–ring mounted in a seal groove. Ind. Eng. Chem. Res. 1990, 29, 2134–2137. [Google Scholar] [CrossRef]
- Szczypinski–Sala, W.; Lubas, J. Tribological Characteristic of a Ring Seal with Graphite Filler. Materials 2020, 13, 311. [Google Scholar] [CrossRef]
- Yamabe, J.; Koga, A.; Nishimura, S. Failure behavior of rubber O–ring under cyclic exposure to high–pressure hydrogen gas. Eng. Fail. Anal. 2013, 35, 193–205. [Google Scholar] [CrossRef]
- Zhou, C.; Chen, G.; Liu, P. Finite Element Analysis of Sealing Performance of Rubber D–Ring Seal in High–Pressure Hydrogen Storage Vessel. J. Fail. Anal. Prev. 2018, 18, 846–855. [Google Scholar] [CrossRef]
- Junjie, H.; Fei, G. Medium Parameters Effect on Sealing Performance of Lip Seal Ring. Coal Mine Mach. 2018, 39, 58–62. [Google Scholar]
- Chen, G.; Tan, J.; Chen, H. Failure mechanism of U–ring seal in water valve with high pressure and large flow capacity. J. Cent. South Univ. 2013, 44, 942–948. [Google Scholar]
- Zhang, L.; Wei, X. A Novel Structure of Rubber Ring for Hydraulic Buffer Seal Based on Numerical Simulation. Appl. Sci. 2021, 11, 2036. [Google Scholar] [CrossRef]
- Liu, X.; He, S.; Zheng, J. Analysis of Sealing Characteristics of Lip Seal Rings for Deep–Sea Separable Pressure Vessels. Appl. Sci. 2023, 13, 6843. [Google Scholar] [CrossRef]
- Zhang, J.; Xie, J. Investigation of Static and Dynamic Seal Performances of a Rubber O–Ring. J. Tribol. 2018, 140, 042202. [Google Scholar] [CrossRef]
- Zhang, M.; Li, D.; Suo, S.; Shi, J. Piston Rod Coating Material Study of Reciprocating Sealing Experiment Based on Sterling Seal. Appl. Sci. 2021, 11, 1370. [Google Scholar] [CrossRef]
- Kurt, M. Testing elastomers for hyperplastic material models in finite element analysis. Tire Technol. Int. 1999, 88, 36–42. [Google Scholar]
- Rivlin, R.S.; Saunders, D.W. Large elastic deformations of isotropic materials. Strain Distribution around a hole in a sheet. Philos. R. Soc. 1951, 243, 289–298. [Google Scholar] [CrossRef]
- Fired, I.; Johnson, A.R. Nonlinear computation of axisymmetric solid rubber deformation. Comput. Methods Appl. Mech. Eng. 1988, 67, 241–253. [Google Scholar] [CrossRef]
- Abbas, I.A. Finite Element analysis of the thermoelastic interactions in an unbounded body with acavity. Forsch. Im Ingenieurwesen 2007, 71, 215–222. [Google Scholar] [CrossRef]
- Yeoh, O.H. Characterization of Elastic Properties of Carbon–Black–Filled Rubber Vulcanizates. Rubber Chem. Technol. 2012, 63, 792–805. [Google Scholar] [CrossRef]
- Malito, L.G.; Arevalo, S.; Kozak, A.; Spiegelberg, S.; Bellare, A.; Pruitt, L. Material properties of ultra-high molecular weight polyethylene: Comparison of tension, compression, nanomechanics and microstructure across clinical formulations. J. Mech. Behav. Biomed. Mater. 2018, 83, 9–19. [Google Scholar] [CrossRef]
- Ledbetter, H.M. Stainless-steel elastic constants at low temperatures. J. Appl. Phys. 1981, 52, 1587–1589. [Google Scholar] [CrossRef]
- Lee, C.Y.; Lin, C.S.; Jian, R.-Q.; Wen, C.-Y. Simulation and experimentation on the contact width and pressure distribution of lip seals. Tribol. Int. 2006, 39, 915–920. [Google Scholar] [CrossRef]
- Xin, L.; Gao, P.; Li, Z. Prediction of seal wear with thermal structural coupled finite element method. Finite Elem. Anal. Des. 2014, 83, 10–21. [Google Scholar] [CrossRef]
- Zhou, S.M.; Chen, P.; Shi, Y. Analysis on Sealing Performance for a New Type of Rubber Saddle–shaped Sealing Ring Based on AQAQUS. Procedia Eng. 2015, 130, 1000–1009. [Google Scholar] [CrossRef]
- Zhou, Y.; Huang, Z.; Bu, Y.; Qiu, C.; Yuan, Y. Simulation studies on drilling mud pump plunger seal failure under ultrahigh pressure and ultradeep conditions. Eng. Fail. Anal. 2014, 45, 142–150. [Google Scholar] [CrossRef]
- Kim, H.K.; Nam, J.H.; Hawong, J.-S.; Lee, Y.-H. Evaluation of O–ring stresses subjected to vertical and one side lateral pressure by theoretical approxi-mation comparing with photoelastic experimental results. Eng. Fail. Anal. 2009, 16, 1876–1882. [Google Scholar] [CrossRef]
Disclaimer/Publisher’s Note: The statements, opinions and data contained in all publications are solely those of the individual author(s) and contributor(s) and not of MDPI and/or the editor(s). MDPI and/or the editor(s) disclaim responsibility for any injury to people or property resulting from any ideas, methods, instructions or products referred to in the content. |
© 2023 by the authors. Licensee MDPI, Basel, Switzerland. This article is an open access article distributed under the terms and conditions of the Creative Commons Attribution (CC BY) license (https://creativecommons.org/licenses/by/4.0/).