Article

Anthropometric Measurements, Physical Fitness Performance and Specific Throwing Strength in Adolescent Track-and-Field Throwers: Age, Sex and Sport Discipline

China Institute of Sport Science, Beijing 100061, China
*
Author to whom correspondence should be addressed.
Appl. Sci. 2023, 13(18), 10118; https://doi.org/10.3390/app131810118
Submission received: 27 July 2023 / Revised: 5 September 2023 / Accepted: 6 September 2023 / Published: 8 September 2023
(This article belongs to the Collection Sports Performance and Health)

Abstract

:

Featured Application

Understanding and researching the characteristics of adolescent athletes can contribute to enhancing the scientific level of training and talent identification. This study examined the anthropometric measurements and physical performance characteristics of female and male throwers from different age groups (14–18 years). Additionally, correlations among specific throwing strength and anthropometric and physical performance were analyzed, and regression models were established. The study reveals that boys aged 14–18 show higher trainability in overall athletic ability that requires multifaceted development. Girls, during the same period, experienced a significant improvement in agility. Agility, speed, strength, and explosive power are crucial qualities for specialized throwing development.

Abstract

Purpose: The aims of this study were: (1) to profile anthropometric, physical fitness, and specific throwing strength characteristics among 14–18 years boys and girls throwers; (2) to evaluate which factors vary with age, and which correlate with specific throwing strength; (3) to identify the measured variables that best predict specific throwing strength. Methods: Anthropometric, physical fitness, and specific throwing strength of 154 boys and 104 girls, who participated in track-and-field throw (Shot put, Javelin, Discus and Hammer throw) from four age categories (U15, U16, U17, U18), were measured in September 2022. The differences and correlations in parameters among different age, sex and throwing groups were analyzed using parametric and non-parametric testing. Multivariate linear regression analysis was used to identify the variables that best explain the specific throwing strength. Results: Disparities in height between boys and girls of the same age have consistently existed, however, the dissimilarity in weight tends to diminish as they grow older. Boys and girls of identical age groups exhibit noteworthy disparities in terms of speed, agility, and jumping prowess. These disparities tend to amplify as they advance in age. Significant differences were observed among boys of different ages in Height (p = 0.038), Body Mass (p = 0.02), BMI (p = 0.025), sit and reach test (p = 0.035), standing long jump (p = 0.012), standing triple jump (p < 0.01), forward overhead medicine ball throw (p = 0.002) and the hexagon agility test (p < 0.01). No differences were found in anthropometric measurements among girls, but differences were found in the hexagon agility test (p = 0.017) and plank test (p = 0.041). Specific throwing strength exhibits variations due to differences in events, age, and gender. Additionally, physical fitness performance, especially lower limb power, linear sprint speed, forward overhead medicine ball throw and backward overhead shot throw, have a high correlation with specific throwing strength. Conclusions: These findings broaden the existing knowledge base for coaches and practitioners, enabling them to discern the distinctive attributes of track and field throwers and capture the crucial physical markers that are pivotal for nurturing the progression of track-and-field throwers. The study suggests that throwers aged 14 to 18 should strive to comprehensively cultivate their athletic abilities.

1. Introduction

Track and field throwing sports, including shot put, javelin, discus, and hammer throw, are Olympic sports with a rich history and global participation [1]. No matter what kind of equipment and rules, executing a throw requires the proper and synchronized functioning of the entire kinetic chain musculature, which enables the creation of a harmonized movement pattern that facilitates the transmission of force [2]. Going further into the matter, the development of athletic skills and sport-specific performance is built upon a foundation of excellent physical fitness [3], body composition and somatotype characteristics [4]. Scholars have progressively acknowledged the crucial significance of sport-specific anthropometric and physical measurement values in the realm of competency assessment [5,6]. Due to the specialized nature of the throwing motion, its fitness characteristics is significantly different from other sports [4,7], thus emphasizing the necessity of sport-specific characteristic studies. There have been some reports on the physiological and anthropometric characteristics of adult and elite athletes [8,9]. However, the performance and biology of adolescent track-and-field athletes is different. For example, arms and legs strength [10] and explosiveness [11] were demonstrated to highly correlate with throwing performance, but these fitness’s have a different age-growth curve [2,12]. Combined with the differences in the rules of game for youth throwing athletes, it suggests that adolescent throwers may have different core fitness attributes compared to adult athletes. Additionally, although laboratory tests are precise in measuring physiological factors and controlling variables, it is time-consuming and expensive. Field tests, designed for specific sports, are more specific and feasible, especially for the youth [13]. Thus, using a reliable field test among different age groups could provide valid information for assessing the athletic performance of youth throwing athletes.
On the other hand, human development exhibits gender differences, necessitating the implementation of appropriate training methods tailored to these specific variations. The clarity of sex difference helps establish achievable objectives and devise tailored training regimens. Some studies reported sex differences in growth and performance among track and field athletes [14,15]. However, no published studies to date have investigated anthropometric and field test performance characteristics among juvenile throwing athletes. Furthermore, although achieving top-level at a young age might not a prerequisite for future achievements [16,17], morphological and physical fitness assessments can aid in distinguishing [18] and transferring [19] young athletes into specific sports. While the development and sustained success of elite athletes is influenced by numerous complex factors, the strategy of guiding young athletes toward suitable sports based on their individual talents seems feasible in their formative years.
A comprehension of the expected of the anticipated variations in age and gender is indispensable for coaches and practitioners. Accordingly, considering the scarcity of anthropometric and physical value research concerning juvenile throwers, the perspective of practitioners is limited. The objectives of this study were: (1) to profile the anthropometric, physical fitness, and specialized throwing strength characteristics of male and female throwers aged 14 to 18 years; (2) to identify which factors vary with age and correlate these with specific throwing strength; (3) to determine which anthropometric and physical fitness variables could explain the variance in the specific throwing performance.

2. Materials and Methods

2.1. Participants

A total of 356 adolescents (218 males and 138 females) were recruited from thirty-two training units in China. On average, all athletes completed 15–20 h of specific-throwing and physical training each week, with a training background of over 2 years. All participants have experience in participating in provincial-level or higher competitions. Age of the subjects was recorded based on their date of birth and the testing date, and they were grouped into four age groups: 14–15, 15–16, 16–17, and 17–18. This study was conducted in accordance with the Helsinki Declaration and received approval from the Ethics Committee of the China Institute of Sport Science. All athletes signed informed consent for testing (under the supervision of the coach and guardian), and obtained consent from parents and training institutions. Participants with injuries or those who had experienced sports-related injuries within the past three months (athletes, coaches, team doctors actively report) were excluded from this study. Considering missing data and subjects who did not complete all tests, 248 subjects (154 boys and 104 girls) were finally included in the study.

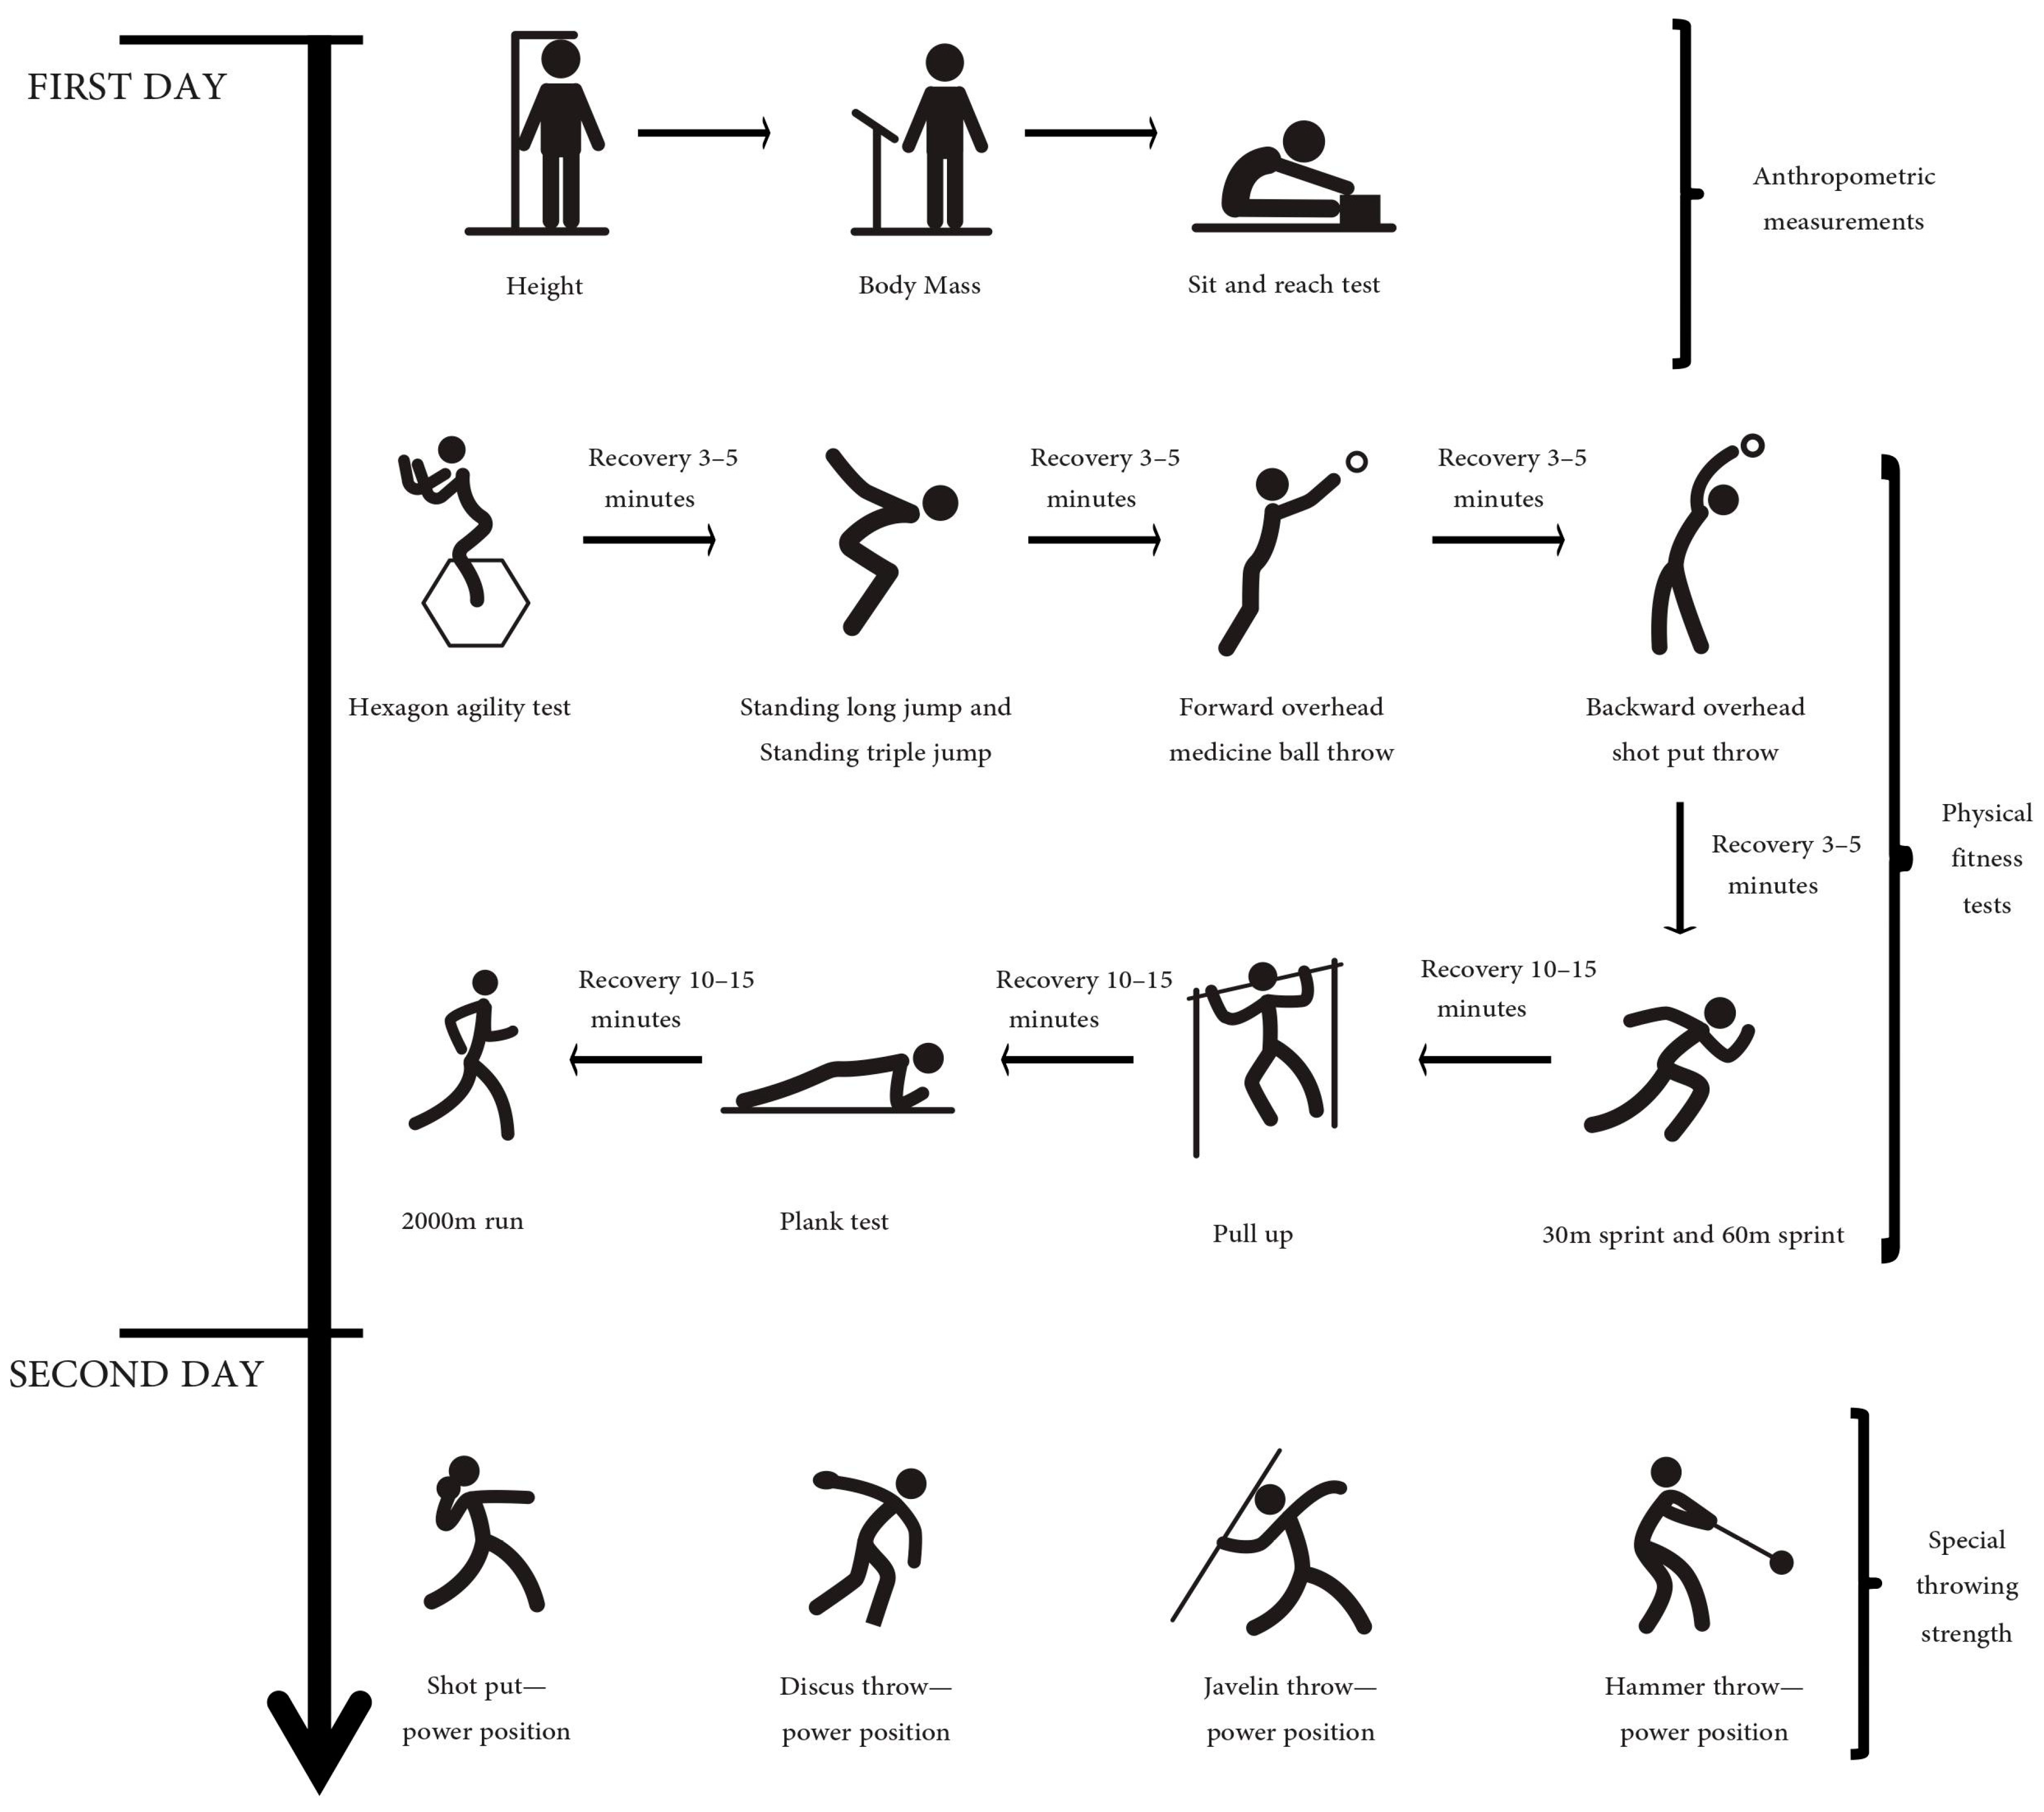
2.2. Experimental Design and Data Collection

The study recruited youth throwers of different ages (14–18 years) and genders. A series of standardized measurements and tests were conducted. Given the number of participants, the testing was conducted in batches, and all tests were concluded before the end of September 2022. The tests commenced at 9 AM. The first day included anthropometric and physical fitness tests, while the second day focused on specific throwing strength tests (Figure 1). All subjects received standardized training and explanations prior to the test. The measurements and tests were conducted by the same group of individuals, comprising over 20 individuals with backgrounds in sports science and coaching. Conducting pre-testing training for experimenters to standardize the testing procedures. The same group of experimenters conducted each test on athletes to ensure measurement consistency. All subjects followed the prescribed warm-up procedure, which included jogging, dynamic stretching, activation, and potentiation techniques [20]. On the first day, in the morning, all participants underwent anthropometric measurements, followed by physical fitness testing in the afternoon. The tests were conducted in the order indicated in Figure 1, ensuring that the completion of one test did not adversely affect performance in subsequent tests [21]. On the second morning, specialized throwing strength testing was conducted. We documented the results of all participant tests according to the specified requirements of each test.

2.3. Assessment of Anthropometry

The subjects followed a standardized procedure for measuring height (Height Tester, Donghuateng Sports Apparatus Ltd., Beijing, China) and weight (calibrated Seca Alpha 770) [22]. We recorded the measured data and specified the results to one decimal place. Additionally, we employed the sit and reach test, known for its high reliability [23], to assess back and leg flexibility [24]. Furthermore, we calculated the body mass index (BMI) of each athlete by dividing their weight by the square of their height (kg·m−2).

2.4. Assessment of Physical Performance

2.4.1. Hexagon Agility Test

The hexagon test is an agility measure that has shown high test–retest reliability (ICC = 0.938, p < 0.001) [25]. The participant stands with their feet together in the middle of a hexagon measuring 60 cm per side and with 120-degree angles, facing forwards during the course of the test. When the starting whistle is heard, the participant hops with both legs from the center of the hexagon in a clockwise direction. Once the participant completes three full revolutions (18 jumps) around the hexagon, the stopwatch [26] is stopped, and the time is recorded. Each subject was tested three times, and the fastest time was recorded. The minimum time unit is one-hundredth of a second. A rest interval of 3–5 min was provided between each test. Rigorous training to the experimenters and standardized testing procedures was provided to reduce human errors [26].

2.4.2. Standing Long Jump and Standing Triple Jump

Some studies have reported that standing long jump [27] and standing triple jump [28] can assess the lower limbs strength and power [29], and they are highly correlated with anaerobic output capacity in the youth. Participants were instructed to wear sneakers on a running track and stand behind the jumping line, then jump forward as fast as possible with an arm swing. All athletes performed three attempts of the long jump and three attempts of triple jump, starting from the edge of the jumping line with one minute rest between each trial. Standardized instructions were provided before testing. The distance between the jump line and the closest landing point, where any part of the body made contact with the ground, was measured with a minimum unit of 1 cm. The maximum distance was recorded.

2.4.3. Forward Overhead Medicine Ball Throw (FOMB) and Backward Overhead Shot Throw (BOST)

Backward overhead shot put throw [30], backward overhead medicine ball throw (BOMB) [31,32] and forward overhead medicine ball throw have been reported as effective tests for assessing the throwing performance and whole-body explosiveness for throwers in athletics [33]. The test–retest reliability of the FOMB was previously reported with a high Intraclass correlation coefficient (ICC) of 0.8403 (p < 0.01) [34], and the BOMB had an ICC of 0.996 (p < 0.01) [35]. The subject stood at a line, positioning their feet parallel and slightly separated while facing (facing away from) the throwing direction. They held the ball (Table 1) with both hands in front of the body and the entire body coordinated to exert force and complete the action of throwing the solid ball forward (or backward) with both hands. Three attempts were granted and the longest distance was recorded.

2.4.4. Linear Sprint

Rumpf [36] reported the reliability of overground sprint running assessments in youth. Therefore, we conducted 30 m and 60 m sprints to evaluate the linear sprint ability of athletes. Athletes stood 1 m behind the start line (which triggered the Photoelectric timing system) using either a 3-point start position or a standing start position, and sprinted for 30 m and 60 m. Each person had two attempts, and rested for 3–5 min between each test. The best results from the 30 m sprint and 60 m sprint are included in the analysis.

2.4.5. Pull Up

The pull-up test is considered an effective test for assessing upper body strength, particularly the strength of the upper back, arms, and shoulders [37]. The subject holds the bar with both hands placed squarely (palms forward), slightly wider than shoulder width. They raise themselves until the chin clears the bar, then lower themselves until the elbows are fully extended and in a hanging position, without any swinging motion. The maximum number of performed pull-ups was recorded.

2.4.6. Plank Test

The plank test is used to assess core muscle endurance and has demonstrated high test–retest reliability with an ICC of 0.99 [38]. The participant started in a prone position on the ground, supported by the body with the elbows, forearms and feet. The elbows were kept perpendicular to the floor, the hips lifted up, and the body remained in a straight line from head to heels. Once the participant assumed the “plank” position, the stopwatch was started. The test continued until the participant could no longer maintain the correct position. The test time was recorded in seconds.

2.4.7. 2000 m Run Test

Various forms of field test, like running [39], have been used to assess endurance [40]. VACLAV [41] suggests that the 2000 m run is an effective and simple field test for evaluating aerobic capacity. Participants started behind a starting line, and began running upon hearing the whistle. They completed the 2 km running in the shortest possible time. The finish time was recorded as “minute: second. millisecond” (mm: ss.00). Finally, all finish times were converted to minutes.

2.5. Assessment of Specific Throwing Strength

In order to minimize the impact of technology on throwing performance, we employed the power-position (without run-up, rotation, or glide) technique to assess the specific strength of youth athletes in shot put and discus. Previous studies have utilized power-position throwing to evaluate performance [8,42]. Furthermore, considering the importance of run-up speed in javelin [43] and release velocity in hammer throw [44], in determining the final throw distance, it is evident that the leg muscles play a significant role in generating force. Javelin athletes utilize a crossover stride technique without run-up for their throws, while under-16 hammer throwers execute one spin before releasing the hammer, and under-18 hammer throwers perform two spins before releasing the hammer.
Briefly, after a warm-up, athletes performed his/her own specialty in the prescribed way. Each athlete performed six throws, and the best result was recorded. A break of 3–5 min was provided between each testing session. Athletes of different ages used different weights of equipment (Table 1).

2.6. Statistical Methods

Descriptive statistics and test for differences, correlation analysis and multiple regression analysis were processed using IBM SPSS (Version 27, Chicago, IL, USA). To assess the Gaussian distribution of the measured data, the Shapiro–Wilks test was used [45].
Differential analysis was conducted on the collected anthropometric and physical fitness test data. Firstly, the data was grouped by age, and for normally distributed data, a one-way analysis of variance (ANOVA) was performed. Multiple pairwise comparisons within each group were conducted using the Least Significant Digit (LSD) [46]. For Non-normal distribution data, a non-parametric test (Kruskal–Wallis H test, K–W H test) was conducted. Secondly, the data was grouped by gender. For normally distributed data, an independent sample t-test was performed, while for non-normal distribution data and potential violations on the assumption of homogeneity of variances, the Mann–Whitney U test was conducted. Spearman correlation analysis was conducted to examine the relationships among anthropometric measurements, physical fitness performance, and specific throwing strength. Finally, the differences of specific throwing strength were analyzed according to event classification. All the indicators are included in the stepwise regression analysis [47] to establish a predict model for specific throwing strength. The effect size of correlation is r, r = 0.1–0.29 = small, 0.3–0.49 = medium, 0.5–0.69 = large, 0.7–0.89 = very large, 0.9–0.99 = almost perfect, and 1 = perfect [46]. The level of significannce was set at 0.05.

3. Results

3.1. Differences of Anthropometric and Physical Fitness Measurements among Different Age Groups and Sex

As shown in Table 2, various testing indicators among adolescent throwers aged 14–18 exhibit distinct differences. Morphological and physical fitness indicators vary to different extents among boys and girls of the same age. Height differences persist consistently (p < 0.01); weight differences disappear at ages 17–18; lower limb flexibility differences vanish around ages 16–17; agility only exhibits differences at ages 17–18 (p < 0.01); jumping ability consistently displays significant differences (p < 0.01); FOMB and BOST differences gradually diminish at ages 16 and 17; sprint speed remains different consistently (p < 0.01); and aerobic endurance differences persist throughout (p < 0.01).
Moreover, significant anthropometric differences were observed only among boys of different ages in Height (F = 2.88, p = 0.038), Body Mass (H = 14.964, p = 0.02), BMI (F = 3.208, p = 0.025), and the sit and reach test (H = 8.631, p = 0.035). After conducting pairwise comparison, differences in height were found for boys aged between 14–15 (p = 0.017) as well as 14–16 (p = 0.008); in Body Mass between ages 14–15 and 15–16 (p = 0.01), as well as 14–15 and 16-17 (p = 0.014); in BMI between ages 14–15 and 15–16 (p = 0.008); and in the sit and reach test between ages 14–15 and 16–17 (p = 0.033), as well as 14–15 and 17–18 (p = 0.019).
Similarly, significant differences were also found in physical fitness performance among boys of different ages, including standing long jump (H = 10.931, p = 0.012), standing triple jump (H = 16.725, p < 0.01), FOMB (H = 14.90, p = 0.002) and the hexagon agility test (H = 42.824, p < 0.001). After conducting multiple pairwise comparisons within each group, it was found that there were differences in standing long jump between ages 14–15 and 16–17, as well as between ages 14–15 and 17–18. Additionally, differences were observed in standing triple jump between ages 14–15 and 16–17, as well as between ages 14–15 and 17–18. Moreover, significant differences were found in shot put between ages 14–15 and 15–16, and differences in agility were observed between ages 14–15 and 16–17, and also 14–15 and 17–18, as well as 15–16 and 17–18. Additionally, significant differences were observed among girls of different ages in the hexagon agility test (H = 10.184, p = 0.017) and plank test (H = 8.241, p = 0.041). After conducting multiple pairwise comparisons within each group, it was found that there were differences in agility between ages 14–15 and 16–17 (p = 0.002), as well as between 15–16 and 16-17 (p = 0.044). Additionally, differences were observed in the plank hold for girls aged between 14–15 and 16–17 (p = 0.005), as well as between 15–16 and 16–17 (p = 0.026).
The differences in specific strength between boys and girls in four throwing events within the same age group, and the differences within the same gender across different age groups, are shown in Figure 2. The specific strength in shot put of boys and girls aged 14–15 (p < 0.01) and 15–16 (p < 0.01) showed differences. There also differences between boys aged 14–15 and 15–16 (p = 0.020), as well as 15–16 and 16–17 (p = 0.016), and in girls aged between 14–15 and 16–17 (p = 0.025), 15–16 and 16–17 (p = 0.011), and 15–16 and 17–18 (p = 0.029). Among discus throwers, differences were found only between boys and girls aged 15–16 (p < 0.01) and 16–17 (p = 0.044). In javelin throwers, differences were found between boys and girls aged 14–15 (p < 0.01), 15–16 (p = 0.011) and 17–18 (p < 0.01). Among boys, differences were observed between ages 14–15 and 17–18 (p = 0.002), 15–16 and 17–18 (p < 0.01), and 16–17 and 17–18 (p = 0.028). However, no age differences were found among girls. In hammer throw athletes, only girls aged 14–15 and 16–17 showed differences (p = 0.014).

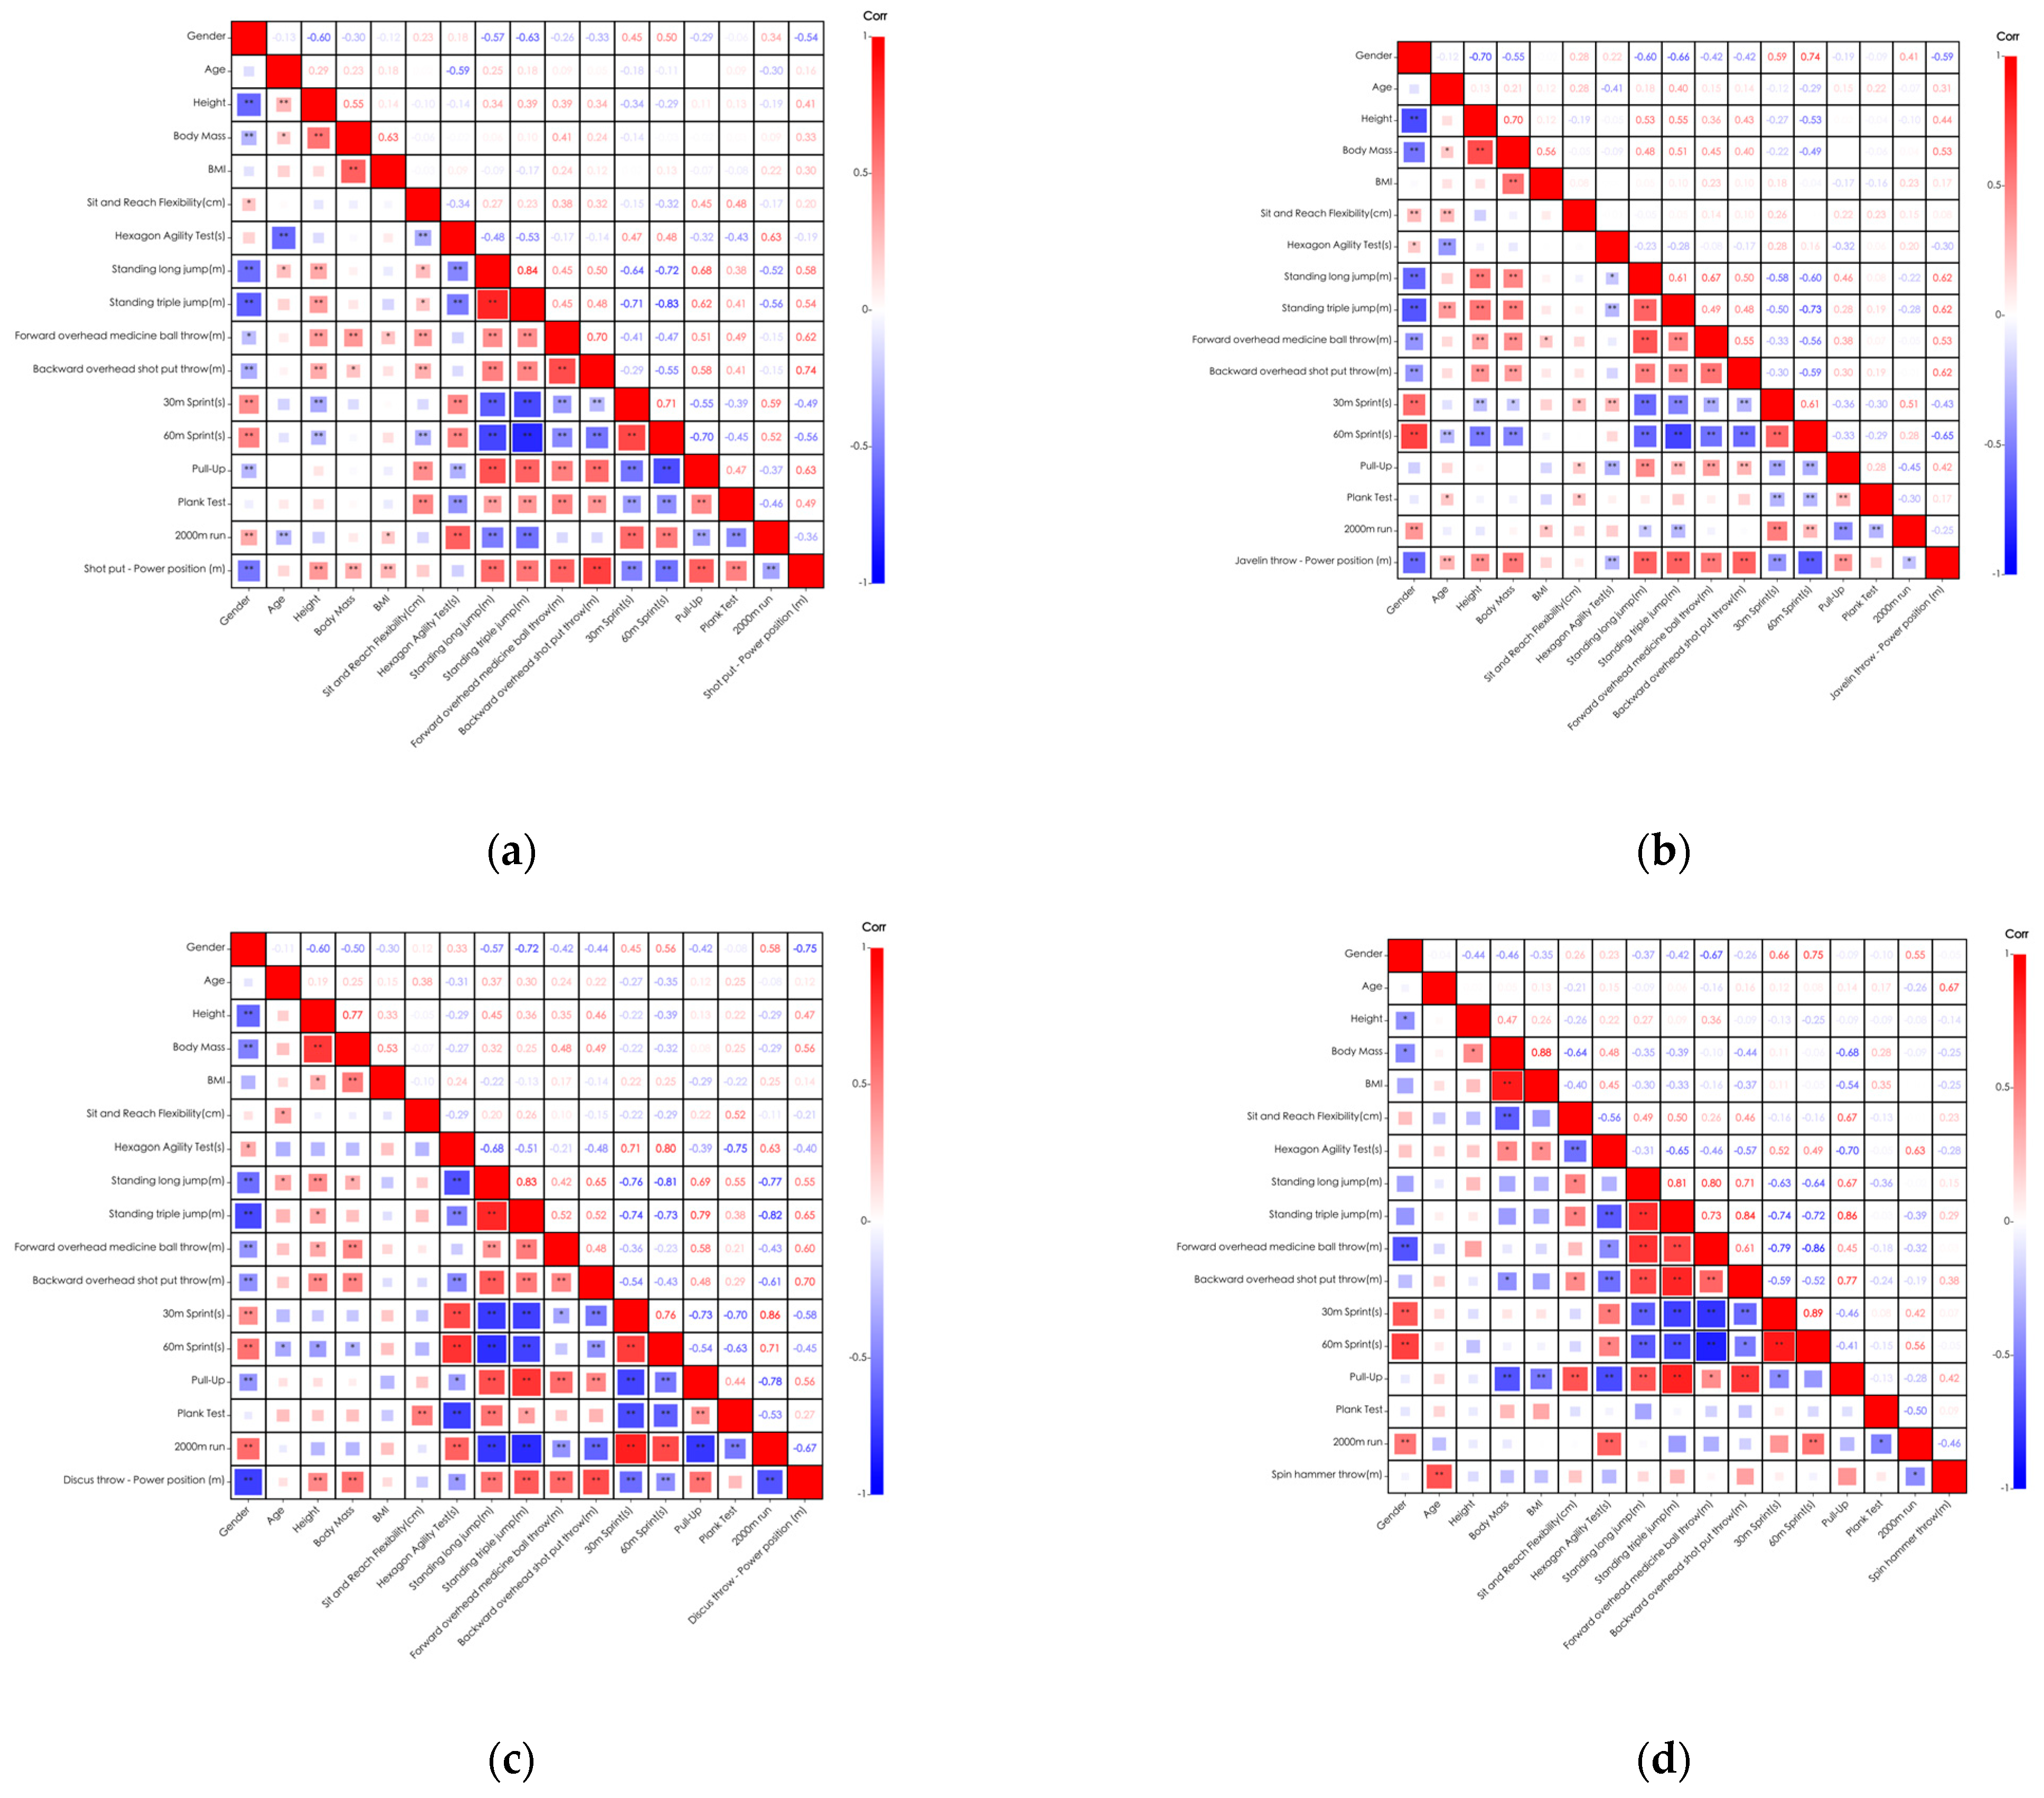
3.2. Correlations between Anthropometric Parameters, Physical Fitness Performance and Specific Throwing Strength

Associations of anthropometric measurements and physical fitness performance for different boys and girls show a varied degree in Figure 3. More precisely, the Body Mass (r = 0.16, p < 0.05), lower body flexibility (r = 0.23, p < 0.01), hexagon agility test (r = −0.49, p < 0.01), standing long jump (r = 0.28, p < 0.01) and standing triple jump (r = 0.30, p < 0.01) of boys are significantly correlated with age, while other attributes are unrelated to age. For girls, only the hexagon agility test (r = −0.29, p < 0.01), standing triple jump (r = 0.22, p < 0.05), and plank test (r = 0.20, p < 0.05) show a correlation with age. Regardless of gender, most physical fitness abilities exhibit significant intercorrelations.
Furthermore, associations of different measurements for shot put, discus throw, javelin throw and hammer throw athletes are shown in Figure 4, respectively. Height (in shot put (r = 0.41, p < 0.01), javelin (r = 0.44, p < 0.01), and discus throw (r = 0.47, p < 0.01)), weight (in shot put (r = 0.33, p < 0.01), javelin (r = 0.53, p < 0.01), and discus throw (r = 0.56, p < 0.01)), and throwing distance are positively correlated; standing long jump (in shot put (r = 0.58, p < 0.01), javelin (r = 0.62, p < 0.01), and discus (r = 0.55, p < 0.01)) and standing triple jump (in shot put (r = 0.54, p < 0.01), javelin (r = 0.62, p < 0.01), and discus (r = 0.65, p < 0.01)) show a high correlation with throwing distance; 30 m (in shot put (r = −0.49, p < 0.01), javelin (r = −0.43, p < 0.01), and discus (r = −0.58, p < 0.01)); and 60 m (in shot put (r = −0.56, p < 0.01), javelin (r = −0.65, p < 0.01), and discus (r = −0.45, p < 0.01)) sprints are negatively correlated with throwing distance height, indicating that faster running results in better performance. But no correlation was found between the hammer throw and jumping or sprinting. A negative correlation was found between agility and throwing distance, only in javelin (r = −0.30, p < 0.05) and discus (r = −0.40, p < 0.05). Special throwing has a high correlation with FOMB (r = 0.62, p < 0.01, in shot put; r = 0.53, p < 0.01, in javelin throw; r = 0.60, p < 0.01, in discus throw) and BOST (r = 0.74, p < 0.01, in shot put; r = 0.62, p < 0.01, in javelin throw; r = 0.70, p < 0.01, in discus throw).
Finally, the gender, age, all anthropometric and physical fitness variables and specific throwing indicators were inserted in the stepwise regression model (Table 3). The results of regression equations indicated that, due to the differences of sport discipline, body morphology and physical fitness have different significant contributor to the final performance (p < 0.05 in four throwing events). However, with the exception of the hammer throw, BOST is included in the equation for all.

4. Discussion

This study was the first to identify the characteristics and differences in anthropometric, physical fitness and specific throwing strength aspects between sexes for adolescent throwers aged 14–18. Series tests, including 11 anthropometric and physical fitness tests and specific throwing tests, were conducted on 258 youth throwers. The main findings included differences in anthropometric and physical performance aspects as chronological age changes, along with the varying degrees of correlation between different indicators and specific throwing strength.
Adolescents generally begin to experience their peak height velocity (PHV) around the age of 13, with girls potentially starting it a bit earlier [48]. Our research found that there are differences in anthropometric measurements among boys aged 14 to 18, while no differences were observed among girls. The anthropometric characteristics of adolescent throwers align with previous findings; throwing athletes tend to be taller and heavier [4]. Taller and heavier athletes may have a potential advantage because they may have greater muscle mass [49] and release height [43]. Boys continue to experience rapid development between the ages of 14 to 18, while earlier growth in girls makes the differences during this period less pronounced. Additionally, we also found a significant correlation between height, weight, and the specific throwing strength. Thorland et al. analyzed junior Olympic athletes and similarly discovered their unique anthropometric characteristics [4].
For physical fitness performance, among boys of different ages, significant differences were found in the hexagon agility test, standing long jump, standing triple jump and FOMB. These results are in line with previous findings, which found an increase of agility [50], muscle strength and power [51] performance with maturation for boys. Our research findings suggest that male throwing athletes aged 14–18 experience a higher growth rate in agility and lower limb power. Similarly, among girls of different ages, significant differences were observed in the hexagon agility test and plank test. This indicates that after the PHV, agility still exhibits considerable growth with advancing age. Furthermore, boys and girls of the same age show significant differences in speed, agility and explosive power, and even if there is no difference at 14–16 years old, there is a gradual difference at 17–18 years old. However, the differences in FOMB and BOST and specific throwing strength diminish with increasing age. This trend could potentially be attributed to variations in the weight of the equipment used. These findings reveal that growth and development during adolescence may influence these variables differently. It enables coaches and athletes to consider the distinct progression rates in key indicator developments across different stages, thereby designing tailored training programs that adapt to these changes.
Notably, specific throwing strength demonstrated significant correlations with FOMB and BOST, although they use different force generation patterns. Stockbrugger et al. [35] confirmed the effectiveness of the medicine ball throw in assessing the explosive power for an analogous total-body movement pattern in sand volleyball players. In our study, FOMB showed a significant correlation with shot put, javelin throw, and discus throw, and BOST exhibited a significant correlation with shot put, javelin throw, and discus throw. In addition, BOST is present in the regression equations for shot put, javelin, and discus. The assessment of specific strength using FOMB and BOST is suggested as viable field test components for track-and-field throwing athletes. Furthermore, we found lower body power, linear sprint speed, upper back strength and aerobic ability correlated with specific throwing strength in shot put, javelin throw, and discus throw events. Undoubtedly, speed, power [52], agility and coordination are linked to the performance in throwing [53]. Slawinski et al. found that the rate of force development (RFD) in elite sprinters was significantly greater [54]. Zaras [33] found a correlation between the rate of force development in the lower limbs and performance in adult throwers. The above-mentioned study can explain the results of this article, as athletes who run faster and jump higher possess better explosive power, resulting in a higher level of specific throwing performance. Remarkably, the 2000 m run shows a negative correlation with specific strength, indicating that individuals who perform better in the aerobic run exhibit greater strength. Previous studies have indicated that an excessive focus on developing aerobic capacity may lead to a decline in specialized performance [55]. Our findings may be attributed to the natural growth in aerobic capacity; however, further research is warranted to fully comprehend the underlying mechanisms behind these correlations.
Finally, the specific throwing strength could be predicted by a different combination of age, sex, anthropometric measurements and physical fitness; the total variance in shot put, javelin and hammer thrower explained were above 60%, exhibiting reliable predictiveness. The presence of standing long jump (p = 0.026), 60 m sprint (p < 0.01) and BOST (p < 0.01) in the predictive equation for javelin throw and FOMB (p < 0.01) in shot put, and BOST (p < 0.01) and FOMB (p = 0.04) in discus, emphasize the importance of rapid force generation.
Overall, previous research has found that world-class adult athletes have a more extensive participation in sports and training during their adolescence [56]. Our findings suggest that various physical fitness parameters play a crucial role in the performance of different throwing events, indicating that the comprehensive development of physical motor abilities in adolescent throwing athletes contributes to their specialized development in the sport. For adolescent throwing athletes, it is crucial to focus on strength, speed, and agility qualities. Coaches need to consider these cross-interacting factors of athletic abilities repeatedly during athlete selection and training, as it may have a transfer effect on specialization.

5. Limitations and Future Outlook

In this study, several limitations should be acknowledged. Firstly, in order to facilitate the development of coaching, we focused solely on the performance of field testing and did not conduct extensive physiological assessments. To gain a deeper understanding of the characteristic of adolescent throwing athletes, future research will need to necessitate more comprehensive testing and analysis. Secondly, we only studied adolescent throwers aged 14 to 18 and the chronological age of athletes. The lack of maturity analysis [51] for athletes limits the depth of this study. We are uncertain about the impact of early and late maturation on adolescent throwers. Furthermore, high-performance during adolescence may not necessarily mean a higher performance at later ages [16,17]. Many factors have an impact on the performance of athletes, like the relative age effect [57], biological age, hormones [58] and so on. Further research is also needed to delve into the optimal development for adolescents that contributes to their performance in adulthood.
Finally, it is possible that, due to the limited number of participants, correlations were observed only between specific spin hammer throw and age as well as the 2000 m run. It is also possible that the included variables were insufficient to fully capture the characteristics of hammer throw athletes, and further in-depth analysis will be required in the future. It has to be stressed that the regression model was solely employed to assess specific throwing performance for throwers aged between 14–18. Its applicability needs further validation.
In the future, it is essential to take into account factors such as maturity status and variability in physiological profiles in order to better comprehend, identify, and nurture the physical attributes of adolescent athletes. More extensive research is required to further investigate the physical and physiological attributes of track-and-field throwers. Specifically, future researches should consider standardized testing batteries and explore the links between physical fitness performance and throwing performance, expanding current knowledge for talent identification and informing tailored conditioning programs for adolescents within the sport. It is possible to build upon this study by enriching the indicators and content of the tests, and developing more effective talent identification schemes and evaluation models.

6. Conclusions

This study analyzed anthropometric measurements and physical fitness performance variance according to age and sex among adolescent track-and-field athletes, as well as the correlations between these variables. The main research findings indicate that throwing athletes have greater height and weight, and practitioners can refer to the specific data of different age groups in the results for talent identification. Boys aged 14–18 are still experiencing rapid growth. Boys show a larger gap with girls in dynamic abilities (especially speed and explosive power) as they age. Furthermore, nearly the majority of physical fitness indicators in this study exhibited correlations with specific throwing strength. During the age range of 14–18, athletes should continue to develop their overall athletic abilities comprehensively, especially agility, speed, strength and power, as it benefits the development of specific strength. The high predictability of the regression models and correlations between indicators suggest that the 11 anthropometric and physical fitness tests, as well as specific throwing strength tests conducted in this study, effectively establish a testing battery for adolescent throwers. These results could provide valuable insights for coaches and athletes in future practice and studies.

Author Contributions

Conceptualization, Y.Z. and K.Z.; formal analysis, Y.Z.; investigation, Y.Z.; writing—original draft preparation, Y.Z.; writing—review and editing, Y.Z. and K.Z.; visualization, Y.Z.; supervision, K.Z. All authors have read and agreed to the published version of the manuscript.

Funding

This research received fund from China Institute of Sport Science (Project 23-42 Supported 403 by the Fundamental Research Funds for the China Institute of Sport Science; Project 23-13 Supported by the Fundamental Research Funds for the China Institute of Sport Science).

Institutional Review Board Statement

The study was conducted in accordance with the Declaration of Helsinki and approved by the China Institute of Sport Science (Approval code: 20230713).

Informed Consent Statement

Informed consent was obtained from all participants involved in the study. Written informed consent has been obtained from the participant(s) to publish this paper.

Data Availability Statement

The data set used in this study is part of youth physical fitness testing and assessment project conducted by the China Athletics Association. The data underlying this article cannot be shared publicly due to Privacy and related policy requirements for adolescent development. The data will be shared with corresponding authors for research purposes only.

Acknowledgments

We would like to express our gratitude to the Chinese Athletics Association for its contribution to the development of young athletes and the Chinese Institute of Sports Science for its support of this study.

Conflicts of Interest

The authors declare no conflict of interest.

References

  1. Meron, A.; Saint-Phard, D. Track and Field Throwing Sports: Injuries and Prevention. Curr. Sports Med. Rep. 2017, 16, 391–396. [Google Scholar] [CrossRef] [PubMed]
  2. Łysoń-Uklańska, B.; Błażkiewicz, M.; Kwacz, M.; Wit, A. Muscle Force Patterns in Lower Extremity Muscles for Elite Discus Throwers, Javelin Throwers and Shot-Putters—A Case Study. J. Hum. Kinet. 2021, 78, 5–14. [Google Scholar] [CrossRef] [PubMed]
  3. Suchomel, T.J.; Nimphius, S.; Stone, M.H. The Importance of Muscular Strength in Athletic Performance. Sports Med. 2016, 46, 1419–1449. [Google Scholar] [CrossRef] [PubMed]
  4. Thorland, W.G.; Johnson, G.O.; Fagot, T.G.; Tharp, G.D.; Hammer, R.W. Body composition and somatotype characteristics of junior Olympic athletes. Med. Sci. Sports Exerc. 1981, 13, 332–338. [Google Scholar] [CrossRef] [PubMed]
  5. Larkin, P.; Sortino, B.; Carlon, T.; Saunders, T.; Pane, C. Gender- and Sport-specific Normative Anthropometric and Physical Values in Talent-Identified High School Athletes. J. Strength Cond. Res. 2023, 37, 606–615. [Google Scholar] [CrossRef] [PubMed]
  6. Larkin, P.; Carlon, T.; Sortino, B.; Greer, S.; Cuttiford, T.; Wijekulasuriya, G.; Pane, C. Anthropometry and Physical Performance in 13-Year-Old Australian Talent-Identified Male and Female Athletes Compared to an Age-Matched General Population Cohort. Children 2023, 10, 212. [Google Scholar] [CrossRef] [PubMed]
  7. Nikolaidis, P.T.; Son’kin, V.D. Sports Physiology in Adolescent Track-and-Field Athletes: A Narrative Review. Open Access J. Sports Med. 2023, 14, 59–68. [Google Scholar] [CrossRef]
  8. Kyriazis, T.; Terzis, G.; Karampatsos, G.; Kavouras, S.; Georgiadis, G. Body Composition and Performance in Shot Put Athletes at Preseason and at Competition. Int. J. Sports Physiol. Perform. 2010, 5, 417–421. [Google Scholar] [CrossRef]
  9. Santos, D.A.; Dawson, J.A.; Matias, C.N.; Rocha, P.M.; Minderico, C.S.; Allison, D.B.; Sardinha, L.B.; Silva, A.M. Reference values for body composition and anthropometric measurements in athletes. PLoS ONE 2014, 9, e97846. [Google Scholar] [CrossRef]
  10. Bouhlel, E.; Chelly, M.S.; Tabka, Z.; Shephard, R. Relationships between maximal anaerobic power of the arms and legs and javelin performance. J. Sports Med. Phys. Fit. 2007, 47, 141–146. [Google Scholar]
  11. Zaras, N.; Stasinaki, A.-N.; Methenitis, S.; Karampatsos, G.; Fatouros, I.; Hadjicharalambous, M.; Terzis, G. Track and field throwing performance prediction: Training intervention, muscle architecture adaptations and field tests explosiveness ability. J. Phys. Educ. Sport 2019, 19, 436–443. [Google Scholar]
  12. Stone, M.H.; Sanborn, K.; O’Bryant, H.S.; Hartman, M.; Stone, M.E.; Proulx, C.; Ward, B.; Hruby, J. Maximum Strength-Power-Performance Relationships in Collegiate Throwers. J. Strength Cond. Res. 2003, 17, 739–745. [Google Scholar] [PubMed]
  13. Bergeron, M.F.; Mountjoy, M.; Armstrong, N.; Chia, M.; Côté, J.; Emery, C.A.; Faigenbaum, A.; Hall, G., Jr.; Kriemler, S.; Léglise, M.; et al. International Olympic Committee consensus statement on youth athletic development. Br. J. Sports Med. 2015, 49, 843–851. [Google Scholar] [CrossRef] [PubMed]
  14. Malina, R.M.; Sławińska, T.; Ignasiak, Z.; Rożek, K.; Kochan, K.; Domaradzki, J.; Fugiel, J. Sex Differences in Growth and Performance of Track and Field Athletes 11–15 Years. J. Hum. Kinet. 2010, 24, 79–85. [Google Scholar] [CrossRef]
  15. Tønnessen, E.; Svendsen, I.S.; Olsen, I.C.; Guttormsen, A.; Haugen, T. Performance development in adolescent track and field athletes according to age, sex and sport discipline. PLoS ONE 2015, 10, e0129014. [Google Scholar] [CrossRef] [PubMed]
  16. Boccia, G.; Cardinale, M.; Brustio, P.R. Elite Junior Throwers Unlikely to Remain at the Top Level in the Senior Category. Int. J. Sports Physiol. Perform. 2021, 16, 1281–1287. [Google Scholar] [CrossRef] [PubMed]
  17. Boccia, G.; Brustio, P.R.; Moisè, P.; Franceschi, A.; La Torre, A.; Schena, F.; Rainoldi, A.; Cardinale, M. Elite national athletes reach their peak performance later than non-elite in sprints and throwing events. J. Sci. Med. Sport 2019, 22, 342–347. [Google Scholar] [CrossRef] [PubMed]
  18. Pion, J.; Segers, V.; Fransen, J.; Debuyck, G.; Deprez, D.; Haerens, L.; Vaeyens, R.; Philippaerts, R.; Lenoir, M. Generic anthropometric and performance characteristics among elite adolescent boys in nine different sports. Eur. J. Sport Sci. 2015, 15, 357–366. [Google Scholar] [CrossRef]
  19. Collins, R.; Collins, D.; MacNamara, A.; Jones, M.I. Change of plans: An evaluation of the effectiveness and underlying mechanisms of successful talent transfer. J. Sports Sci. 2014, 32, 1621–1630. [Google Scholar] [CrossRef]
  20. Jeffreys, I. Warm up revisited–the ‘ramp’ method of optimising performance preparation. UKSCA J. 2006, 6, 15–19. [Google Scholar]
  21. Haff, G.G.; Triplett, N.T. Essentials of Strength Training and Conditioning, 4th ed.; Human Kinetics: Champaign, IL, USA, 2015. [Google Scholar]
  22. Norton, K.I. Standards for anthropometry assessment. Kinanthropometry Exerc. Physiol. 2018, 4, 68–137. [Google Scholar]
  23. Safrit, M.J. The Validity and Reliability of Fitness Tests for Children: A Review. Pediatr. Exerc. Sci. 1990, 2, 9–28. [Google Scholar] [CrossRef]
  24. Hoeger, W.W.K.; Hopkins, D.R.; Button, S.; Palmer, T.A. Comparing the Sit and Reach with the Modified Sit and Reach in Measuring Flexibility in Adolescents. Pediatr. Exerc. Sci. 1990, 2, 156–162. [Google Scholar] [CrossRef]
  25. Beekhuizen, K.S.; Davis, M.D.; Kolber, M.J.; Cheng, M.-S.S. Test-Retest Reliability and Minimal Detectable Change of the Hexagon Agility Test. J. Strength Cond. Res. 2009, 23, 2167–2171. [Google Scholar] [CrossRef] [PubMed]
  26. Vicente-Rodríguez, G.; Rey-López, J.P.; Ruíz, J.R.; Jiménez-Pavón, D.; Bergman, P.; Ciarapica, D.; Heredia, J.M.; Molnar, D.; Gutierrez, A.; Moreno, L.A.; et al. Interrater reliability and time measurement validity of speed-agility field tests in adolescents. J. Strength Cond. Res. 2011, 25, 2059–2063. [Google Scholar] [CrossRef]
  27. Almuzaini, K.S.; Fleck, S.J. Modification of the Standing Long Jump Test Enhances Ability to Predict Anaerobic Performance. J. Strength Cond. Res. 2008, 22, 1265–1272. [Google Scholar] [CrossRef] [PubMed]
  28. Aoki, K.; Kohmura, Y.; Sakuma, K.; Koshikawa, K.; Naito, H. Relationships between Field Tests of Power and Athletic Performance in Track and Field Athletes Specializing in Power Events. Int. J. Sports Sci. Coach. 2015, 10, 133–144. [Google Scholar] [CrossRef]
  29. Castro-Piñero, J.; Ortega, F.B.; Artero, E.G.; Girela-Rejón, M.J.; Mora, J.; Sjöström, M.; Ruiz, J.R. Assessing Muscular Strength in Youth: Usefulness of Standing Long Jump as a General Index of Muscular Fitness. J. Strength Cond. Res. 2010, 24, 1810–1817. [Google Scholar] [CrossRef]
  30. Ekstrand, L.G.; Battaglini, C.L.; McMurray, R.G.; Shields, E.W. Assessing Explosive Power Production Using the Backward Overhead Shot Throw and the Effects of Morning Resistance Exercise on Afternoon Performance. J. Strength Cond. Res. 2013, 27, 101–106. [Google Scholar] [CrossRef]
  31. Beckham, G.K.; Martin, E.; Layne, D.K.; Luke, R.; Mayhew, J.L. Assessing full body impulsive ability using a range of medicine ball loads for the backward overhead medicine ball throw. Sports Biomech. 2020, 22, 1278–1289. [Google Scholar] [CrossRef]
  32. Mayhew, J.L.; Bird, M.; Cole, M.L.; Koch, A.J.; Jacques, J.A.; Ware, J.S.; Buford, B.N.; Fletcher, K.M. Comparison of the backward overhead medicine ball throw to power production in college football players. J. Strength Cond. Res. 2005, 19, 514–518. [Google Scholar] [PubMed]
  33. Zaras, N.D.; Stasinaki, A.-N.E.; Methenitis, S.K.; Krase, A.A.; Karampatsos, G.P.; Georgiadis, G.V.; Spengos, K.M.; Terzis, G.D. Rate of Force Development, Muscle Architecture, and Performance in Young Competitive Track and Field Throwers. J. Strength Cond. Res. 2016, 30, 81–92. [Google Scholar] [CrossRef] [PubMed]
  34. Rosni, M.H.N.B.M.; Abas, N.G.; Mohamad, N.I. Reliability of overhead medicine ball throw test as a muscular power assessment tool. In Proceedings of the Seminar Penyelidikan Kebangsaan, Perak, Malaysia; 2014. [Google Scholar]
  35. Stockbrugger, B.A.; Haennel, R.G. Validity and Reliability of a Medicine Ball Explosive Power Test. J. Strength Cond. Res. 2001, 15, 431–438. [Google Scholar] [PubMed]
  36. Rumpf, M.C.; Cronin, J.B.; Oliver, J.L.; Hughes, M. Assessing Youth Sprint Ability–Methodological Issues, Reliability and Performance Data. Pediatr. Exerc. Sci. 2011, 23, 442–467. [Google Scholar] [CrossRef] [PubMed]
  37. Pate, R.R.; Burgess, M.L.; Woods, J.A.; Ross, J.G.; Baumgartner, T. Validity of Field Tests of Upper Body Muscular Strength. Res. Q. Exerc. Sport 1993, 64, 17–24. [Google Scholar] [CrossRef] [PubMed]
  38. Tong, T.K.; Wu, S.; Nie, J. Sport-specific endurance plank test for evaluation of global core muscle function. Phys. Ther. Sport Off. J. Assoc. Chart. Physiother. Sports Med. 2014, 15, 58–63. [Google Scholar] [CrossRef] [PubMed]
  39. O’Gorman, D.; Hunter, A.; McDonnacha, C.; Kirwan, J.P. Validity of Field Tests for Evaluating Endurance Capacity in Competitive and International-Level Sports Participants. J. Strength Cond. Res. 2000, 14, 62–67. [Google Scholar] [CrossRef]
  40. Morrow, J.R., Jr.; Mood, D.; Disch, J.; Kang, M. Measurement and Evaluation in Human Performance, 5th ed.; Human Kinetics: Champaign, IL, USA, 2015; p. 347. [Google Scholar]
  41. Bunc, V. A simple method for estimating aerobic fitness. Ergonomics 1994, 37, 159–165. [Google Scholar] [CrossRef]
  42. Karampatsos, G.; Terzis, G.; Georgiadis, G. Muscular strength, neuromuscular activation and performance in discus throwers. J. Phys. Educ. Sport 2011, 11, 369. [Google Scholar]
  43. Bartlett, R.M.; Best, R.J. The biomechanics of javelin throwing: A review. J. Sports Sci. 1988, 6, 1–38. [Google Scholar] [CrossRef]
  44. Castaldi, G.M.; Borzuola, R.; Camomilla, V.; Bergamini, E.; Vannozzi, G.; Macaluso, A. Biomechanics of the Hammer Throw: Narrative Review. Front. Sports Act. Living 2022, 4, 853536. [Google Scholar] [CrossRef] [PubMed]
  45. Royston, P. Approximating the Shapiro-Wilk W-test for non-normality. Stat. Comput. 1992, 2, 117–119. [Google Scholar] [CrossRef]
  46. Hopkins, W.; Marshall, S.; Batterham, A.; Hanin, J. Progressive statistics for studies in sports medicine and exercise science. Med. Sci. Sports Exerc. 2009, 41, 3. [Google Scholar] [CrossRef] [PubMed]
  47. Lindley, D.V. Regression and correlation analysis. In Time Series and Statistics; Eatwell, J., Milgate, M., Newman, P., Eds.; Palgrave Macmillan: London, UK, 1990; pp. 237–243. [Google Scholar]
  48. Granados, A.; Gebremariam, A.; Lee, J.M. Relationship Between Timing of Peak Height Velocity and Pubertal Staging in Boys and Girls. J. Clin. Res. Pediatr. Endocrinol. 2015, 7, 235–237. [Google Scholar] [CrossRef] [PubMed]
  49. Takai, Y.; Nakatani, M.; Aoki, T.; Komori, D.; Oyamada, K.; Murata, K.; Fujita, E.; Akamine, T.; Urita, Y.; Yamamoto, M.; et al. Body shape indices are predictors for estimating fat-free mass in male athletes. PLoS ONE 2018, 13, e0189836. [Google Scholar] [CrossRef] [PubMed]
  50. Fernandez-Fernandez, J.; Canós-Portalés, J.; Martínez-Gallego, R.; Corbi, F.; Baiget, E. Effects of different maturity status on change of direction performance of youth tennis players. Biol. Sport 2023, 40, 867–876. [Google Scholar] [CrossRef] [PubMed]
  51. Hammami, R.; Chaouachi, A.; Makhlouf, I.; Granacher, U.; Behm, D.G. Associations Between Balance and Muscle Strength, Power Performance in Male Youth Athletes of Different Maturity Status. Pediatr. Exerc. Sci. 2016, 28, 521–534. [Google Scholar] [CrossRef]
  52. Terzis, G.; Kyriazis, T.; Karampatsos, G.; Georgiadis, G. Muscle strength, body composition, and performance of an elite shot-putter. Int. J. Sports Physiol. Perform. 2012, 7, 394–396. [Google Scholar] [CrossRef]
  53. Morriss, C.; Bartlett, R. Biomechanical factors critical for performance in the men’s javelin throw. Sports Med. 1996, 21, 438–446. [Google Scholar] [CrossRef]
  54. Slawinski, J.; Bonnefoy, A.; Levêque, J.M.; Ontanon, G.; Riquet, A.; Dumas, R.; Chèze, L. Kinematic and kinetic comparisons of elite and well-trained sprinters during sprint start. J. Strength Cond. Res. 2010, 24, 896–905. [Google Scholar] [CrossRef]
  55. Gäbler, M.; Prieske, O.; Hortobágyi, T.; Granacher, U. The Effects of Concurrent Strength and Endurance Training on Physical Fitness and Athletic Performance in Youth: A Systematic Review and Meta-Analysis. Front. Physiol. 2018, 9, 1057. [Google Scholar] [CrossRef]
  56. Barth, M.; Güllich, A.; Macnamara, B.N.; Hambrick, D.Z. Predictors of Junior Versus Senior Elite Performance are Opposite: A Systematic Review and Meta-Analysis of Participation Patterns. Sports Med. 2022, 52, 1399–1416. [Google Scholar] [CrossRef]
  57. Brustio, P.R.; Kearney, P.E.; Lupo, C.; Ungureanu, A.N.; Mulasso, A.; Rainoldi, A.; Boccia, G. Relative Age Influences Performance of World-Class Track and Field Athletes Even in the Adulthood. Front. Psychol. 2019, 10, 1395. [Google Scholar] [CrossRef]
  58. de Almeida-Neto, P.F.; Gama de Matos, D.; Monteiro Pinto, V.C.; Monteiro Monte Oliveira, V.; da Silva Cunha de Medeiros, R.C.; Jeffreys, I.; Moreira Silva Dantas, P.; Aidar, F.J.; de Araújo Tinoco Cabral, B.G. Biological age, testosterone, and estradiol as discriminating factors of muscle strength levels in young athletes. J. Sports Med. Phys. Fit. 2022, 62, 122–130. [Google Scholar] [CrossRef]
Figure 1. Experimental design.
Applsci 13 10118 g001
Figure 2. Differences of specific throwing performance for adolescent throwers * p < 0.05; ** p < 0.01.
Applsci 13 10118 g002
Figure 3. Correlations between anthropometric measurements and physical fitness performance: (a) Boys; (b) Girls. * p < 0.05; ** p < 0.01.
Applsci 13 10118 g003
Figure 4. Correlations among specific throwing strength, anthropometric measurements and physical fitness performance: (a) Shot put; (b) Javelin; (c) Discus; (d) Hammer. * p < 0.05; ** p < 0.01.
Applsci 13 10118 g004
Table 1. Weight of throwing equipment.
TestUnder 16 YearsUnder 18 Years
MaleFemaleMaleFemale
FOMB4 kg3 kg5 kg3 kg
BOST4 kg3 kg5 kg3 kg
Shot put4 kg3 kg5 kg3 kg
Discus throw1 kg1 kg1.5 kg1 kg
Javelin throw600 g500 g700 g500 g
Hammer throw4 kg3 kg5 kg3 kg
Table 2. Descriptive statistics and comparisons of anthropometric, physical fitness measurements for adolescent throwers.
VariableSex14–15 Years (n = 81)Statistical Hypothesis Testing15–16 Years (n = 76)Statistical Hypothesis Testing16–17 Years (n = 59)Statistical Hypothesis Testing17–18 Years (n = 31)Statistical Hypothesis Testingp-Value 1p-Value 2
MSDMedianMSDMedianMSDMedianMSDMedian
Height (cm)Boys179.326.54180.006.07a **182.706.32182.006.99a **183.367.97183.005.18a **181.444.24183.004.04a ** 0.038
Girls171.235.39172.00171.527.01171.00171.577.04174.00173.955.56174.250.550
Body mass (kg)Boys79.4815.8875.002.03a *92.0119.2690.00−4.14b **89.5517.9789.502.03a *86.8015.4383.00−1.09b0.002
Girls72.7613.8070.0072.7212.8670.0079.8316.8385.0080.0516.7875.000.261
BMI (kg·m−2)Boys24.264.4123.35−0.54a26.944.3227.002.24a *26.924.3227.750.94a25.116.7625.50−0.95a 0.025
Girls24.804.4724.0024.703.5323.5025.774.7023.8027.254.7527.40 0.305
Sit and reach test (cm)Boys17.185.5118.00−3.25b **18.555.3818.00−2.83b **19.687.2120.05−1.47b20.784.0820.05−1.03b0.035
Girls20.713.6321.0021.044.6020.0022.574.4224.0021.506.7825.000.288
Hexagon agility test (s)Boys14.801.4314.90−0.69b14.221.5614.00−1.58a13.481.8213.25−0.96b12.691.1512.50−3.57b **<0.01
Girls14.971.9815.0014.892.0614.7013.862.6113.5014.431.3414.150.017
Standing long jump (m)Boys2.490.222.50−4.52b **2.570.212.60−4.46b **2.610.262.66−4.53b **2.640.182.69−3.77b **0.012
Girls2.230.272.302.290.222.302.190.322.302.270.262.270.802
Standing triple jump (m)Boys7.330.707.50−5.61b **7.580.647.657.34a **7.790.797.95−4.77b **7.880.788.10−3.04b **<0.01
Girls6.350.546.366.490.536.506.500.936.826.590.776.590.188
Forward overhead medicine ball throw (m)Boys12.732.0212.86−2.52b **14.131.8714.00−4.02b **13.212.2913.622.70a **13.801.9113.691.75a0.002
Girls11.911.5412.2512.261.6012.4511.671.6611.5812.451.4012.900.137
Backward overhead shot put throw (m)Boys15.323.2915.15−3.43b **16.592.3416.854.91a **15.363.9016.001.70b15.571.9215.30−0.69b 0.152
Girls13.302.2313.0013.702.5414.0013.872.3813.8414.602.4114.60 0.396
30 m sprint (s)Boys4.410.384.40−4.02a **4.320.284.30−5.04b **4.340.364.27−4.66a **4.230.314.20−3.41b ** 0.304
Girls4.810.504.804.870.434.904.850.444.754.720.414.620.513
60 m sprint (s)Boys8.160.688.00−5.15b **8.080.598.00−6.23a **8.030.648.07−3.87b **7.790.657.64−3.32b **0.116
Girls9.010.758.809.000.968.899.301.318.908.950.908.670.891
Pull up (reps)Boys8.555.238.001.89a9.246.069.00−2.19b **8.895.2310.001.75a11.339.0810.00−2.05b *0.856
Girls6.514.426.006.284.886.006.484.737.006.004.825.000.973
Plank test (s)Boys145.9059.15161.500.51a157.3348.71165.001.38a157.3499.96148.00−2.20b **175.3360.77180.000.82a0.198
Girls139.9843.65130.00141.0446.65138.00185.6275.05180.00154.9280.91154.000.041
2000 m run (min)Boys9.831.459.50−3.65b **9.881.4210.00−2.76a **9.641.2110.04−3.43a **9.711.9210.00−2.09b **0.257
Girls11.121.3811.3010.901.6311.3410.971.7411.0810.961.1611.120.858
Italics number with a are t values for independent samples t-test and Italics number with b are Z values for the Mann-Whitney U test; Legend: * p < 0.05; ** p < 0.01. 1 Kruskal–Wallis H Test; 2 ANOVA Test.
Table 3. Test variables and predictive equations.
Test Variables and EquationsRR2Adjusted
R2
SEEp
Distance of javelin throw in power-position = 0.929 + (1.401 × Age) + (0.162 × Body mass) + (6.059 × Standing long jump) + (0.836 × BOST) + (−2.129 × 60 m sprint) + (−0.936 × 2000 m run)0.7970.6340.6114.780p = 0.030
Distance of shot put in power-position = 8.608 + (−1.514 × Gender) + (0.386 × BOST) + (0.09 × Plank test)0.8610.7410.7321.092p < 0.01
Distance of discus throw in power-position = 23.486 + (−6.968 × Gender) + (1.065 × BOST) + (0.671 × FOMB)0.8950.8010.7842.942p = 0.040
Distance of hammer throw in power-position = −83.937 + (6.454 × Age) + (−2.223 × hexagon agility test) + (11.015 × 30 m sprint)0.7150.5110.4298.705p = 0.048
Distance of javelin throw in power-position = 0.929 + (1.401 × Age) + (0.162 × Body mass) + (6.059 × Standing long jump) + (0.836 × BOST) + (−2.129 × 60 m sprint) + (−0.936 × 2000 m run)0.7970.6340.6114.780p = 0.030
R = coefficient of correlation value; R2 = coefficient of determination value; SEE = Standard Error of Estimate; p = significance level.
Disclaimer/Publisher’s Note: The statements, opinions and data contained in all publications are solely those of the individual author(s) and contributor(s) and not of MDPI and/or the editor(s). MDPI and/or the editor(s) disclaim responsibility for any injury to people or property resulting from any ideas, methods, instructions or products referred to in the content.

