Article

A Study of the Relationship between Dipole Noise Sources and the Flow Field Parameters around the Rearview Mirror of Passenger Cars

1
State Key Laboratory of Vehicle NVH and Safety Technology, Chongqing 401120, China
2
Changan Automobile Engineering Research Institute, Chongqing 401120, China
3
Hubei Key Laboratory of Modern Auto Parts Technology, Wuhan University of Technology, Wuhan 430070, China
*
Author to whom correspondence should be addressed.
Appl. Sci. 2023, 13(19), 10651; https://doi.org/10.3390/app131910651
Submission received: 18 August 2023 / Revised: 21 September 2023 / Accepted: 22 September 2023 / Published: 25 September 2023
(This article belongs to the Section Acoustics and Vibrations)

Abstract

:
When air flows through the mirrors, A-pillars, and other surfaces of a passenger car, airflow separation occurs to generate vorticity and generates aerodynamic noise. The dipole noise source is the main source of aerodynamic noise when the passenger car is travelling at high speed. In order to reveal the relationship between the physical quantities in the flow field and the intensity of the dipole noise source, this paper equates each dipole noise source to a sphere radiating noise to the outside. The acoustic wave fluctuation equations expressed as spherical coordinates are combined with the acoustic boundary conditions and the equations of motion of an ideal fluid medium to obtain the relationship between the intensity of the dipole noise source and the flow velocity and vorticity in the flow field. Then, through flow field simulation, we establish a method of identifying the dipole noise source and its distribution area, and analyze the generation mechanism of the dipole noise source. Through the analysis, it is concluded that the dipole noise sources are mainly concentrated in the airflow separation areas, which easily generate vortices. The size of the vorticity is the key factor affecting the intensity of the dipole noise source. When the intensity of the dipole noise source reaches its peak, the direction of the flow vorticity is perpendicular to the direction of the flow velocity and the peak of the flow velocity occurs before the peak of the dipole noise source, which indicates that the angle between the flow vorticity and the flow velocity, as well as the flow velocity, also has a certain effect on the generation of the dipole noise source.

1. Introduction

With the rapid development of new energy vehicles, people not only have higher requirements for the safety and power of vehicles, but also have certain requirements for the comfort of vehicles. Research shows that when the driving speed of a vehicle reaches 100 km/h, the noise in the passenger compartment is mainly aerodynamic noise [1,2]. When the vehicle is running at high speed, the vehicle body surface and air interact with each other, and an aerodynamic noise source is generated in the near-wall turbulence zone near the vehicle body and radiates noise to the surroundings. In all parts of the vehicle, the noise source in the rearview mirror and A-pillar area are the main source of aerodynamic noise in the vehicle [3]. Therefore, it is of great significance to study the aerodynamic noise source in the rearview mirror area.
Recently, research on aerodynamic noise has made great progress. For the study of aerodynamic noise in the rearview mirror area, numerical simulation is mainly used to explain the cause of aerodynamic noise according to the flow separation phenomenon and pressure pulsation in the flow field, and then the aerodynamic noise can be controlled by controlling the local structure of the rearview mirror. Mutnri, F., et al. [4] studied the influence of different installation positions of the rearview mirror on the aerodynamic noise in the vehicle, and concluded that the aerodynamic noise in the vehicle is relatively small when the rearview mirror is installed in the door position. Chen, F., et al. [5,6] studied the influence of the rearview mirror cover edge and different rearview mirror shapes on aerodynamic noise, and found that the construction of grooves on the rearview mirror cover edge had a significant impact on the structure and position of the vorticity at the rear of the rearview mirror; the research revealed the law of the influence of different rearview mirror shapes on the flow field. Li, F., et al. [7] studied the influence of three shape parameters and two installation angle parameters of the rearview mirror on the aerodynamic noise and reported that the windward angle of the rearview mirror, the length of the bracket, and the thickness in front of the rearview mirror are the key structures affecting the aerodynamic noise. In terms of aerodynamic noise source, Wang, F., et al. [8] established the relationship between the radiated sound pressure of a dipole sound source and the pressure gradient in the flow field according to the relationship between the radiated sound pressure in the flow field and the pulsating pressure and the pressure gradient in the flow field, and established an identification method for sound source in the flow field. Chen, F., et al. [9] simulated the aerodynamic noise of a high-speed magnetic levitation train based on the Lighthill acoustic analogy theory using finite element analysis, showing that the aerodynamic noise of high-speed magnetic levitation train is a kind of broadband noise, and the noise source is mainly distributed in the areas of airflow separation and turbulence intensity such as the head car and the tail car’s streamlined shoulder. Yang, F., et al. [10] calculated the main sources of aerodynamic noise of a high-temperature superconducting magnetic levitation train based on large-vortex simulation and the K-FWH equation. It was shown that the dipole sound sources were mainly distributed on both sides of the roof surface of the middle car, the tail streamer, and behind the superconducting coil. Quadrupole sound sources made significant contributions in the tail flow area, and the energy share of quadrupole sound sources increased with the increase of speed. Wu, F., et al. [11] considered a high-speed magnetic levitation train as a research object to study the spatial distribution characteristics of aerodynamic noise sources at different speeds. The study showed that the tail car streamlined area was mainly dominated by dipole noise, while the tail flow area was dominated by quadrupole noise; the contribution of radiated energy from quadrupole sound sources in the tail flow area increased with the increase of vehicle speed. He, F., et al. [12] used Curle sound source on the body surface as the optimization target and used the discrete concomitant method to identify the sensitivity, and finally identified the region with high sensitivity to the noise source on the body surface and structurally optimized that region. Li, F., et al. [13] proposed a method to predict quickly the far-field aerodynamic noise of a full-model high-speed train through the numerical calculation results of a half-model. At present, the aerodynamic noise of an automobile is predicted through the change of physical quantity in the flow field. For the complex flow in the side window area, it is difficult to establish the relationship between the noise and the physical quantity of the flow field, and the noise source cannot be accurately identified, so the research on aerodynamic noise around the side window area lacks corresponding theoretical guidance.
Since the travelling speed of the car is of low Mach (Ma < 0.3), according to the FW-H equation [14], the influence of unipolar and quadrupolar noise sources on the aerodynamic noise of the car can be neglected. This paper focuses on the automotive aerodynamic noise dominated by dipole noise sources. A dipole noise source is formed by the unstable reaction force between the fluid and the object when there is an obstacle in the fluid, so the dipole noise source is a force sound source. The force sound source is the main cause of vibration at the car window and is also the main component of the aerodynamic noise source. By establishing the relationship between the intensity of the dipole noise source and the physical quantity of the flow field, the identification method of the dipole noise source in the rearview mirror region of the car can be obtained. The distribution and radiation intensity of the dipole noise source in the automotive rearview mirror region were obtained by this method, providing theoretical guidance for the subsequent optimization of the mirror structure and in-depth understanding and control of automotive aerodynamic noise.

2. Theoretical Basis of Aerodynamic Noise

The generation and propagation of aerodynamic noise can be controlled by the FW-H equation [10], as shown in Equation (1):
2 t 2 c 0 2 2 ρ = t ρ 0 u i f x i δ f x i ρ v i v j + P i j f x i + 2 τ i j x i x j
where u i , v i , and v j are the velocity component; ρ is the density change of air; c 0 is the speed of sound; P i j is the compressive stress tensor; τ i j is the viscous stress tensor; δ f is the δ function; f is the volume force acting on air.
Although the above FW-H equation can reflect the relationship between the sound field and the flow field, it cannot reveal the mechanism of aerodynamic noise generation and the form of interaction between turbulence and acoustic waves. Therefore, based on the above equation, Powell [14] introduced the concept of vorticity to obtain the relationship between the vorticity and the sound field, as shown in Equation (2):
2 ρ 0 t 2 c 0 2 2 ρ 0 = ρ 0 ω × u u ρ 0 t u 2 2 p 0 + p 0 ρ 0 c 0 2 + ρ 0 u 2 2
where ω is the flow vorticity; u is the flow velocity.
Since the influence of monopole and quadrupole sources can be ignored at low Mach numbers, the vorticity Equation (2) can therefore be simplified as:
2 p 1 c 0 2 2 ρ 0 t 2 = ρ 0 ω × u
In the equation, the left side is the noise propagation term, and the right side is the dipole noise term. Based on the above equation, the relationship between the intensity of dipole source and flow vorticity, flow velocity, and the relationship between the angle of flow vorticity and flow velocity can be obtained. The smaller the flow vorticity and flow velocity and the angle between two, the lower intensity of dipole source.
When only the dipole aerodynamic noise source is considered, Equation (4) can be obtained according to the inhomogeneous acoustic wave fluctuation equation [15]:
2 p 1 c 0 2 2 ρ 0 t 2 = · F
where F is the force source.
The acoustic wave fluctuation equation in the form of spherical coordinates can be written as [11]:
1 c 0 2 2 p t 2 1 r 2 r r 2 p r 1 r 2 sin 2 φ 2 p θ 2 1 r 2 sin 2 φ φ sin φ p φ = 0
where p is sound pressure; c 0 is the sound velocity; t is the gas propagation time, r is the gas propagation distance; φ   and   θ are the polar and azimuth angles in the polar coordinate system, respectively.
Wang [16] uses the acoustic wave equation in the form of spherical coordinates and combines the acoustic boundary conditions to obtain the solution of sound pressure p in the form of spherical coordinates:
p r , φ , t = i ρ 0 ω a 3 v A r 2 1 + i k r 2 ( k a ) 2 + i 2 k a     cos φ     e x p   [ i ω t k r a ]
According to the equilibrium of forces, it is known that the force of sound pressure acting on the spherical source should be equal to the size of the external force, so the integration of the source surface sound pressure combined with Equation (6) can be obtained from Equation (7):
F = S p a , φ , t cos φ d s = 0 2 π d θ 0 π p a , φ , t a 2 sin φ cos φ d φ = i 4 π 3     ρ 0 ω a 3 v A     1 + ( k a ) 2 4 + ( k a ) 4     e x p i ω t + arctan ( k a ) arctan 2 k a 2 ( k a ) 2
The relationship between p and F can be obtained by combining Equations (6) and (7) as:
p r , φ , t = 3 cos φ 4 π r 2     1 + ( k r ) 2 1 + ( k a ) 2     F     e x p   [ i k a r + arctan ( k r arctan ( k a ) ) ]
According to the equation of motion of an ideal fluid medium [15], the sound pressure p and the normal velocity u r are related as follows:
ρ 0 u r t = p r
By combining Equations (8) and (9), the following equation can be obtained:
u r r , φ , t = i 3 cos φ 4 π r 3 ρ 0 ω     4 + ( k r ) 4 1 + ( k a ) 2     F     e x p i k r a + arctan 2 k r 2 ( k r ) 2 arctan ( k a )
The sound intensity in a flow field represents the rate of energy flow perpendicular to the direction of sound propagation through a unit area, and is usually expressed as the time average of the real part of the product of the acoustic pressure p and the normal velocity u r [17], so that the acoustic intensity of the normal velocity is calculated as shown in Equation (11):
I r = 1 T 0 T Re p Re u d t = 9 cos 2 φ ω 2 16 π 2 r 7 ρ 0 c 0 3   ·   1 1 + k a 2   ·   F 2
Since sound intensity is a vector quantity, it possesses directionality during the propagation process. In sound propagation, two opposite directions of sound intensity would cancel each other out, which sometimes leads to an invalid calculation of sound intensity. Therefore, current research describes sound radiant intensity using sound power. Sound power represents the sound energy radiated by a noise source from the inside to the outside in a unit of time. Its calculation can involve the spherical integral of sound intensity along the radius of sound source propagation. Hence, the calculation of sound intensity for a sound source can be formulated as follows:
ε ¯ = 0 2 π d θ 0 π I r r 2 sin φ d φ = 3 ω 2 4 π ρ 0 c 0 3 ·     1 1 + ( k a ) 2   ·   F 2 = 3 ω 2 4 π ρ 0 c 0 3     · 1 1 + ( k a ) 2 ·   ρ 0 ω × u 2
Equation (12) shows the relationship between the intensity of the dipole noise source and the physical quantities such as vorticity and velocity in the flow field, which provides a theoretical basis for identifying the dipole noise source in the flow field.

3. Numerical Simulation

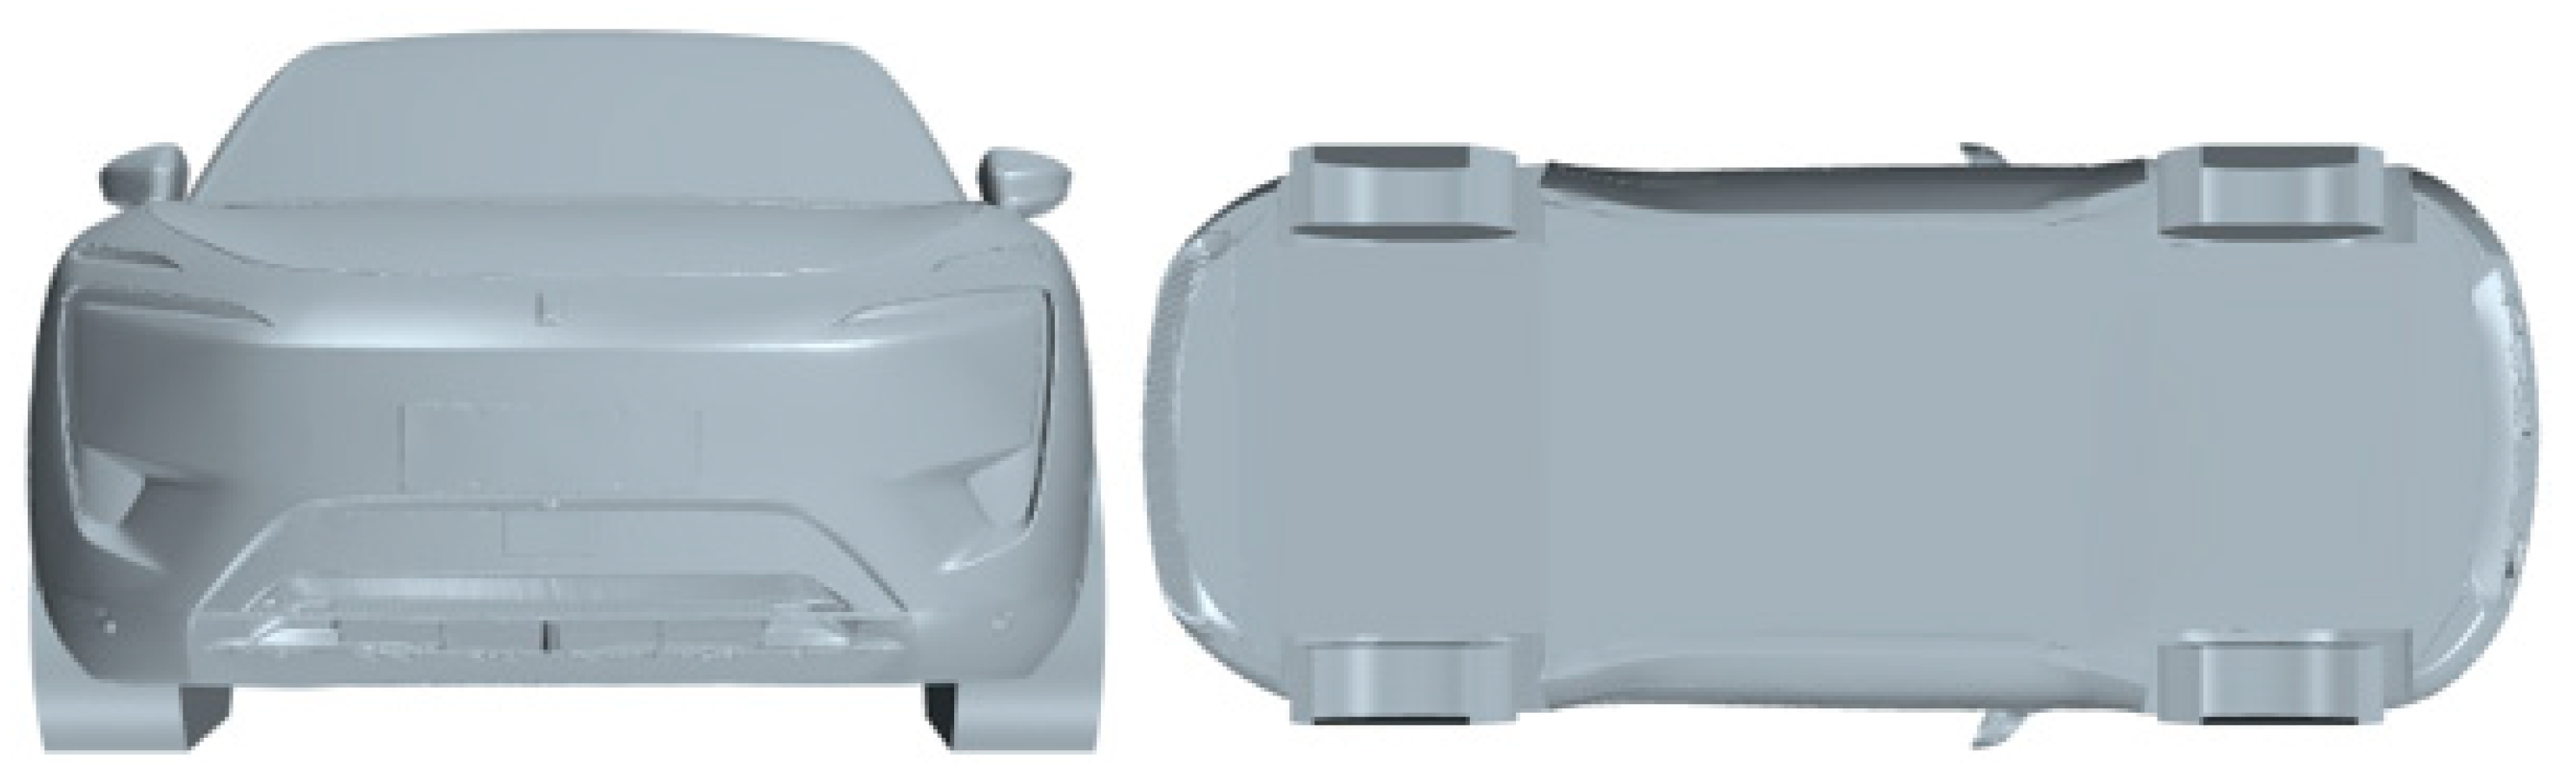
3.1. Geometric Model and Computational Domain

This paper takes a pure electric SUV as the research object. The length, width, and height of the car are 4.88 m × 1.97 m × 1.6 m. In order to improve the efficiency of the simulation calculation, the surface of the car was simplified to feature a closed chassis and air intake grille (see Figure 1).
In order to ensure the accuracy of the flow field computation under the premise of minimizing the calculation time, with reference to the size of the modern automotive wind-tunnel test section [18], the computational domain was set with the distance from the air inlet to the front end of the vehicle as three times the length of the car, the distance from the air outlet to the rear end of the car as eight times the length of the vehicle, the distance from the upper and lower wall surfaces as seven times the height of the vehicle, the distance from the left and right sides of the model to the wall surfaces as three times the width of the vehicle, as shown in Figure 2.

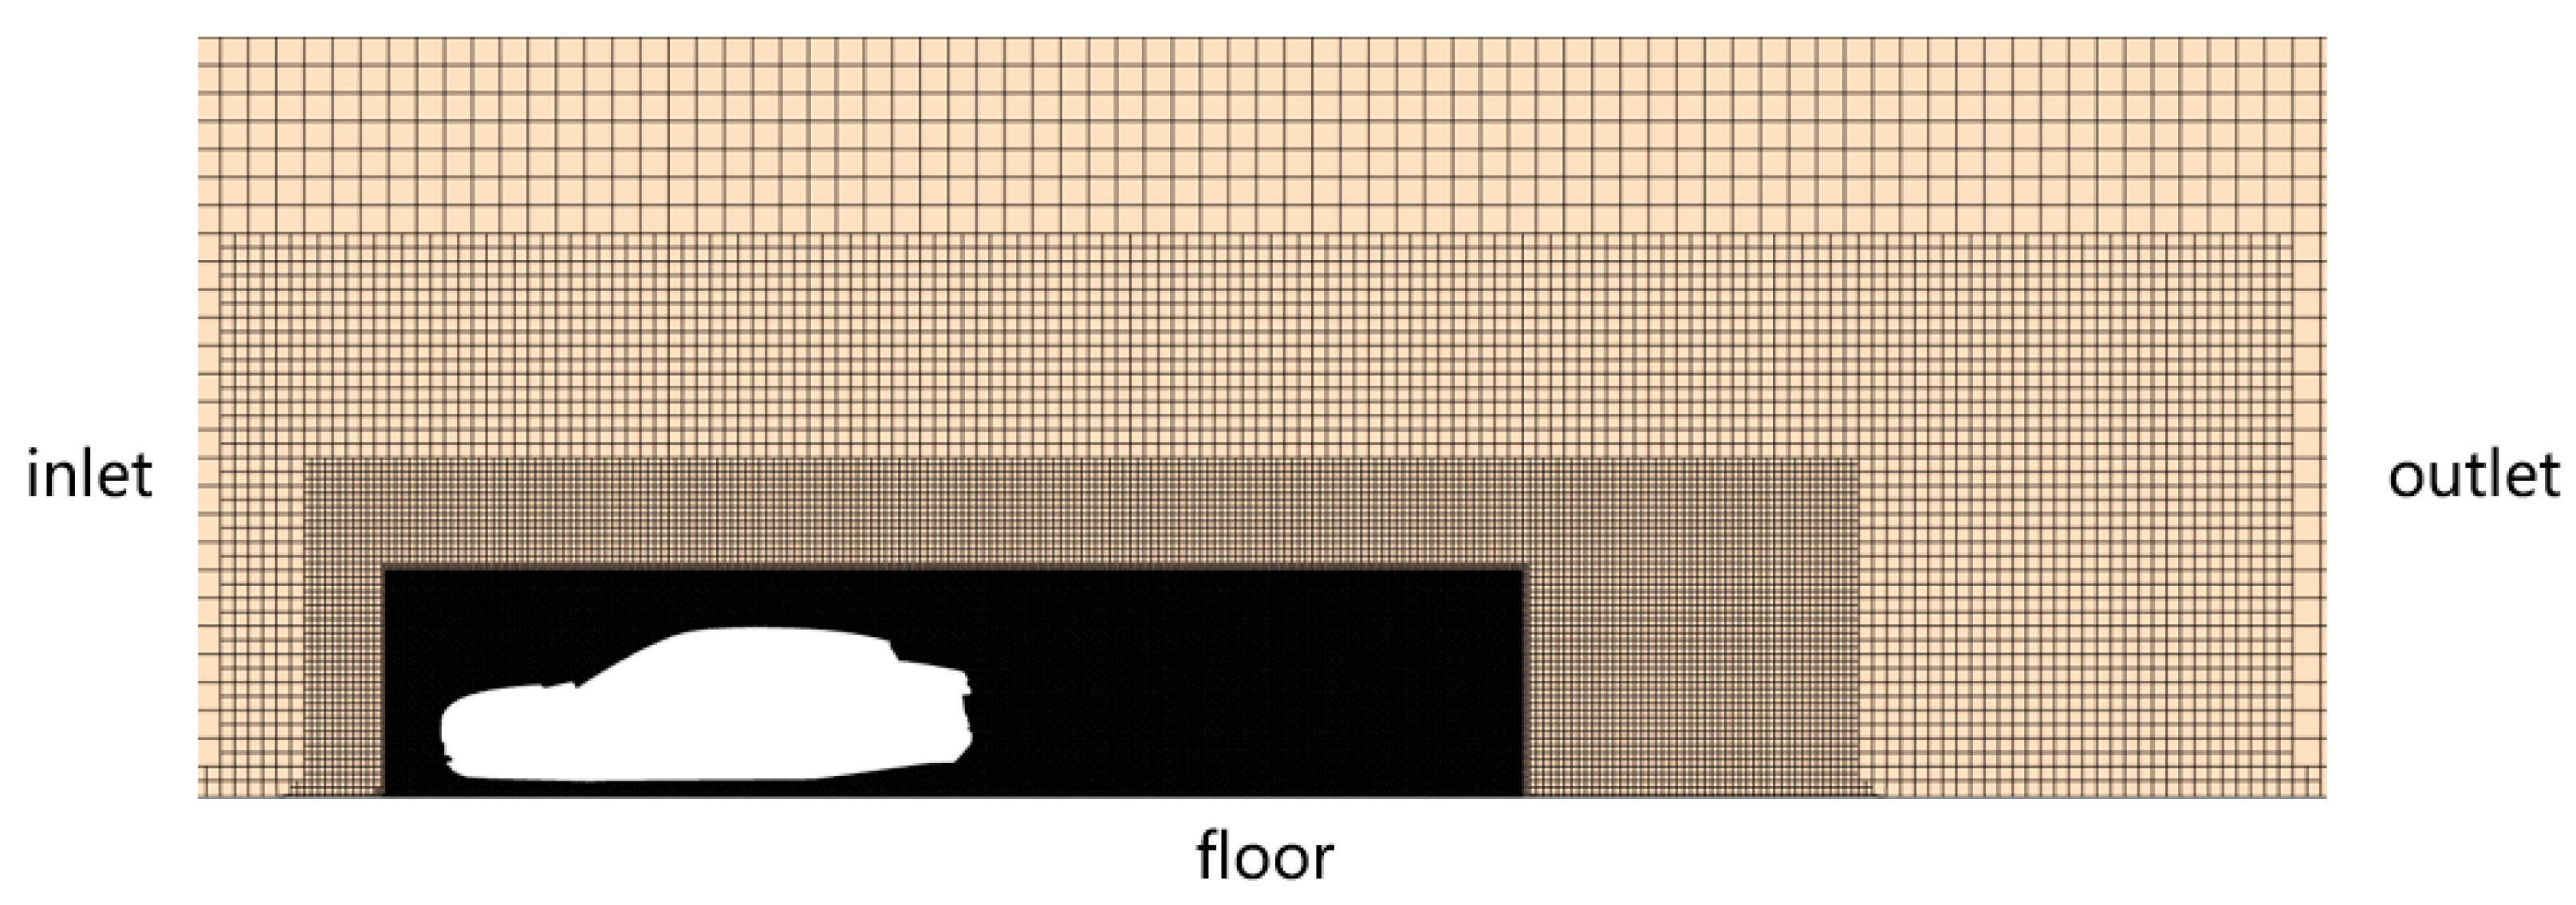
3.2. Mesh Generation

Due to the complex geometry of the rearview mirror, a triangular surface mesh can simulate the complex 3D model more accurately than other meshes [19], so a triangular surface mesh was used for the flow field calculation. In order to ensure the accuracy of the model, the surface mesh was encrypted at the mirrors with a mesh size of 1 mm, the mesh size of the rest of the body was 1–16 mm, and the mesh size of the computational domain was 512 mm. In order to ensure that the Y+ value met the requirements (Y+ < 1) of the large eddy simulation (LES), the volumetric mesh was generated with eight layers of prisms, with a prism layer extension of 1.5, and the total thickness of the prism layers was 0.6 mm. The cloud of Y+ values on the surface of the rearview mirror is shown in Figure 3. Meanwhile, in order to correctly capture the flow information around the vehicle model, three encrypted domains were set up around the model, with sizes of 16 mm, 64 mm, and 128 mm, respectively. The final mesh size was 32 million. The mesh profile is shown in Figure 4.
Large eddy simulation divides turbulence into eddies of different sizes. Where larger scale eddies are solved by direct numerical simulation and smaller scale eddies are solved by a generic model, large eddy simulation can simulate turbulent flow well. There are two important aspects to realizing a large eddy simulation:
(1)
The development of a mathematical filtering model to decompose the equations describing large eddies by filtering out eddies with scales smaller than the scale of the filter function from the turbulent instantaneous equations of motion.
(2)
Considering the effect of the filtered out small eddies on the large eddies. This is captured by introducing an additional stress term in the equations of motion for the large vortex flow field, which is referred to as subgrid-scale stress. This mathematical model is called the subgrid-scale model (SGS model).
The N-S equation for the instantaneous state and the continuum equation are handled by the filter function:
t ρ u ¯ i + x j ρ u ¯ u ¯ j = p ¯ x i + x j μ u ¯ i x j τ i j x j
ρ t + x i ρ u ¯ i = 0
The two equations above are the set of control equations used for the large eddy simulation, with the quantities with an overline being the filtered field variables. τ i j = ρ u i ¯ u ¯ j ρ u i u j ¯ ¯ is a subgrid scale stress. The force reflects the effect of small-scale vortex motion on the solved equations of motion.
A commonly used subgrid model is the Smargorinsky model. Assuming that the small-scale pulsations filtered out with isotropic filters are locally balanced, i.e., the energy transfer from the solvable scale terms of the unsolvable scale pulsations is equal to the turbulent energy dissipation, Smargorinsky’s sublattice Reynolds stress model can be used:
τ ¯ i j = u i ¯ u j ¯ u i u j ¯ = 2 C s Δ 2 S ¯ i j S ¯ i j S ¯ i j 1 / 2 1 3 τ ¯ k k δ i j
where Δ is the filtering scale. This simple sub-lattice stress model is called the Smargorinsky model. Sublattice vortex viscosity factor v t = C s Δ 2 S ¯ i j S ¯ i j 1 / 2 ; C s Δ is the mixing length; C s is the Smagorinsky constant; C s = 0.18 .

3.3. Boundary Conditions

The flow field computation was carried out using Star-ccm+. The velocity boundary was imposed at the inlet of computational domain with the velocity at 120 km/h, the pressure boundary was imposed at the outlet of the computational domain with the pressure at 0 Pa, the selection of specific boundary conditions was as shown in Table 1. In order to ensure a good convergence, a steady-state calculation using the RANS turbulence model was carried out. The unsteady flow field computation was carried out by the large eddy simulation with time step of is 1 × 10 4 s. The total solution time was 0.5 s.

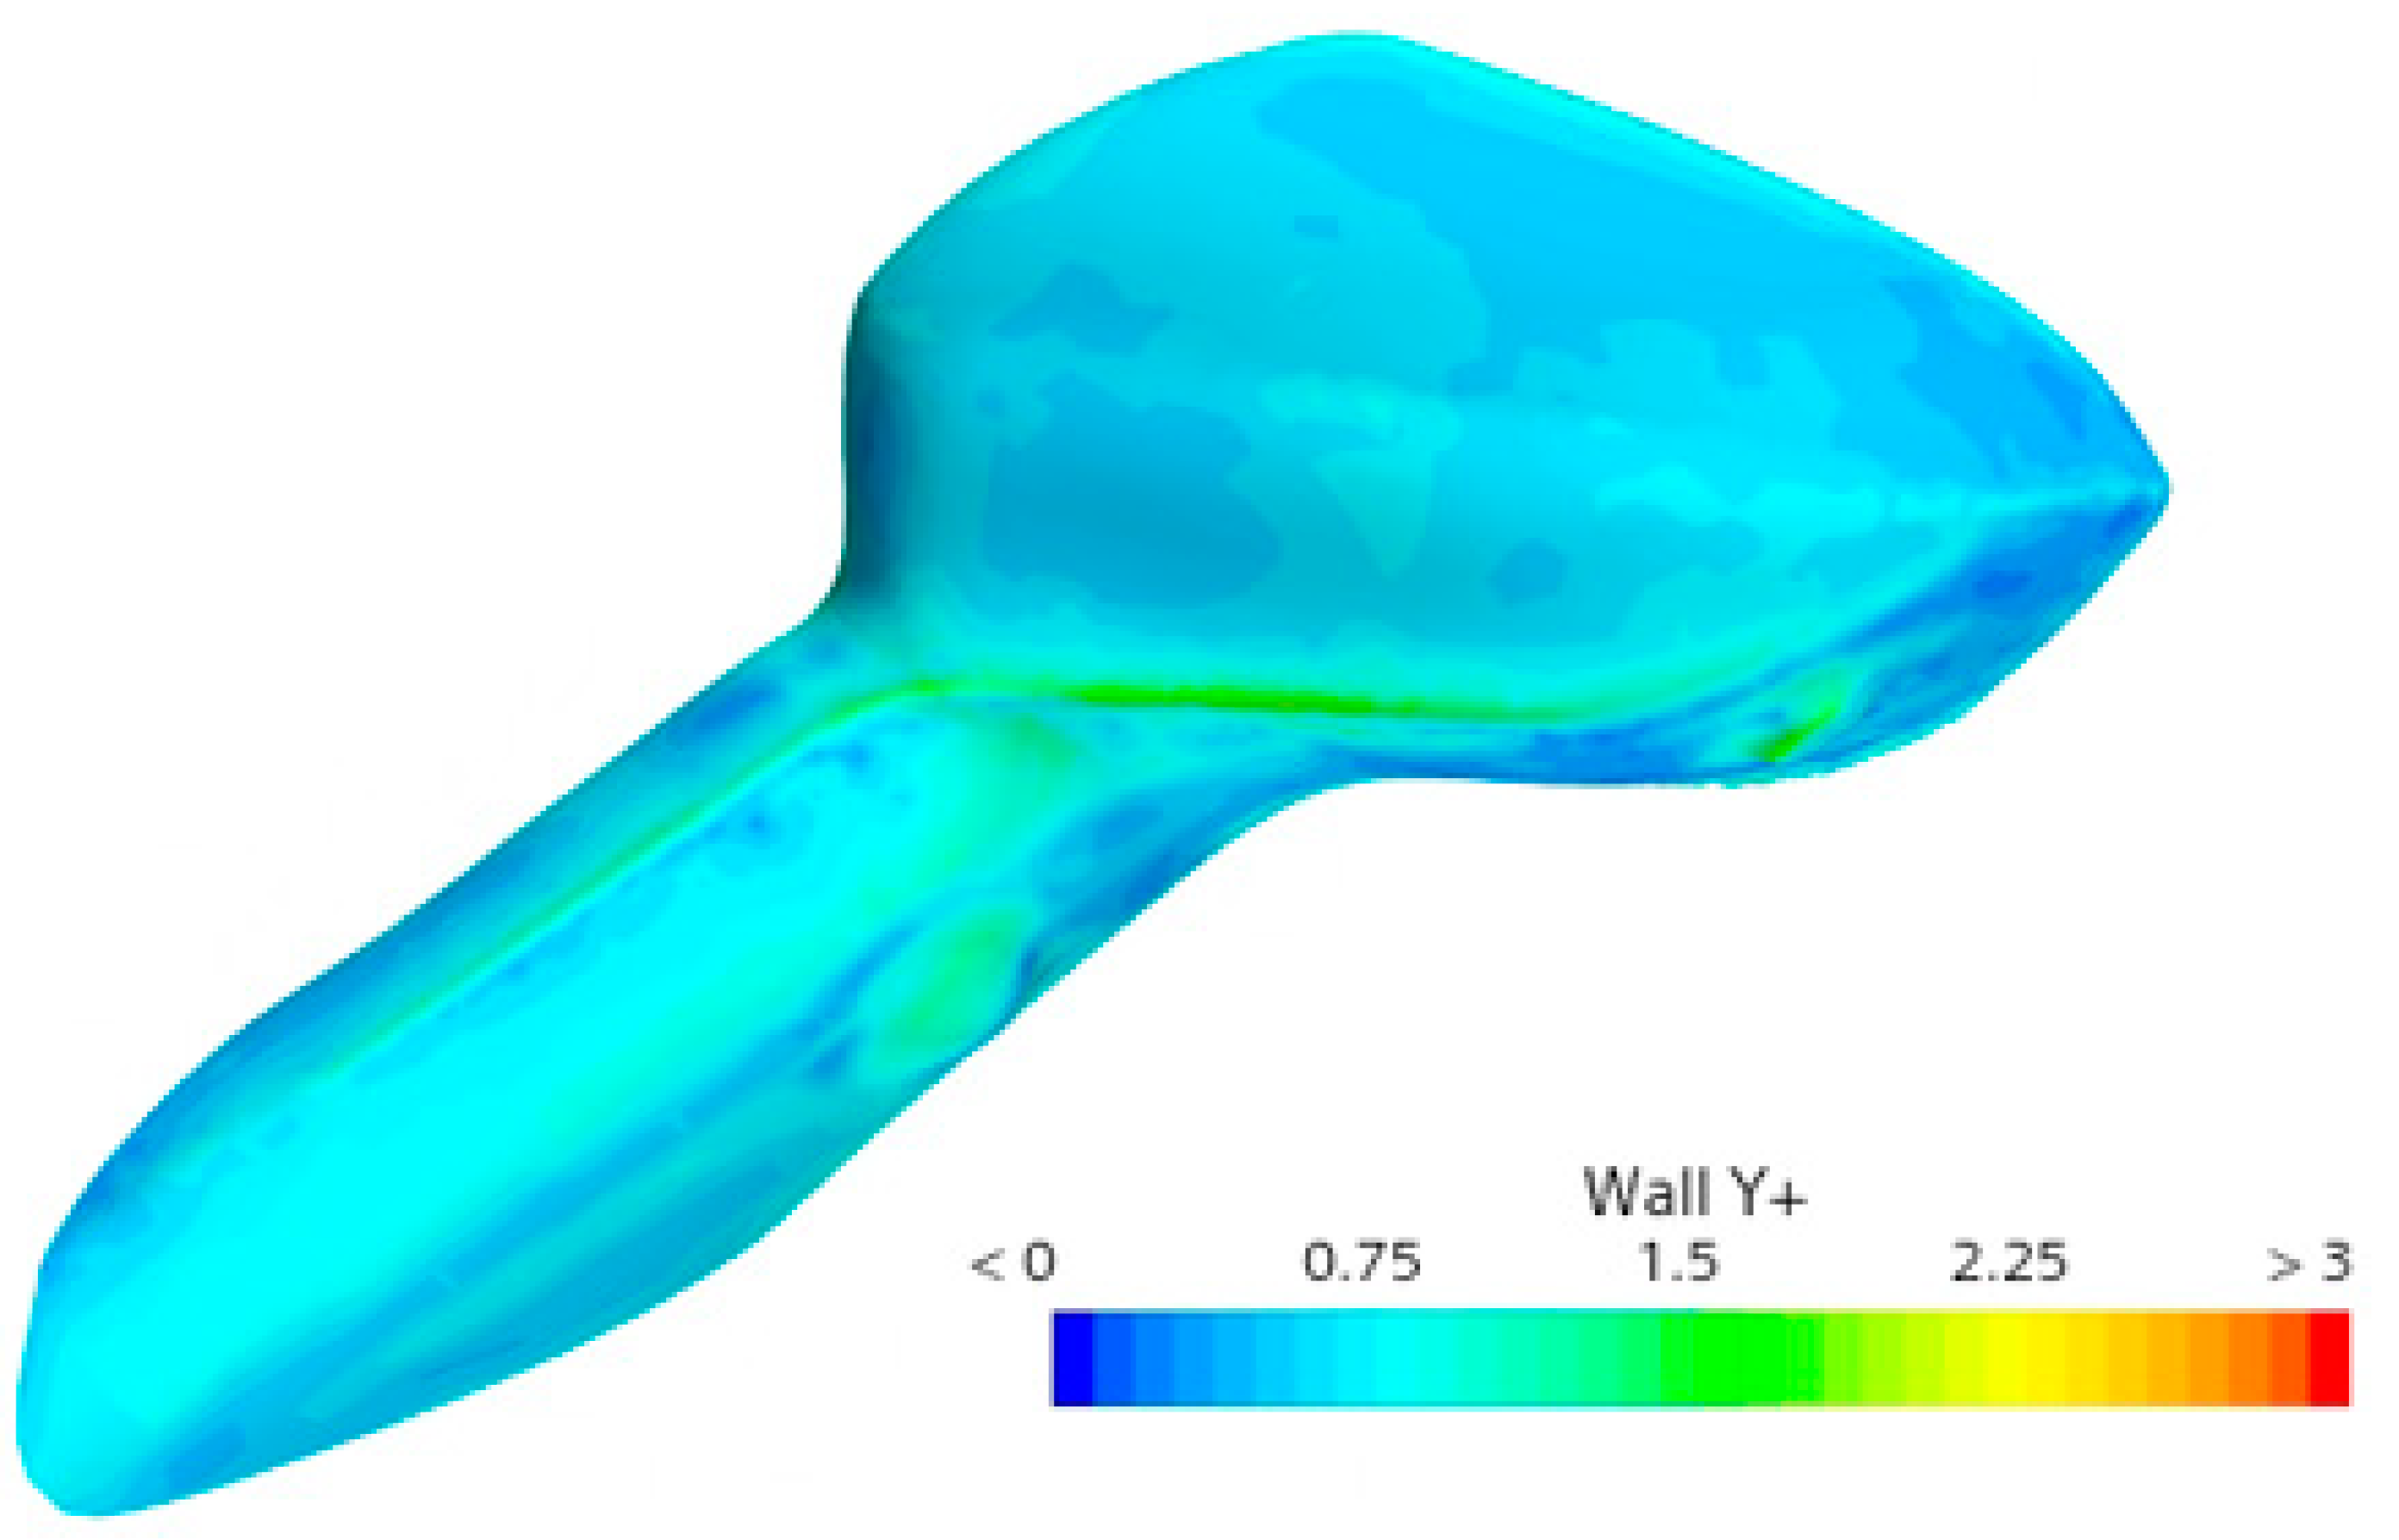
3.4. Grid-Independent Verification

The automobile air resistance coefficient C D was used as a reference standard to verify the mesh irrelevance, and five mesh schemes were set up. Examples of different grid number pairs are shown in Table 2.
According to the data in Table 2, it can be seen that when the number of grids reaches 32 million, the error of wind resistance coefficient is 1.95%, which meets the requirements of calculation accuracy.

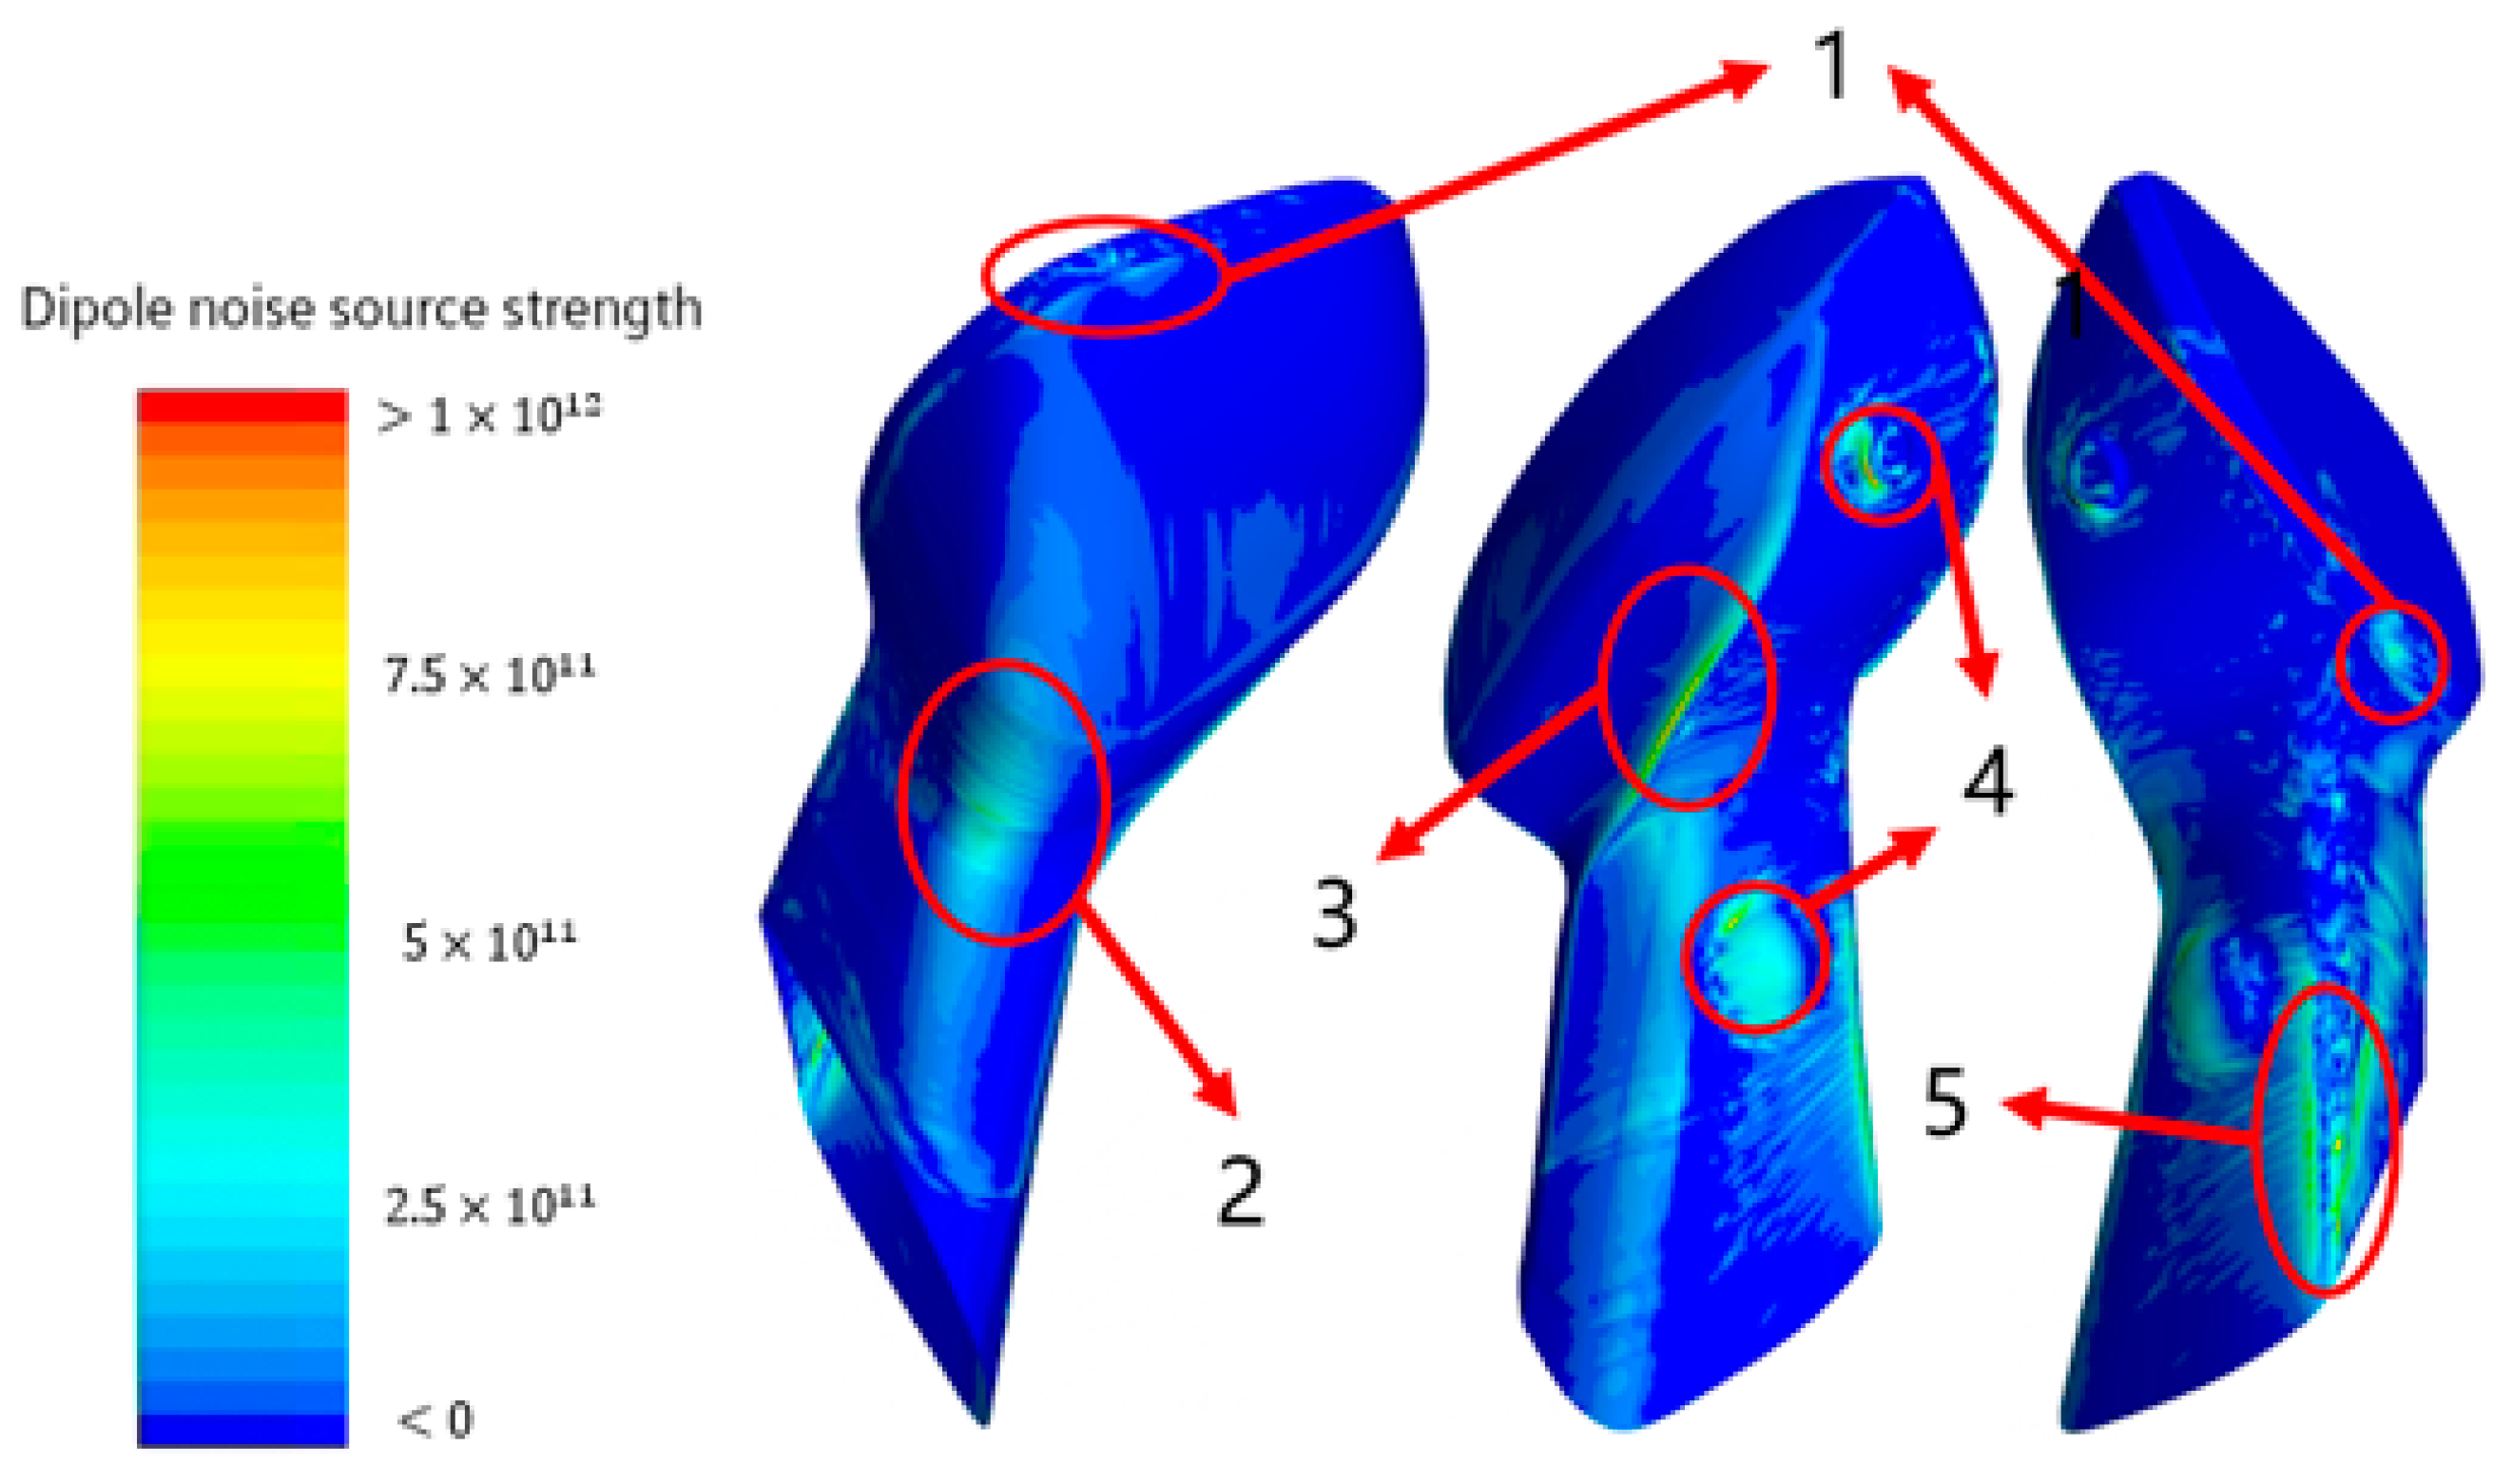
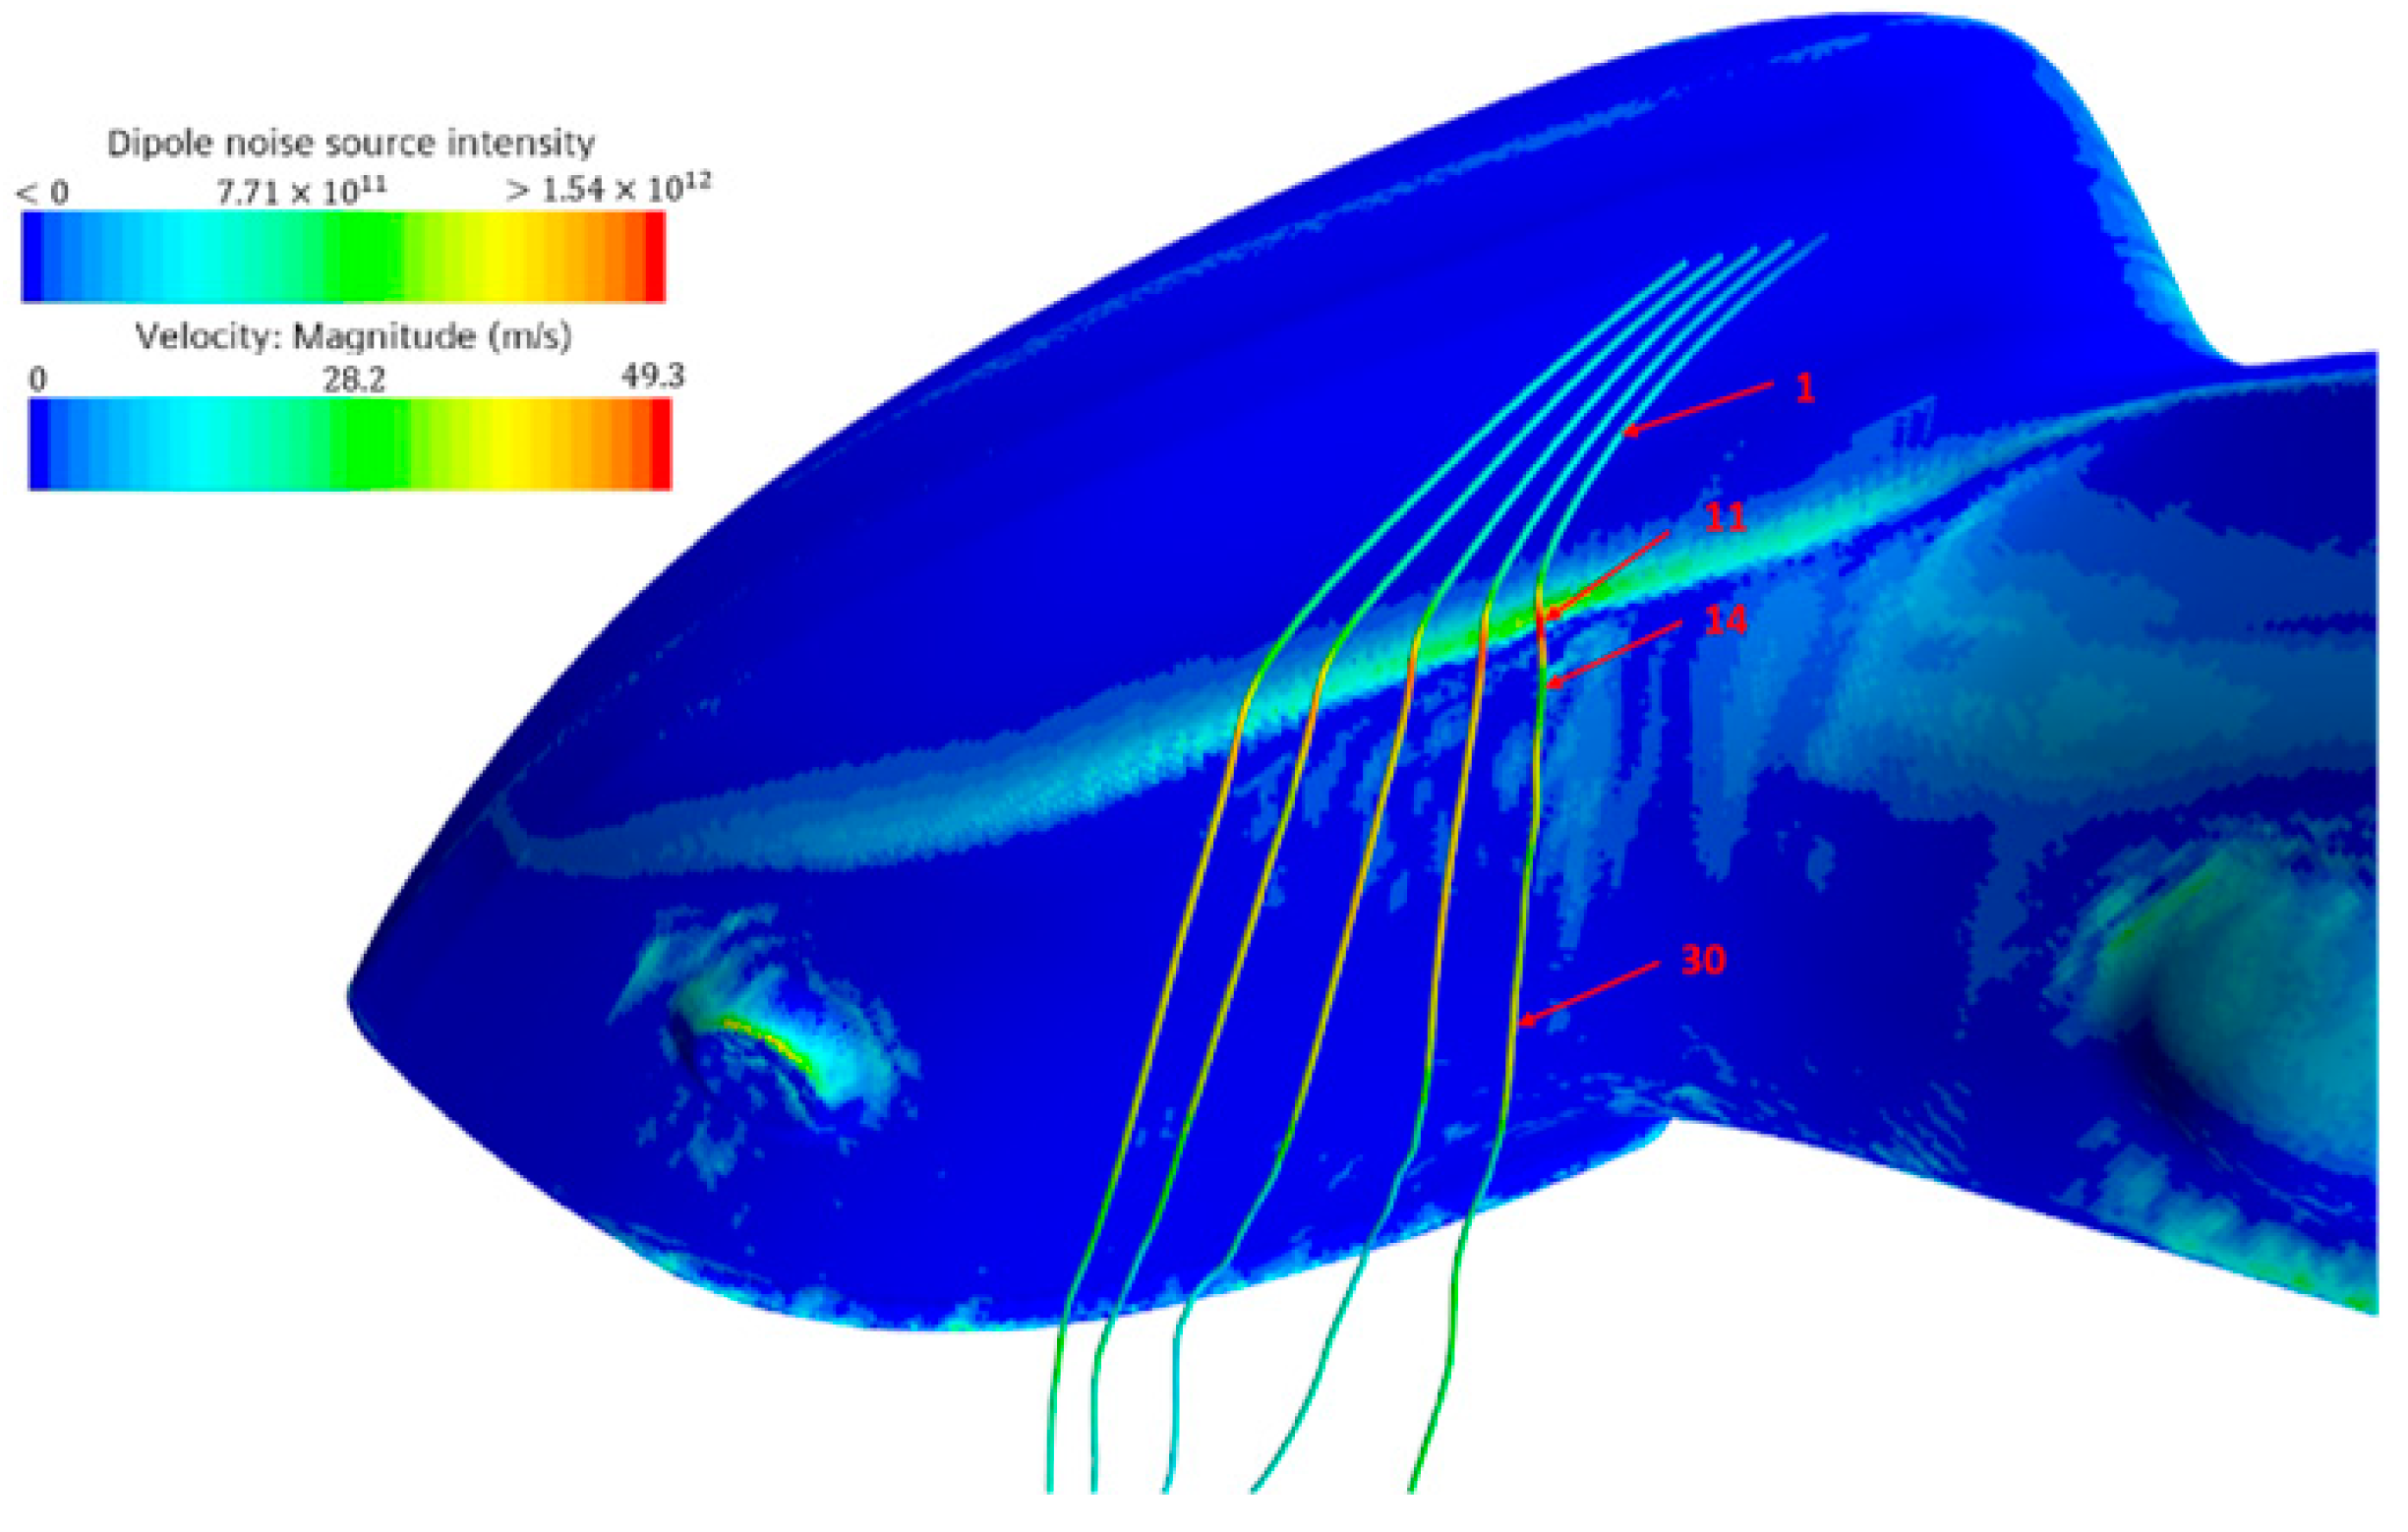
4. Identification of Noise Sources around Rearview Mirror

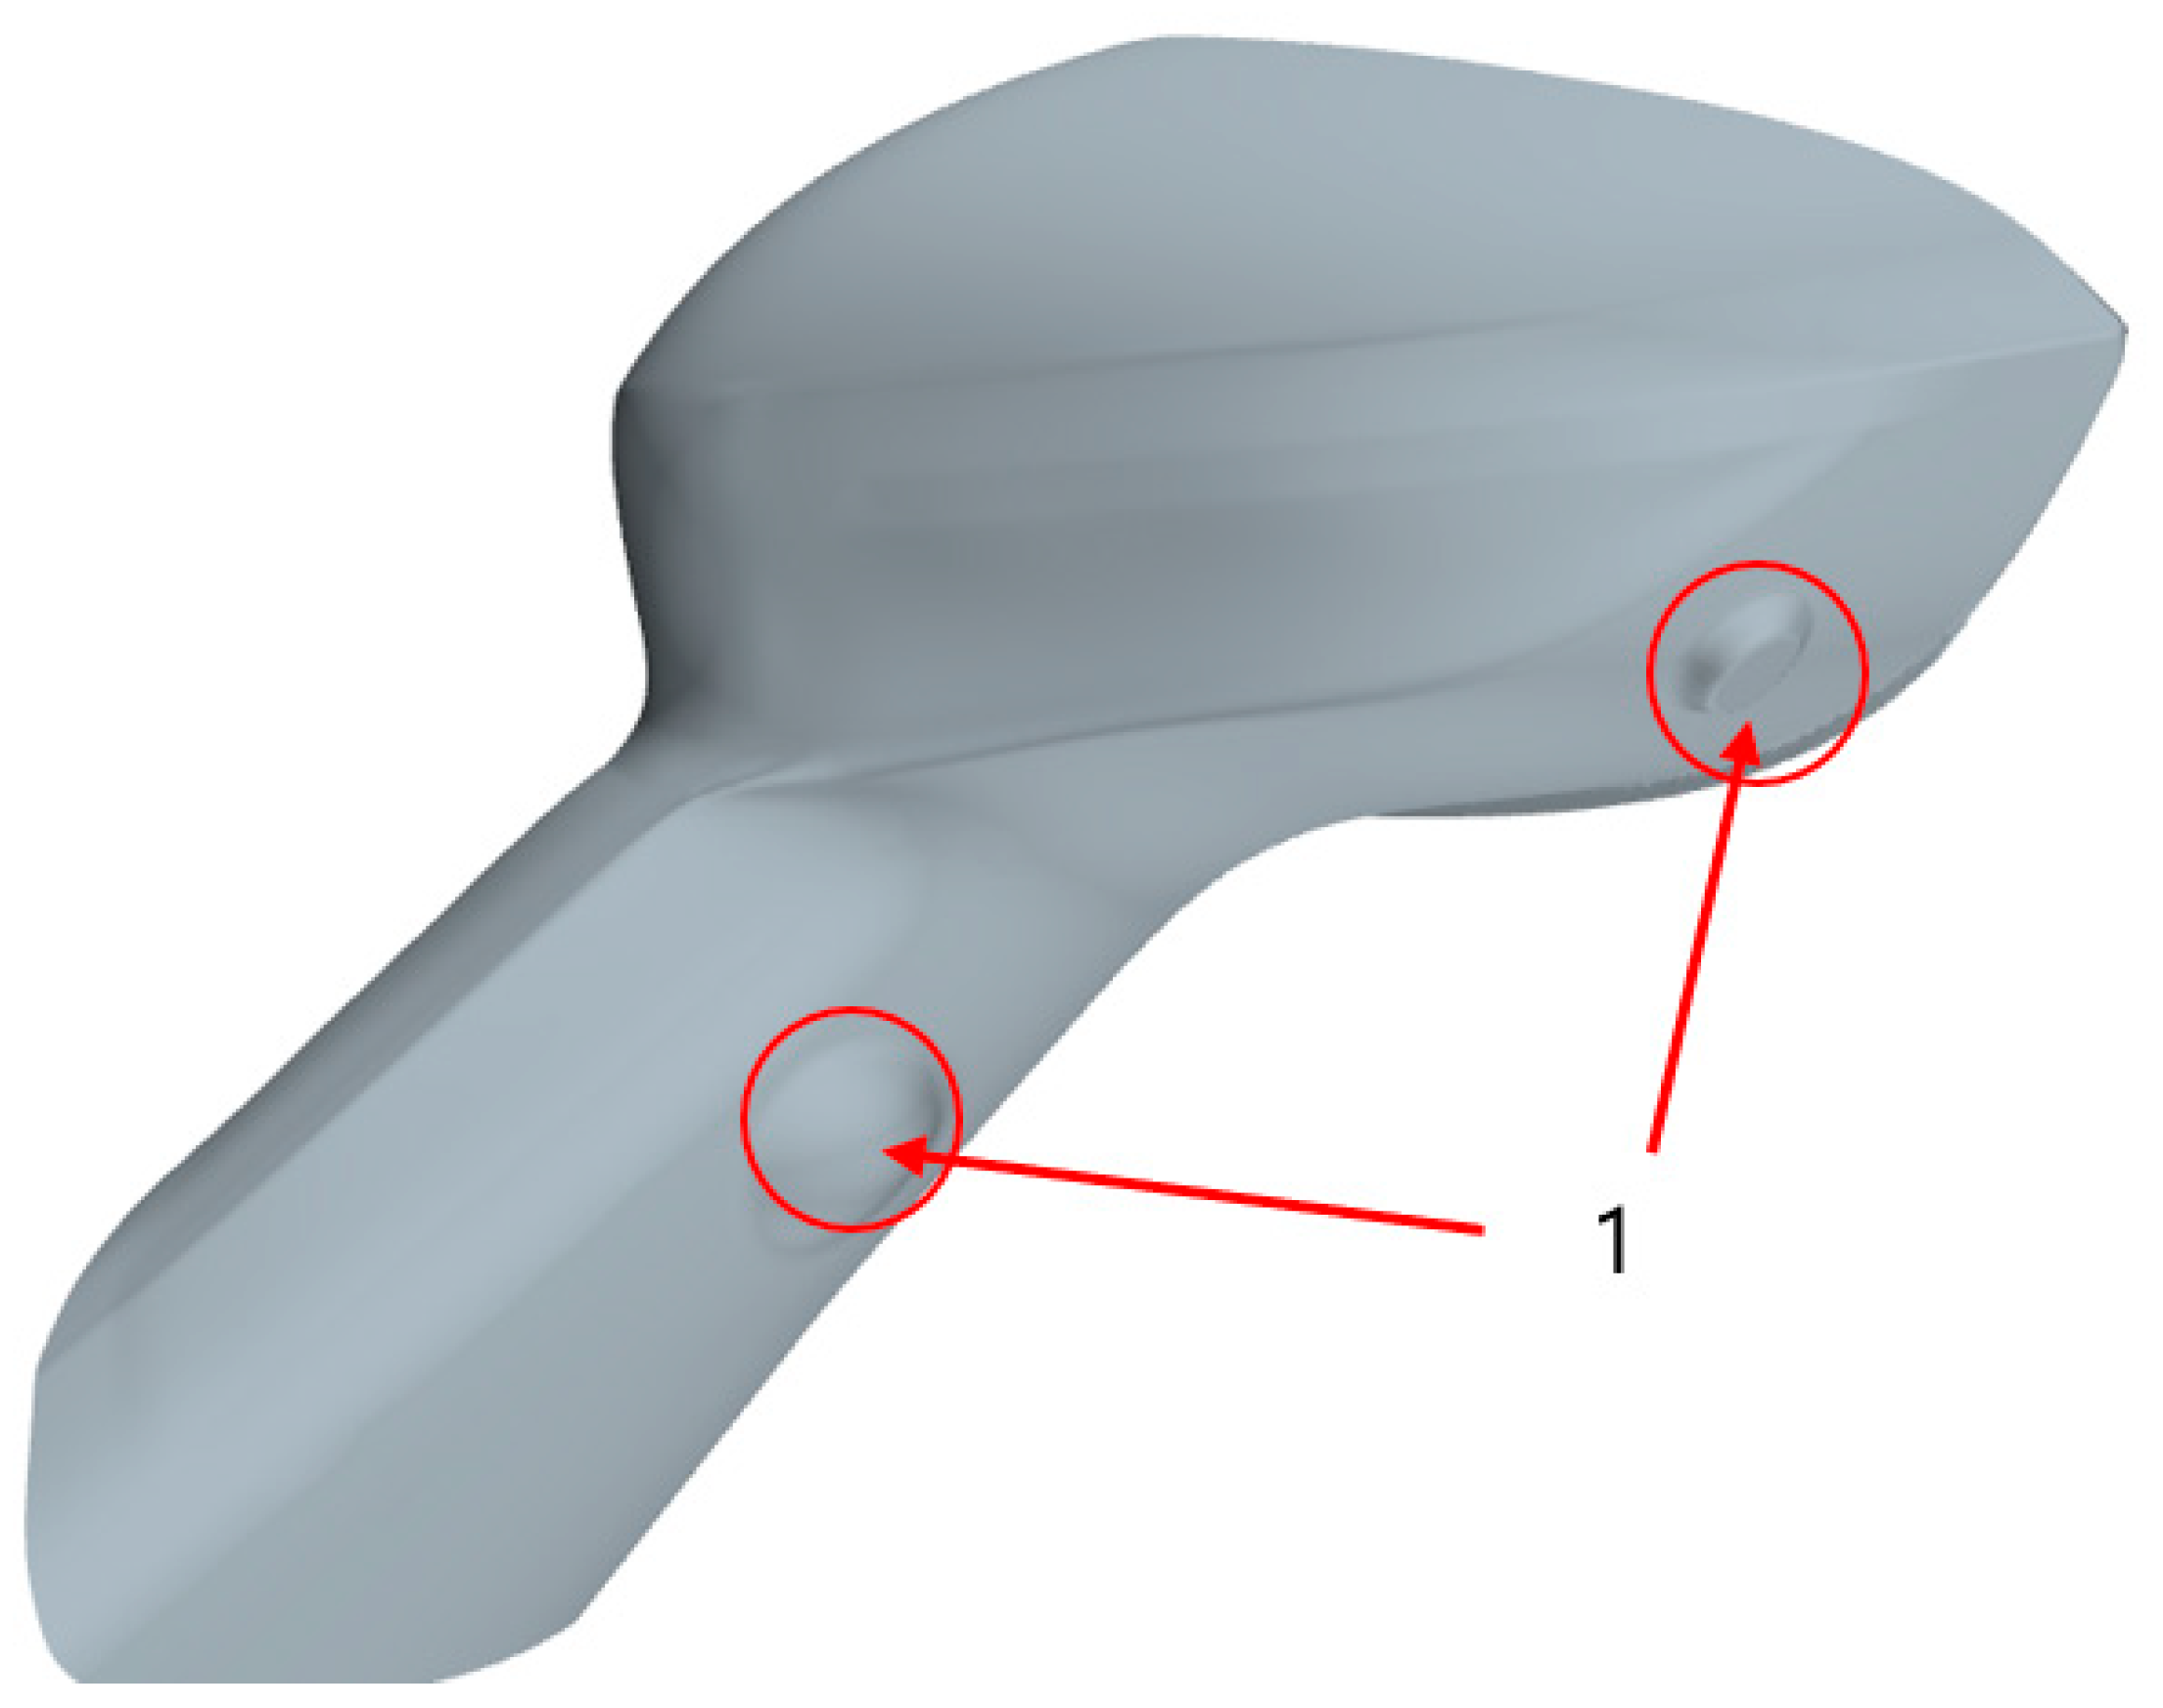
4.1. The Mirror Modelling and Dipole Noise Source Distribution

The geometric feature structure of the mirror is shown in Figure 5; the cameras are installed in position 1.
Formula (12) is a method for calculating the intensity of the dipole noise source. The values of vorticity ω and velocity u in the formula are obtained by transient calculation. Then, the relationship between the intensity of the dipole noise source and the flow physical quantity is used to establish a function to characterize the dipole noise source in the flow field. The noise source distribution on the rearview mirror is shown in Figure 6. It can be seen that the dipole noise source is mainly concentrated at the edges and bulges. Generally, the airflow separates at the edges and bulges and results in a strong pressure fluctuation. Meanwhile, at the junction of the rearview mirror shell and the rearview mirror frame, the noise source is mainly distributed in the place where the curvature changes greatly (position 1), where airflow separation is prone to occur. There is a similar strength distribution at position 2 near the body, which is also a significant location for airflow separation.
There is a strong source of dipole noise at position 3, as shown in Figure 6. This is because the protruding features at these edges disrupt the smooth flow of air, resulting in increased vorticity. The structural protrusions at position 4 result in a dipole noise source at its edges. Position 5 is the junction of the windward and leeward sides of the mirror. It can be seen from the figure that the closer the location is to the bodywork, the larger the dipole noise source becomes. This is due to the fact that the presence of the bodywork obstructs some of the airflow, causing the airflow at this location to become complicated and create vortices.

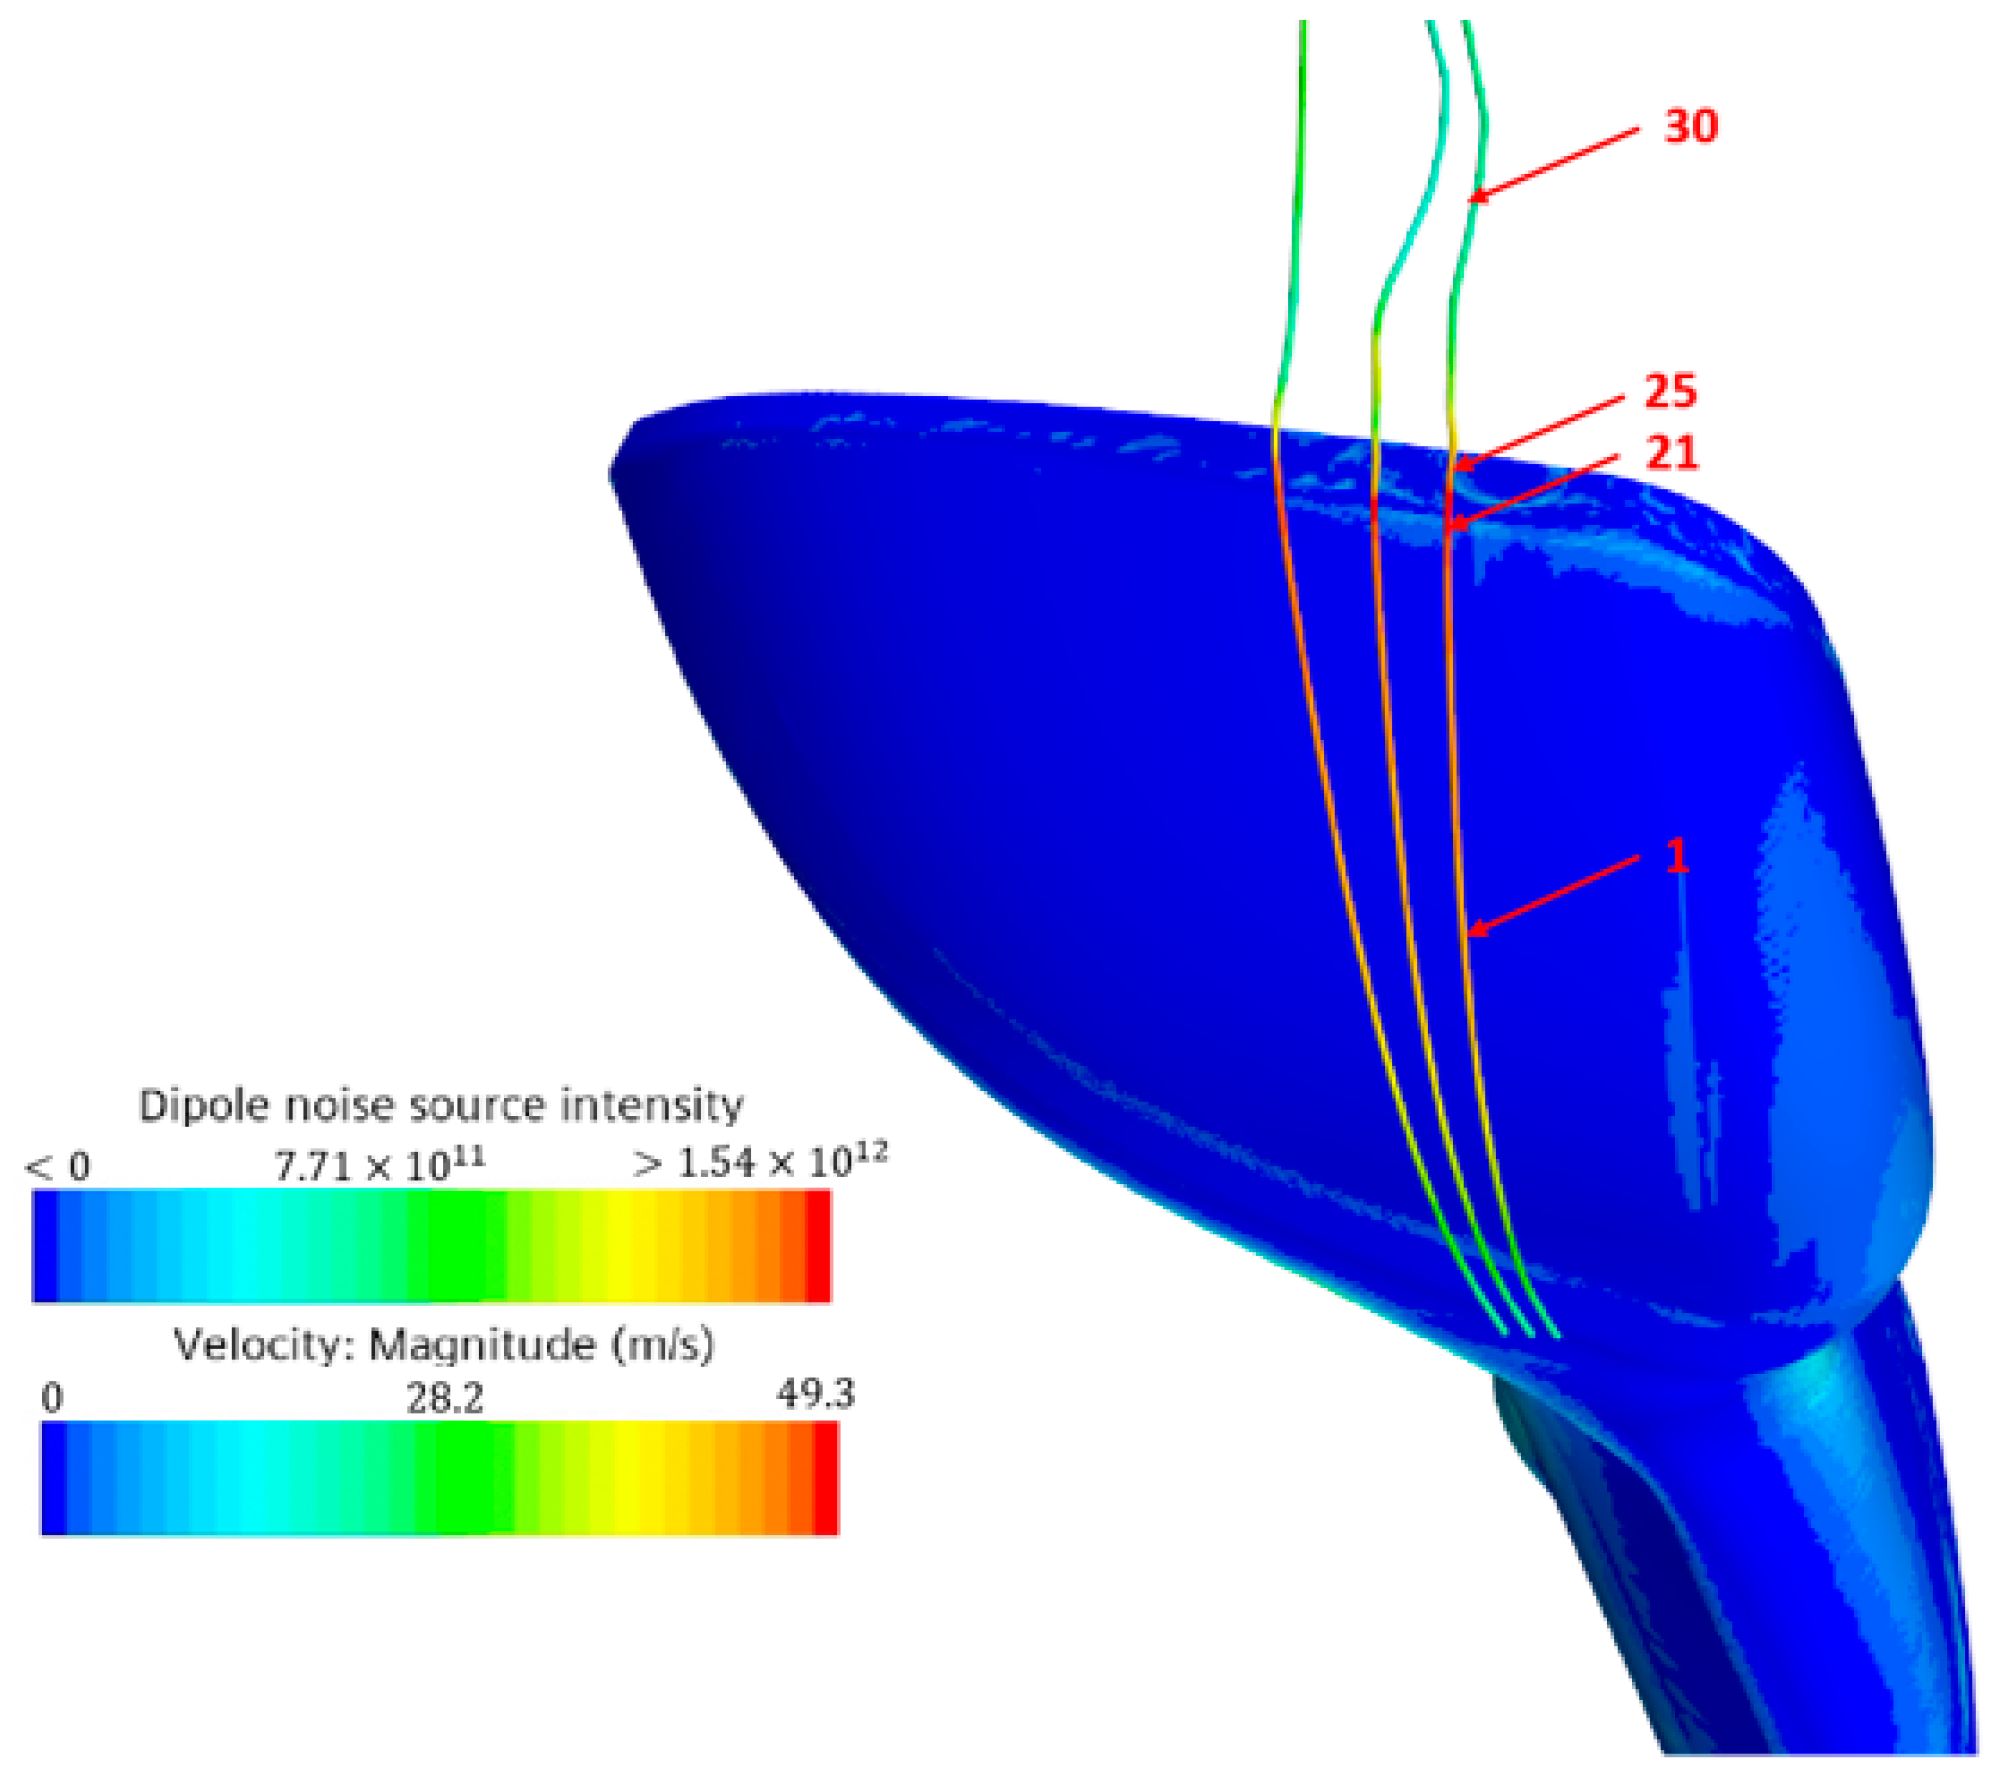
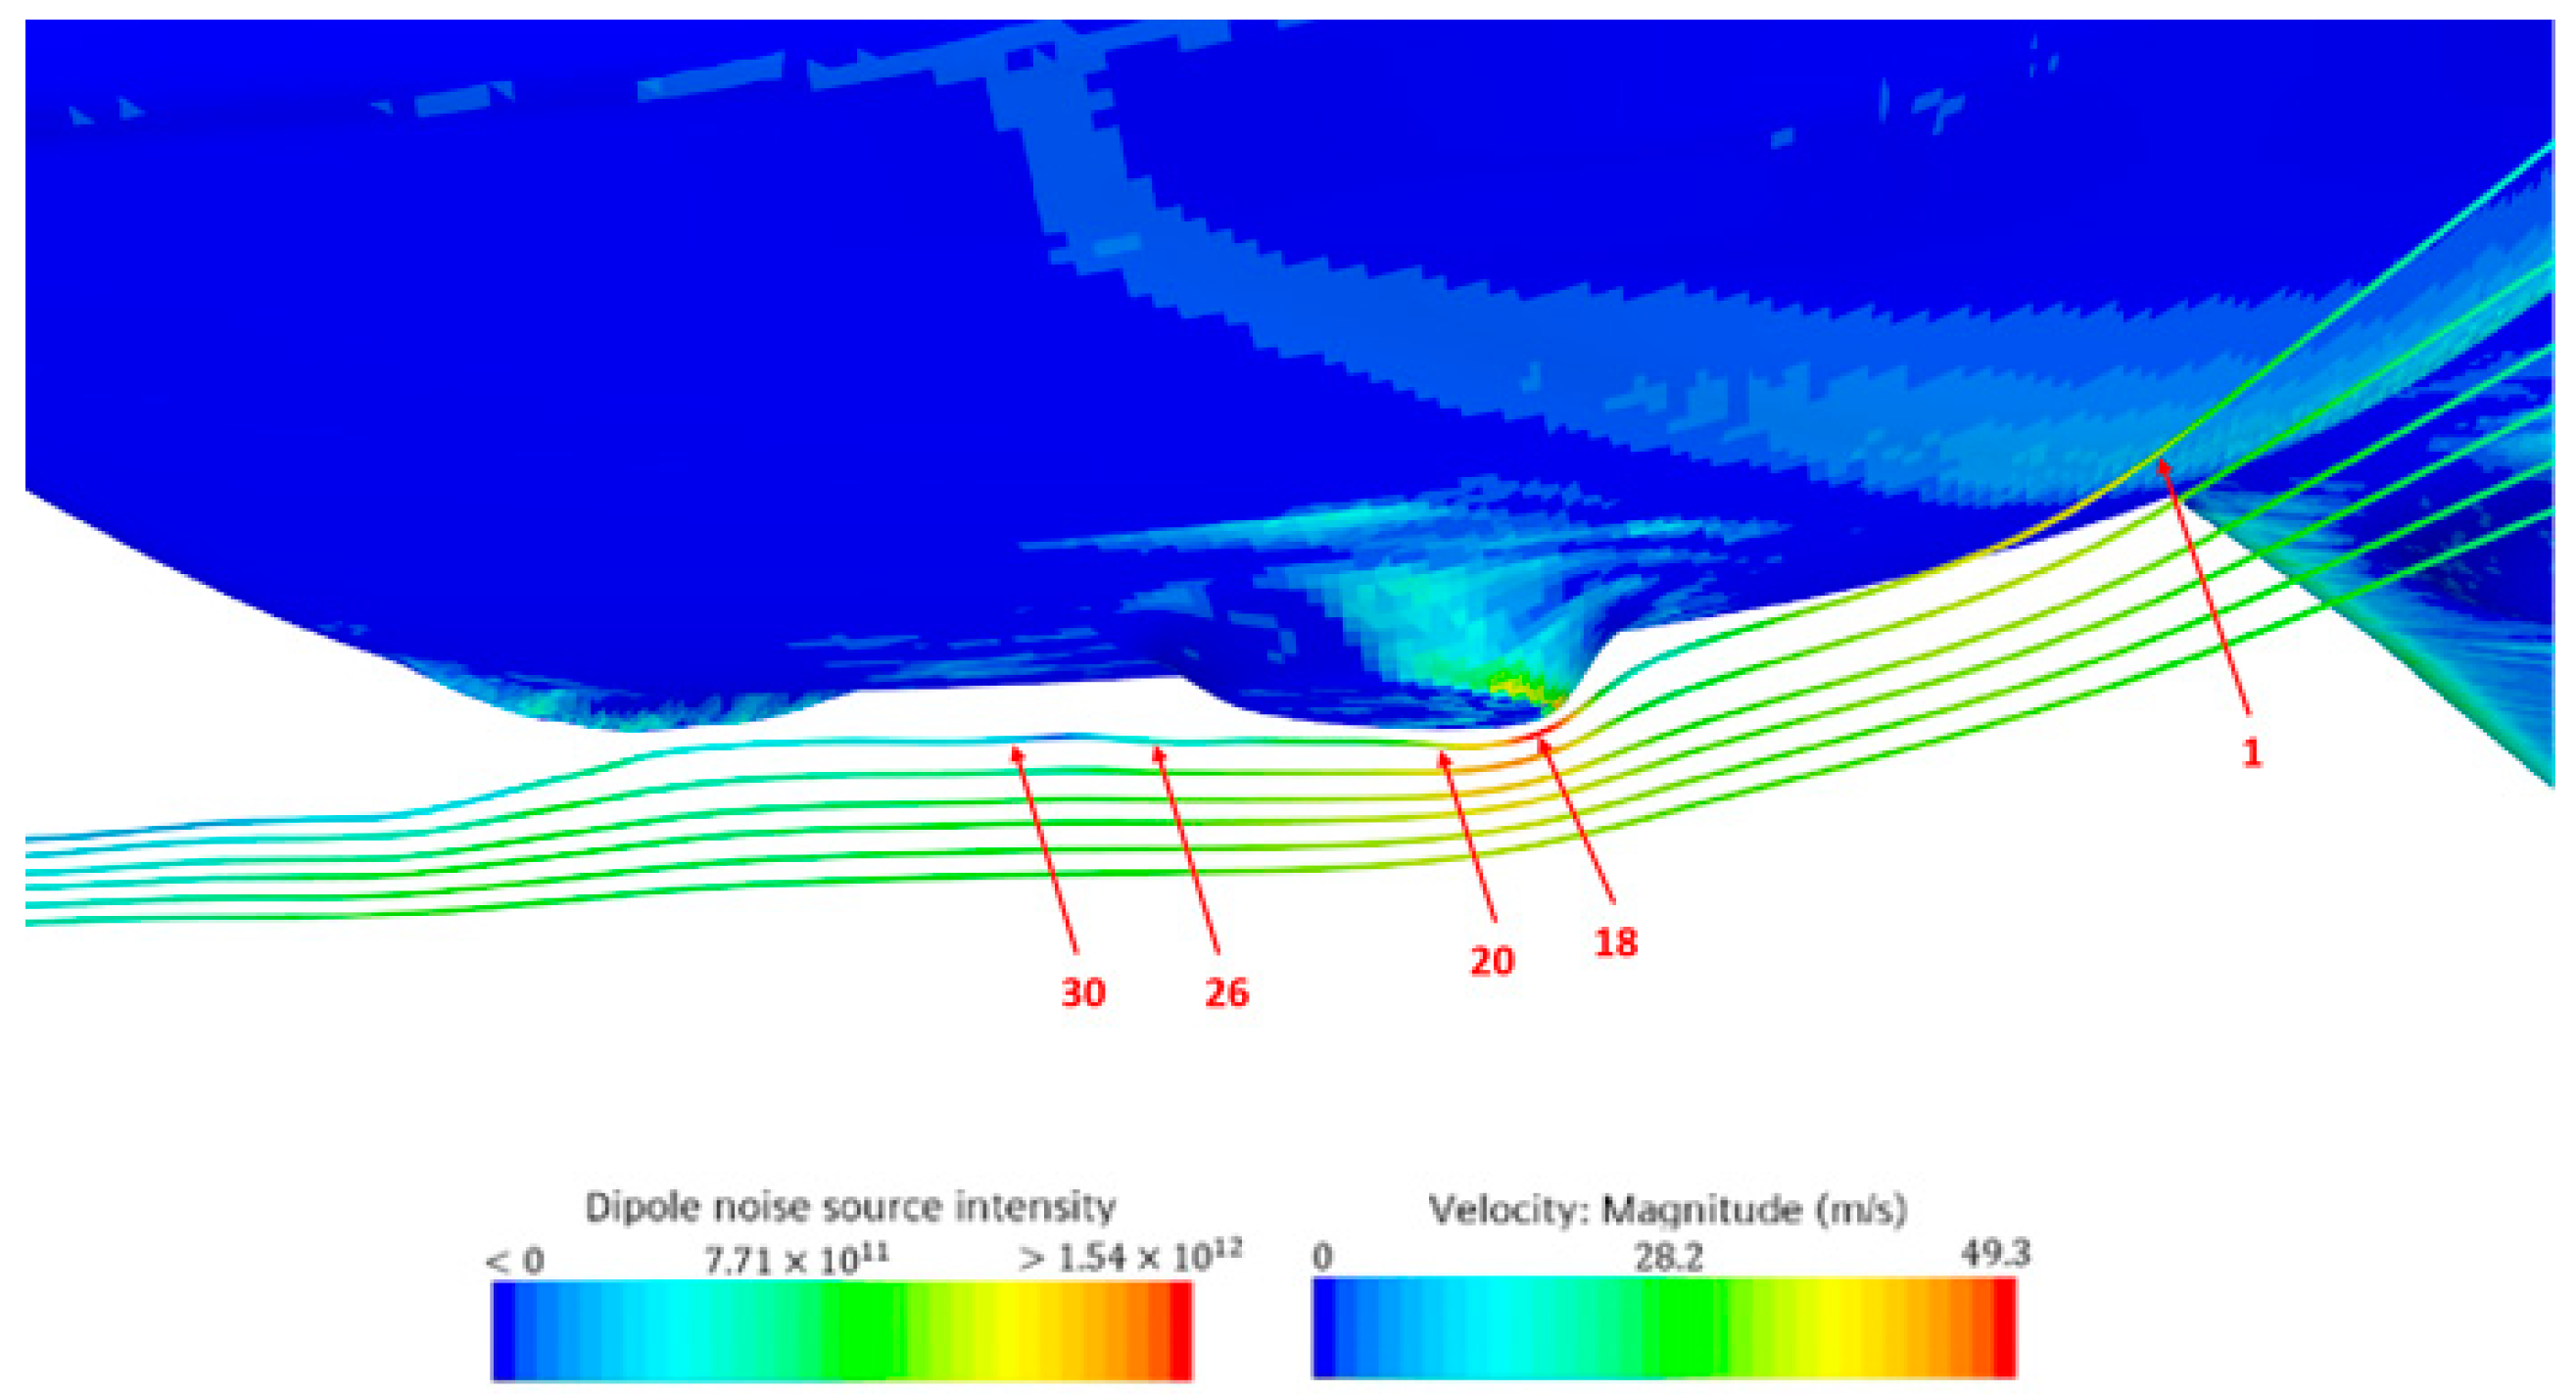
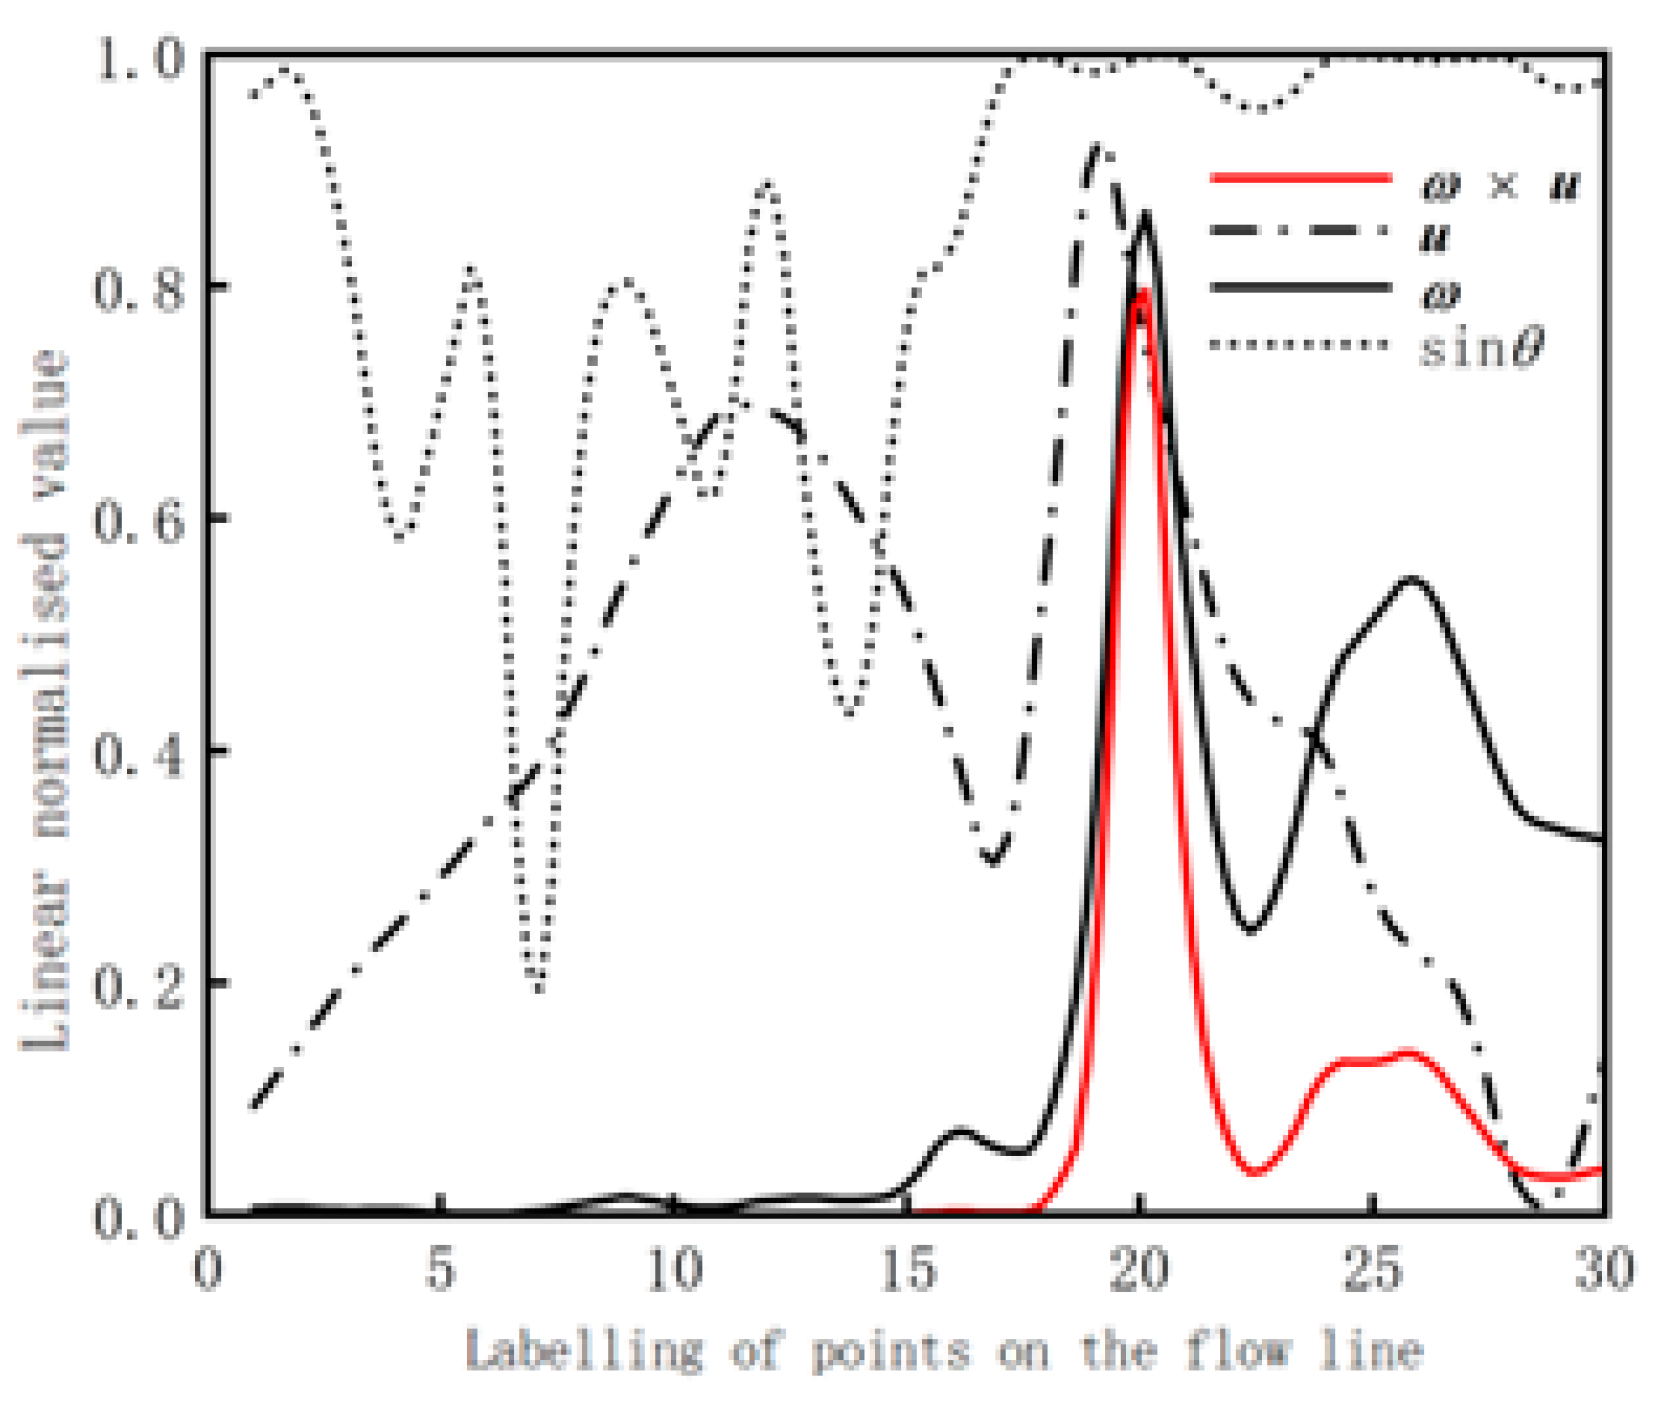
4.2. Relationship between Noise Sources and Flow Field

The dipole noise sources at locations 1, 2, 3 and 4 were selected by understanding the distribution of dipole noise sources. We built flow lines passing through these four locations and extract data on a section of the flow line, including vorticity, velocity, and other relevant flow field physical quantities. The relationship between the dipole noise sources and the flow field physical quantities was analyzed to reveal the mechanism of aerodynamic noise generated by the mirrors. In order to facilitate the comparative analysis of the different data, a linear normalization process was performed on the physical quantities in the streamlines. The extracted physical quantities were mapped to the range [0, 1], and the specific normalization formula is as described in Equation (12):
X n o m = X X m i n X m i n m a x
where X is the original data; X m a x and X m i n are the maximum and minimum values of the data, respectively.
As shown in Figure 7, streamlines were created on the upper surface of the rearview mirror, and one of the streamlines was selected to extract the relevant physical quantities of the flow field above it: the flow velocity u , the vorticity ω , the intensity of the noise source ω × u , and the sinusoid of the angle θ between the flow velocity and the vorticity. The extracted physical quantities were linearly normalized to obtain the results shown in Figure 8. According to the trend of the physical quantities in the figure, it can be seen that:
(1)
The velocity u reaches its maximum near point 21, which is located in front of the junction of the mirror housing and the mirror ring.
(2)
The vorticity ω and the intensity of the sound source ω × u reach the maximum near point 25, which is located at the junction of the mirror shell and the mirror ring.
(3)
The sine value of the angle θ between the flow velocity and the vortex is about 1 when the vortex quantity ω and the intensity of the sound source ω × u reach the maximum; the angle θ between the flow velocity and the vortex is about 90 degrees.
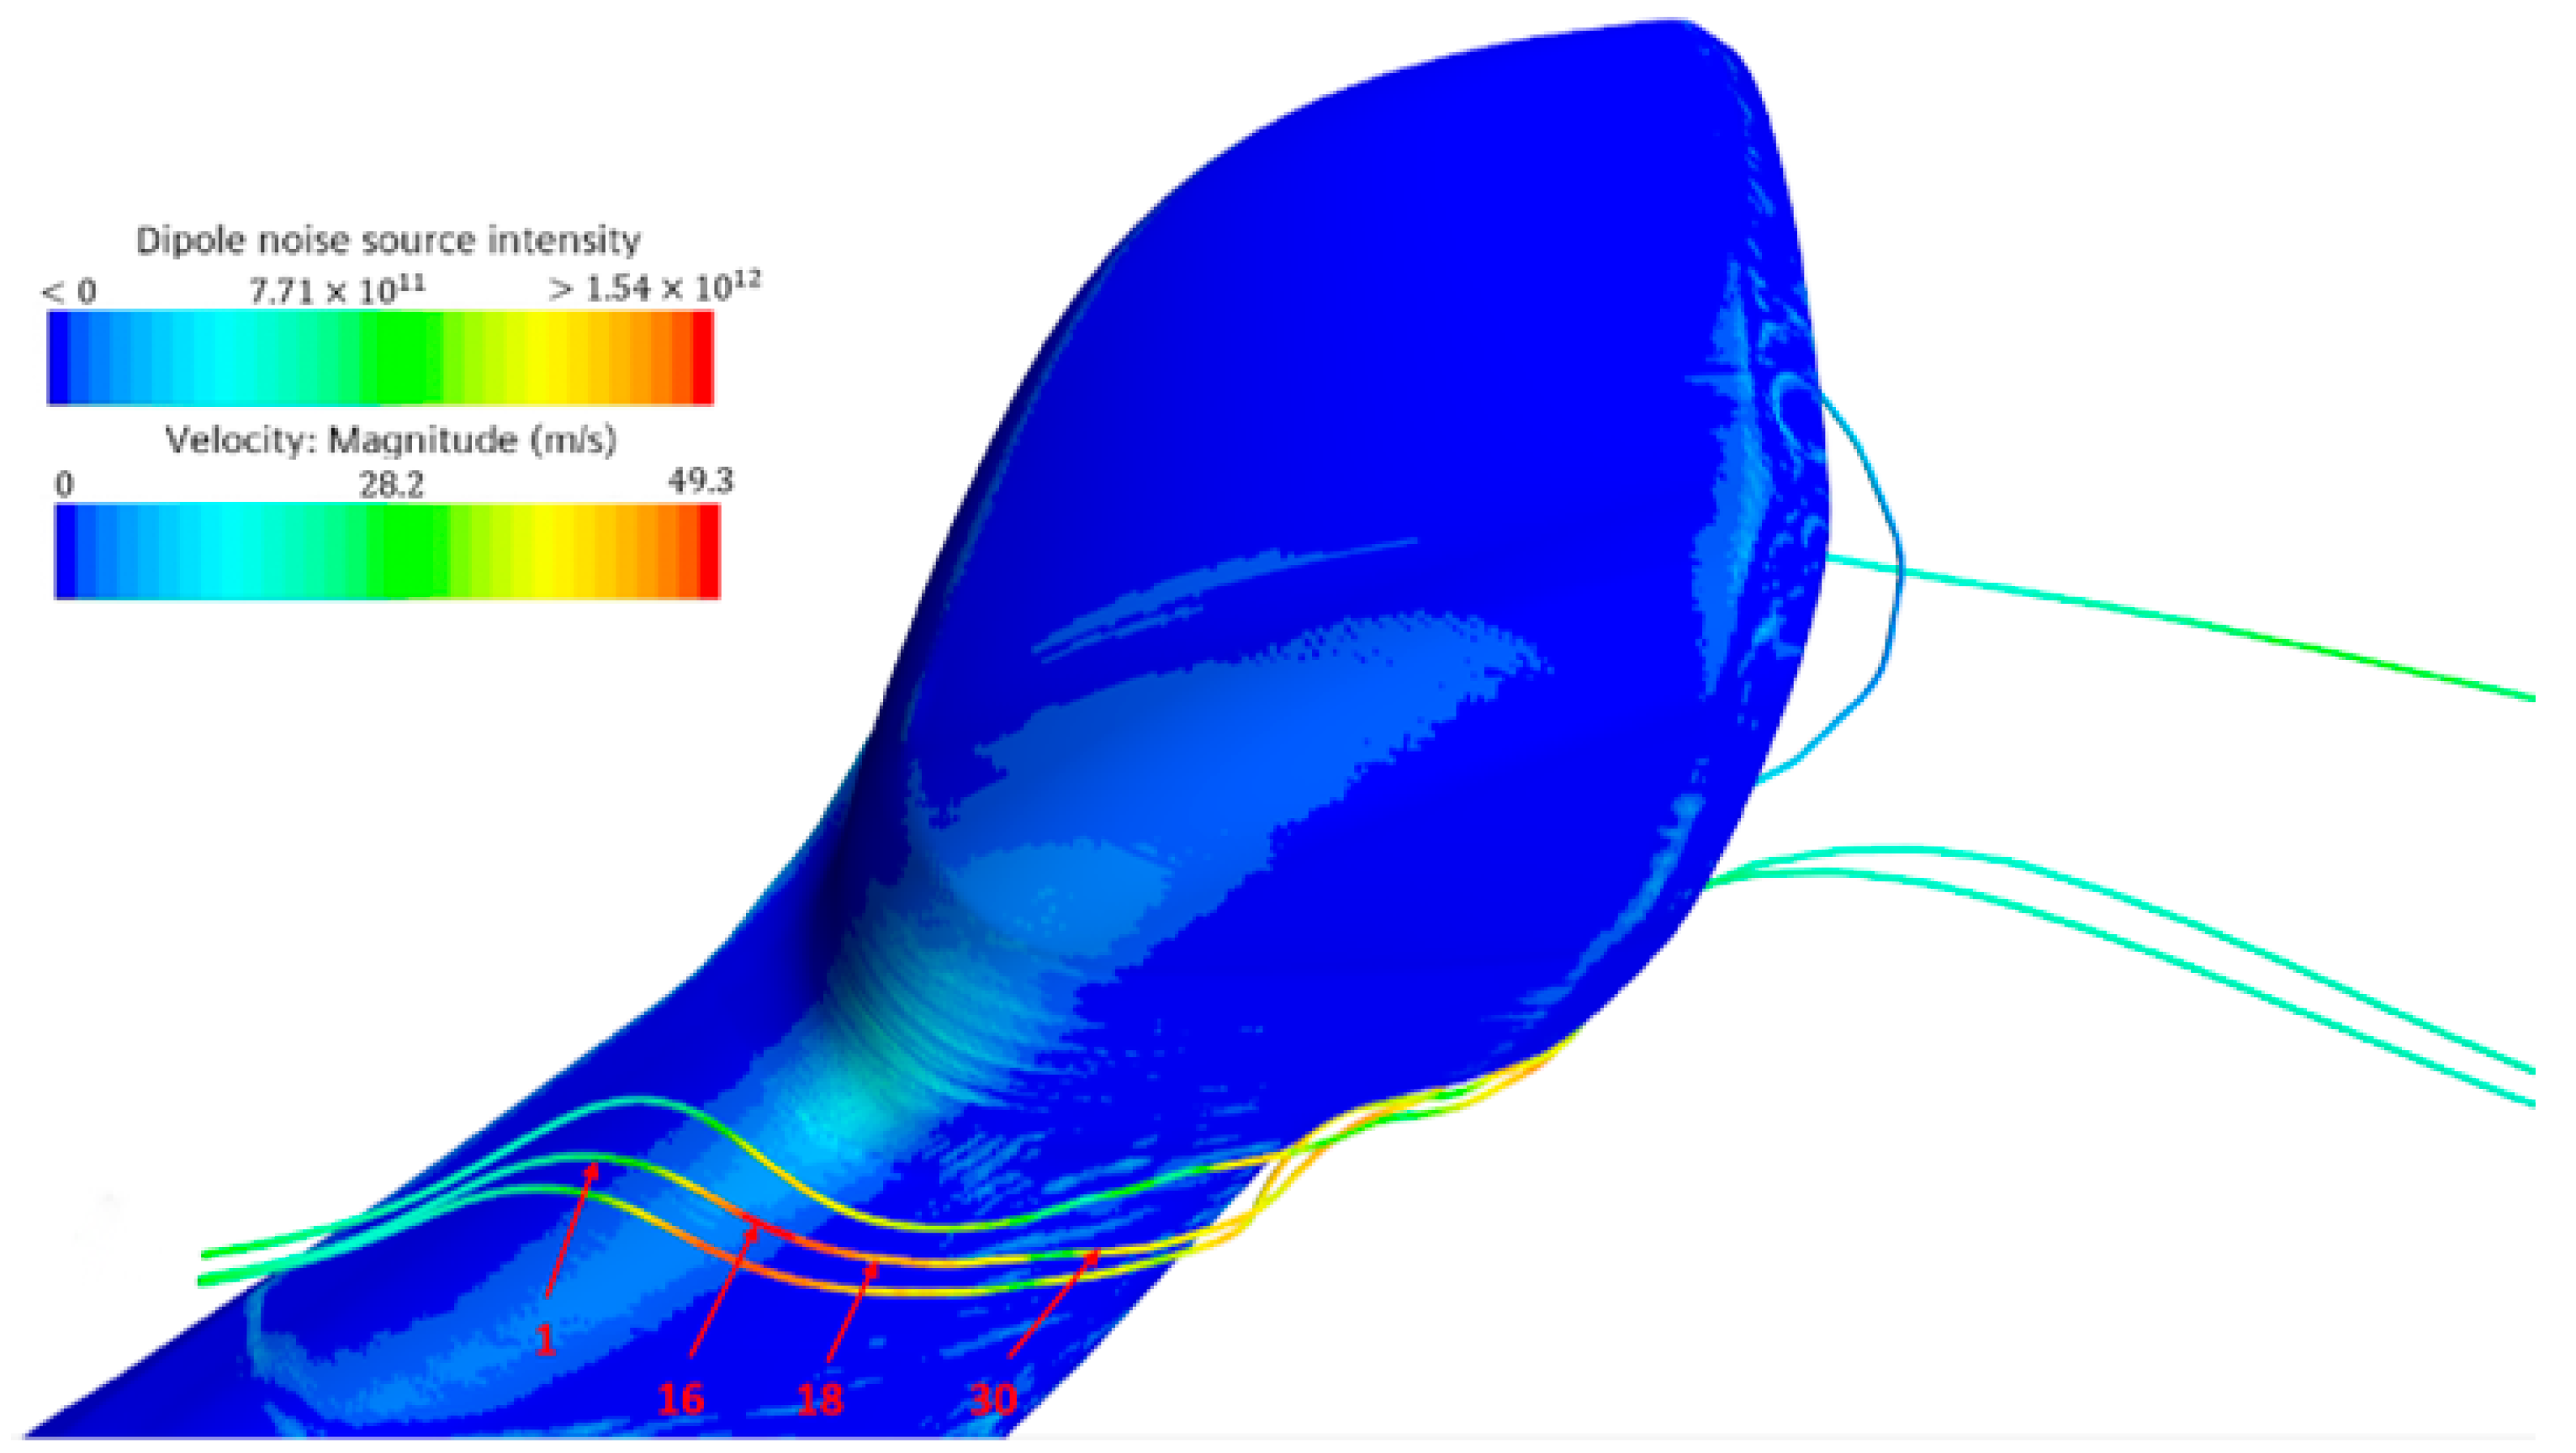
Comparison of the trends of the physical quantities shows that the change of the vorticity before and after the junction of the mirror shell and the mirror ring is the most drastic, which is the main reason for the generation of the dipole noise source.
As shown in Figure 9, the same method as above was used to create streamlines in the rearview mirror near the side window mirror stalk; we selected one of the streamlines to extract the relevant flow field physical quantities and then applied linear normalization to obtain the results shown in Figure 10. According to the trend of each physical quantity in the figure, it can be seen that:
(1)
The vorticity ω and noise source intensity ω × u reach the maximum value near point 18, and the angle θ between the flow velocity and the vorticity has a sinusoidal value of 1, which is located at the rounded corner of the mirror stalk, which is the main location of the airflow separation.
(2)
Compared with the vorticity and noise source intensity, the flow velocity u reaches the peak value earlier, and the peak position is located at point 14.
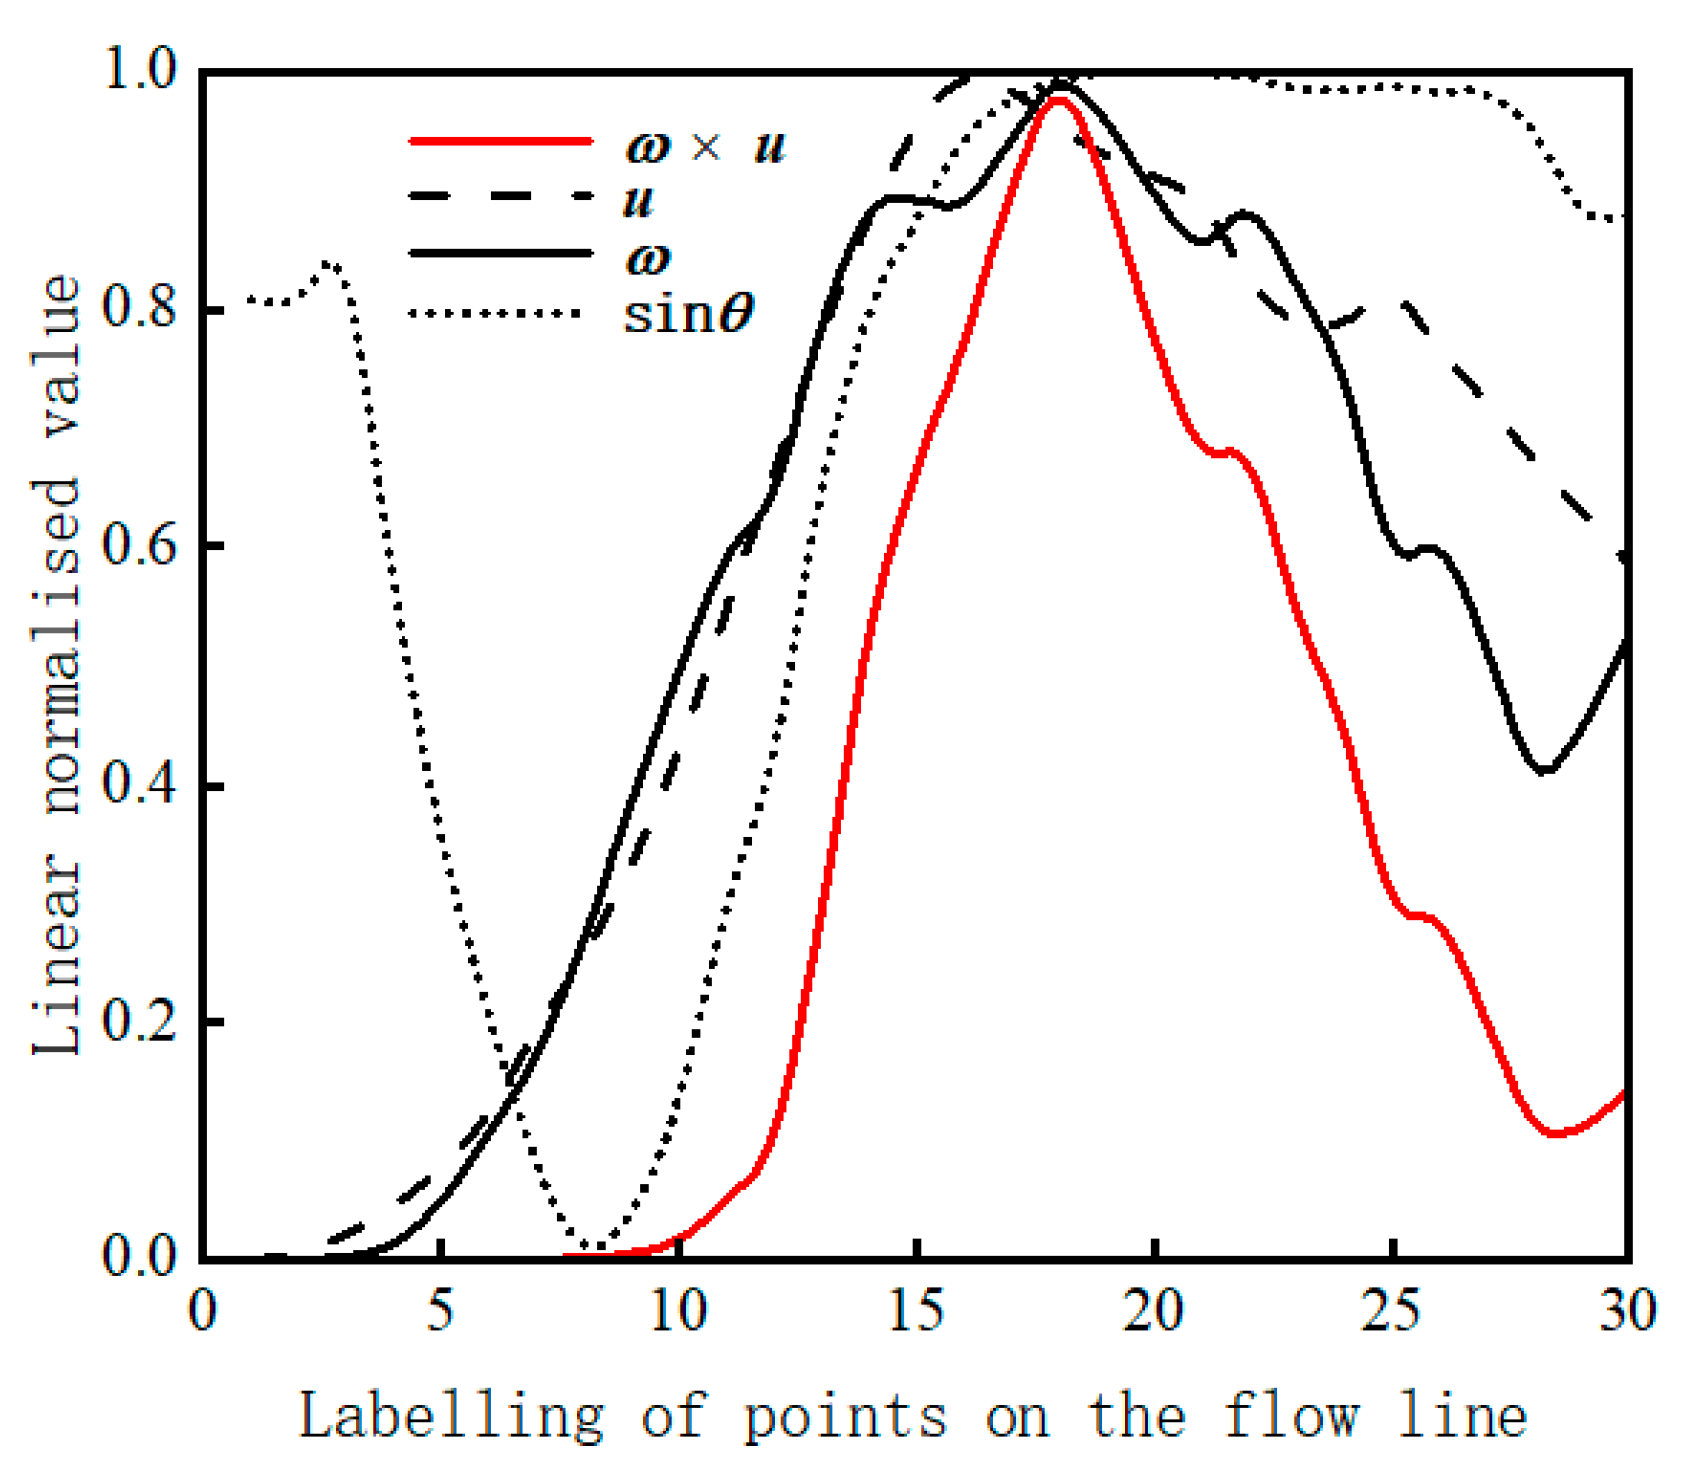
Comparison of the trends of each physical quantity shows that the vorticity ω , flow velocity u , the angle sine value sinθ, and the intensity of the sound source ω × u all reach the maximum near point 18, and the flow velocity and the vortex angle sine value sinθ basically remain unchanged, while the rest of the physical quantities undergo great change before and after point 18, among which the intensity of the noise source ω × u changes most drastically, and the trends of the change of the vorticity and the intensity of the noise source are basically the same. The main reason for the noise source at this point is that the vortex ω and the flow velocity u change drastically when the gas flows through here, while the angle θ between the velocity and the vortex is close to 90 degrees.
As shown in Figure 11, the same method as above was used to create streamlines in the rearview mirror shell surface prisms; we selected one of the streamlines to extract the relevant flow field physical quantities and then applied linear normalization to obtain the results shown in Figure 12. According to the trend of each physical quantity in the figure, it can be seen that:
(1)
Like the previous law, the flow velocity u peaks first near point 10, and the sinusoidal value of the angle between the flow velocity and the vorticity, sinθ, also peaks earlier. This is due to the more obvious prismatic features on the surface of the mirror shell of the rearview mirror, and the drastic change of the airflow before and after the prism.
(2)
The vorticity ω and the intensity of the sound source ω × u peak near point 13, and both of them change more drastically before and after point 13.
A comparison of the trends of the physical quantities shows that the vorticity and the noise source intensity peak near point 13, and there are obvious changes in the velocity, vorticity, and noise source intensity before and after the peak. Subsequently, vortices are generated due to the interaction of the downward flowing portion of the separated airflow passing through the point with the airflow from the mirror stalk. Therefore, a certain peak value of vorticity, velocity, noise source intensity, and the sine of the angle between the flow velocity and vorticity is generated near points 18 and 26. From Figure 12, it can be concluded that the angle between the flow velocity and the vorticity has some effect on the generation of the dipole noise source.
As shown in Figure 13, as above, streamlines were created at the rearview mirror camera installation, and one of the streamlines was selected to extract the relevant physical quantities of the flow field above and then linearly normalized to obtain the results shown in Figure 14. According to the trend of each physical quantity in the figure, it can be seen that:
(1)
The change of the angle between the flow velocity u and the vorticity ω is more drastic in the early stage due to the influence of the prisms on the surface of the rearview mirror shell. The sinusoidal value of the angle between the flow velocity u and the vorticity ω reaches its maximum value at point 16, and remains basically unchanged thereafter.
(2)
The flow velocity u peaks near point 18, and the vorticity ω and source intensity ω × u peak near point 20. However, the changes of physical quantities before and after the peaks are more drastic.
Comparison of the trends of the physical quantities shows that the vorticity, the intensity of the noise source, and the sine of the angle between the vorticity and the velocity peak near point 20. The angle between vorticity and velocity is always around 90 degrees. The drastic changes in vorticity, velocity, and noise source intensity are the main reasons for the dipole noise source. At the same time, the airflow is separated by the camber and then converges at the rear to produce vortices, so that the vorticity and the intensity of the noise source produce a certain peak near point 26.
From the above analysis of the relationship between dipole noise sources and physical quantities in the flow field, it can be concluded that the dipole noise sources are mainly distributed in the airflow separation region. Before and after the airflow separation, the vorticity ω , velocity u , and the angle between vorticity and velocity in the flow field all change drastically. By comparing the four physical quantities of the flow field, it is found that the peaks of the vorticity and the noise source always appear in the same position. This indicates that the generation of vorticity is the key factor in the generation of dipole noise source. In addition, whenever the intensity of the noise source reaches the maximum, the angle θ between the vorticity and the flow velocity is about 90 degrees, which indicates that the dipole noise source is easily generated when the direction of the flowing vortex and the direction of the flow velocity are perpendicular to each other. When the intensity of the noise source reaches its peak value before the flow velocity, the change in flow velocity creates a difference in flow velocity, which in turn creates a pressure difference. Since it is the creation of the pressure difference that leads to the creation of vortices, the flow velocities reach their peaks earlier.

5. Conclusions

In this paper, based on the acoustic wave fluctuation equation, the dipole noise source is regarded as a sphere radiating noise outwards. By combining the acoustic wave fluctuation equation and the equation of motion of fluid in spherical coordinates, a method of expressing the intensity of the dipole noise source at the rearview mirror of a car in terms of the acoustic power intensity is derived, and a relationship equation between the dipole noise source and the physical quantity of the flow field is obtained. According to this relation equation, the distribution region of the dipole noise source on the rearview mirror was obtained by flow field simulation using large vortex simulation. By analyzing the dipole noise sources in each region, the relationship between physical quantities such as vortices and flow velocity in the flow field and the dipole noise sources is further revealed:
(1)
The dipole noise sources are mainly concentrated in the airflow separation region, and the vorticity, velocity, and the angle between the two in the flow field change drastically before and after the airflow separation;
(2)
The peak value of vorticity and the peak value of noise source intensity always appear in the same position, and the generation of vorticity is the key factor for the generation of the dipole noise source;
(3)
Whenever the intensity of the noise source reaches its maximum, the angle θ between the vorticity and the flow velocity is about 90 degrees, and it is easy to generate a dipole noise source when the direction of the flowing vortex and the direction of the flow velocity are perpendicular to each other;
(4)
When the intensity of the noise source reaches its peak value before the flow velocity reaches its peak value, the change of the flow velocity produces the flow velocity difference, which in turn produces pressure difference. Since the generation of pressure difference is what leads to the generation of vortices, the flow velocities all peak earlier.

Author Contributions

Software, R.M.; Validation, W.J. and X.X.; Investigation, S.Z.; Resources, H.J.; Writing—original draft, R.M. and J.X.; Writing—review & editing, Y.W.; Project administration, J.P. All authors have read and agreed to the published version of the manuscript.

Funding

This study was not externally funded.

Informed Consent Statement

This article is not about human research.

Data Availability Statement

No data related to the research process was created.

Conflicts of Interest

The authors declare no conflict of interest.

References

  1. Xiao, Z. Research on Aerodynamic Noise of High-Speed Vehicles. Ph.D. Thesis, Hunan University, Changsha, China, 2007. [Google Scholar]
  2. Li, Q.; Yang, Z.; Wang, Y.; He, Y. Experimental and numerical studies on aerodynamic noise of automotive rear mirror. Noise Control. Eng. J. 2011, 59, 613. [Google Scholar] [CrossRef]
  3. Yao, H.; Chroneer, Z.; Davidson, L. Simplifications Applied to Simulation of Turbulence Induced by a Side View Mirror of a Full-Scale Truck Using DES; SAE Technical Paper 2018-01-0708, Aerodynamics, Volvo Group Trucks Technology; Chalmers University of Technology: Gothenburg, Sweden, 2018. [Google Scholar]
  4. Mutnuri, L.; Senthooran, S.; Powell, R.; Sugiyama, Z.; Freed, D. Computational Process for Wind Noise Evaluation of Rear-View Mirror Design in Cars; SAE Publications: Warrendale, PA, USA, 2014. [Google Scholar]
  5. Chen, X.; Wang, H.-Y.; Gao, C.-F.; Zhang, W.; Xie, C. Effects of mirror cowl edge structure on flow field and aerodynamic noise. J. Aerosp. Dyn. 2014, 29, 1099–1104. [Google Scholar]
  6. Xin, C.; Ning, W.; Chuan, L.S.; Xiao, F.; Chang, H.Y. Effect of rearview mirror modelling on front side window aerodynamic noise. J. Jilin Univ. (Eng. Ed.) 2020, 50, 426–436. [Google Scholar]
  7. Li, Q.; Yang, Z.; Wang, Y. Influence parameters of aerodynamic noise of automobile mirrors. J. Tongji Univ. (Nat. Sci. Ed.) 2011, 39, 1204–1207. [Google Scholar]
  8. Wang, Y.; Zhu, L.; Yan, J.; Hao, Z. Aerodynamic sound source identification method based on cylindrical winding. J. Tongji Univ. (Nat. Sci. Ed.) 2022, 50, 1500–1507. [Google Scholar]
  9. Chen, Y.; Ge, J.; Ding, S.; Zhu, L.; Guo, J. Aerodynamic noise simulation and experimental analysis of 600km-h~(-1) high-speed maglev train. J. Tongji Univ. (Nat. Sci. Ed.) 2023, 51, 247–255. [Google Scholar] [CrossRef]
  10. Yang, Z.; Yang, C.; Gao, J.; Lu, Z.; Liu, H. Simulation Studly on Aerodynamic Noise Characteristics of High-Temperature Superconducting Maglev Train. China Railw. Sci. 2023, 44, 92–101. [Google Scholar] [CrossRef]
  11. Hang, J.; Wu, Y.W.; Gao, J.-Y.; Gao, G.J.; Yang, Z.G. Numerical Simulation of Radiated Aeroacoustics Characteristics of TRO8Maglev’Trains. J. Railw. Sci. Eng. 2022, 19, 2794–2803. [Google Scholar] [CrossRef]
  12. He, Y.; Tian, W.; Zhang, Z.; Li, Y. Passenger Car Aerodynamic Noise Optimization Based on Sensitivity Analysis. China Mech. Eng. 2022, 33, 740–746. [Google Scholar] [CrossRef]
  13. Li, T.; Qin, D.; Zhang, J.; Zhang, W. Numerical Approach for Far-Field Aerodynamic Noise of High-Speed Trains Based on Half Model. J. Southwest Jiao Tong Univ. 2023, 58, 272–279+286. [Google Scholar] [CrossRef]
  14. Powell, A. Theory of vortex sound. J. Acoust. Soc. Am. 1964, 36, 177–195. [Google Scholar] [CrossRef]
  15. Zhang, Q. Fundamentals of Pneumatic Acoustics. Master’s Thesis, National Defense Industry Press, Beijing, China, 2012. [Google Scholar]
  16. Wang, Y.-G.; Zhao, S.-A.; Zhang, H.; Yang, Z.-G. Characteristic identification of aerodynamic noise sources in the automotive rearview mirror-A-pillar region. Automot. Eng. 2021, 43, 1840–1847. [Google Scholar]
  17. Zhang, G.; Wang, H. Measurement and analysis system of hydroacoustic sound intensity and its application in underwater noise identification. Appl. Acoust. 1996, 4, 33–38. [Google Scholar]
  18. Kim, M.-S.; Lee, J.-H.; Kee, J.-D.; Chang, J.-H. Hyundai Full Scale Aero-acoustic Wind Tunnel. SAE Trans. 2001, 110, 648–664. [Google Scholar]
  19. Gu, Z.; Wang, Y.; Li, W. Evaluation of Aerodynamic Noise Generated in a Miniature Car Using Nu-Medical Simulation. SAE Int. J. Passeng. Cars Mech. Syst. 2009, 2, 693–702. [Google Scholar]
Figure 1. Simplified vehicle model.
Applsci 13 10651 g001
Figure 2. Computational domain.
Applsci 13 10651 g002
Figure 3. Y+ value of rearview mirror surface.
Applsci 13 10651 g003
Figure 4. Mesh along the symmetry plane.
Applsci 13 10651 g004
Figure 5. The geometric feature structure of the mirror.
Applsci 13 10651 g005
Figure 6. Distribution of dipole noise sources.
Applsci 13 10651 g006
Figure 7. Flow diagram of the upper surface part of the rearview mirror.
Applsci 13 10651 g007
Figure 8. Variation of each physical quantity on the upper surface of the rearview mirror with streamlines.
Applsci 13 10651 g008
Figure 9. Partial flow diagram at the mirror stalk of the rearview mirror.
Applsci 13 10651 g009
Figure 10. Variation of each physical quantity at the mirror stalk of the rearview mirror with streamline.
Applsci 13 10651 g010
Figure 11. Rearview mirror windward face shunt line drawing.
Applsci 13 10651 g011
Figure 12. Variation of each physical quantity on the windward side of the rearview mirror with streamlines.
Applsci 13 10651 g012
Figure 13. Partial flow diagram of the rearview mirror camera mounting location.
Applsci 13 10651 g013
Figure 14. Variation of each physical quantity at the rearview mirror camera mounting with the streamline.
Applsci 13 10651 g014
Table 1. Setting of boundary conditions.
BoundaryBoundary Condition
InletVelocity inlet, u = 120 km/h
OutletPressure outlet, p = 0 Pa
Calculate the top and side of the domainSymmetrical wall
OthersWall
BoundaryBoundary condition
Table 2. Grid-independent verification.
ParameterOption 1Option 2Option 3Option 4Option 5
Number of grids15.6 million26.1 million32.4 million38.8 million45.6 million
Wind resistance coefficient (simulated value)0.3520.3320.3140.3150.315
Wind resistance coefficient (test value)0.308
Disclaimer/Publisher’s Note: The statements, opinions and data contained in all publications are solely those of the individual author(s) and contributor(s) and not of MDPI and/or the editor(s). MDPI and/or the editor(s) disclaim responsibility for any injury to people or property resulting from any ideas, methods, instructions or products referred to in the content.

