
A Through-Transmission Ultrasonic Method for the Detection of Ferrite Tile Defects
by
 ,
,
Kaiheng Huang
1,
Qiaolin Li
1,*,
Kaixiong Zhu
1,
Baihan Chen
1,
Xiang Qian
1,
Xiaohao Wang
1 and
Xinghui Li
1,2 1
Shenzhen International Graduate School, Tsinghua University, Shenzhen 518055, China
2
Tsinghua-Berkeley Shenzhen Institute, Tsinghua University, Shenzhen 518055, China
*
Author to whom correspondence should be addressed.
Appl. Sci. 2023, 13(20), 11172; https://doi.org/10.3390/app132011172
Submission received: 14 August 2023
/
Revised: 28 September 2023
/
Accepted: 29 September 2023
/
Published: 11 October 2023
(This article belongs to the Topic Advances in Non-Destructive Testing Methods, 2nd Volume)
Abstract
:A through-transmission ultrasonic method is proposed to address limitations in conventional ultrasonic reflection methods for non-destructive testing of ferrite tiles. The method utilizes a dual-probe configuration on both sides of the test piece to measure ultrasonic transmission signals, overcoming issues related to blind zones and orientation limitations in pulse-echo reflection methods. This method demonstrates excellent capabilities for full inspection of internal and external defects in ferrite tiles. Physical field finite element simulations were conducted to analyze detection capabilities and a transmissive testing system is developed based on the simulation results. Experimental validation was performed on artificially manufactured quantified defect samples in aluminum alloy, and the same testing system was applied to evaluate ferrite tile samples. The results confirmed the effectiveness of the system in distinguishing defective (NG) signals from normal defect-free (OK) signals, with a recall rate of at least 95% on samples of various sizes up to 0.1 mm. This research provides insights for quality control and defect detection technology in ferrite tiles.
1. Introduction
Ferrite tiles are critical components in permanent magnet motors [1,2,3]. However, due to their high hardness and brittleness, they are prone to defects during the manufacturing process, which can adversely affect the performance and lifespan of permanent magnet motors. These defects include external flaws such as fractures and burrs, as well as internal flaws like cracks and voids [4,5]. To reduce production costs and improve efficiency, non-destructive testing of internal and external defects in ferrite tiles is required before they are magnetized to become magnetic tile products. In recent years, acoustic vibration methods have been proposed for detecting internal defects in ferrite tiles. For instance, Lu [3] applied acoustic methods to detect internal defects in ferrite tiles by analyzing the sound signals generated when the tiles were impacted by an iron block. Xie et al. [6] investigated the effectiveness of the PCA-SVM (Principal Component Analysis-Support Vector Machines) method based on acoustic resonance for detecting internal defects in ferrite tiles. On the other hand, machine vision methods have been utilized to inspect external defects in ferrite tiles. Xie et al. [1] introduced a feature fusion CNN (Convolutional Neural Networks) to address continuous image defect recognition, while Hu et al. [7] proposed a two-stage detection model called UPM-Dense Net (Upscaled PatchMatch Dense Network) to meet the precision and speed requirements for detecting small defects. Compared to other non-destructive testing methods, ultrasonic inspection offers a simple testing system and strong robustness, making it applicable to a wide range of materials. Consequently, in industrial applications, the ultrasonic test has found extensive use in areas such as detecting internal defects, measuring material properties, and health monitoring [8,9,10]. M. Liu et al. [11] conducted time-domain analysis of the weld defect echo signal of stainless steel pipes according to the weld defect echo signal of stainless steel pipes, compared and analyzed the amplitude changes of different types of weld defect signals, and realized the detection of weld defects. Typically, ultrasonic pulse-echo methods detect sample defects by analyzing the time and frequency domain characteristics of echo signals. For defect detection in ferrite tiles, Cheng et al. [12] developed a pulse-echo-based approach that improved the B-scan (Brightness Scan) imaging and accurate localization of internal defects in the tiles. However, when defects are located near or at the surface of the sample, the impedance mismatch between the probe, sample, and coupling agent leads to strong surface echoes, making defect detection challenging [13,14]. As a result, ultrasonic pulse-echo methods have limitations in terms of detection accuracy and sample structures [15]. In the realm of ultrasonic testing (UT), ultrasonic transmission emerges as a defect detection technique that overcomes the limitations of traditional methods, allowing for the inspection of near-surface and surface defects and the measurement of various material properties. Several studies both domestically and internationally have utilized ultrasonic transmission methods for defect detection and measurement [16,17,18,19,20,21]. For instance, Wang [22] employed ultrasonic transmission for defect detection in complex curved resin-based composite materials, demonstrating the capability of the ultrasonic transmission method to detect bending composite parts with the aid of an automatic robot inspection system. These research outcomes suggest that ultrasonic transmission method has the potential for comprehensive defect inspection of both internal and external defects in ferrite tiles.
The ultrasonic echo test of ferrite tiles posed several challenges during the experiments. These challenges included the high damping attenuation in ferrite tiles, leading to weak echo signals and a low signal-to-noise ratio in the pulse-echo method. Moreover, the pulse-echo method exhibited more pronounced blind zones in small-sized ferrite tile samples, making defect detection difficult. Additionally, the detection of common longitudinal cracks in ferrite tiles was hindered by the influence of defect orientation. To address these difficulties, a water-immersion ultrasonic transmission method for ferrite tiles is proposed. The effectiveness of this method is validated through finite element simulation, test system design, and experimental verification. By utilizing the ultrasonic transmission method, the paper overcomes the limitations of the conventional pulse-echo method and provides a promising solution for comprehensive defect detection in both the internal and external regions of ferrite tiles.
2. Principle of Defect Detection by Liquid-Immersed Ultrasonic Transmission Method
The ultrasonic transmission method is a detection method developed based on the loss of ultrasonic waves in the medium, including the phenomena of absorption of sound waves, dissipation, scattering at interfaces, and attenuation of the diffusion of the sound beam. During the measurement, a pair of transmitting probes and receiving transducers are placed on both sides of the sample to be measured. When a piezoelectric crystal inside the transmitting probe is excited by a pulsed voltage, pulsed ultrasonic waves propagate through the sample. A focusing transducer was employed in the transmitting probe for the focus of the ultrasonic beam. This is achieved by applying an acoustic lens, which increases the sound intensity inside the sample and therefore the signal-to-noise ratio. When ultrasound is applied to the non-destructive testing of internal defects, the main consideration is the scattering and attenuation of the defects encountered by the ultrasound waves during propagation. As shown in Figure 1, ultrasonic waves are emitted from the transmitting probe at an angle perpendicular to the sample surface and propagate into the sample through the coupling agent water. When the ultrasonic wave encounters a defect during the propagation of the sample under test, a portion of the ultrasonic wave will be lost at the junction of the sample and the defect, i.e., between different media, and a certain range of masking will be formed behind the defect. According to the loss of ultrasonic energy, it is then possible to determine the presence and size of defects, including internal and external defects.
The ultrasonic signal propagated through the coupling agent can be distinguished from the ultrasonic signal propagated through the solid sample. Because the speed of sound in a solid, such as a ferrite tile, is about 6700 m/s at room temperature of 25 °C, which is significantly higher than the speed of sound in a liquid, such as water, which is about 1500 m/s, the time of flight (TOF) for propagating the same distance of sound waves in a ferrite tile is only 1/4 of that in a water medium, resulting in the received signals showing a significant difference in the time domain. Based on the cleaning requirements after sample testing and the principle of acoustic impedance matching, the coupling agent was selected as water.
Ultrasonic waves can be regarded as linear propagation in an isotropic ideal medium, following the geometric acoustic law. Let the initial sound pressure , the received sound pressure is , the ultrasonic angular frequency is , the imaginary number unit is j and the wave number be , respectively. The ultrasonic sound pressure p at the sound range r is
The transmittance T of ultrasonic waves between a medium with acoustic impedances is
The acoustic transmittance decreases with the increase of the acoustic impedance difference between the two sides of the dielectric interface. To ensure the sufficient intensity of acoustic transmission into the sample, it is necessary to match the acoustic impedance of the medium on both sides of the interface, so it is necessary to insert the liquid coupler with large acoustic impedance between the probe and the sample.
As the thickness of the thin-walled sample is less than the diameter of the probe, the perforated circular hole defect is regarded as a rigid sphere with radius a. The direction of the incident sound wave is the positive direction of θ. The wave equation of sound wave propagation is , then the far-field scattered sound pressure at a distance of r from the defect can be calculated by Equation (3) where j is the imaginary number unit, and R(θ) is the directionality function of the scattered sound field [23,24]:
The size of the R(θ) function is determined by the defect size parameter ka, which is a dimensionless parameter characterizing the defect size relative to the wavelength, expressed as shown in Equation (4) where is the Legendre polynomial:
Therefore, in an ideal isotropic medium, the sound pressure received by the probe is approximately:
From the formula: with the increase of the defect size, the scattered acoustic field acoustic wave sound pressure increases. Therefore, defects can be identified from the signal energy when the transmitted signal energy appears to be significantly weakened. The signal energy is defined as:
The signal energy is the integral of the square of the sound pressure received by the probe, and the sampling in practice is the amplitude of the sampling point of the transmitted signal. When an ultrasonic wave encounters the interface between the medium transition in defects and samples, interactions such as attenuation and diffraction occur, which will further reduce the signal energy of the transmitted acoustic wave propagation. Therefore, it can be concluded that when the cross-sectional area of the defect is larger, the sound pressure of the ultrasonic transmitted signal is smaller. By comparing the energy of the acoustic signal, the defects and their sizes in the sample can be detected.
Based on the above conclusions, a device for detecting internal and external defects of magnetic tile samples by immersion focused transmission method is developed in this paper. Its characteristics include: the ultrasonic transmission method using one end to emit a specific frequency of ultrasonic waves, the other end to receive the corresponding sound waves, according to the waveform diagram to judge the presence and size of defects; the transmitting probe, the sample under test, and the receiving probe are immersed in the coupler to reduce the loss of ultrasonic waves between the air and the interface of the workpiece under test. This will be beneficial to the acquisition signal processing of transmitted sound waves, including filtering of transmitted wave signals in the time-frequency domain, peak extraction and so on.
3. Numerical Modeling
3.1. Establishment of Simulation Model
To assess the feasibility of ultrasonic detection for internal defects, this study employed COMSOL Multiphysics v.6 software for modeling the water-immersion ultrasonic inspection method [25,26,27,28,29]. In the physical field modeling, the pressure acoustics time-domain explicit physics interface was chosen for simulation modeling. The schematic representation of the overall simulation model is shown in Figure 2. Due to the symmetry of the entire model, the geometric model was set as an axisymmetric model to reduce computational time and memory requirements. The model was divided into three parts, namely, A, B, and C. Part A comprised the ultrasonic emission source and the coupling water layer. Part B represented the 3033 aluminum alloy test material with internal defects, with dimensions of 10 mm × 42 mm. Part C consisted of the coupling agent layer and the ultrasonic wave receiving transducer. The coupling material was set as water, and the thickness of the coupling layer was set at 3.5 mm. The outer side of the transmission model is completely enclosed by the ideal absorbing layer to prevent the reflection phenomenon in the boundary of the local model, and the simulated sample domain and the coupling domain extend indefinitely in this direction.
The excitation signal equation was defined as follows:
where is the period of the ultrasonic wave, and is the frequency of the ultrasonic wave.
The ultrasonic frequency was set at 10 MHz, and the defect diameter ranged from 0.1 mm to 1.2 mm. The simulation time step was set at 1/10 of the ultrasonic signal period, i.e., 0.2 μs, to ensure sufficient sampling of the ultrasonic transmission signal.
3.2. Analysis of Simulation Results
3.2.1. Ultrasonic Wave Propagation in the Medium
Figure 3 shows the propagation of ultrasonic waves in different periods in the medium when detecting a circular cavity. It can be seen from the figure that the longitudinal wave and Rayleigh wave are generated and propagated together when ultrasonic wave occurs, and the longitudinal wave propagates along the normal direction with the fastest velocity. At the interface between water and the part to be tested, the ultrasonic wave is partially reflected. Because the pressure acoustic physical field interface is used to deal with the ultrasonic wave propagation in the solid, the shear wave generated by waveform conversion cannot be seen. While the longitudinal wave continues to propagate forward, the echo on the upper surface of the aluminum alloy block also oscillates back and forth in the coupled water layer and partially enters the aluminum alloy block. These waveforms will lead to the detection of different strong and weak waveforms at different times when the transmitted wave is detected. The wavelength of ultrasonic waves in aluminum alloy medium is 2.5 mm. Figure 3d shows that when it meets the circular hole defect with a diameter of 0.8 mm during its propagation, part of the reflection occurs, which leads to the reduction of the transmitted wave energy compared with that without the defect.
3.2.2. Detection Results of Different Defects at Different Locations
The simulation calculation was carried out by changing the defect diameter from 0.4 mm, 0.6 mm, 0.8 mm, 1.0 mm, 1.2 mm and the defect depth from 7 mm, 14 mm, 21 mm, 28 mm, and 35 mm. The simulation results are shown in Figure 4. The range of the first signal peak of the transmitted energy is integrated by the square of the sound pressure. It can be seen that when the defect position is unchanged, the transmission detection results of each depth independently indicated that the larger the defect diameter, the smaller the detected transmission amplitude and energy. There is a significant linear relationship between the ultrasonic energy attenuation and the size of the defect, which is consistent with the theoretical calculation results in Section 2. The principle of flooding ultrasonic transmission method for defect detection is based on this law, and the size of the defect is determined by the attenuation of energy.
4. Design and Experimentation of the Ultrasonic Transmission System
4.1. Design of Defect Detection System
The functional requirements of the detection system include aligning the probe to the fixed sample position, transmitting and acquiring ultrasonic signals, and processing the ultrasonic signals for defect assessment. As shown in Figure 5, to meet these system functions, the ultrasonic transmission inspection system consists of three parts: an automated ultrasonic wave emission and reception system, a fixture assembly, and a data post-processing system.
The ultrasonic wave emission and reception system consist of a 100 MHz data acquisition card, a DPR300 ultrasonic pulse generator and receiver, and two 10 MHz focused probes. The two probes operate in a send-receive mode, where one probe is used to transmit ultrasonic signals through the tested sample and the other to receive and convert the transmitted ultrasonic signals into electrical signals. The ultrasonic receiver sends the data to the acquisition card and converts it into digital signals. The probes and fixture assembly are immersed in coupling agent to reduce the acoustic impedance between the probes and the sample.
As shown in Figure 6, the fixture assembly includes three parts: the base, the probe holder, and the sample holder. The base provides support and has two through-slides in different directions, restricting the movement of the holders to specific directions. The probe holder consists of rails of different heights and a probe fixture, which elevates the probes to a certain height and aligns them with each other, with the ability to adjust the distance between the probes. The sample holder also consists of rails of different heights and a probe fixture, with the rails oriented perpendicular to those of the probe holder, allowing the adjustment of the sample height to align the test area with the centerline of the probes. Each fixture can slide horizontally to adjust the horizontal position of the test sample.
The system achieves precise alignment of the transmitting probe, defect, and receiving probe, as well as the ability to quickly adjust the scanning position in the ultrasonic transmission defect detection system, by organically connecting the components of the fixture system through the slides.
The data post-processing system consists of a personal computer that utilizes a differential peak-seeking algorithm to determine the positions of the wave peaks, locate the ultrasonic transmission signal peaks, and calculate the energy of the sample signals.
4.2. Experimental Operation and Data Processing
The experimental procedure is as follows: firstly, the sample is securely fixed with the probe using a fixture, ensuring precise alignment between the probe and the sample. Next, the PC data acquisition program and motion platform are activated to scan the sample surface and collect data to obtain ultrasonic transmission signals. By analyzing the signals, the sample intervals are determined, and their energy characteristics are computed.
As shown in Figure 7, the analysis of ultrasonic transmission signals reveals their components and sources: part 1 corresponds to the emission signature generated by circuit coupling, indicating the initiation of ultrasonic wave transmission. Part 2 represents the sample transmission signal, which is the ultrasonic wave signal passing through the sample and coupling agent via the shortest path during transmission. Its energy reflects the presence of obstacles in the transmission path. Therefore, calculating the total energy of the transmission signal provides the ultrasonic transmission energy of the sample. The signals that appear between the second and the third part are generated by ultrasonic waves repeatedly reflecting between the sidewall and surface of the measured sample, forming a series of gradually decreasing signal peaks. This part of the signal is categorized into delayed waves and triangular echoes based on their generation causes [30]. Due to the prolonged transmission path, they appear later than the second part. Part 3 corresponds to the water transmission signal. This signal is formed when ultrasonic waves only pass through the coupling medium without entering the sample for propagation, as water has a slower sound velocity compared to the solid sample, resulting in a delayed appearance.
The energy of the ultrasonic transmission signal from each emission is defined as the square of the integral of the amplitude of the signal peak in the transmission signal. Comparing the energy of the sample’s transmission signal peaks with that of intact samples from the same batch can reveal the presence of defects. Since ultrasonic waves undergo multiple reflections and superimpose at the probe-water interface and sample-water interface, only the first received transmission signal peak in the time domain is considered for energy calculation, as it is less affected by interference compared to other multiply-reflected ultrasonic signals. This signal is generated by ultrasonic waves propagating along the shortest path between the probes, experiencing less interference compared to other multiply-reflected ultrasonic signals.
4.3. Experimental Results
4.3.1. Transmission Test of Aluminum Alloy Sample
The purpose of the ultrasonic transmissive experiments is to validate the detection sensitivity and capability of the proposed ultrasonic transmissive method for external defect detection. Precise cavities of varying sizes and depths were fabricated to simulate internal defects, and the defect detection system’s ability to detect defects of different sizes was tested. The ferrite tiles have a sound impedance of 28.3. Among commonly used CNC machining materials, as shown in Table 1, the aluminum alloy exhibits similar acoustic properties, with sound impedance and velocity relatively close to those of ferrite tiles. Therefore, the aluminum alloy was used to quantitatively validate the defect detection pattern using the ultrasonic transmissive method.
The first set of experiments focused on artificially created aluminum alloy samples with defects. Circular hole defects of different depths (7 mm, 14 mm, 21 mm, 28 mm, and 35 mm) were CNC-machined at five equidistant points along the depth. The distribution of defects by depth and an example can be seen in Figure 8 below. The defect sizes were 0.4 mm, 0.6 mm, 0.8 mm, 1.0 mm, and 1.2 mm. Transmissive experiments were conducted on aluminum alloy samples with different defect sizes at the same depth to test the detection capability under various depth conditions and verify the simulation conclusions. Additionally, based on the machining conditions, a set of extremely small defect samples with a minimum defect diameter of 0.1 mm was prepared. These samples contain near-surface defects, with defect depths of 3 mm or shallower, resulting in the overlap of ultrasonic pulse echo signals with surface echoes, creating a near-surface detection blind zone. These samples were used to evaluate the ultrasonic transmissive method’s capability to detect near-surface defects.
By performing ultrasonic A-scans (Amplitude Scan) on the defect-containing regions of the samples, the transmission energy of ultrasonic waves was measured. Figure 9 shows the experimental results of signal energy variation with defect radius for each depth, including near surface depth. As shown in the figure, the regularity is observed that as the defect size increases, the transmission signal energy decreases at all depths. The correlation coefficients between the defect diameter and transmission signal energy are both above 0.97, indicating a significant correlation between the two parameters. The attenuation functions of transmission signal energy at all depths have a correlation greater than 0.975 with the simulation results. The maximum residual difference between the measured normalized transmission energy and the predicted value from the simulated fitted curve is 0.12, and this maximum is from samples with a radius of 0.5 mm in the depth = 21 mm group. This discrepancy might be attributed to the metal block’s rust formation due to prolonged immersion in water and the potential errors in the CNC machining of the defects.
The experimental results demonstrate a significant difference in transmission signal energy between defect-free and defective samples, allowing for defect detection and identification of defect sizes. Comparing the transmission signal energy of extremely small defect samples with the simulation results, a strong linear relationship between the energy and defect size is observed. The transmitted signal energy measured from the aluminum alloy sample is linearly fitted, and the residual difference between the measured attenuation slope and the simulated attenuation line is obtained by comparing the measured and simulated fitting lines. The calculated results show that the experimental data align well with the theoretical simulation model, with the maximum difference between the measured attenuation slope and the residual of the simulated attenuation line being 0.05. These findings validate the capability of ultrasonic transmissive method in detecting and determining defect sizes within the blind zone of the reflection method.
4.3.2. Transmission Experiment of Ferrite Tiles
The second set of experiments involved testing ferrite tile samples provided by the factory. Examples of ferrite tiles with internal defects and external defects are shown in Figure 10a,b respectively. The test group comprised a batch of ferrite tiles with both external and internal defects, alongside a batch of defect-free ferrite tiles. The defect types observed in the ferrite tiles were external cracks, external fractures, and internal cracks. Initially, transmission experiments were conducted on 54 defect-free ferrite tiles, and their ultrasonic transmission signals were collected. The threshold for defect-free ferrite tiles was calculated using the 3σ significance principle. The transmission energy of the tiles under inspection was measured and compared to the transmission energy of the defect-free ferrite tiles. Any ferrite tile with transmission energy below three times the standard deviation of the defect-free tiles was classified as defective.
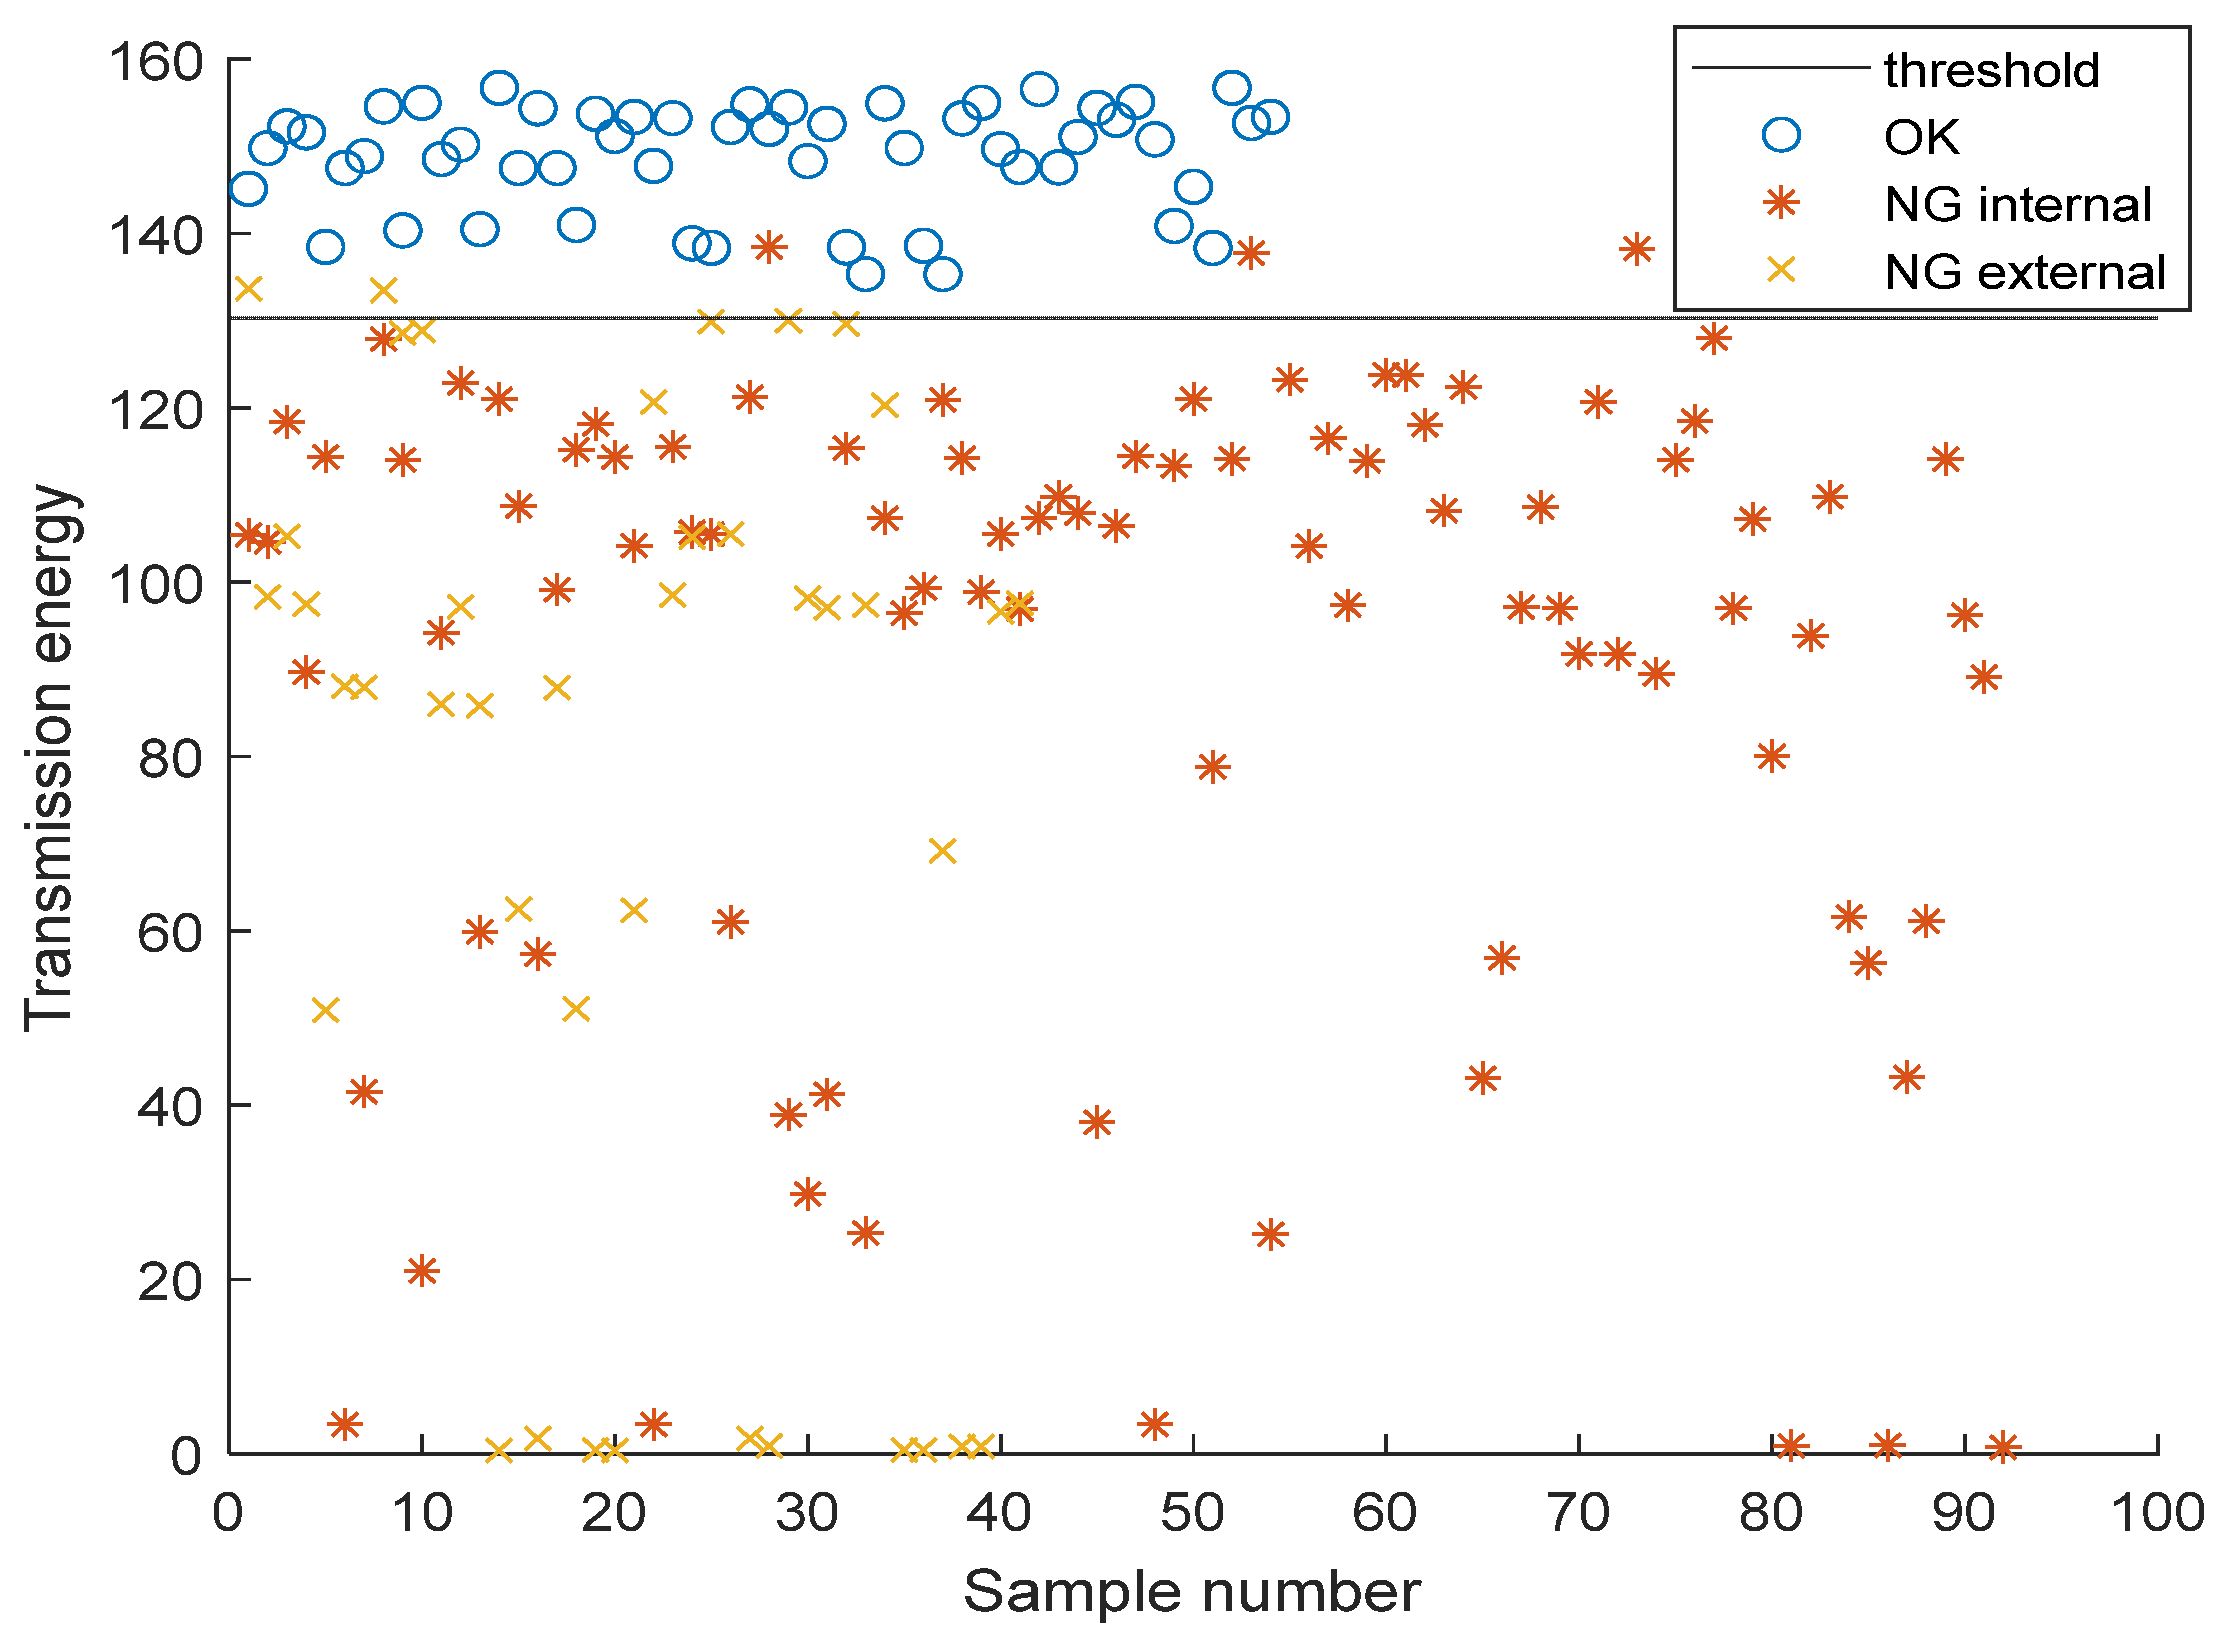
The transmission energy of 54 defect-free ferrite tiles was measured for calibration. During the experiment, the probe was aligned to the same position on the ferrite tiles to measure the ultrasonic transmission energy. The mean transmission energy of the defect-free ferrite tiles was determined as 148.7866, with a variance of 6.1653. Based on the 3σ significance principle in mathematics, the lower limit of the 99.73% confidence interval for the transmission energy of defect-free tiles was calculated as 130.2907. Any measurement result below this threshold was considered significantly deviated from the batch of samples, thus allowing for the calculation of whether the transmission energy of the tested samples was significantly lower than that of the defect-free ferrite tiles. Samples with energy below the threshold were classified as defective.
The inspection group measured the transmission energy of 92 internal defective samples and 41 external defective samples using the ultrasonic transmission method. By comparing these measurements with the threshold determined from OK ferrite tiles, as shown in Figure 11. The threshold values well separate the OK sample from the NG sample. The detection rate for internal defects reached 96.74%, while for external defects, it reached 95.12%.
Both experiments conducted on aluminum alloy and ferrite tiles verified the feasibility of using ultrasonic transmission for full defect detection of both internal and external defects. The method exhibited high sensitivity in detecting defects in artificially controlled samples and showed good fitting with simulation results. Moreover, in real samples, it achieved high recall rates for samples containing both internal and external defects.
5. Conclusions
A water-immersion through-transmission ultrasonic testing method is proposed for the simultaneous detection of internal and external defects in metals and ferrite tiles. The principle of ultrasonic wave transmission is analyzed, and numerical approximations are used to calculate the energy variation of ultrasonic waves propagating through samples containing internal defects, providing a theoretical basis for defect analysis and probe positioning in subsequent simulations and analyses. The simulation results show that the variation of transmitted wave sound pressure can be used to determine the presence of defects and analyze their equivalent size. A measurement system is constructed, and experiments are conducted to further validate the capability of the water-immersion focused ultrasonic transmission method in detecting micro-cracks on ferrite tile surfaces and circular hole defects in processed aluminum alloy samples. Compared with the commonly used pulse-echo method, this approach exhibits a smaller blind zone and higher sensitivity, enabling effective detection of surface and internal defects, and significant potential is demonstrated for various applications.
However, this method also has some certain limitations, such as the inability to measure the depth of the defect. Further improvement will be carried out as follows: a combined ultrasonic transmission method and traditional pulse echo method to realize full detection of internal and external defects as well as the depth of internal defects.
Author Contributions
Conceptualization, K.H. and Q.L.; Methodology, Q.L. and K.Z.; Software, K.Z.; Formal analysis, Q.L.; Investigation, K.H.; Resources, X.W.; Data curation, B.C.; Writing original draft, K.H.; Writing; Review & Editing, Q.L. and X.L.; Visualization, X.Q.; Supervision, Q.L. and X.W.; Project administration, X.L.; Funding acquisition, X.L. All authors have read and agreed to the published version of the manuscript.
Funding
This research was funded by Tsinghua University Shenzhen International Graduate School Research Start-up Fund, grant number QD2020001N; Tsinghua University Shenzhen International Graduate School Interdisciplinary Research and Innovation Fund, grant number JC2021003.
Institutional Review Board Statement
Not applicable.
Informed Consent Statement
Not applicable.
Data Availability Statement
Data are available upon request from the corresponding author.
Acknowledgments
The author would like to thank Zhihan Intelligent Manufacturing Co., Ltd. for providing samples for the experiment, and thank Li Liang for taking X-ray pictures of the magnetic tile samples.
Conflicts of Interest
The authors declare no conflict of interest.
References
- Xie, L.; Xiang, X.; Xu, H.; Wang, L.; Lin, L.; Yin, G. FFCNN: A Deep Neural Network for Surface Defect Detection of Magnetic Tile. IEEE Trans. Ind. Electron. 2020, 68, 3506–3516. [Google Scholar] [CrossRef]
- Huang, Q.; Yin, Y.; Yin, G. Automatic classification of magnetic tiles internal defects based on acoustic resonance analysis. Mech. Syst. Signal Process. 2015, 60–61, 45–58. [Google Scholar] [CrossRef]
- Lu, H.; Zhu, Y.; Yin, M.; Yin, G.; Xie, L. Multimodal Fusion Convolutional Neural Network With Cross-Attention Mechanism for Internal Defect Detection of Magnetic Tile. IEEE Access 2022, 10, 60876–60886. [Google Scholar] [CrossRef]
- Wei, J.; Zhu, P.; Qian, X.; Zhu, S. One-stage object detection networks for inspecting the surface defects of magnetic tiles. In Proceedings of the 2019 IEEE International Conference on Imaging Systems and Techniques (IST), Abu Dhabi, United Arab Emirates, 9–10 December 2019; pp. 1–6. [Google Scholar] [CrossRef]
- Cao, X.; Yao, B.; Chen, B.; Wang, Y. Multi-defect detection for magnetic tile based on SE-U-Net. In Proceedings of the 2020 IEEE International Symposium on Product Compliance Engineering-Asia (ISPCE-CN), Chongqing, China, 6–8 November 2020; pp. 1–6. [Google Scholar] [CrossRef]
- Xie, L.; Yin, M.; Huang, Q.; Zhao, Y.; Deng, Z.; Xiang, Z.; Yin, G. Internal defect inspection in magnetic tile by using acoustic resonance technology. J. Sound Vib. 2016, 383, 108–123. [Google Scholar] [CrossRef]
- Hu, C.; Liao, H.; Zhou, T.; Zhu, A.; Xu, C. Online recognition of magnetic tile defects based on UPM-DenseNet. Mater. Today Commun. 2022, 30, 103105. [Google Scholar] [CrossRef]
- Yin, J.; Chen, S.; Wong, V.-K.; Yao, K. Thermal Sprayed Lead-Free Piezoelectric Ceramic Coatings for Ultrasonic Structural Health Monitoring. IEEE Trans. Ultrason. Ferroelectr. Freq. Control 2022, 69, 3070–3080. [Google Scholar] [CrossRef] [PubMed]
- Ozsoy, U.; Koyunlu, G.; Ugweje, O.C.; Dayyabu, A. Nondestructive testing of concrete using ultrasonic wave propagation. In Proceedings of the 2017 13th International Conference on Electronics, Computer and Computation (ICECCO), Abuja, Nigeria, 28–29 November 2017; pp. 1–5. [Google Scholar] [CrossRef]
- Mondal, S.; Datta, D. Ultrasonic Monitoring of Hardness of Industrial Rubbers. In Proceedings of the 2019 8th International Conference on Modeling Simulation and Applied Optimization (ICMSAO), Manama, Bahrain, 15–17 April 2019; pp. 1–6. [Google Scholar] [CrossRef]
- Liu, M. Ultrasonic Inspection And Defect Identification of Thin—Walled Stainless Steel Welded Pipe Weld. In Proceedings of the 2022 9th International Forum on Electrical Engineering and Automation (IFEEA), Zhuhai, China, 4–6 November 2022; pp. 995–998. [Google Scholar] [CrossRef]
- Cheng, Z.; Zhu, K.; Li, X.; Qian, X. Detection of Internal Defects Based on Empirical Mode Decomposition and Wavelets Denoising. In Proceedings of the 2021 IEEE Industrial Electronics and Applications Conference (IEACon), Penang, Malaysia, 22–23 November 2021; pp. 302–307. [Google Scholar] [CrossRef]
- Case, T.; Waag, R. Flaw identification from time and frequency features of ultrasonic waveforms. IEEE Trans. Ultrason. Ferroelectr. Freq. Control 1996, 43, 592–600. [Google Scholar] [CrossRef]
- Medak, D.; Posilovic, L.; Subasic, M.; Budimir, M.; Loncaric, S. Automated Defect Detection From Ultrasonic Images Using Deep Learning. IEEE Trans. Ultrason. Ferroelectr. Freq. Control 2021, 68, 3126–3134. [Google Scholar] [CrossRef]
- Li, K.; Wu, Y.; Guo, D.; Que, K.; Chen, B. A new method of ultrasonic featured-scan for composite materials. In Proceedings of the 2011 International Symposium on Applications of Ferroelectrics (ISAF/PFM) and 2011 International Symposium on Piezoresponse Force Microscopy and Nanoscale Phenomena in Polar Materials, Vancouver, BC, Canada, 24–27 July 2011; pp. 1–3. [Google Scholar] [CrossRef]
- Suryawanshi, V.J.; Pawar, A.C.; Palekar, S.P.; Rade, K.A. Defect detection of composite honeycomb structure by vibration analysis technique. Mater. Today Proc. 2020, 27, 2731–2735. [Google Scholar] [CrossRef]
- Benavente, D.; Galiana-Merino, J.; Pla, C.; Martinez-Martinez, J.; Crespo-Jimenez, D. Automatic detection and characterisation of the first P- and S-wave pulse in rocks using ultrasonic transmission method. Eng. Geol. 2020, 266, 105474. [Google Scholar] [CrossRef]
- Bang, S.J.; Song, D.G.; Jhang, K.Y. Comparisons of second- and third-order ultrasonic nonlinearity param-eters measured using through-transmission and pulse-echo methods. NDT E Int. 2023, 133, 102757. [Google Scholar] [CrossRef]
- Miyamoto, R.; Mizutani, K.; Ebihara, T.; Wakatsuki, N. Defect detection and size estimation in billet from profile of time-of-flight using ultrasonic transmission method with linear scanning. Jpn. J. Appl. Phys. 2015, 54, 07HC11. [Google Scholar] [CrossRef]
- Zhu, J.; Lin, Y.; Wang, B.; Wen, J.; Tian, R. Study on ultrasonic attenuation characteristics in air-droplet two-phase flow. Ann. Nucl. Energy 2023, 185, 109742. [Google Scholar] [CrossRef]
- Liu, H.; Tan, C.; Dong, F. Improved Amplitude Extraction Method for Attenuation Reconstruction of Transmissive Ultrasonic Tomography. In Proceedings of the 2022 IEEE International Instrumentation and Measurement Technology Conference (I2MTC), Ottawa, ON, Canada, 16–19 May 2022; pp. 1–6. [Google Scholar] [CrossRef]
- Wang, H.B. Study on Key Techniques of Ultrasonic Nondestructive Testing Composite Parts. Ph.D. Thesis, Beijing Institute of Technology, Beijing, China, 2014. [Google Scholar]
- Song, Y.Y.; Su, M.X.; Cai, X.S.; Shen, J.Q.; Xue, M.H. Computation of Acoustic Scattering by Rigid Particles by the Boundary Element Method. Chin. J. Process Eng. 2009, 9, 107–111. [Google Scholar]
- Huang, D.-H.; Liao, C.-K.; Wei, C.-W.; Li, P.-C. Simulations of optoacoustic wave propagation in light-absorbing media using the finite difference time-domain method. In Proceedings of the IEEE Ultrasonics Symposium, 2004, Montreal, QC, Canada, 23–27 August 2004. [Google Scholar] [CrossRef]
- Schwartz, H.; Pineau, J.-P.; Feuillard, G.; Prax, C.; Valiere, J.-C. Development of flow characterization system using ultrasonic methods. In Proceedings of the 2012 IEEE International Ultrasonics Symposium, Dresden, Germany, 7–10 October 2012; pp. 1–4. [Google Scholar] [CrossRef]
- Fang, L.; Yu, X.; Zeng, Q.; Zhao, N.; Li, X. Excitation Characteristics of Ultrasonic Probe. In Proceedings of the 2019 IEEE International Instru-mentation and Measurement Technology Conference (I2MTC), Auckland, New Zealand, 20–23 May 2019; pp. 1–6. [Google Scholar]
- Pereira, D.; Le Duff, A.; Painchaud-April, G.; Belanger, P. Simulation-Based Inversion for the Characterization of Adhe-sively Bonded Joints Using Ultrasonic Guided Waves. IEEE Trans. Ultrason. Ferroelectr. Freq. Control 2022, 69, 2400–2407. [Google Scholar] [CrossRef] [PubMed]
- Wang, M.; Zheng, D. Simulation Research on Liquid Film Thickness of Horizontal Gas-liquid Two-phase Flow Based on Ultrasonic Method. In Proceedings of the 2021 40th Chinese Control Conference (CCC), Shanghai, China, 26–28 July 2021. [Google Scholar] [CrossRef]
- Cheng, J.; He, C.; Lyu, Y.; Zheng, Y.; Xie, L.; Wu, L. Ultrasonic inspection of the surface crack for the main shaft of a wind turbine from the end face. NDT E Int. 2020, 114, 102283. [Google Scholar] [CrossRef]
- Dong, J.B.; Gao, H.B.; Zhang, S.J. Simulation Research and Experimental Verification of Non-defect Echoes by Ultra-sonic Testing. Res. Explor. Lab. 2022, 41, 110–116. [Google Scholar]
Figure 1.
Focusing liquid immersion ultrasonic transmission detection method; (a) system diagram (b) the basis for judging defects.
Figure 1.
Focusing liquid immersion ultrasonic transmission detection method; (a) system diagram (b) the basis for judging defects.
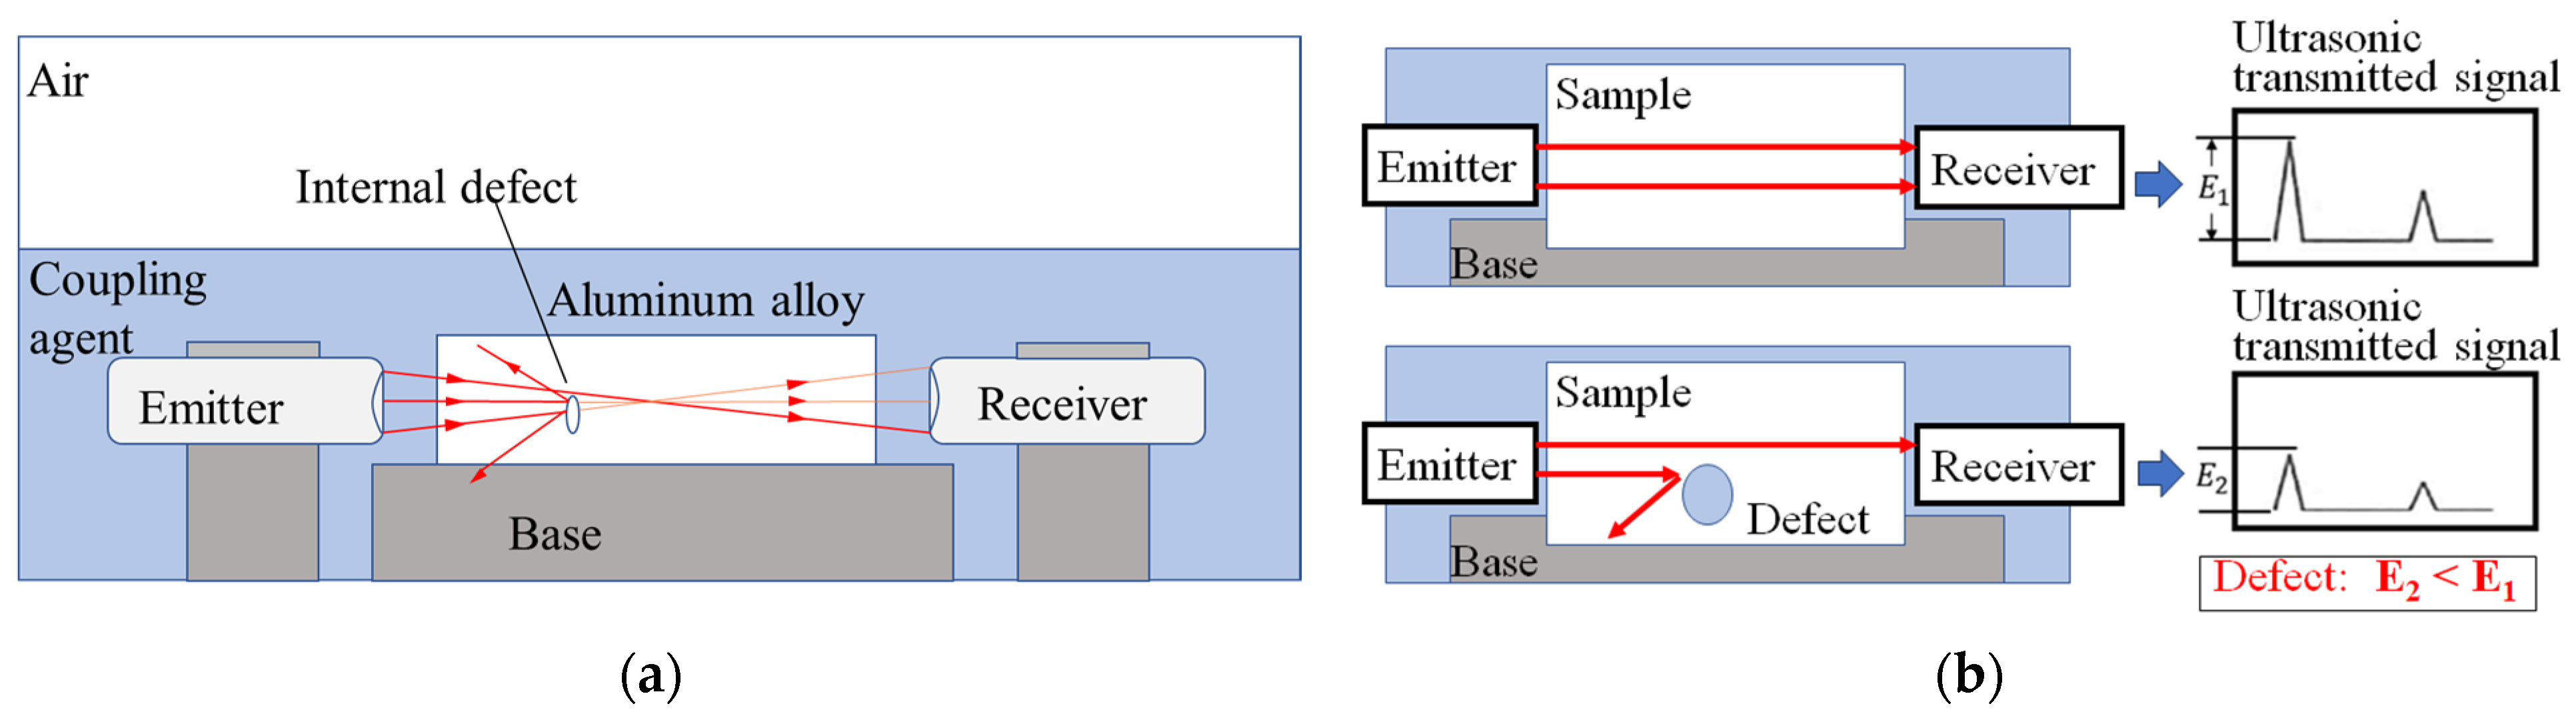
Figure 2.
Internal defect detection model by liquid immersion ultrasonic transmission.
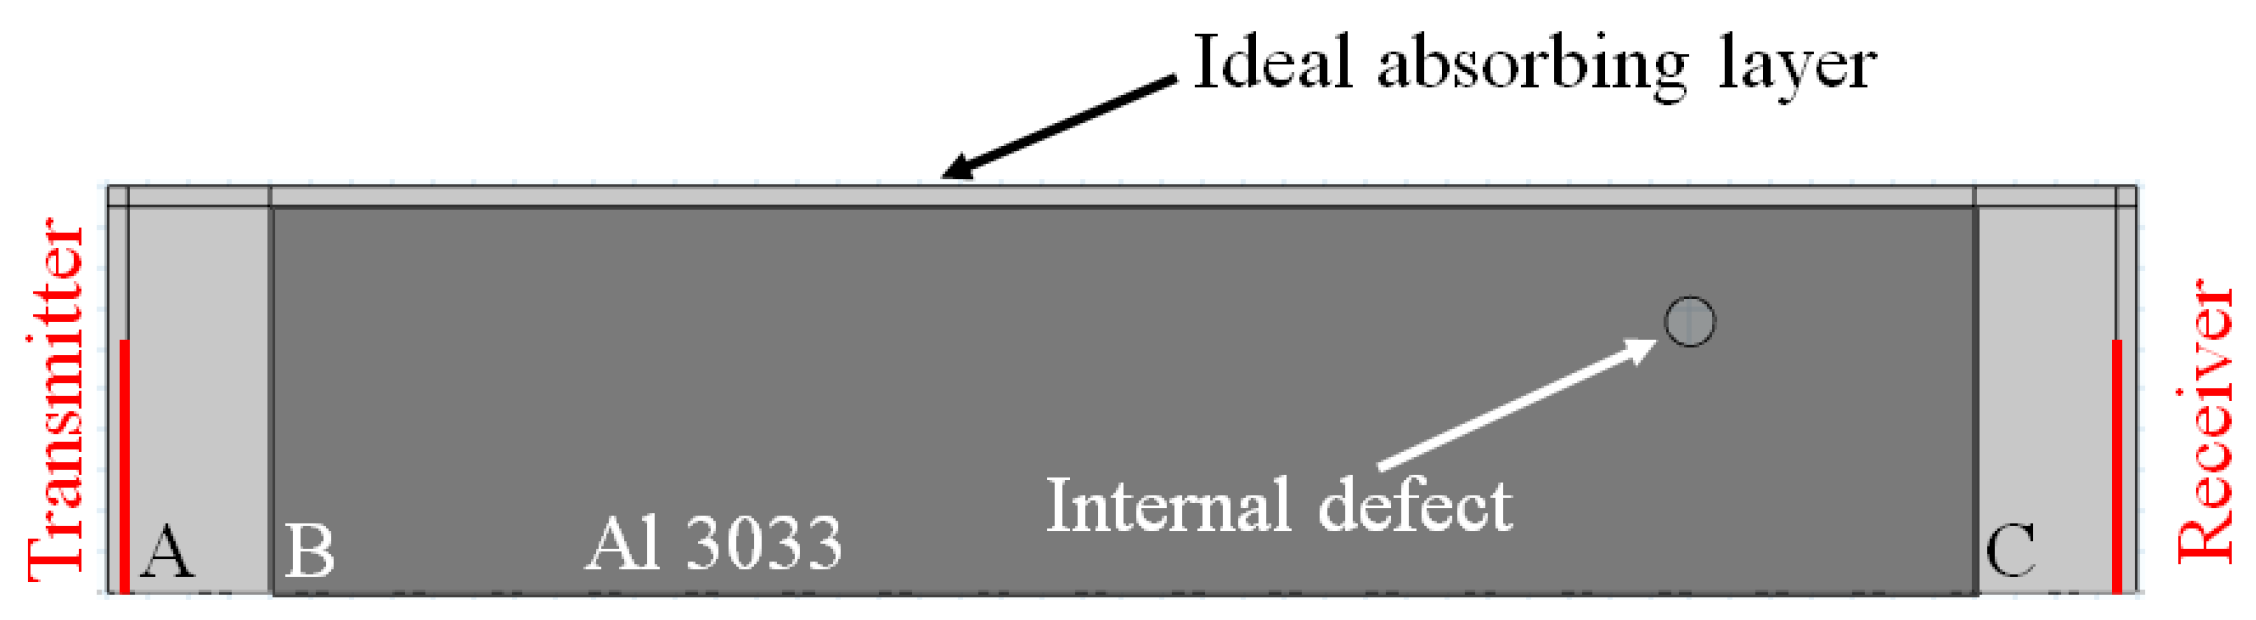
Figure 3.
Sound pressure distribution of ultrasonic wave in the medium at different times: (a) 1.4 μs; (b) 4 μs; (c) 6.4 μs; (d) 9.0 μs; (e) 11.8 μs. Rayleigh waves (R wave), longitudinal waves (L wave).
Figure 3.
Sound pressure distribution of ultrasonic wave in the medium at different times: (a) 1.4 μs; (b) 4 μs; (c) 6.4 μs; (d) 9.0 μs; (e) 11.8 μs. Rayleigh waves (R wave), longitudinal waves (L wave).
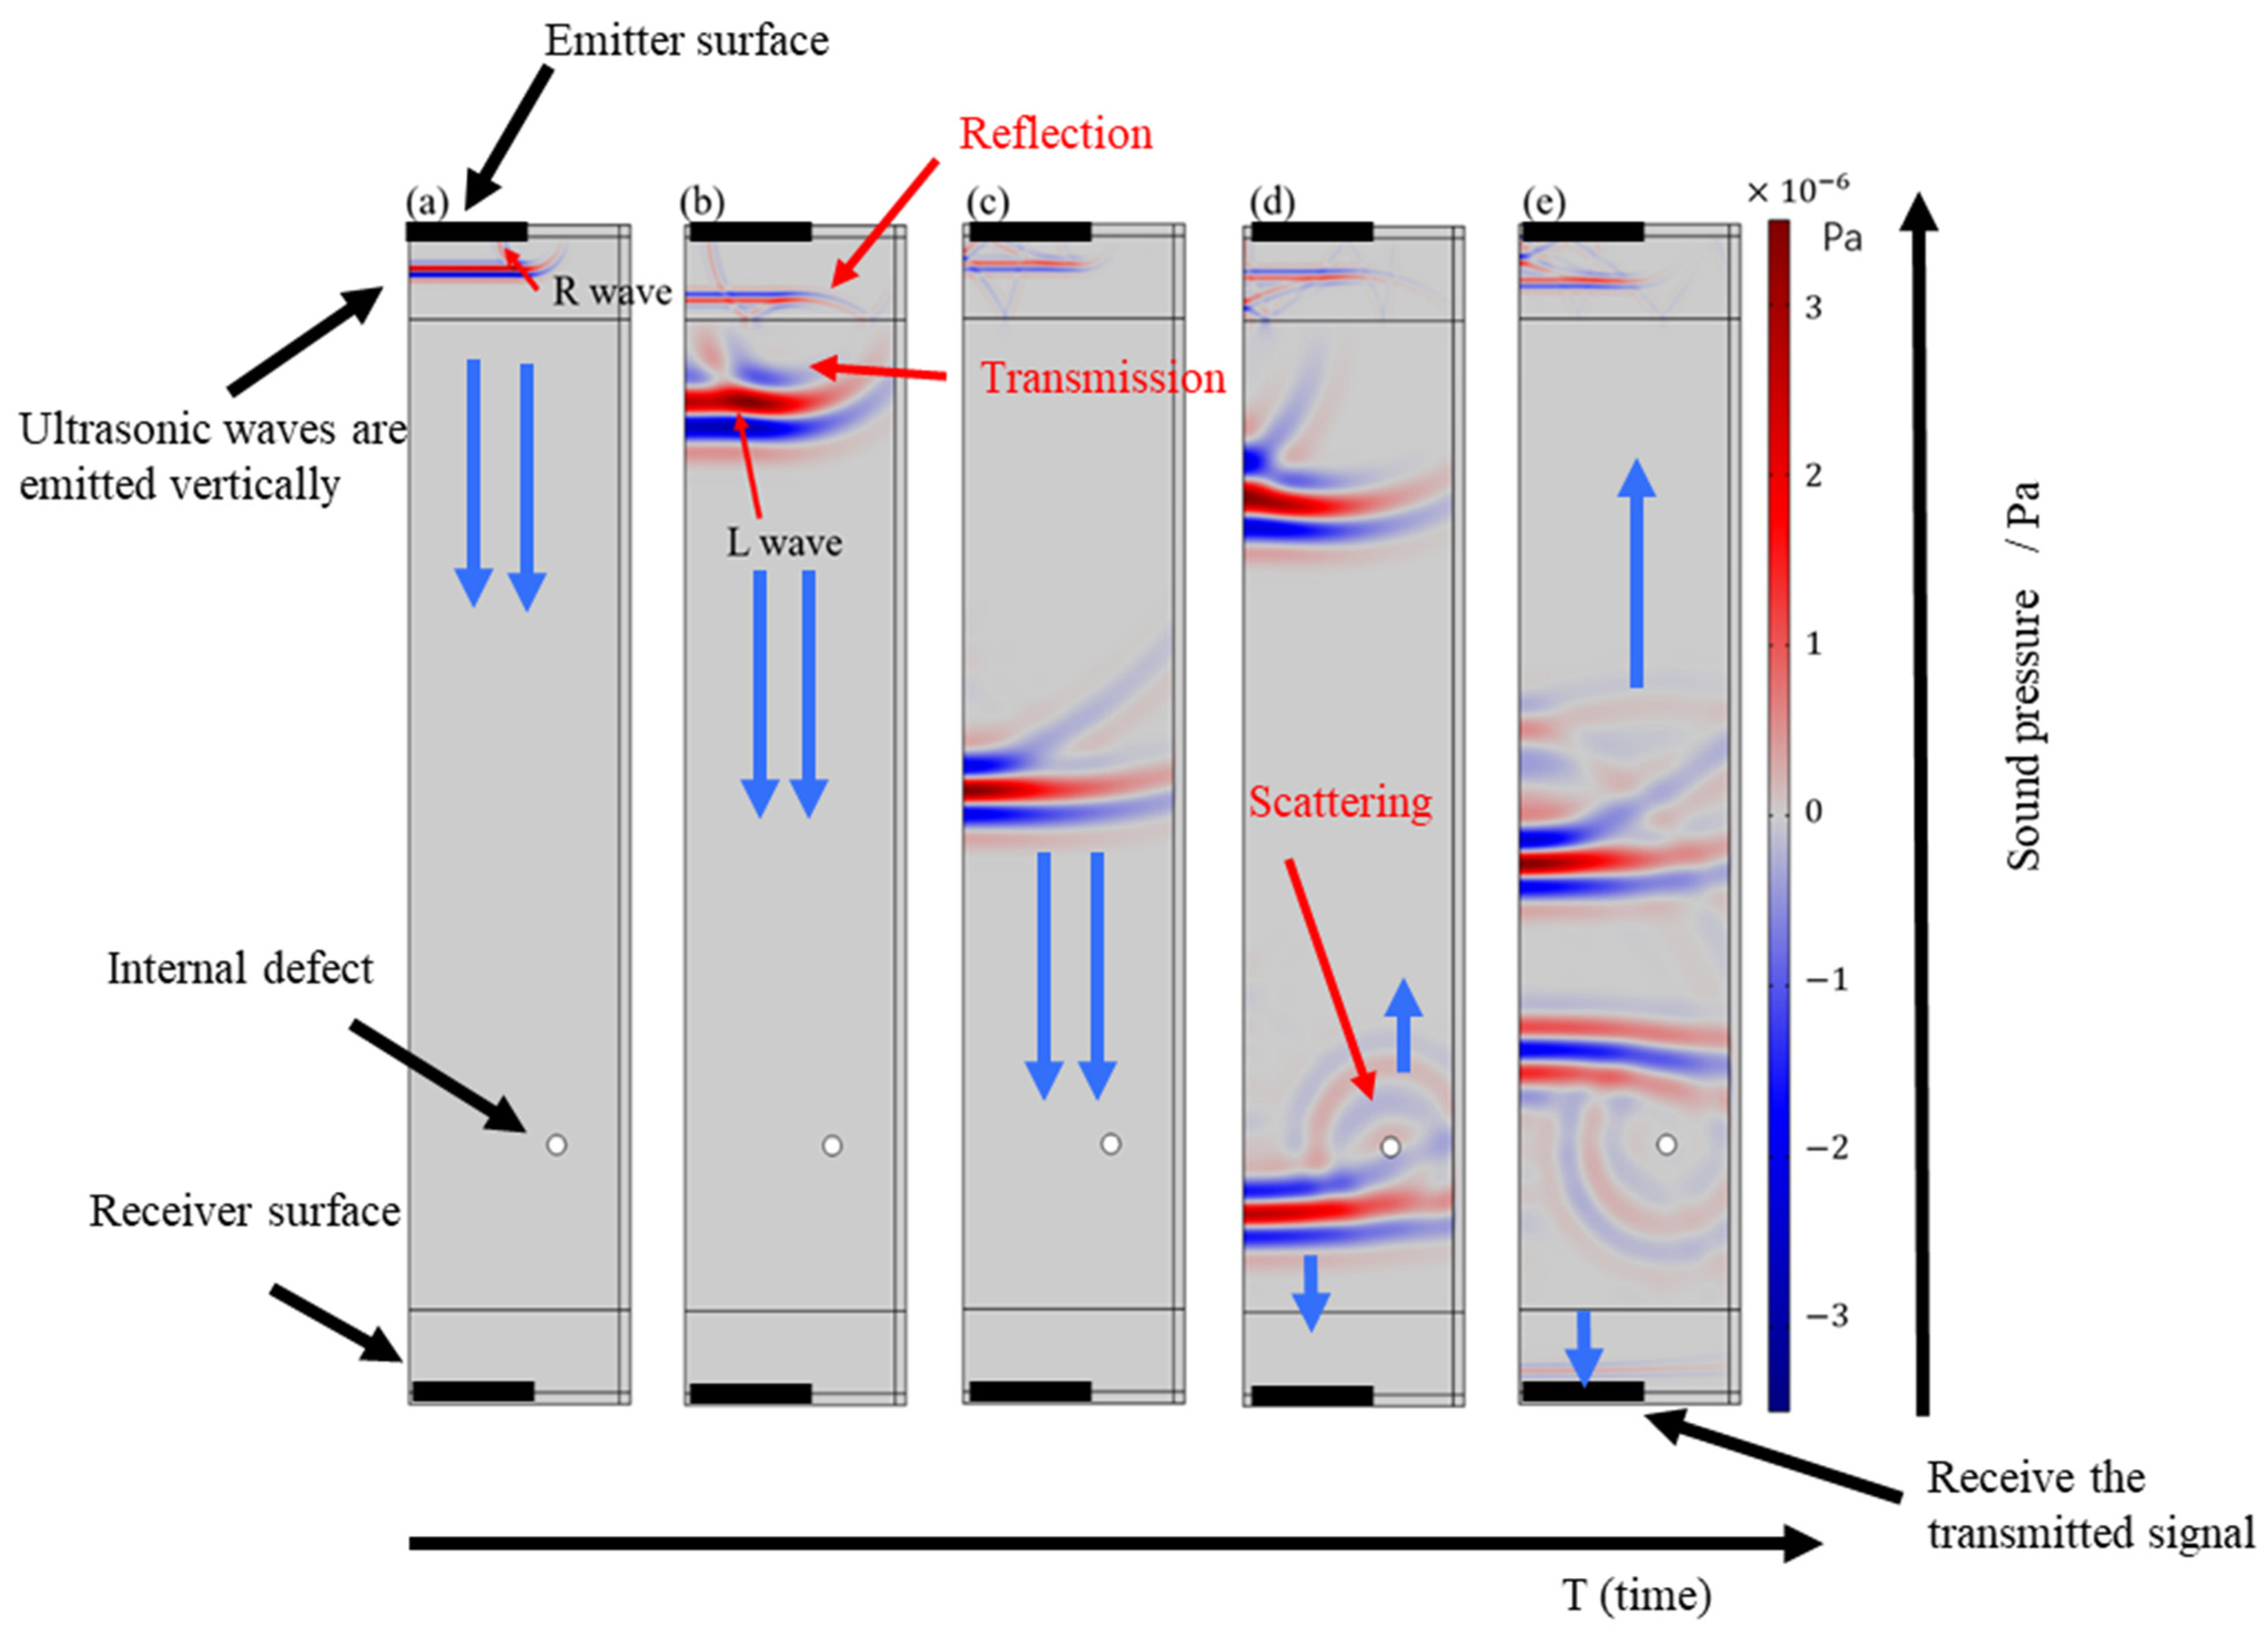
Figure 4.
Ultrasonic transmission simulation results: (a) simulation signal in time domain (b) Energy map of the simulation.
Figure 4.
Ultrasonic transmission simulation results: (a) simulation signal in time domain (b) Energy map of the simulation.
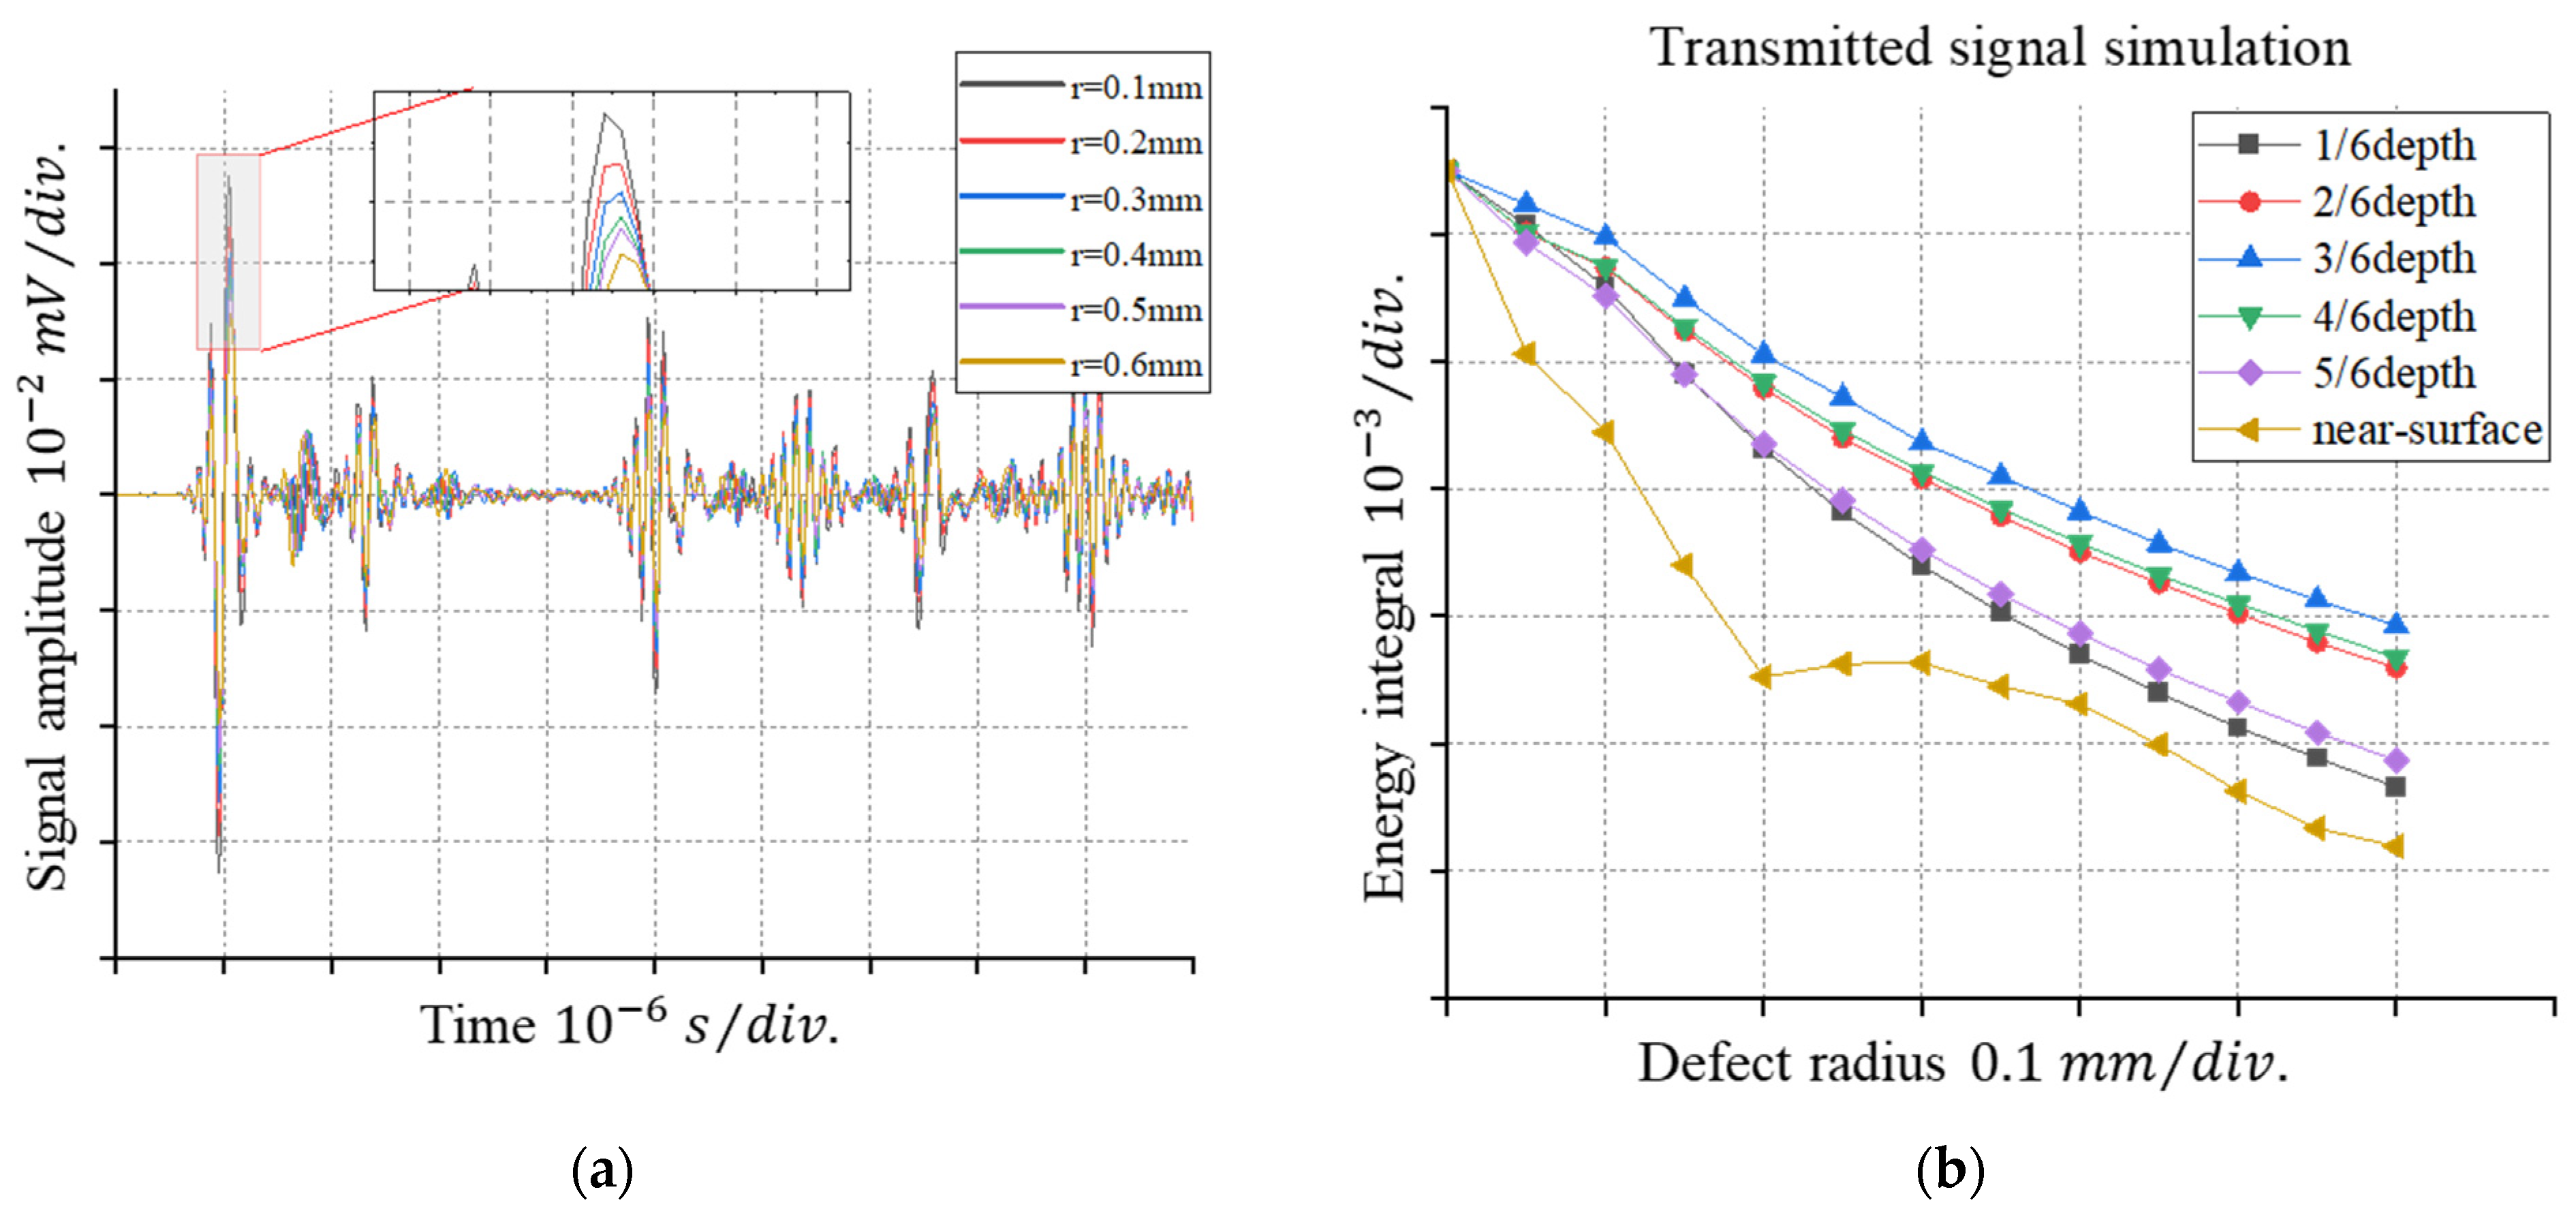
Figure 5.
System composition.
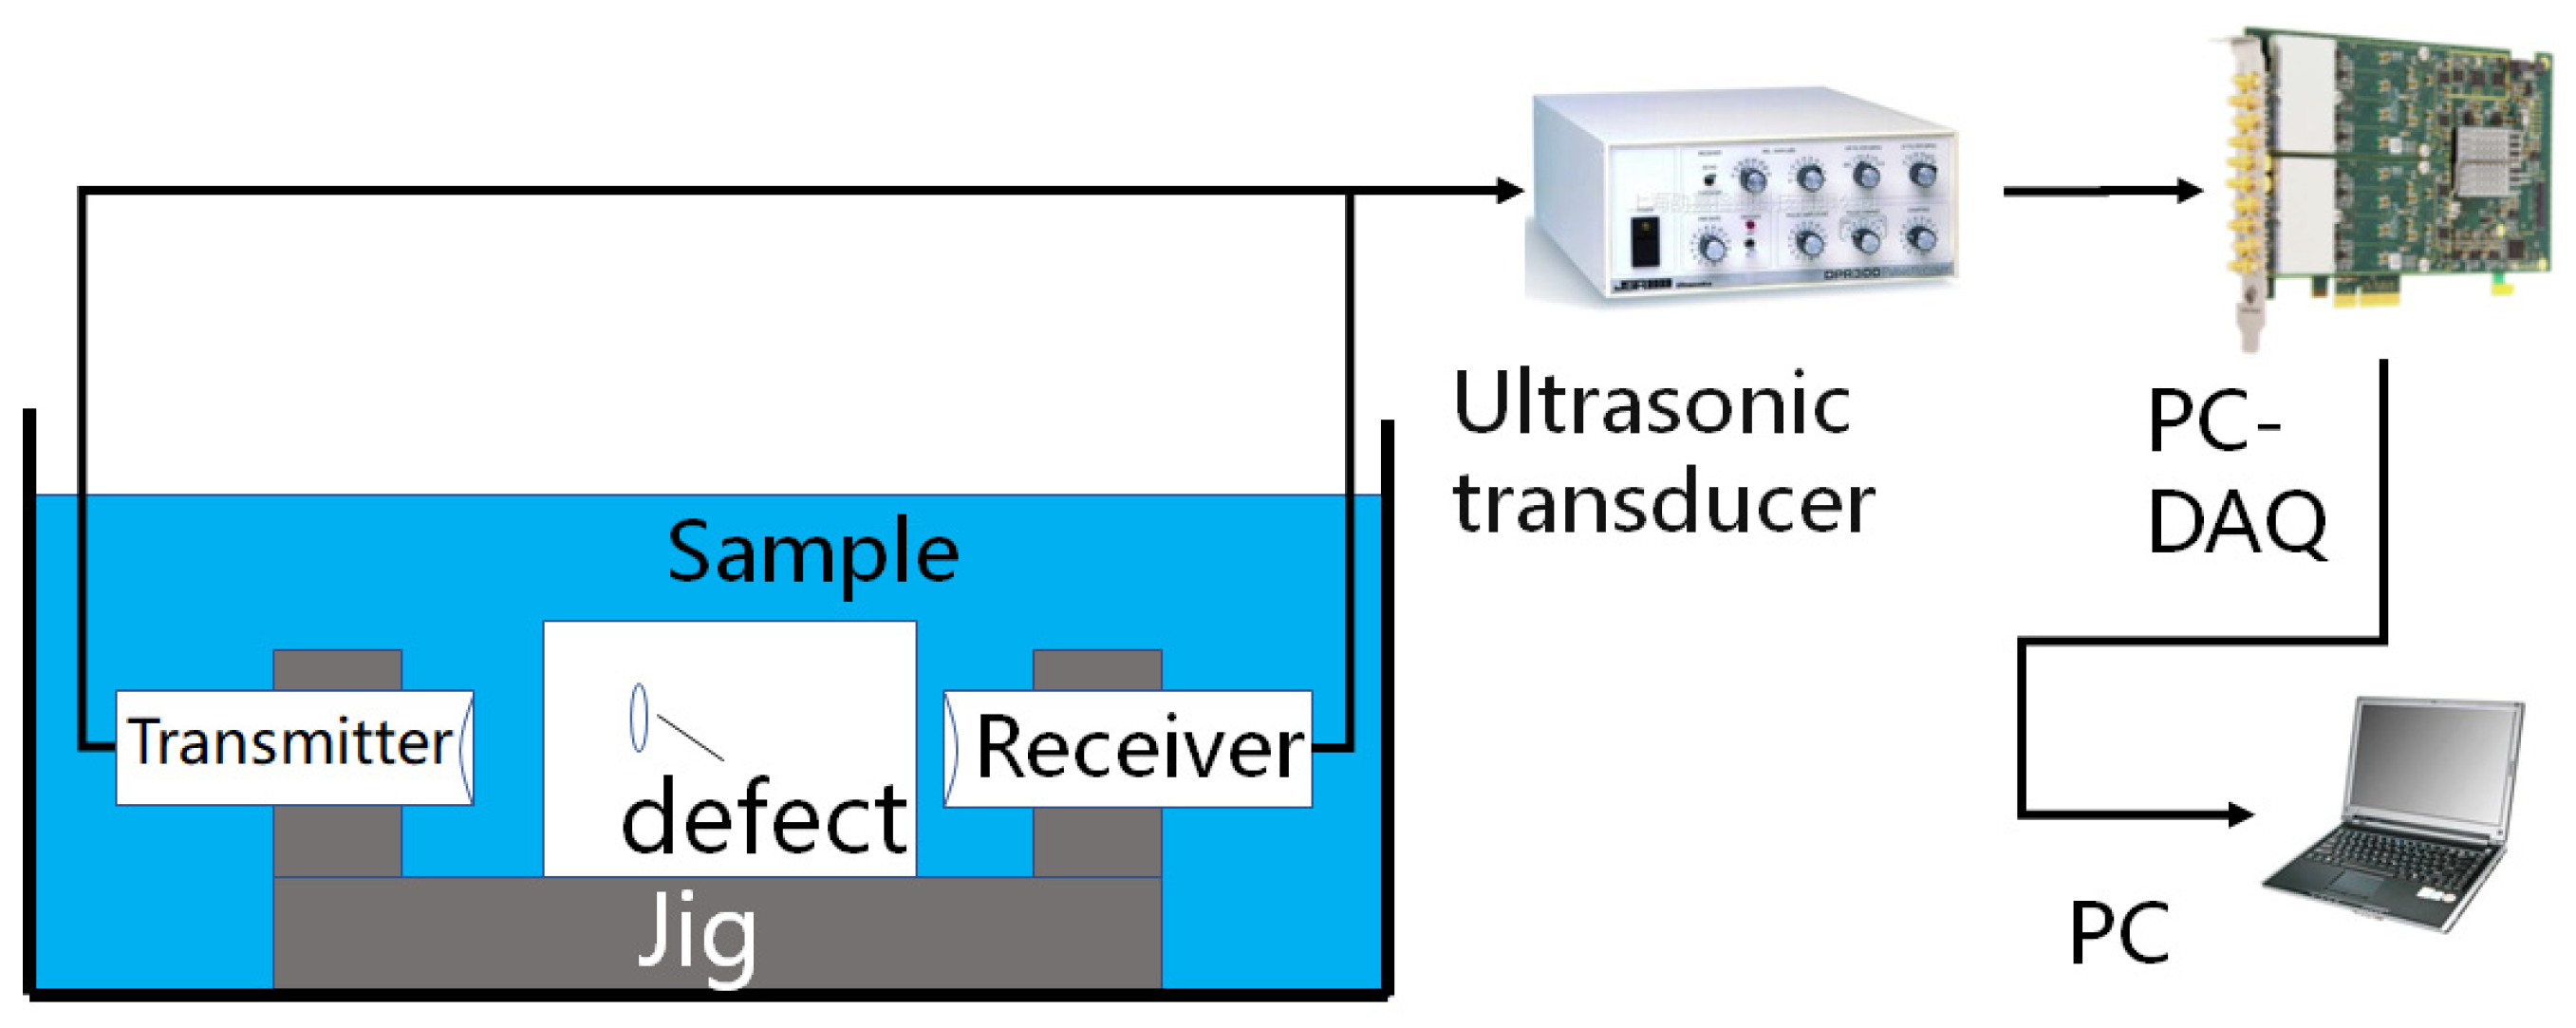
Figure 6.
Fixture set assembly: (a) Assembly; (b) base; (c) probe clamp; (d) sample clamp.

Figure 7.
Example of ultrasonic transmission signal.
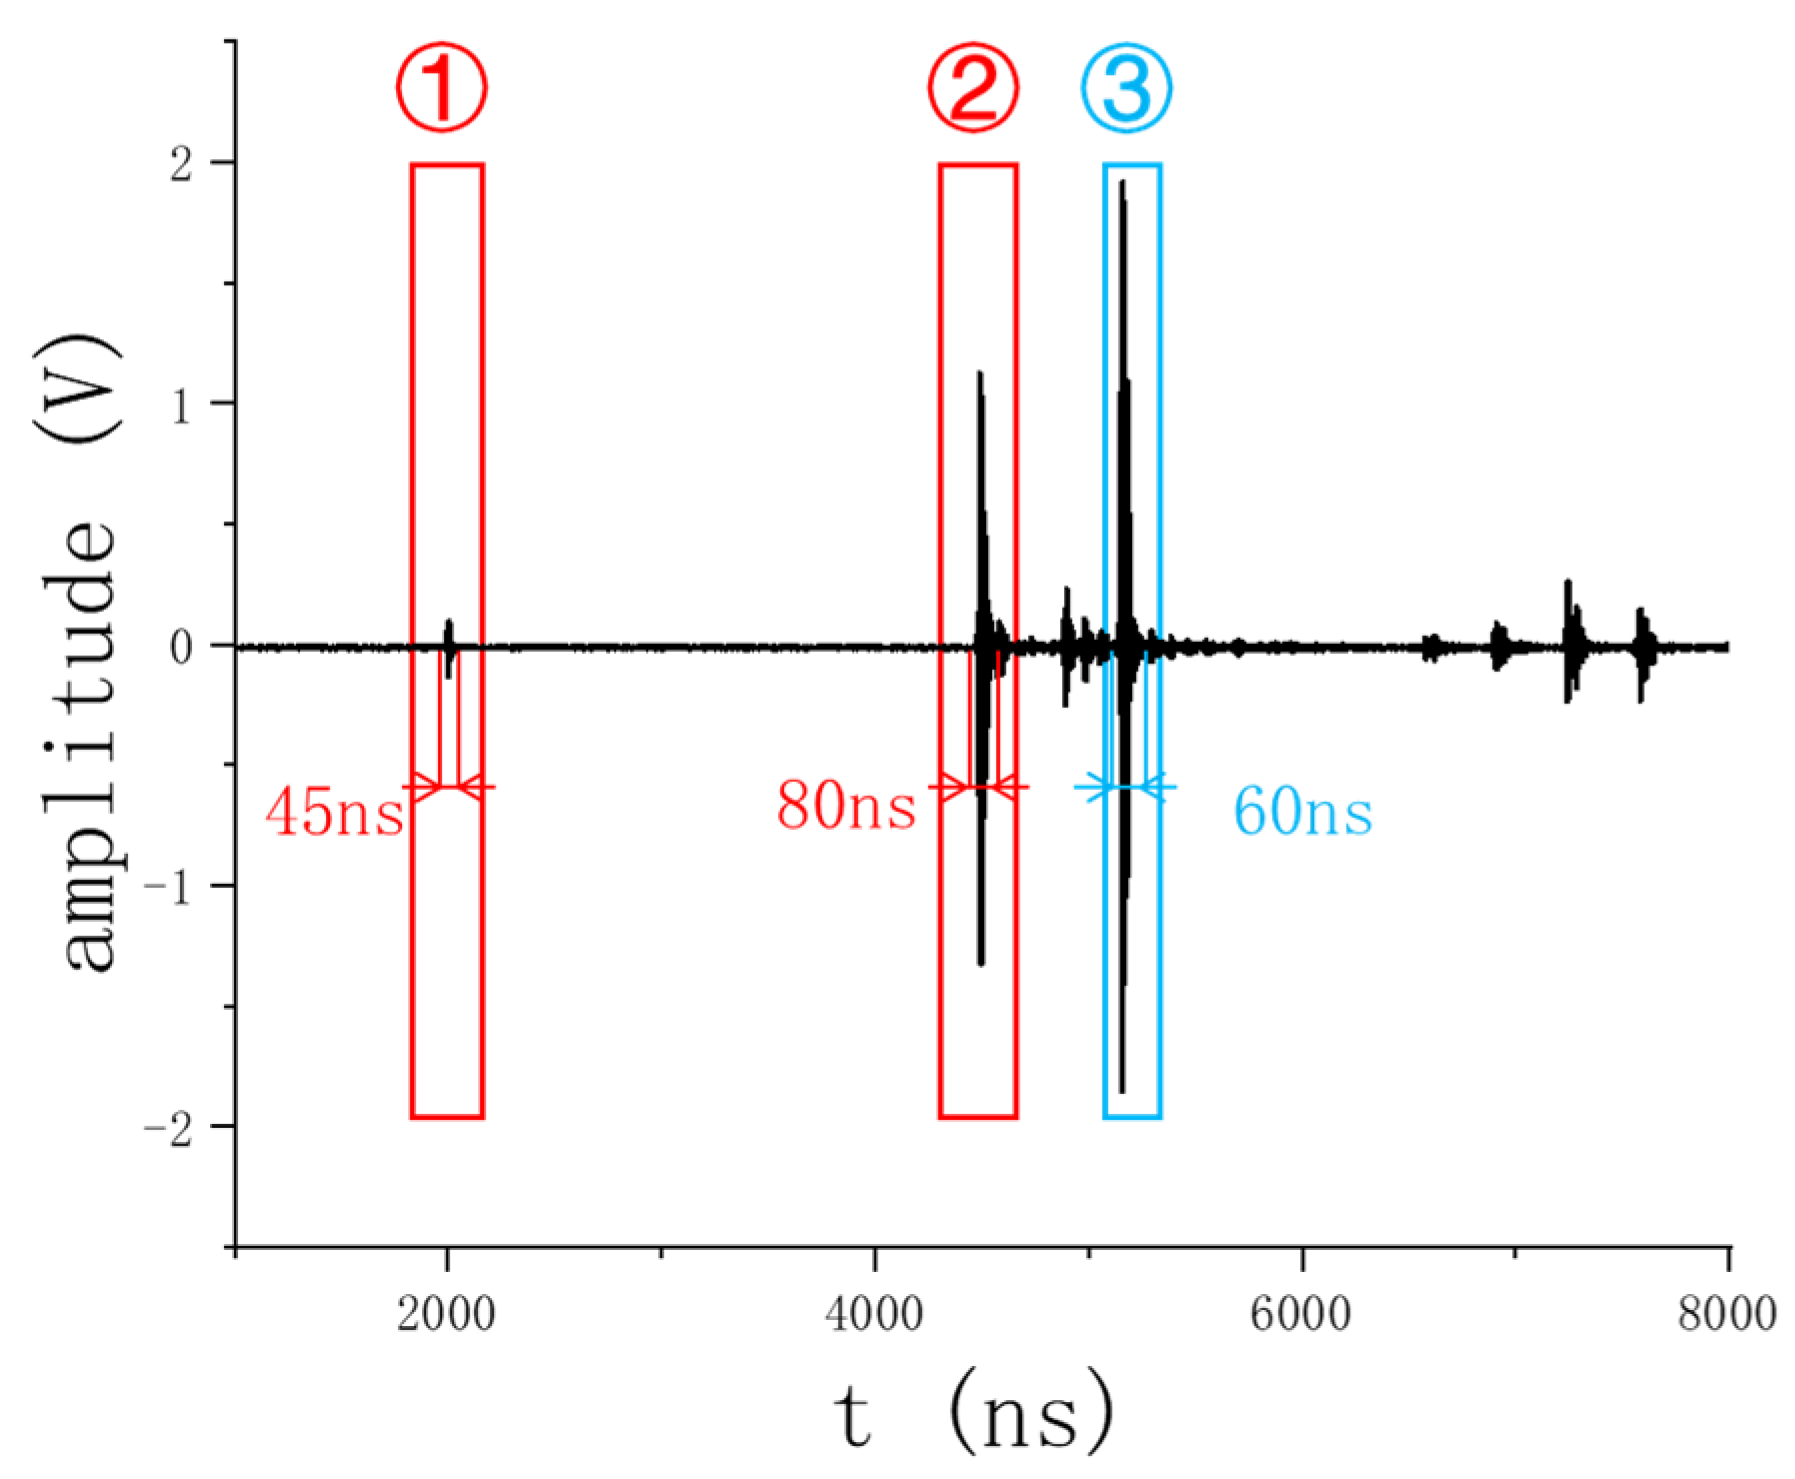
Figure 8.
Examples of defects in aluminum alloys: (a) Aluminum alloy; (b) alloy immersed in coupler.
Figure 8.
Examples of defects in aluminum alloys: (a) Aluminum alloy; (b) alloy immersed in coupler.
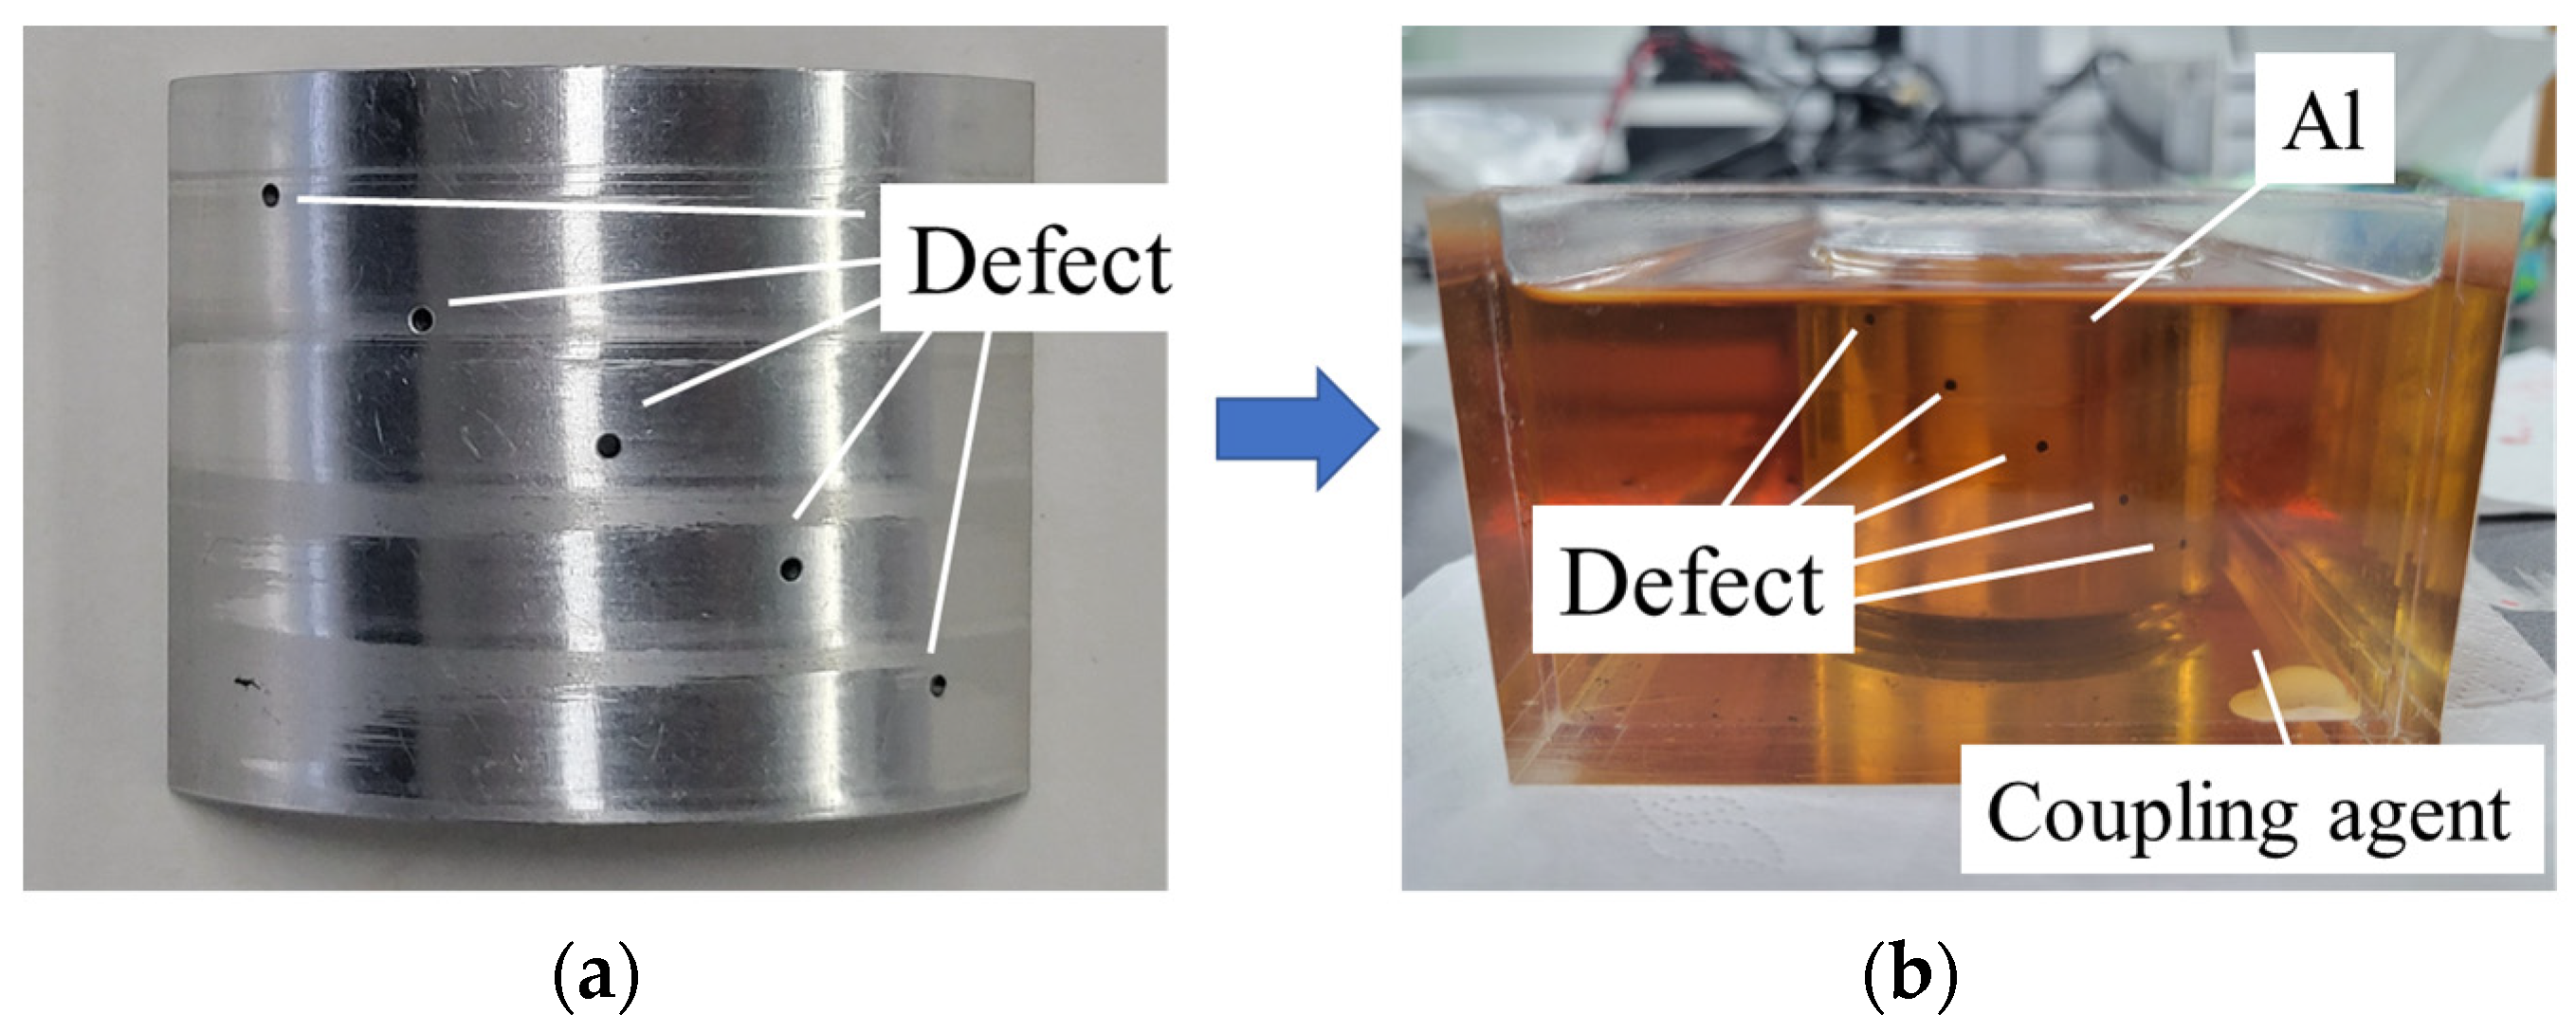
Figure 9.
Transmission Experiments of Aluminum Alloys with Different Depth Defects.
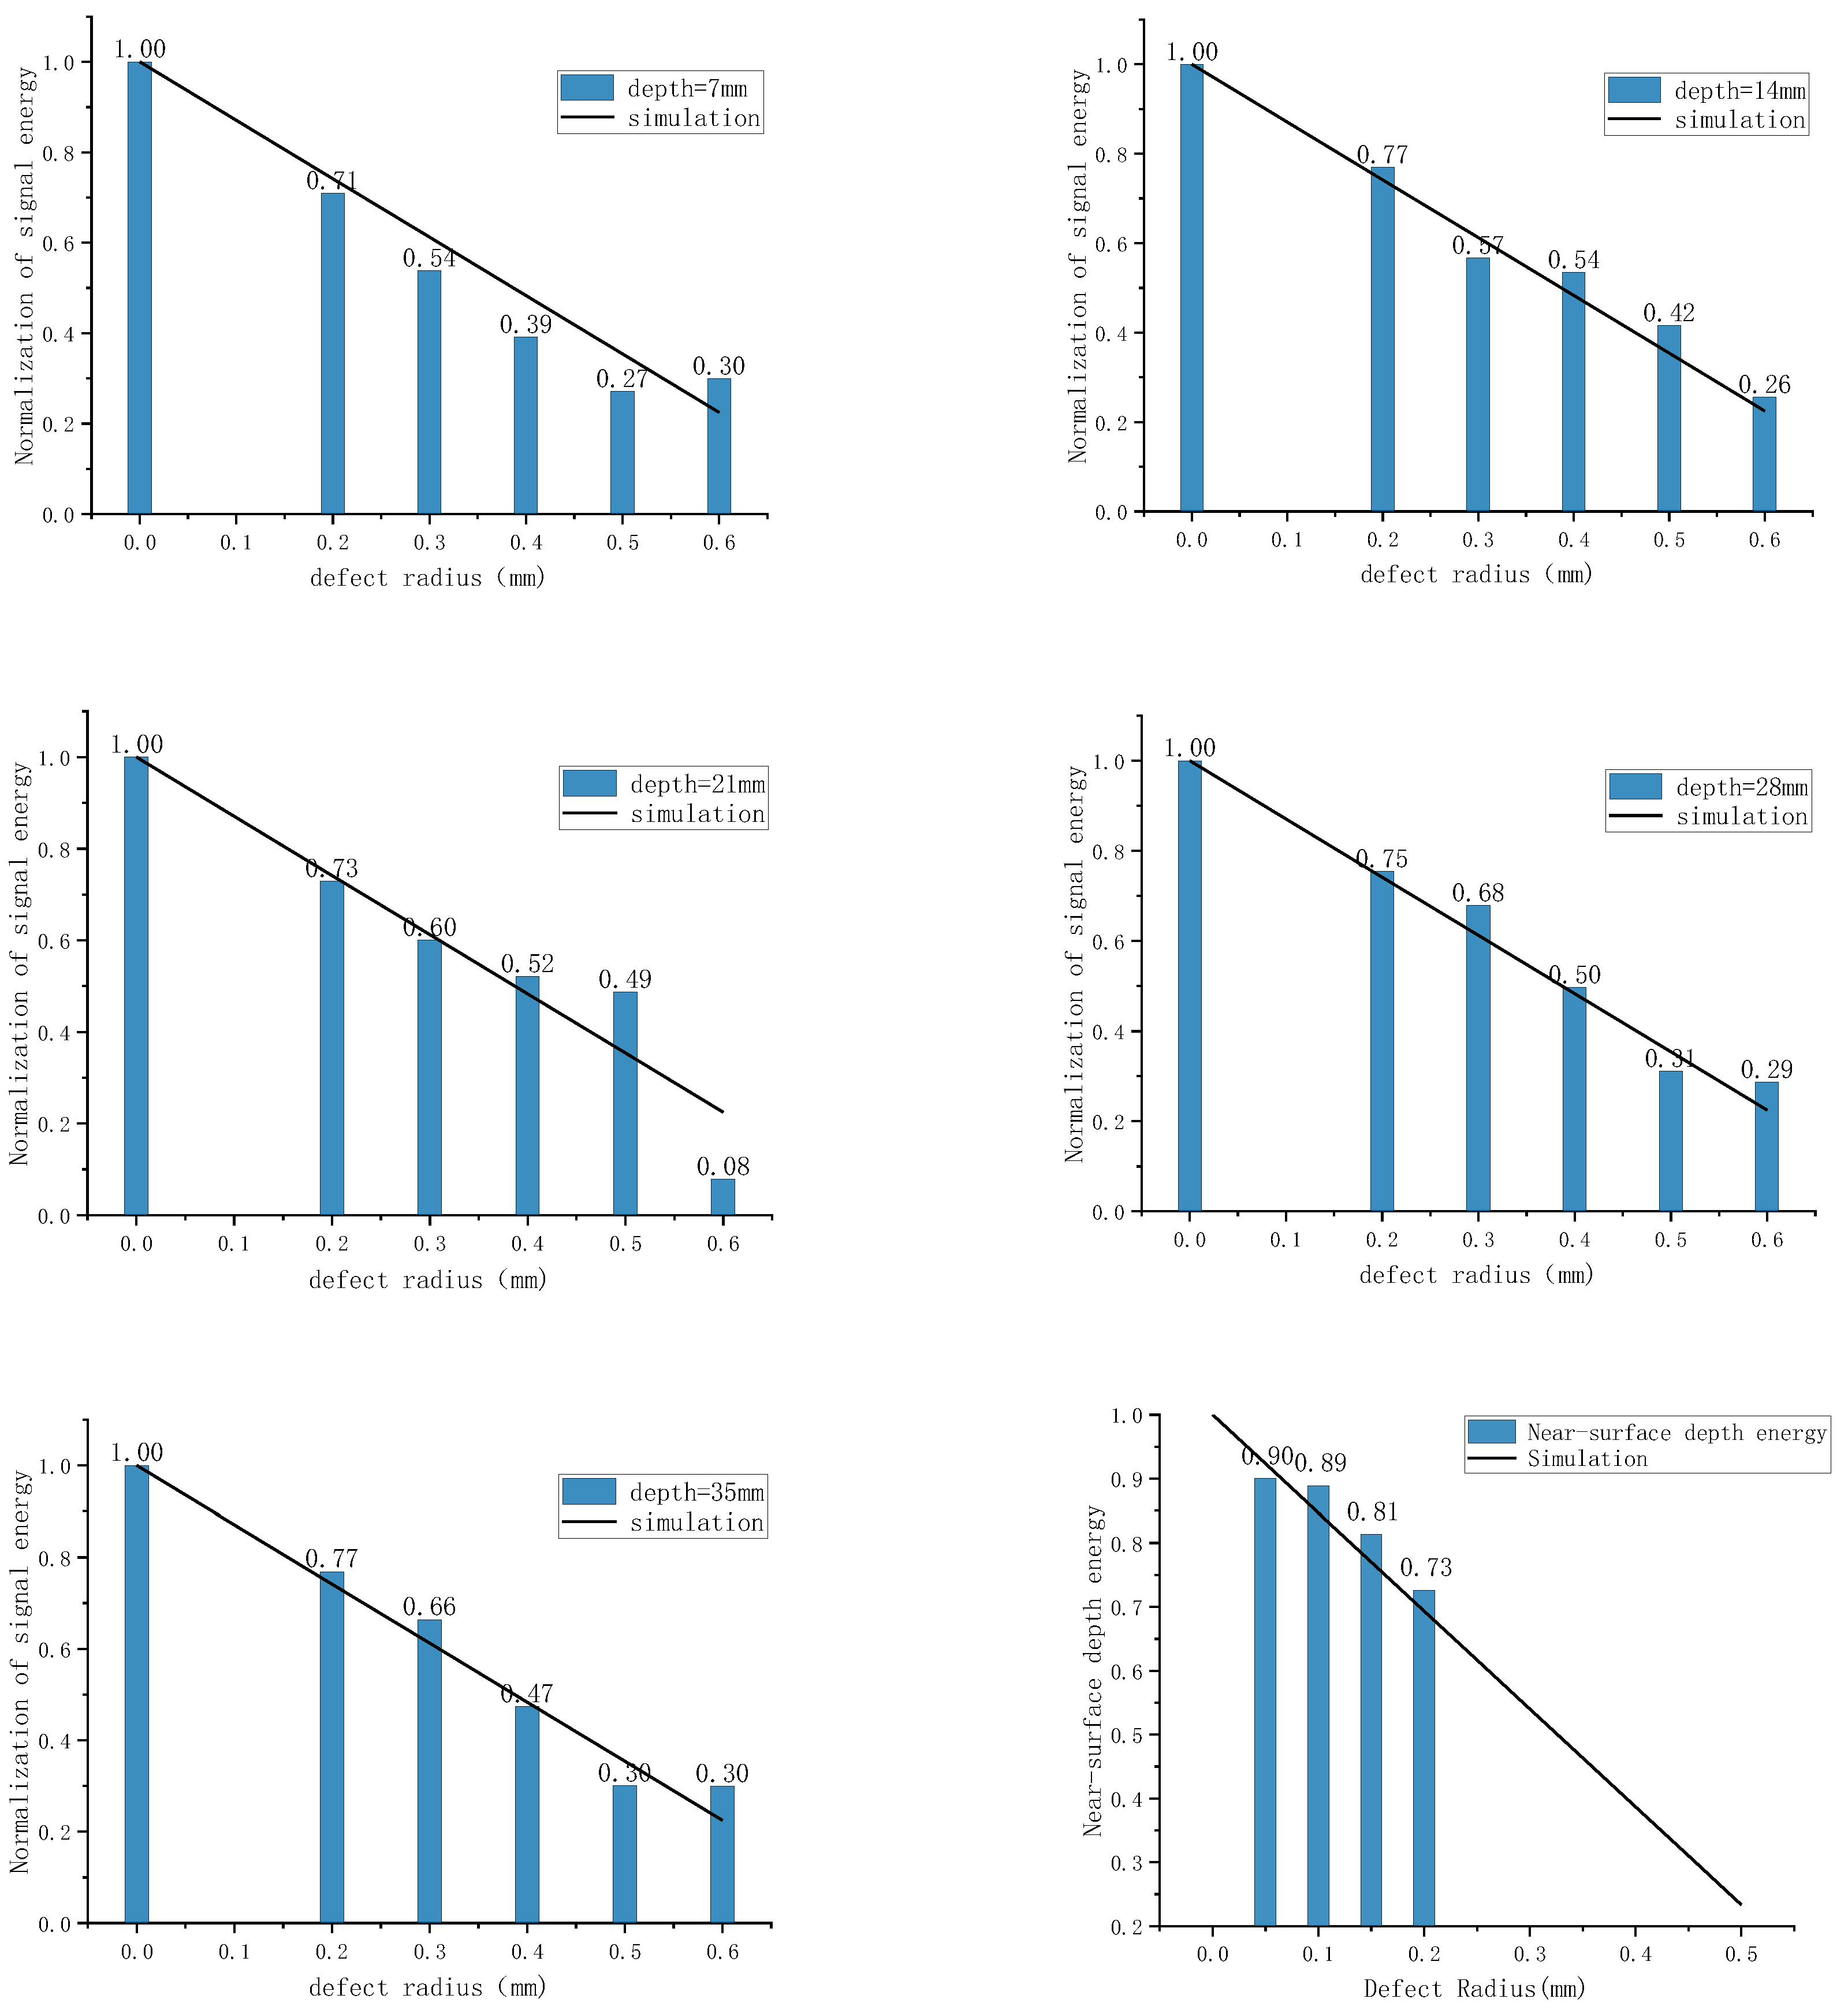
Figure 10.
Ferrite tile defect example: (a) External crack; (b) Internal defects captured by X-ray imaging.
Figure 10.
Ferrite tile defect example: (a) External crack; (b) Internal defects captured by X-ray imaging.
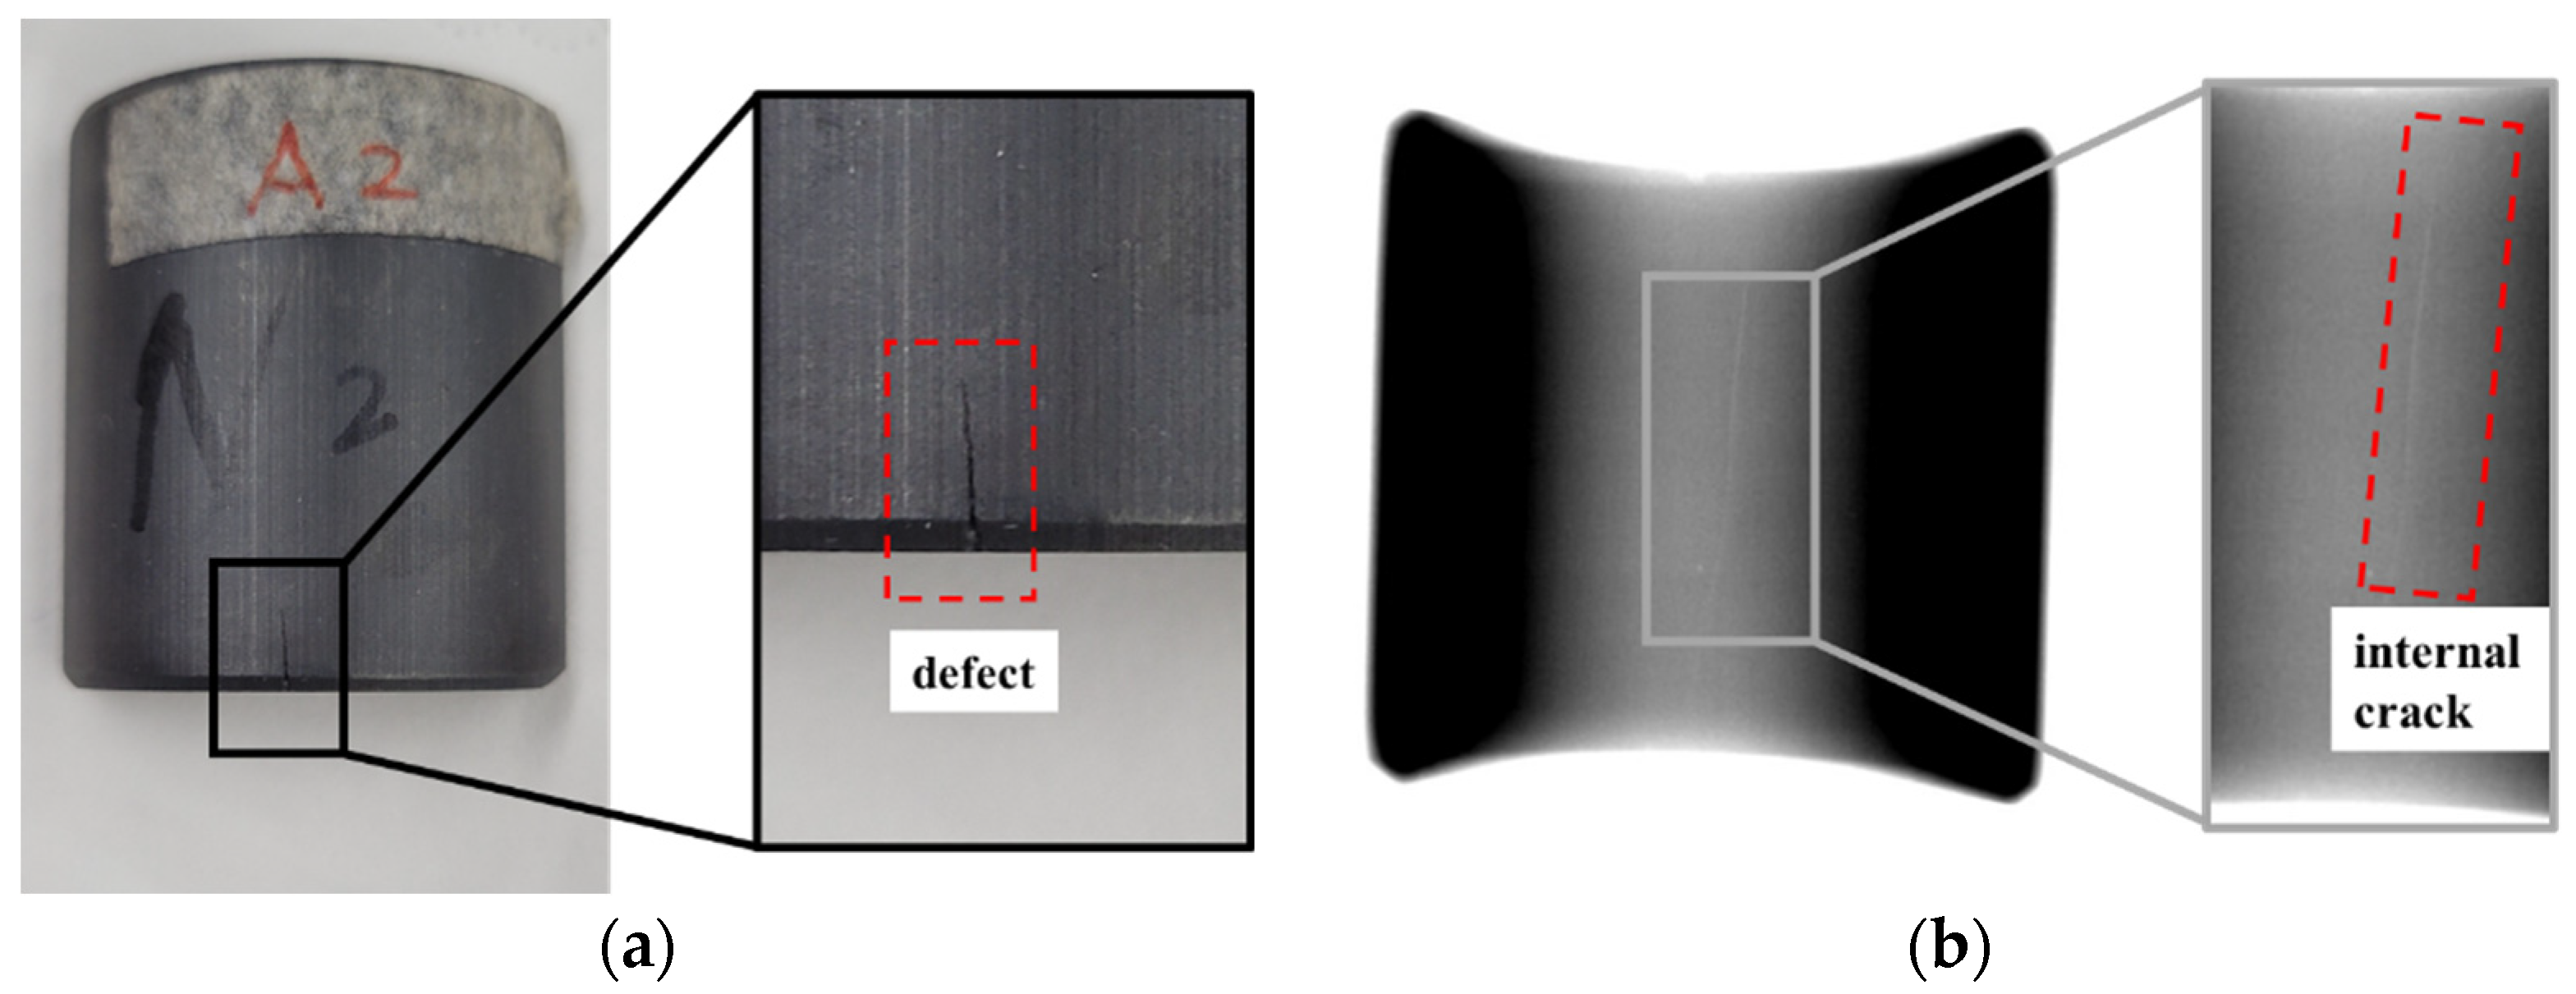
Figure 11.
Results of calibration and measurement.

Table 1.
Acoustic indicators of common materials.
| Material | Acoustic Impedance gm/(cm2·s) | Sound Velocity (25 °C) km/s |
|---|---|---|
| Ferrite | 28.3 | 6.7 |
| Aluminum | 17.0 | 6.3 |
| Copper | 41.6 | 4.7 |
| Steel and Stainless | 45.4 | 5.8 |
| Iron | 45.4 | 5.9 |
| Magnesium | 10.1 | 5.77 |
Disclaimer/Publisher’s Note: The statements, opinions and data contained in all publications are solely those of the individual author(s) and contributor(s) and not of MDPI and/or the editor(s). MDPI and/or the editor(s) disclaim responsibility for any injury to people or property resulting from any ideas, methods, instructions or products referred to in the content. |
© 2023 by the authors. Licensee MDPI, Basel, Switzerland. This article is an open access article distributed under the terms and conditions of the Creative Commons Attribution (CC BY) license (https://creativecommons.org/licenses/by/4.0/).
Share and Cite
MDPI and ACS Style
Huang, K.; Li, Q.; Zhu, K.; Chen, B.; Qian, X.; Wang, X.; Li, X. A Through-Transmission Ultrasonic Method for the Detection of Ferrite Tile Defects. Appl. Sci. 2023, 13, 11172. https://doi.org/10.3390/app132011172
AMA Style
Huang K, Li Q, Zhu K, Chen B, Qian X, Wang X, Li X. A Through-Transmission Ultrasonic Method for the Detection of Ferrite Tile Defects. Applied Sciences. 2023; 13(20):11172. https://doi.org/10.3390/app132011172
Chicago/Turabian StyleHuang, Kaiheng, Qiaolin Li, Kaixiong Zhu, Baihan Chen, Xiang Qian, Xiaohao Wang, and Xinghui Li. 2023. "A Through-Transmission Ultrasonic Method for the Detection of Ferrite Tile Defects" Applied Sciences 13, no. 20: 11172. https://doi.org/10.3390/app132011172
Note that from the first issue of 2016, this journal uses article numbers instead of page numbers. See further details here.