Article

Rapid Discrimination of Organic and Non-Organic Leafy Vegetables (Water Spinach, Amaranth, Lettuce, and Pakchoi) Using VIS-NIR Spectroscopy, Selective Wavelengths, and Linear Discriminant Analysis

1
Key Laboratory of Space Active Opto-Electronics Technology, Shanghai Institute of Technical Physics, Chinese Academy of Sciences, Shanghai 200083, China
2
Key Laboratory of Infrared System Detection and Imaging Technology, Shanghai Institute of Technical Physics, Chinese Academy of Sciences, Shanghai 200083, China
3
School of Information Science and Technology, ShanghaiTech University, Shanghai 201210, China
4
University of Chinese Academy of Sciences, Beijing 100049, China
5
Shanghai Key Laboratory of Multidimensional Information Processing, East China Normal University, Shanghai 200241, China
*
Authors to whom correspondence should be addressed.
Appl. Sci. 2023, 13(21), 11830; https://doi.org/10.3390/app132111830
Submission received: 3 October 2023 / Revised: 24 October 2023 / Accepted: 26 October 2023 / Published: 29 October 2023
(This article belongs to the Special Issue Spectroscopy Applications in Plant and Plant-Based Foods)

Abstract

:
Organic leafy vegetables face challenges related to potential substitution with non-organic products and vulnerability to dehydration and deterioration. To address these concerns, visible and near-infrared spectroscopy (VIS-NIR) combined with linear discriminant analysis (LDA) was employed in this study to rapidly distinguish between organic and non-organic leafy vegetables. The organic category includes organic water spinach (Ipomoea aquatica Forsskal), amaranth (Amaranthus tricolor L.), lettuce (Lactuca sativa var. ramosa Hort.), and pakchoi (Brassica rapa var. chinensis (Linnaeus) Kitamura), while the non-organic category consists of their four non-organic counterparts. Binary classification was performed on the reflectance spectra of these vegetables’ leaves and stems, respectively. Given the broad range of the VIS-NIR spectrum, stability selection (SS), random forest (RF), and analysis of variance (ANOVA) were used to evaluate the importance of the wavelengths selected by genetic algorithm (GA). According to the GA-selected wavelengths and their SS-evaluated values and locations, the significant bands for leaf spectra classification were identified as 550–910 nm and 1380–1500 nm, while 750–900 nm and 1700–1820 nm were important for stem spectra classification. Using these selected bands in the LDA classification, classification accuracies of over 95% were achieved, showcasing the effectiveness of utilizing the proposed method to rapidly identify organic leafy vegetables and the feasibility and potential of using a cost-effective spectrometer that only contains necessary bands for authenticating.

1. Introduction

Leafy vegetables are a part of everyday diets as they offer a wide variety of vitamins, minerals, and elements necessary for preserving excellent health [1]. Pakchoi, cabbage, lettuce, leek, water spinach, and amaranth are a few examples of leafy vegetables, and most of them contain edible leaves and stems. The cultivation of organic vegetables requires adherence to rigorous farming procedures that preclude the use of chemically synthesized pesticides, genetically engineered organisms and their derivatives, and inorganic fertilizers. Instead, organic fertilizers sourced from plants and animals are utilized, and the crops are safeguarded from pests and diseases using naturally occurring substances [2]. Numerous studies have found that organic leafy vegetables frequently have higher nutritional content while having lower yields than conventional agricultural techniques [3]. Due to its advantages for consumers’ health, environmental safety, lack of toxic pesticides, high nutrient content, and bioactive components, organic vegetables are becoming more and more popular [4,5].
The need for a rapid, reliable, and non-destructive identification technology for organic vegetables is becoming increasingly urgent. This is because the price of organic leafy vegetables is higher compared to leafy vegetables due to the low yields of organic vegetables [6]. Moreover, fraudsters are enthusiastic about making huge profits by selling non-organic vegetables as organic ones through the use of fake labels or producing high-yield vegetables that do not meet the organic identification standards [7]. Unfortunately, these fake organic vegetables are difficult to identify for ordinary consumers, resulting in wrong spending and a reduction in the market for real organic vegetables. Therefore, the organic vegetable industry requires technology that can quickly, accurately, and reliably identify organic vegetables while minimizing damage to the produce.
A multitude of authentication methods exist, utilizing diverse techniques. These encompass molecular methodologies, chromatographic techniques, isotopic analyses, vibrational and fluorescence spectroscopy, mass spectrometry, elemental assays, nuclear magnetic resonance spectroscopy, and the discerning art of sensory analysis [8,9,10]. Birse and colleagues adeptly discriminated between organic and conventional leeks through the adept employment of ambient mass spectrometry and inductively coupled plasma mass spectrometry for leafy vegetable authentication [11]. The distinction of organic lettuces has been accomplished by harnessing the power of spectroscopy synergized with advanced machine learning algorithms [12]. Notably, contemporary techniques, exemplified by mass spectrometry and high-performance liquid chromatography, have demonstrated heightened sensitivity and precision. Alas, their application is often impeded by the impractical attributes of complexity, exorbitant costs, and protracted procedural durations, rendering them ill-suited for the exigencies of rapid, non-destructive authentication [13,14]. Furthermore, these methodologies may necessitate the inclusion of an assortment of chemical reagents, thereby adding an additional stratum of intricacy to the already intricate process of vegetable authentication.
A number of potential elemental and Isotopic indicators, in concert with the nuanced application of machine learning paradigms, have undergone meticulous scrutiny in the pursuit of delineating the demarcation between organic and non-organic leafy vegetables [15,16,17]. Regrettably, the resultant findings have not invariably furnished unambiguous determinations, thereby presenting a formidable challenge in the endeavor to establish overarching threshold values for categorical differentiation.
As a non-destructive, swift, and efficient technique, spectroscopy has been successfully applied in plant qualitative and quantitative analysis, suggesting that this technique is a viable option for authenticating organic leafy vegetables [12,18,19]. It is worth noting that machine learning has been increasingly utilized across various disciplines for its ability to enhance predictive performance [20]. Spectroscopy combined with linear discriminant analysis is applied in the authentication of leafy greens, as LDA has demonstrated satisfactory classification outcomes [12,16].
Given the extensive range of the VIS-NIR spectrum, it potentially elevates computational complexity and may influence the outcomes of LDA classification. To tackle this concern, genetic algorithms are utilized to meticulously select the most informative wavelengths from the vast pool of 2101 available wavelengths of the VIS-NIR spectrum [21]. Nonetheless, when the number of selected wavelengths is set limited, GA is easily influenced by individual wavelengths and may obtain a local solution, and the selected wavelengths are redundant when the number is set excessively large, which is not what we wanted [22]. Considering these issues, the number is set to 30 in this study, and then stability selection, random forest algorithm, and analysis of variance methods are used to evaluate the importance of each wavelength selected by GA [23,24]. By analyzing the GA-selected wavelengths, their corresponding importance values, and their specific locations, we can identify a subset of suitable bands for classification purposes, thus obviating the need for utilizing the entire VIS-NIR spectrum. In this study, we present a viable solution to the issue of cost associated with VIS-NIR spectrometry in leafy vegetables authentication and achieve rapid, non-destructive, and precise discrimination between various types of organic and non-organic leafy vegetables. The selected 550–910 nm and 1380–1500 nm wavelengths used in the classification of the leaf spectra and the selected 750–900 nm and 1700–1820 nm wavelengths used in the classification of the stem spectra achieved accuracies and f1 scores of over 98%.

2. Materials and Methods

2.1. Samples

Four types of leafy vegetables, water spinach, green amaranth, lettuce, and pakchoi, were selected for this study. The organic vegetables were purchased from the same vendor, Nanjing Planck Technology and Trade Company (Nanjing, China), where discarded vegetables were processed and fermented to be used as fertilizer in the cultivation process of the organic vegetables. The non-organic vegetables were obtained from different supermarkets in Nanjing. A sample size of 20 individual vegetables was meticulously chosen for each specimen to obviate any undue reliance on a singular plant’s experimental reflectance spectra. The leafy vegetables underwent a rigorous cleansing process with distilled water to effectually eradicate any surface impurities and were meticulously dried prior to the commencement of spectral measurements. To forestall the deterioration of the vegetables, they were judiciously stored in a refrigeration unit at a temperature of 4 °C when not actively involved in the experiment, and the experimental procedures were expeditiously initiated to mitigate any potential temporal effects.

2.2. Visible and Near-Infrared Reflectance Spectra Measurements

The leaves and stems of leafy vegetables were separated. The reflectance spectra of these leaves and stems were directly measured by the ASD system (Figure 1) in the lab without using chemical reagents and other physical pretreatments.
The ASD system mainly includes the ASD FieldSpec-4 Hi-Res NG spectroradiometer (Analytical Spectral Devices, Longmont, Colorado), the illuminator (Analytical Spectral Devices), a laptop computer with RS3TM inbuilt software (version 6.3, Analytical Spectral Devices), a whiteboard, and the fiber optic cable receiver (Analytical Spectral Devices). The illuminator was positioned at an inclination of 45 degrees from the zenith angle, maintaining a distance of 40 cm above the vegetable specimen. The 8° field-of-view fiber optic cable receiver was kept at a distance of 3 cm above the vegetable specimen. The ASD spectroradiometer was designed to operate under varying temperatures between 0 and 40 °C. In order to collect spectral data, the ASD spectroradiometer should be coupled with light sources and the RS3TM software on a computer.
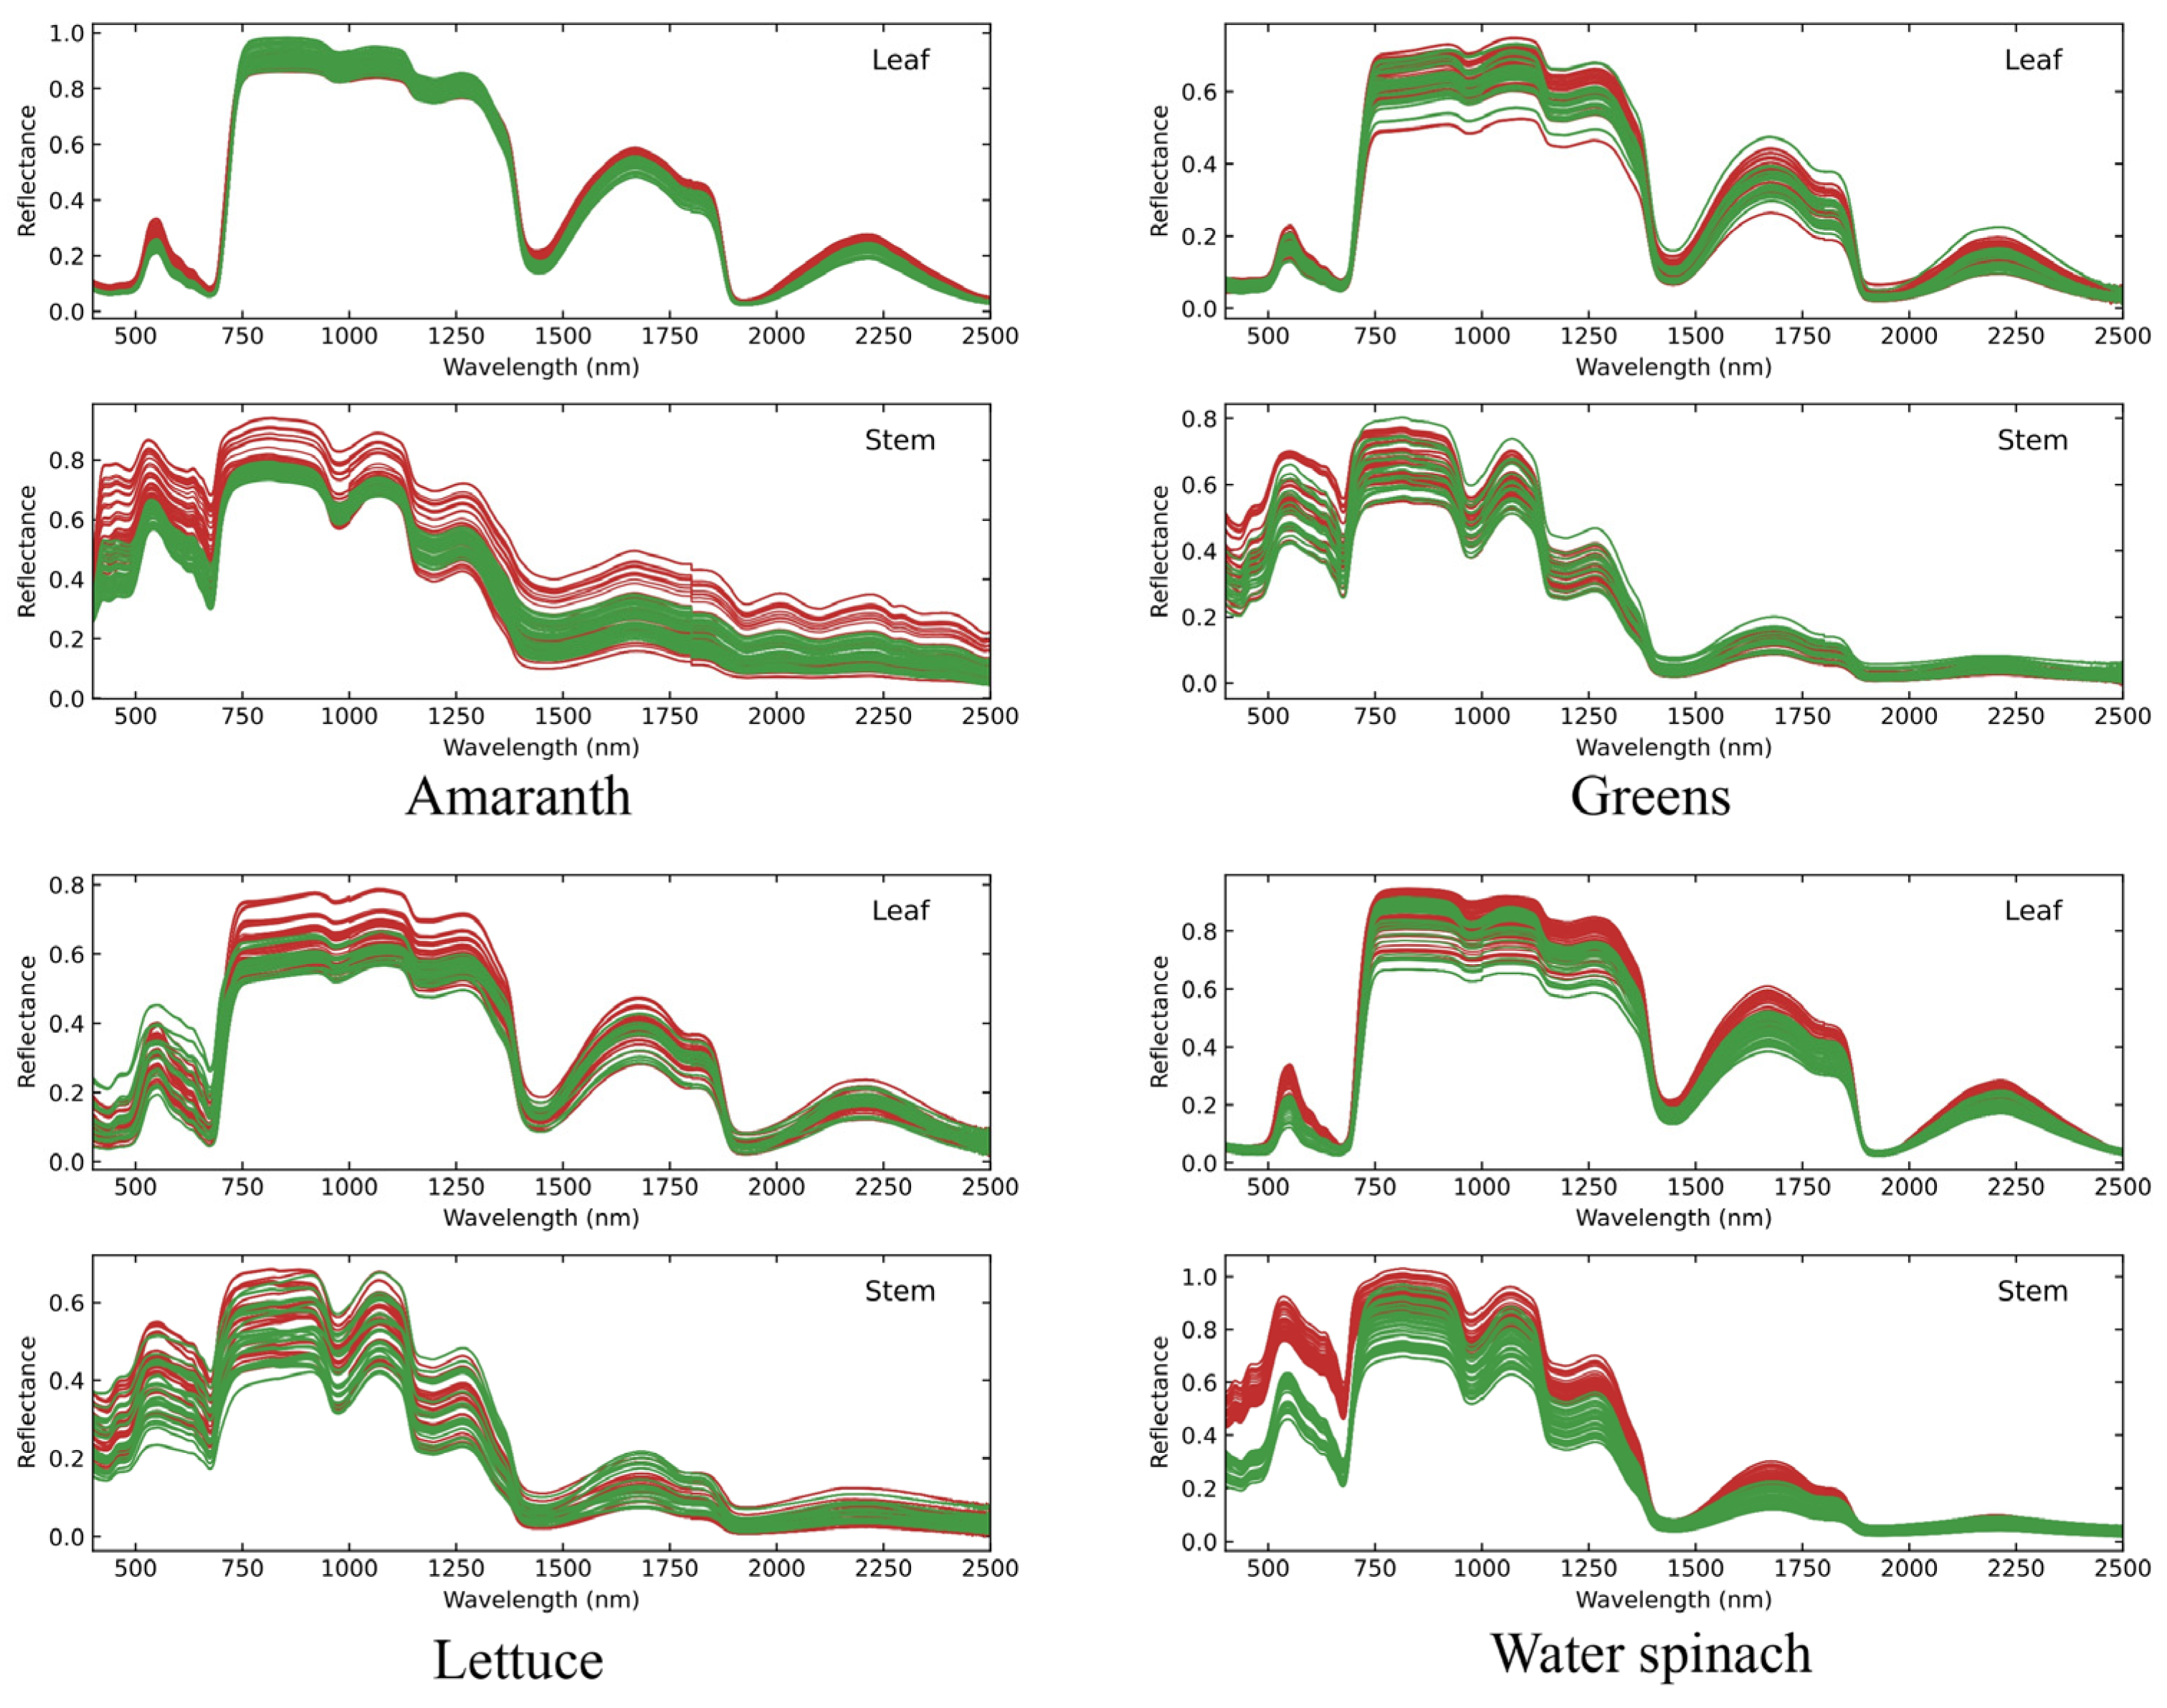
Before collecting spectra, it was necessary to allow the spectroradiometer to warm up for a period of time to minimize the impact of the instrument on the measurements. Furthermore, the reflectance spectrum of the initial background was calibrated using the whiteboard to ensure that the reflectance was near unity. Only the illuminator provided illumination during the experiment, and no other light sources were present. The leaf or stem sample was then placed on the experimental platform, and the reflected light was captured by the light receiver. The resulting reflectance values for each wavelength were obtained through processing with the spectroradiometer and the RS3TM software. For this study, only the reflectance values between 400 nm and 2500 nm were used. A total of 100 reflectance spectra were acquired for each of the four distinct categories of leafy vegetables, encompassing both organic and non-organic varieties. These reflectance spectra were meticulously procured from varying positions within different samples. In Figure 2, each individual spectrum was obtained by averaging data from five scans of the respective sample.

2.3. Spectral Preprocessing

The integrity of our classification models relies significantly on the quality of the data. To establish robust classification models, rigorous data preprocessing procedures were executed. The obtained spectra, being susceptible to potential disturbances from scattering effects, required special attention [25]. To enhance the resilience of our discriminant model, we employed three critical techniques: multiplicative scattering correction (MSC), standard normal variate (SNV), and Savitzky–Golay (SG) algorithm. MSC was applied to ameliorate scattering artifacts, SNV to mitigate the effects of optical path deviations, and SG to suppress scattering artifacts, enhance spectral coherence, and reduce diffuse reflection and noise [14].

2.4. Wavelength Selection and Importance Assessment

The VIS-NIR spectrum encompasses a vast range of 2101 wavelengths; however, not all of them hold significance in the classification process. To enhance the quality of the data, reduce complexity, and enhance interpretability, a meticulous selection of wavelengths was conducted. In this study, a genetic algorithm was used to select wavelengths. Stability selection, random forest, and analysis of variance methods were employed to assess the importance of the selected wavelengths. These methods were implemented using Python 3.8.13 in the PyCharm software (2021.3.2 community version, JetBrains).
GA is a type of stochastic search algorithm that is based on the principles of genetics and natural selection [22]. GA has been proven to be effective in producing high-quality solutions for the wavelength selection problem [12]. This approach was effective in optimizing large state spaces, reducing the initial 2101 variables to a more manageable number under the maximum number of variables that were deemed to be the most influential and significant variables in the experiment.
SS is a variable selection method based on subsampling in combination with selection algorithms [23]. In this experiment, we used the randomized lasso method to subsample the training data. Then, the coefficients of these unimportant wavelengths were compressed to zero with the lasso, achieving both accurate parameter estimation and wavelength selection. We calculated the frequency of each wavelength that was considered significant in the selections. Then, the importance of each wavelength could be evaluated with its frequency in the selections.
RF is a robust and adaptable supervised machine learning algorithm that generates and merges various decision trees to form a decision forest and can be used for classification and regression tasks [26]. Here, RF is used as a classifier and finally returns measures of wavelength importance. RF was used to rank the importance of wavelengths in this study.
ANOVA is a statistical technique used to compare the means of two or more groups to determine if there are significant differences among them [24]. The technique calculates an F-statistic, which represents the ratio of the variance between groups to the variance within groups. If the calculated F-value is larger than the critical value, it suggests that there is a significant difference among the group means. We calculated the F-value of each wavelength within the organic and non-organic groups; then, it was used to gauge the importance of each wavelength in the experiment.

2.5. Classifier and Evaluation Indicators

LDA is one of the most popular supervised classification techniques and also a dimensionality reduction technique, which is used to find a linear transformation that will decrease the distance inside the data classes while maximizing the distance between classes [27]. It can be described by Equation (1), where Sb is the between-class scatter matrix, Sw is the within-class scatter matrix, w is the projection vector when there are only two classes, and T means the transpose of the matrix. The value of w is calculated by means of the generalized Rayleigh quotient xHAx/xHBx, where matrices A and B are Hermitian matrices, B is a positive-definite matrix, H is the conjugate transpose, and x is a nonzero vector. We assumed that the spectra data of each class conform to Gaussian distribution. In this way, after the LDA was used for projection, the maximum likelihood estimation could be used to calculate the mean and variance of the projection data of each class, and then the probability density function of the Gaussian distribution of that class could be obtained. When a new spectrum arrived, we could project it and then bring the projected spectrum wavelengths into the Gaussian distribution probability density function of each class to calculate the probability that belongs to this class. The class corresponding to the maximum probability is the prediction class.
a r g m a x   J ( w ) = w T S b w w T S w w
The dataset was randomly shuffled and divided into a training set and a testing set in a 7:3 ratio in this study. The classification results of the testing set were evaluated with sensitivity, specificity, accuracy, and f1 scores depicted by Equations (2)–(5), respectively.
s e n s i t i v i t y = T P T P + F N
s p e c i f i c i t y = T N F P + T N
a c c u r a c y = T P + T N T P + F P + F N + T N
f 1 = 2 × T P 2 × T P + F P + F N
As Table 1 shows, a true positive (TP) occurs when a positive sample is correctly classified, while a true negative (TN) occurs when a negative sample is correctly classified. On the other hand, a false positive (FP) is when a negative sample is incorrectly classified, and a false negative (FN) is when a positive sample is incorrectly classified.

2.6. Reference Methods

To evaluate the efficacy of wavelength selection techniques in the classification of the spectra of the leafy vegetables, several approaches utilizing the entire VIS-NIR spectrum were employed as points of reference. It is important to note that the methods employing the entire spectral range did not directly use the raw, unprocessed data for classification. Rather, it involved dimensionality reduction techniques, which effectively mitigate the effects stemming from the high dimensionality, spectral overlap, and nonlinearity of the spectral data. Dimensionality reduction techniques, such as principal component analysis (PCA) and partial least squares–discriminant analysis (PLS-DA), are commonly employed [28]. Unlike PCA, PLS-DA is a supervised method that effectively reduces the dimensionality of the data while considering class labels, rendering it suitable for classification tasks. During the experiment, we employed PCA-LDA, PCA-SVM (support vector machine), and PLS-DA methods, all of which utilized the complete VIS-NIR spectrum [29,30].

3. Results

3.1. Spectrum of the Leafy Vegetables

Figure 3 illustrates the average spectral profiles of these four varieties of vegetables. Organic leafy vegetables, it appears, exhibit spectral distinctions that are not markedly dissimilar from their non-organic counterparts. However, upon closer scrutiny, we discern that the reflectance of organic vegetables is inferior to that of their non-organic counterparts. In Figure 2, the organic and non-organic spectral characteristics of the various vegetables also manifest congruent outcomes.
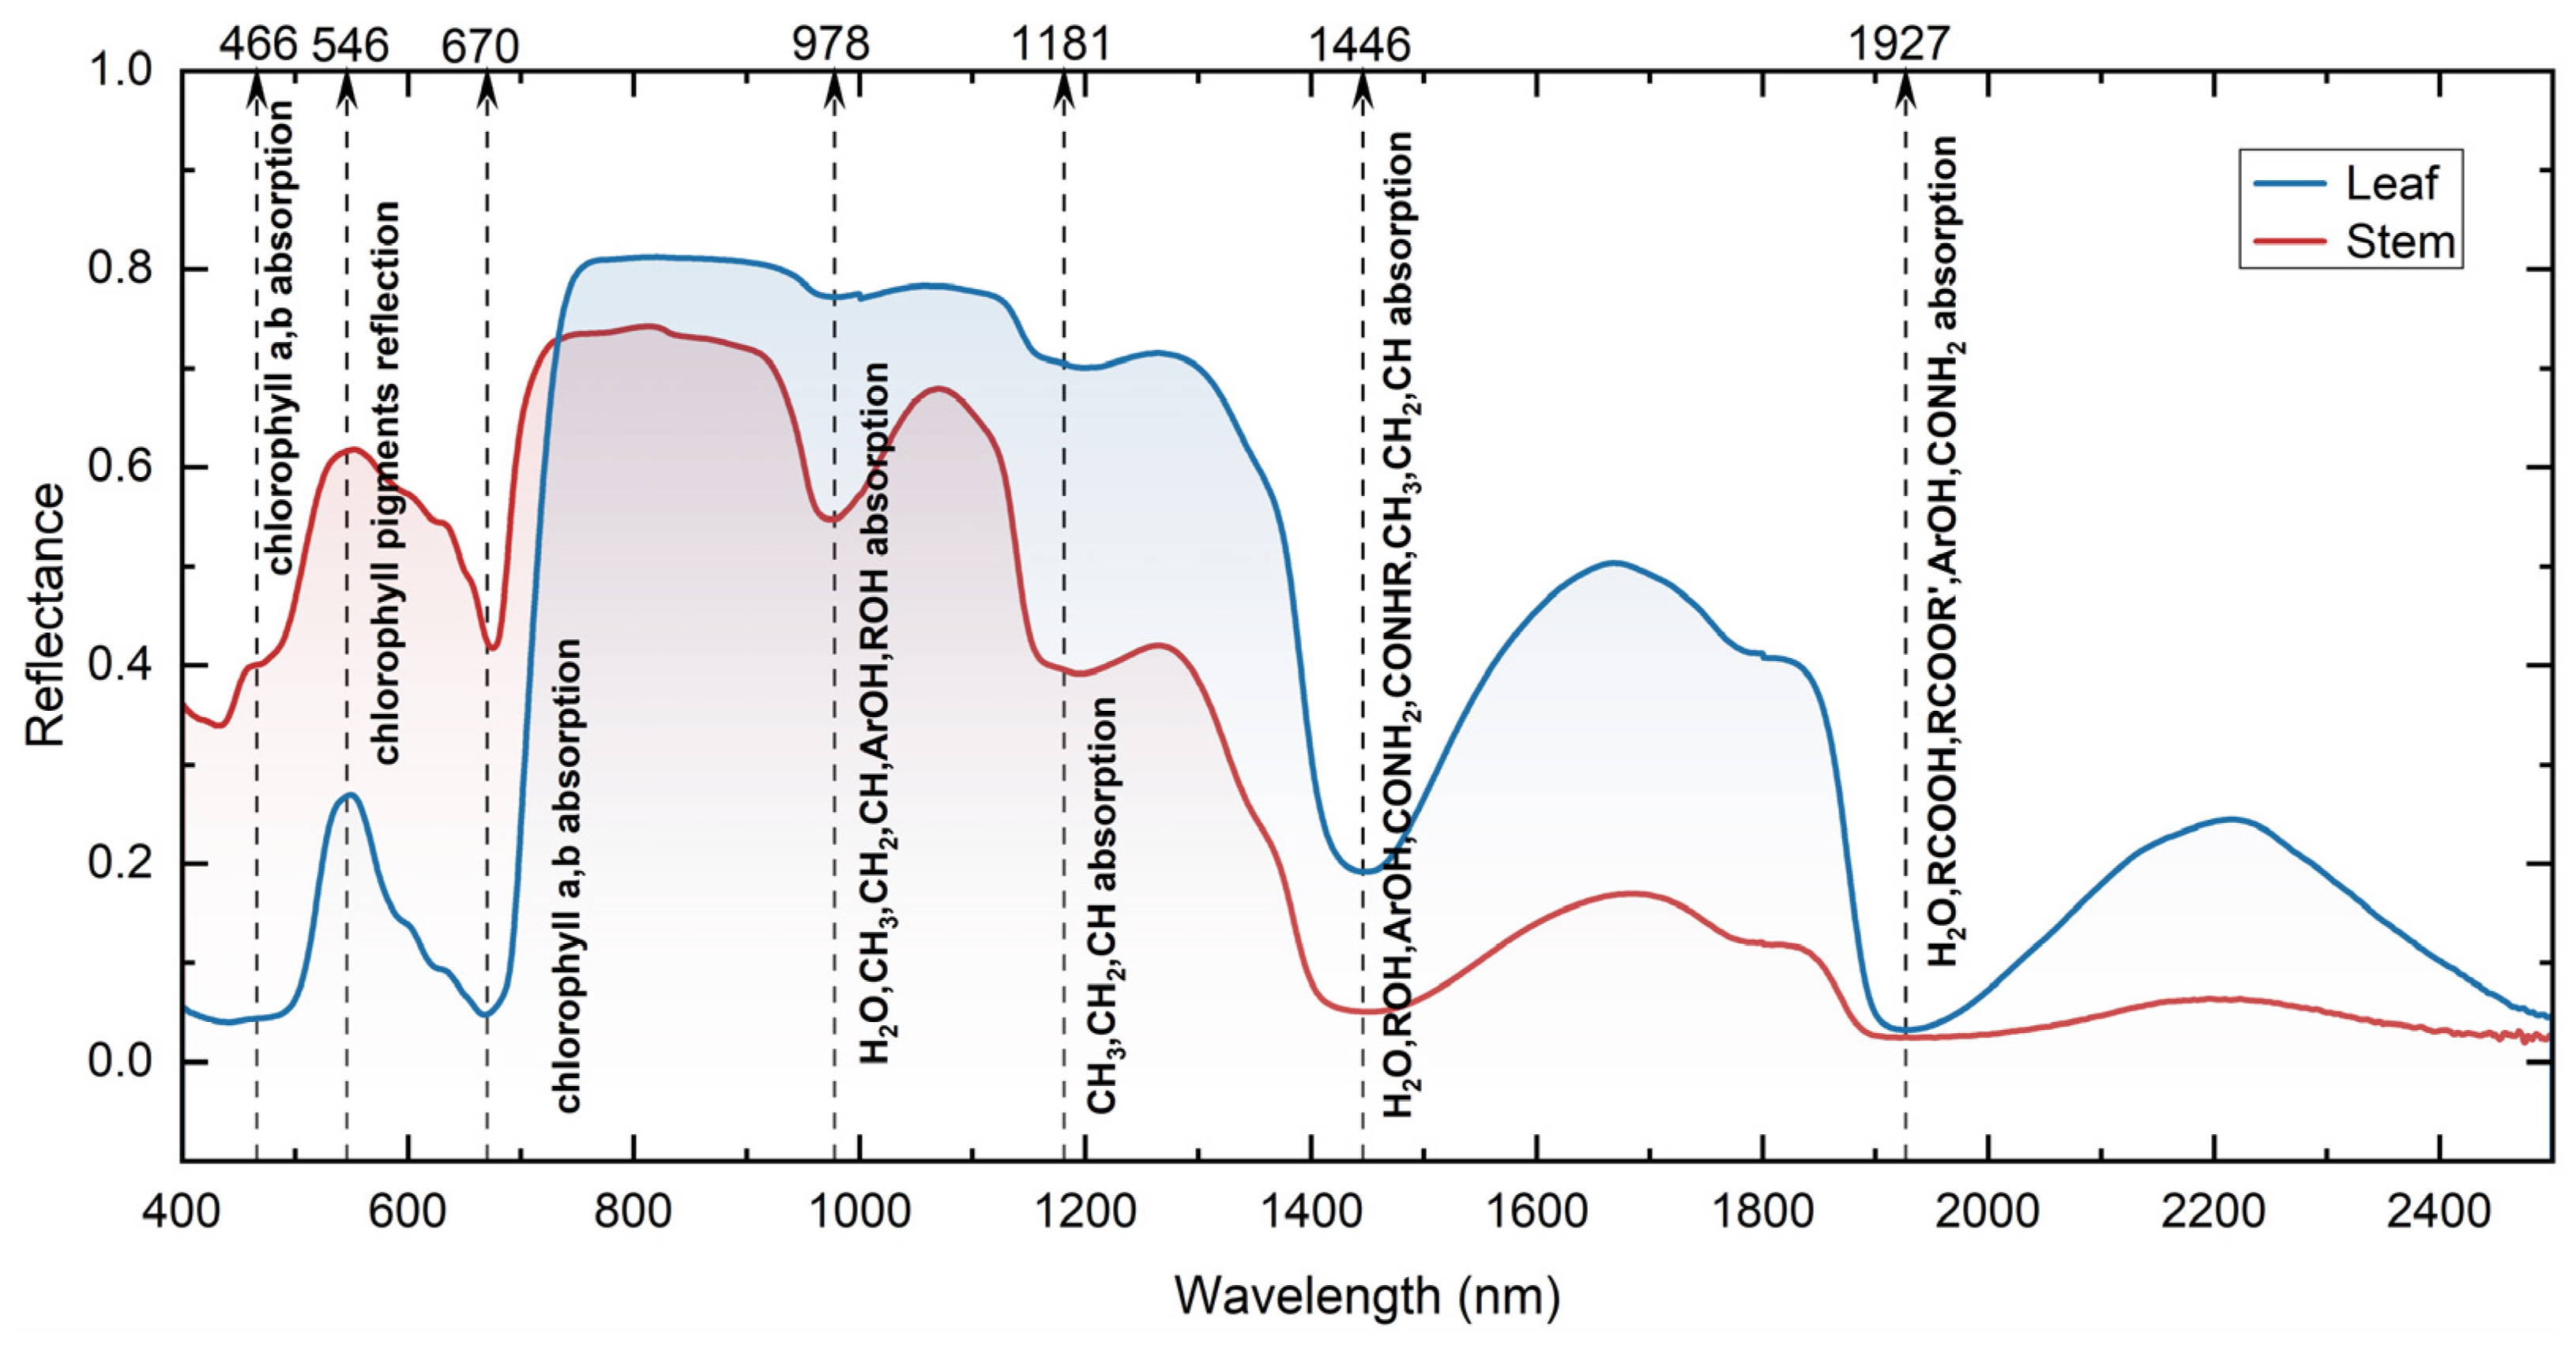
As depicted in Figure 4, the spectral profiles of the leaf and stem exhibit a similar shape owing to the fact that the samples all belong to the vegetative category and share the same absorption peaks. In the visible range (400–780 nm), light absorption is primarily determined by the presence of leaf pigments; chlorophyll pigments a and b selectively absorb wavelengths of blue (400–500 nm) and red (600–700 nm) for photosynthesis, resulting in a reduced absorption of green wavelengths (500–600 nm), thereby imparting green coloration to the vegetables [31]. In the NIR range (780–2500 nm), light absorption is primarily affected by the structural characteristics and contents of the leafy vegetables. The bulk of the light energy is transmitted and reflected in the wavelength range of 780–1400 nm, and it is mainly governed by the absorption of vegetables’ water content in the wavelength range of 1400–2500 nm. Absorption bands near 960 nm, 1100 nm, 1400 nm, and 1900 nm are influenced by the molecular structure in the vegetables’ contents [32]. These are overtone or combination bands of the fundamental absorption bands due to the vibrational and rotational transitions, and they encompass the “bond vibration” and combinations of overtones of the fundamental C–H, O–H, and N–H bonds [33].
It is evident that the shape of the reflection spectrum of leafy vegetables is inherently linked to two pivotal elements: water content and pigmentation. Moreover, an array of secondary metabolites, encompassing polyphenols, alkaloids, glucosinolates, volatile constituents, and vitamin C, may also exert influence on shaping the reflection spectrum of leafy vegetables [2].

3.2. Spectral Pretreatment

In this study, the spectral preprocessing methods SG, SNV, and MSC were applied to the spectra. The SG preprocessing employed a window size of 21 and a polynomial order of 3. The resultant preprocessed spectra served as inputs to construct the LDA classification model. The preprocessing method that yielded the highest classification accuracy was selected for this experiment.
Table 2 showcases the LDA classification accuracies of the spectral data for both the leaf and stem of the leafy vegetables after undergoing various preprocessing methods. It is evident that the classification accuracy improved significantly following spectral preprocessing, surpassing the performance of the unprocessed spectra. Notably, the SG preprocessing exhibited superior results, achieving higher accuracy levels. These outcomes underscore the efficacy of the SG method, thus justifying its application in this research endeavor.

3.3. Selected Wavelengths and Classification Results

3.3.1. Wavelengths Selection

Through the implementation of the GA, the excessive number of wavelengths, originally comprising 2101, was effectively diminished to a more manageable and pertinent subset. The maximum number of GA-selected wavelengths was set to 30 in this study. Subsequently, SS, RF, and ANOVA were employed to assess the significance of each wavelength selected by the GA. This evaluation identified the wavelengths exhibiting elevated importance values, signifying their prominence in the classification task. These wavelengths, distinguished by their high importance, emerged as the optimal candidates for further analysis and utilization.
Table 3 presents the wavelengths selected by the GA in the leaf spectra and stem spectra. There were 28 and 25 selected wavelengths in the leaf spectra and stem spectra, respectively.
Figure 5 shows the important values of the GA-selected wavelengths, evaluated by using SS, RF, and ANOVA, respectively. The GA-selected wavelengths are displayed in descending order of importance, and the important values are scaled between 0 and 1.
In Figure 5a, we used the randomized lasso method to subsample the training data with a 0.75 ratio 200 times. Then, the coefficients of these unimportant wavelengths were compressed to zero by the lasso, achieving both accurate parameter estimation and wavelength selection. Finally, we calculated the frequency of each wavelength that was considered significant in the 200 selections. As a result, the importance of each GA-selected wavelength could be evaluated with its frequency.
For Figure 5b, the order of the wavelengths selected by the GA was randomly shuffled and sent to the RF classifier to evaluate their importance, which was repeated 20 times. In the end, the importance of each wavelength was calculated as the mean of the 20 values.
For Figure 5c, we calculated the F-value of each wavelength within the organic and non-organic groups; then, it was used to gauge the importance of each GA-selected wavelength in the experiment.

3.3.2. Classification Results

In order to assess the reliability of the SS, RF, and ANOVA methodologies, wavelengths were ranked in descending order of importance. The foremost 10 pivotal wavelengths and the trailing 10 of significance were meticulously selected as inputs for the LDA classifier, respectively. Subsequently, a comparative analysis of their classification performance was conducted.
Table 4 and Table 5, respectively, present the classification outcomes of the testing set of the leaf spectra and stem spectra. The training set was composed of 70% of the spectra, while the remaining 30% constituted the test set. To ensure robustness, the classification process was repeated 20 times, with the dataset shuffled prior to each iteration. The reported results represent the average performance across these 20 iterations.
The effectiveness of the SS, RF, and ANOVA methods in wavelength evaluation was evident. It was observed that utilizing the first 10 important wavelengths for classification yielded superior outcomes compared to employing the last 10 important wavelengths. Nevertheless, this does not imply that the latter wavelengths were devoid of utility; rather, they carried a relatively lower degree of discerning information for classification purposes. Furthermore, the classification results were subject to the interplay of various factors, including the number of wavelengths and their specific combinations. Notably, alternative combinations of wavelengths, encompassing both the initial and final important wavelengths, and an ample inclusion of the latter important wavelengths in the classification process had the potential to yield improved results.
The SS method emerged as the more reliable approach for evaluating the importance of wavelengths. Firstly, when utilizing the first 10 important wavelengths identified through SS, the classification accuracy and f1 score exceeded 90%, surpassing the performance achieved using RF and ANOVA. Secondly, a notable discrepancy in classification accuracy and f1 score was observed between the first 10 important wavelengths and the last 10 important wavelengths in SS, amounting to a 7% difference. Consequently, GA combined with SS emerged as a trustworthy and optimal method for wavelength selection. By leveraging this method, the classification process was optimized through the selection of the most pertinent and crucial variables, leading to a significant reduction in the number of variables and a subsequent decrease in computational complexity. Moreover, it allowed for the flexibility of choosing an appropriate number of variables based on specific requirements and practical considerations.
No discernible differentiation was observed between the utilization of vegetable leaves and stems for the purpose of identifying the four organic leafy vegetables. Both approaches proved effective in distinguishing the four types of organic vegetables from their non-organic counterparts. Remarkably, employing a mere 10 wavelengths achieved a classification accuracy of 92.1% in the leaf spectra and 91.1% in the stem spectra. Furthermore, it is worth noting that the classification accuracy can possibly be further enhanced by increasing the number of important wavelengths.

3.4. Application Based on the Selected Wavelengths

The VIS-NIR spectrum encompasses a vast range of 2101 wavelengths, rendering the equipment required to capture the entire spectrum prohibitively expensive for widespread utilization in authenticating organic leafy vegetables within the market. While employing the most pivotal wavelengths in LDA classification yields remarkable results, it is imperative to recognize that the adjacent wavelengths should not be disregarded as inconsequential. Consequently, by meticulously considering the selected wavelengths and their associated importance values and locations, as Figure 6 shows, we can strategically curtail the cost of the spectrometer by discerningly identifying and selecting a judicious subset of bands from the full VIS-NIR spectrum. In doing so, we strike an optimal balance between cost-effectiveness and the retention of essential spectral information necessary for accurate authentication and classification.
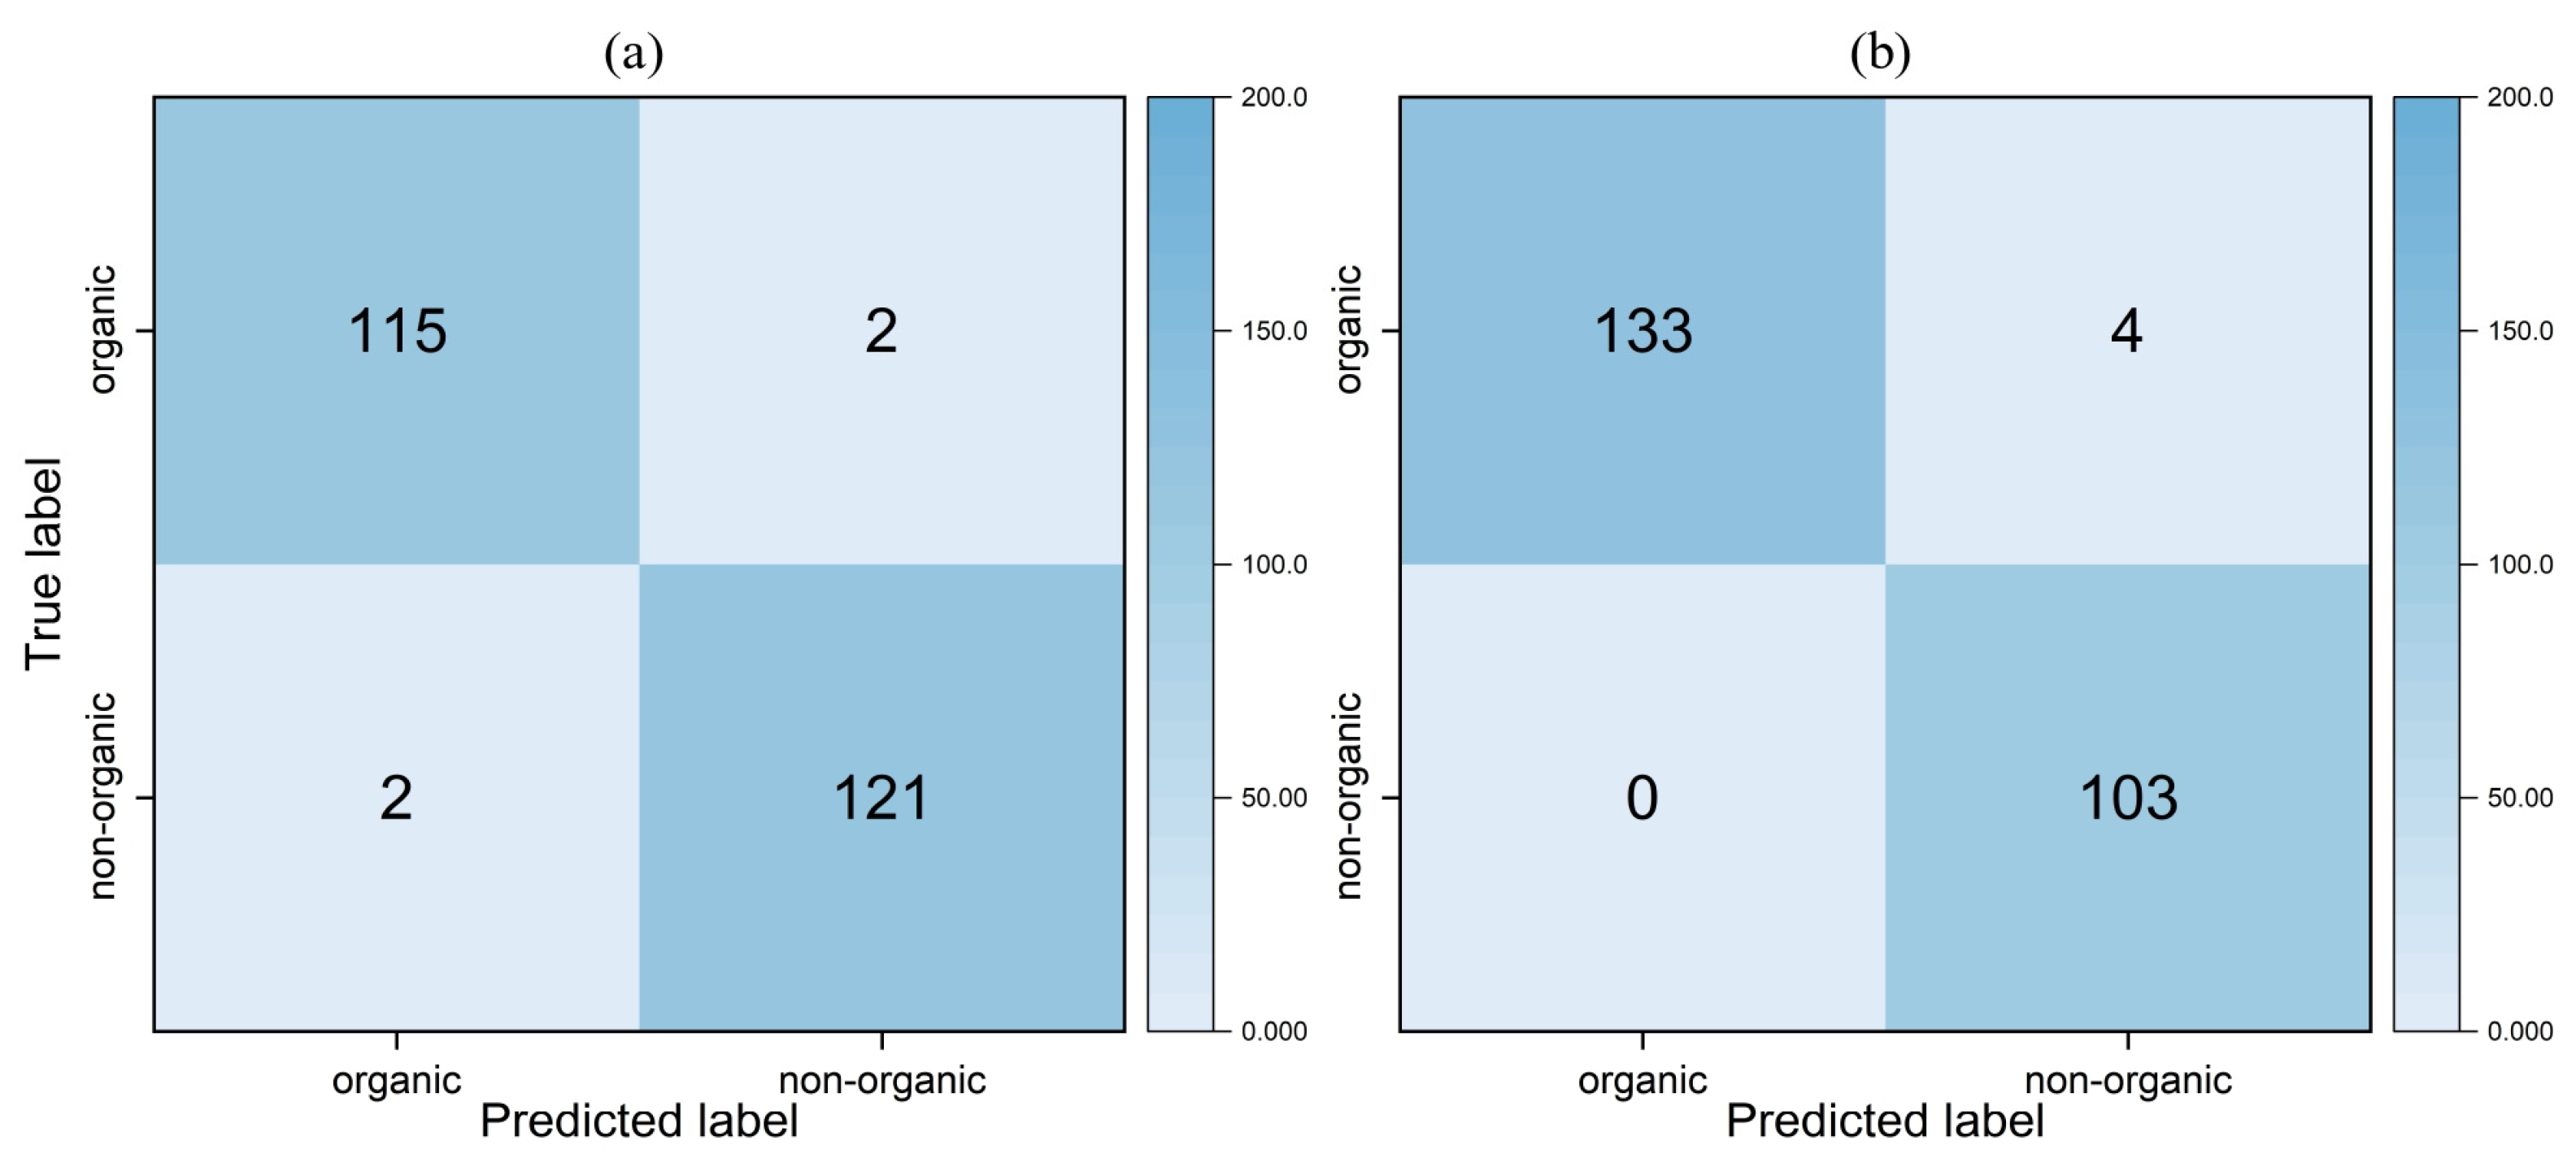
Table 6 and Figure 7 present the LDA classification outcomes of the testing set obtained using these selected bands in the leaf spectra and stem spectra. Notably, their classification accuracies and f1 scores surpass those achieved by employing a number of selected wavelengths as described in Section 3.3.2.
The excellent classification results unequivocally validate the practicality and dependability of employing the number, significance, and placement of the chosen wavelengths to ascertain the suitable VIS-NIR bands. It also substantiates the viability and efficacy of utilizing a discerning selection of suitable VIS-NIR bands in combination with LDA for accurate classification of organic and non-organic leafy vegetable spectra.

4. Discussion

In this endeavor, we enhance the discernment of organic from non-organic leafy vegetables by judiciously selecting wavelengths within the visible and near-infrared spectrum. This judicious wavelength selection augments the classification model’s accuracy, reduces computational intricacies, and imbues the resultant classifications with heightened interpretability to a considerable degree. As delineated in Table 7, it becomes evident that the performance of the GA-LDA approach surpasses that of other methods reliant upon the entire VIS-NIR spectrum when it comes to classifying the leaf and stem spectra of these leafy vegetables. For the GA-LDA approach, when employing the first 10 important wavelengths evaluated by SS, it achieves classification accuracies of 92.1% and 91.1% for the leaf and stem spectra of the vegetables, respectively; when utilizing the selected spectral bands for classification (550–910 nm and 1380–1500 nm for the leaf spectra, 750–900 nm and 1700–1820 nm for the stem spectra), the accuracies for the leaf and stem spectra of the vegetables notably rise to 98.3% each. There are few studies on the identification of organic leafy vegetables. NIR combined with LDA was used to classify organic and traditional cultivation as well as hydroponic lettuce, which obtained classification accuracies of 77.3% and 68.2% when using a successive projections algorithm (SPA)-LDA and stepwise formulation (SW)-LDA methods, respectively [12]. Birse et al. used ambient mass spectrometry and inductively coupled plasma mass spectrometry technology to distinguish between organic and non-organic leeks, achieving an accuracy ranging from 92.5% to 98.1% [11]. Araújo et al. used a combination of multiple elements and machine learning methods to distinguish between organic and non-organic lettuce, achieving a classification accuracy of 92% [15]. Compared to the aforementioned studies, this research has also achieved excellent classification results. When using selected spectral bands for classification, it can achieve an accuracy of 98%. Furthermore, this study encompasses four different categories of leafy vegetables, not just one.
Analyzing the wavelength distribution selected by the GA in Figure 6, it becomes evident that the classification outcomes in the leaf spectra primarily relied upon wavelengths proximate to 700 nm, 820 nm, and 1400 nm due to their abundance. Furthermore, the 10 most influential wavelengths assessed with SS were predominantly situated around 700 nm, 820 nm, 1400 nm, 2000 nm, and 2500 nm. The classification results in the stem spectra were predominantly affected by wavelengths in the vicinity of 800 nm, 1780 nm, and 2400 nm. By combining these findings with Figure 4, we can infer that the authentication of the four organic leafy vegetables, based on their leaves, may be significantly influenced by factors such as chlorophyll a, b (around 700 nm), water molecules, ROH, ArOH, and substances containing CONH2, CONHR, CH3, CH2, or CH groups (around 1400 nm). However, to the best of our knowledge, the selected wavelengths in the stem spectra do not provide conclusive insights into the substances influencing the classification results for the stems of the four leafy vegetables. Notably, the wavelength near 800 nm exhibits significance not only in the identification of the leaves but also in the stems of these organic leafy vegetables.
Leafy vegetables contain varying levels of different phytochemicals and compounds, such as glucosinolates, vitamin C, polyphenols, and carotenoids [1,2]. The content of these substances affects the VIS-NIR spectral reflectance of the leafy vegetables. Additionally, the physical properties of the vegetables, such as texture, color, and size, also influence their spectral reflectance. All of these factors pose challenges for the spectral classification of organic and non-organic leafy vegetables. In Figure 3, the VIS-NIR spectral reflectances of the organic leafy vegetables are lower than those of the non-organic leafy vegetables, which may be attributed to their different cultivation practices. In organic cultivation, organic fertilizers are used, potentially leading to increased levels of phytochemicals and compounds within the vegetables; another possible reason could be that vegetables exposed to stress-inducing environments caused by pests may enhance the production of natural defense compounds from secondary metabolism, thus increasing the levels of phytochemicals and compounds within the vegetables. Therefore, the increase in the content of phytochemicals and compounds within organic leafy vegetables results in lower VIS-NIR spectral reflectance compared to non-organic leafy vegetables.
The classification of organic and non-organic leafy vegetables is influenced by numerous factors. Variations in organic vegetable certification standards and differences in growing conditions across different locations and time periods can also pose challenges to the identification of organic leafy vegetables. Subsequent research will be conducted on the spectral classification of organic and non-organic leafy vegetables by incorporating spectral data from a wider range of vegetables sourced from different locations and time periods.

5. Conclusions

The obtained results clearly demonstrate the effectiveness of using VIS-NIR spectroscopy in conjunction with wavelength selection methods and linear discriminant analysis to distinguish between the four types of organic leafy vegetables and their non-organic counterparts. Utilizing either the leaves or stems of these leafy vegetables can achieve excellent results, providing a comprehensive approach for authentication. The principal research conclusions are as follows:
(1)
The primary accomplishment lies in the identification of key spectral bands for the classification of organic leafy vegetables. We analyzed the distribution of wavelengths selected by a genetic algorithm, combined with the distribution of the ten most important wavelengths, as well as the number of the selected wavelengths distributed in a certain location. Spectral classification bands for the leaves and stems were defined in the ranges of 550–910 nm and 1380–1500 nm and 750–900 nm and 1700–1820 nm, respectively. Utilizing these selected bands for classification, we achieved an accuracy of 98.3% for both leaf and stem spectral classifications. This analysis also revealed that specific wavelengths, such as those around 700 nm, 820 nm, and 1400 nm, significantly impact leaf spectral classification, while wavelengths near 800 nm, 1780 nm, and 2400 nm play a substantial role in stem spectral classification. The identification of key spectral bands is of utmost significance as it allows for the effective identification of organic leafy vegetables instead of using the full spectral bands, thereby reducing the costs associated with visible and near-infrared spectrometers.
(2)
Our approach not only achieved high classification accuracy but also proved to be as efficient as the methods utilizing the entire visible and near-infrared spectrum, such as principal component analysis–linear discriminant analysis, principal component analysis–support vector machine, and partial least squares–discriminant analysis. Furthermore, it provides interpretability by revealing the wavelengths significantly influencing vegetable spectral classification.
(3)
Additionally, we found that using spectroscopic pre-processing methods, such as the Savitzky–Golay method, enhances the accuracy of the linear discriminant analysis model for classification. When evaluating the importance of wavelengths selected by the genetic algorithm using stability selection, random forest, and analysis of variance methods, we observed that the use of the first ten important wavelengths yielded superior classification results compared to the latter ten, showing the effectiveness of the evaluating methods. Notably, the stability selection method outperformed the other methods in terms of classification results.
This work provides an economical, rapid, and non-destructive method for identifying organic leafy vegetables. However, factors such as the origin of vegetables, harvest time, and differences between organic and traditional cultivation conditions can impact the identification of organic leafy vegetables. Subsequent research should take these factors into account, collect samples from as many different locations and harvest periods as possible to enhance the robustness of classification models, and optimize wavelength selection algorithms. This technology can also be applied to the identification of other organic leafy vegetables.

Author Contributions

Conceptualization, Y.W. and Z.H.; methodology, Y.W.; software, Y.W. and Y.M.; investigation, Y.W., B.W. and Y.M.; resources, B.W. and M.W.; data curation, Y.W. and Y.M.; writing—original draft preparation, Y.W. and M.W.; writing—review and editing, Y.W., B.W. and Z.H.; visualization, Y.W., B.W. and Y.M.; supervision, Q.F. and Z.H.; project administration, Q.F. and Z.H.; funding acquisition, Z.H. All authors have read and agreed to the published version of the manuscript.

Funding

This research was funded by the National Science Fund for Distinguished Young Scholars (Grant No. 62125505); the Shanghai Outstanding Academic Leaders Plan.

Institutional Review Board Statement

Not applicable.

Informed Consent Statement

Not applicable.

Data Availability Statement

The data presented in this study are available from the corresponding author upon request.

Acknowledgments

The authors thank the editor and anonymous reviewers for providing helpful suggestions for improving the quality of this manuscript. We would also like to thank Nanjing Planck Technology and Trade Company (Nanjing, China) for providing organic leafy vegetables and Shanghai Space-OE Technology Co., Ltd., (Shanghai, China) for its technical support.

Conflicts of Interest

The authors declare no conflict of interest.

References

  1. Kumar, S.; Shekhar, C. Nutritional components in green leafy vegetables: A review. J. Pharmacogn. Phytochem. 2020, 9, 2498–2502. [Google Scholar] [CrossRef]
  2. Lima, G.P.P.; Borges, C.V.; Vianello, F.; Cisneros-Zevallos, L.; Minatel, I.O. Phytochemicals in organic and conventional fruits and vegetables. In Fruit and Vegetable Phytochemicals: Chemistry and Human Health, 2nd ed.; John Wiley & Sons: Hoboken, NJ, USA, 2017; pp. 1305–1322. [Google Scholar] [CrossRef]
  3. Olle, M.; Williams, I.H. Organic Farming of Vegetables. In Sustainable Agriculture Reviews; Lichtfouse, E., Ed.; Springer: Dordrecht, The Netherlands, 2012; Volume 11, pp. 63–76. [Google Scholar] [CrossRef]
  4. Rahman, S.M.E.; Mele, M.A.; Lee, Y.T.; Islam, M.Z. Consumer preference, quality, and safety of organic and conventional fresh fruits, vegetables, and cereals. Foods 2021, 10, 105. [Google Scholar] [CrossRef] [PubMed]
  5. Rana, J.; Paul, J. Consumer behavior and purchase intention for organic food: A review and research agenda. J. Retail. Consum. Serv. 2017, 38, 157–165. [Google Scholar] [CrossRef]
  6. Durham, T.C.; Mizik, T. Comparative economics of conventional, organic, and alternative agricultural production systems. Economies 2021, 9, 64. [Google Scholar] [CrossRef]
  7. Giannakas, K.; Yiannaka, A. Food Fraud: Causes, Consequences, and Deterrence Strategies. Annu. Rev. Resour. Econ. 2023, 15, 85–104. [Google Scholar] [CrossRef]
  8. Callao, M.P.; Ruisánchez, I. An overview of multivariate qualitative methods for food fraud detection. Food Control 2018, 86, 283–293. [Google Scholar] [CrossRef]
  9. Danezis, G.P.; Tsagkaris, A.S.; Camin, F.; Brusic, V.; Georgiou, C.A. Food authentication: Techniques, trends & emerging approaches. TrAC Trends Anal. Chem. 2016, 85, 123–132. [Google Scholar] [CrossRef]
  10. Picó, Y. Geographical, Botanical, and Species Origin, Method of Production and Food Frauds Detection. In Food Authentication: Management, Analysis and Regulation; Georgiou, C.A., Danezis, G.P., Eds.; John Wiley & Sons: Chichester, UK, 2017; pp. 431–449. [Google Scholar] [CrossRef]
  11. Birse, N.; McCarron, P.; Quinn, B.; Fox, K.; Chevallier, O.; Hong, Y.; Elliott, C. Authentication of organically grown vegetables by the application of ambient mass spectrometry and inductively coupled plasma (ICP) mass spectrometry; The leek case study. Food Chem. 2022, 370, 130851. [Google Scholar] [CrossRef] [PubMed]
  12. Brito, A.L.B.; Araújo, D.A.; Pontes, M.J.C.; Pontes, L.F.B.L. Near infrared reflectance spectrometry classification of lettuce using linear discriminant analysis. Anal. Methods 2015, 7, 1890–1895. [Google Scholar] [CrossRef]
  13. Zhou, L.; Ma, Y.; Yao, J.; Zhang, M.; Fu, H.; Yang, J.; Liu, J.; Zhao, M.; Marchioni, E. Discrimination of chrysanthemum varieties using lipidomics based on UHPLC–HR-AM/MS/MS. J. Sci. Food Agric. 2023, 103, 837–845. [Google Scholar] [CrossRef]
  14. He, C.; Ji, Y.; Wu, B.; Wu, X.; Fu, H. Non-Destructive Classification of Chrysanthemum Tea Using Near-Infrared Spectroscopy (NIRS) and Fuzzy Improved Pseudoinverse Linear Discriminant Analysis (FIPLDA). In Analytical Letters; Taylor & Francis: Abingdon, UK, 2023; pp. 1–15. [Google Scholar] [CrossRef]
  15. Araújo, E.M.; de Lima, M.D.; Barbosa, R.; Alleoni, L.R.F. Using machine learning and multi-element analysis to evaluate the authenticity of organic and conventional vegetables. Food Anal. Methods 2019, 12, 2542–2554. [Google Scholar] [CrossRef]
  16. Yuan, Y.; Hu, G.; Chen, T.; Zhao, M.; Zhang, Y.; Li, Y.; Xu, X.; Shao, S.; Zhu, J.; Wang, Q.; et al. Improved discrimination for Brassica vegetables treated with agricultural fertilizers using a combined chemometric approach. J. Agric. Food Chem. 2016, 64, 5633–5643. [Google Scholar] [CrossRef] [PubMed]
  17. Sinkovič, L.; Nečemer, M.; Ogrinc, N.; Žnidarčič, D.; Stopar, D.; Vidrih, R.; Meglič, V. Parameters for discrimination between organic and conventional production: A case study for chicory plants (Cichorium intybus L.). Food Chem. Toxicol. 2020, 136, 111109. [Google Scholar] [CrossRef]
  18. Sohn, S.I.; Pandian, S.; Zaukuu, J.L.Z.; Oh, Y.J.; Lee, Y.H.; Shin, E.K.; Thamilarasan, S.K.; Kang, H.J.; Ryu, T.H.; Cho, W.S. Rapid discrimination of Brassica napus varieties using visible and Near-infrared (Vis-NIR) spectroscopy. J. King Saud Univ.-Sci. 2023, 35, 102495. [Google Scholar] [CrossRef]
  19. Huang, Y.; Dong, W.; Sanaeifar, A.; Wang, X.; Luo, W.; Zhan, B.; Liu, X.; Li, R.; Zhang, H.; Li, X. Development of simple identification models for four main catechins and caffeine in fresh green tea leaf based on visible and near-infrared spectroscopy. Comput. Electron. Agric. 2020, 173, 105388. [Google Scholar] [CrossRef]
  20. Jordan, M.I.; Mitchell, T.M. Machine learning: Trends, perspectives, and prospects. Science 2015, 349, 255–260. [Google Scholar] [CrossRef] [PubMed]
  21. Katoch, S.; Chauhan, S.S.; Kumar, V. A review on genetic algorithm: Past, present, and future. Multimed. Tools Appl. 2021, 80, 8091–8126. [Google Scholar] [CrossRef]
  22. Mirjalili, S. Genetic Algorithm. In Evolutionary Algorithms and Neural Networks: Theory and Applications; Springer: Cham, Switzerland, 2019; Volume 780, pp. 43–55. [Google Scholar] [CrossRef]
  23. Meinshausen, N.; Bühlmann, P. Stability selection. J. R. Stat. Soc. Ser. B Stat. Methodol. 2010, 72, 417–473. [Google Scholar] [CrossRef]
  24. Wang, Y.H.; Zhang, Y.F.; Zhang, Y.; Gu, Z.F.; Zhang, Z.Y.; Lin, H.; Deng, K.J. Identification of adaptor proteins using the ANOVA feature selection technique. Methods 2022, 208, 42–47. [Google Scholar] [CrossRef] [PubMed]
  25. Junges, C.H.; Guerra, C.C.; Canedo-Reis, N.A.; Gomes, A.A.; Ferrão, M.F. Discrimination of whole grape juice using fluorescence spectroscopy data with linear discriminant analysis coupled to genetic and ant colony optimisation algorithms. Anal. Methods 2023, 15, 187–195. [Google Scholar] [CrossRef] [PubMed]
  26. Biau, G.; Scornet, E. A random forest guided tour. Test 2016, 25, 197–227. [Google Scholar] [CrossRef]
  27. Tharwat, A.; Gaber, T.; Ibrahim, A.; Hassanien, A.E. Linear discriminant analysis: A detailed tutorial. AI Commun. 2017, 30, 169–190. [Google Scholar] [CrossRef]
  28. Lasalvia, M.; Capozzi, V.; Perna, G. A comparison of PCA-LDA and PLS-DA techniques for classification of vibrational spectra. Appl. Sci. 2022, 12, 5345. [Google Scholar] [CrossRef]
  29. Chu, X.; Zhang, K.; Wei, H.; Ma, Z.; Fu, H.; Miao, P.; Jiang, H.; Liu, H. A Vis/NIR spectra-based approach for identifying bananas infected with Colletotrichum musae. Front. Plant Sci. 2023, 14, 1180203. [Google Scholar] [CrossRef] [PubMed]
  30. Dou, J.; Dawuti, W.; Zhou, J.; Li, J.; Zhang, R.; Zheng, X.; Ling, R.; Lü, G. Rapid detection of cholecystitis by serum fluorescence spectroscopy combined with machine learning. J. Biophotonics 2023, 16, e202200354. [Google Scholar] [CrossRef] [PubMed]
  31. Huete, A.R. Remote sensing for environmental monitoring. In Environmental Monitoring and Characterization; Artiola, J.F., Pepper, I.L., Brusseau, M.L., Eds.; Elsevier Academic Press: Burlington, MA, USA, 2004; pp. 183–206. [Google Scholar] [CrossRef]
  32. Simpson, M.B. Near-infrared spectroscopy for process analytical technology: Theory, technology and implementation. In Process Analytical Technology: Spectroscopic Tools and Implementation Strategies for the Chemical and Pharmaceutical Industries, 1st ed.; Bakeev, K.A., Ed.; John Wiley & Sons Ltd.: Chichester, UK, 2010; pp. 107–155. [Google Scholar] [CrossRef]
  33. Kumar, S.; Singh, R.; Dhanani, T. Rapid estimation of bioactive phytochemicals in vegetables and fruits using near infrared reflectance spectroscopy. In Fruit and Vegetable Phytochemicals: Chemistry and Human Health, 2nd ed.; John Wiley & Sons: Hoboken, NJ, USA, 2017; pp. 781–802. [Google Scholar] [CrossRef]
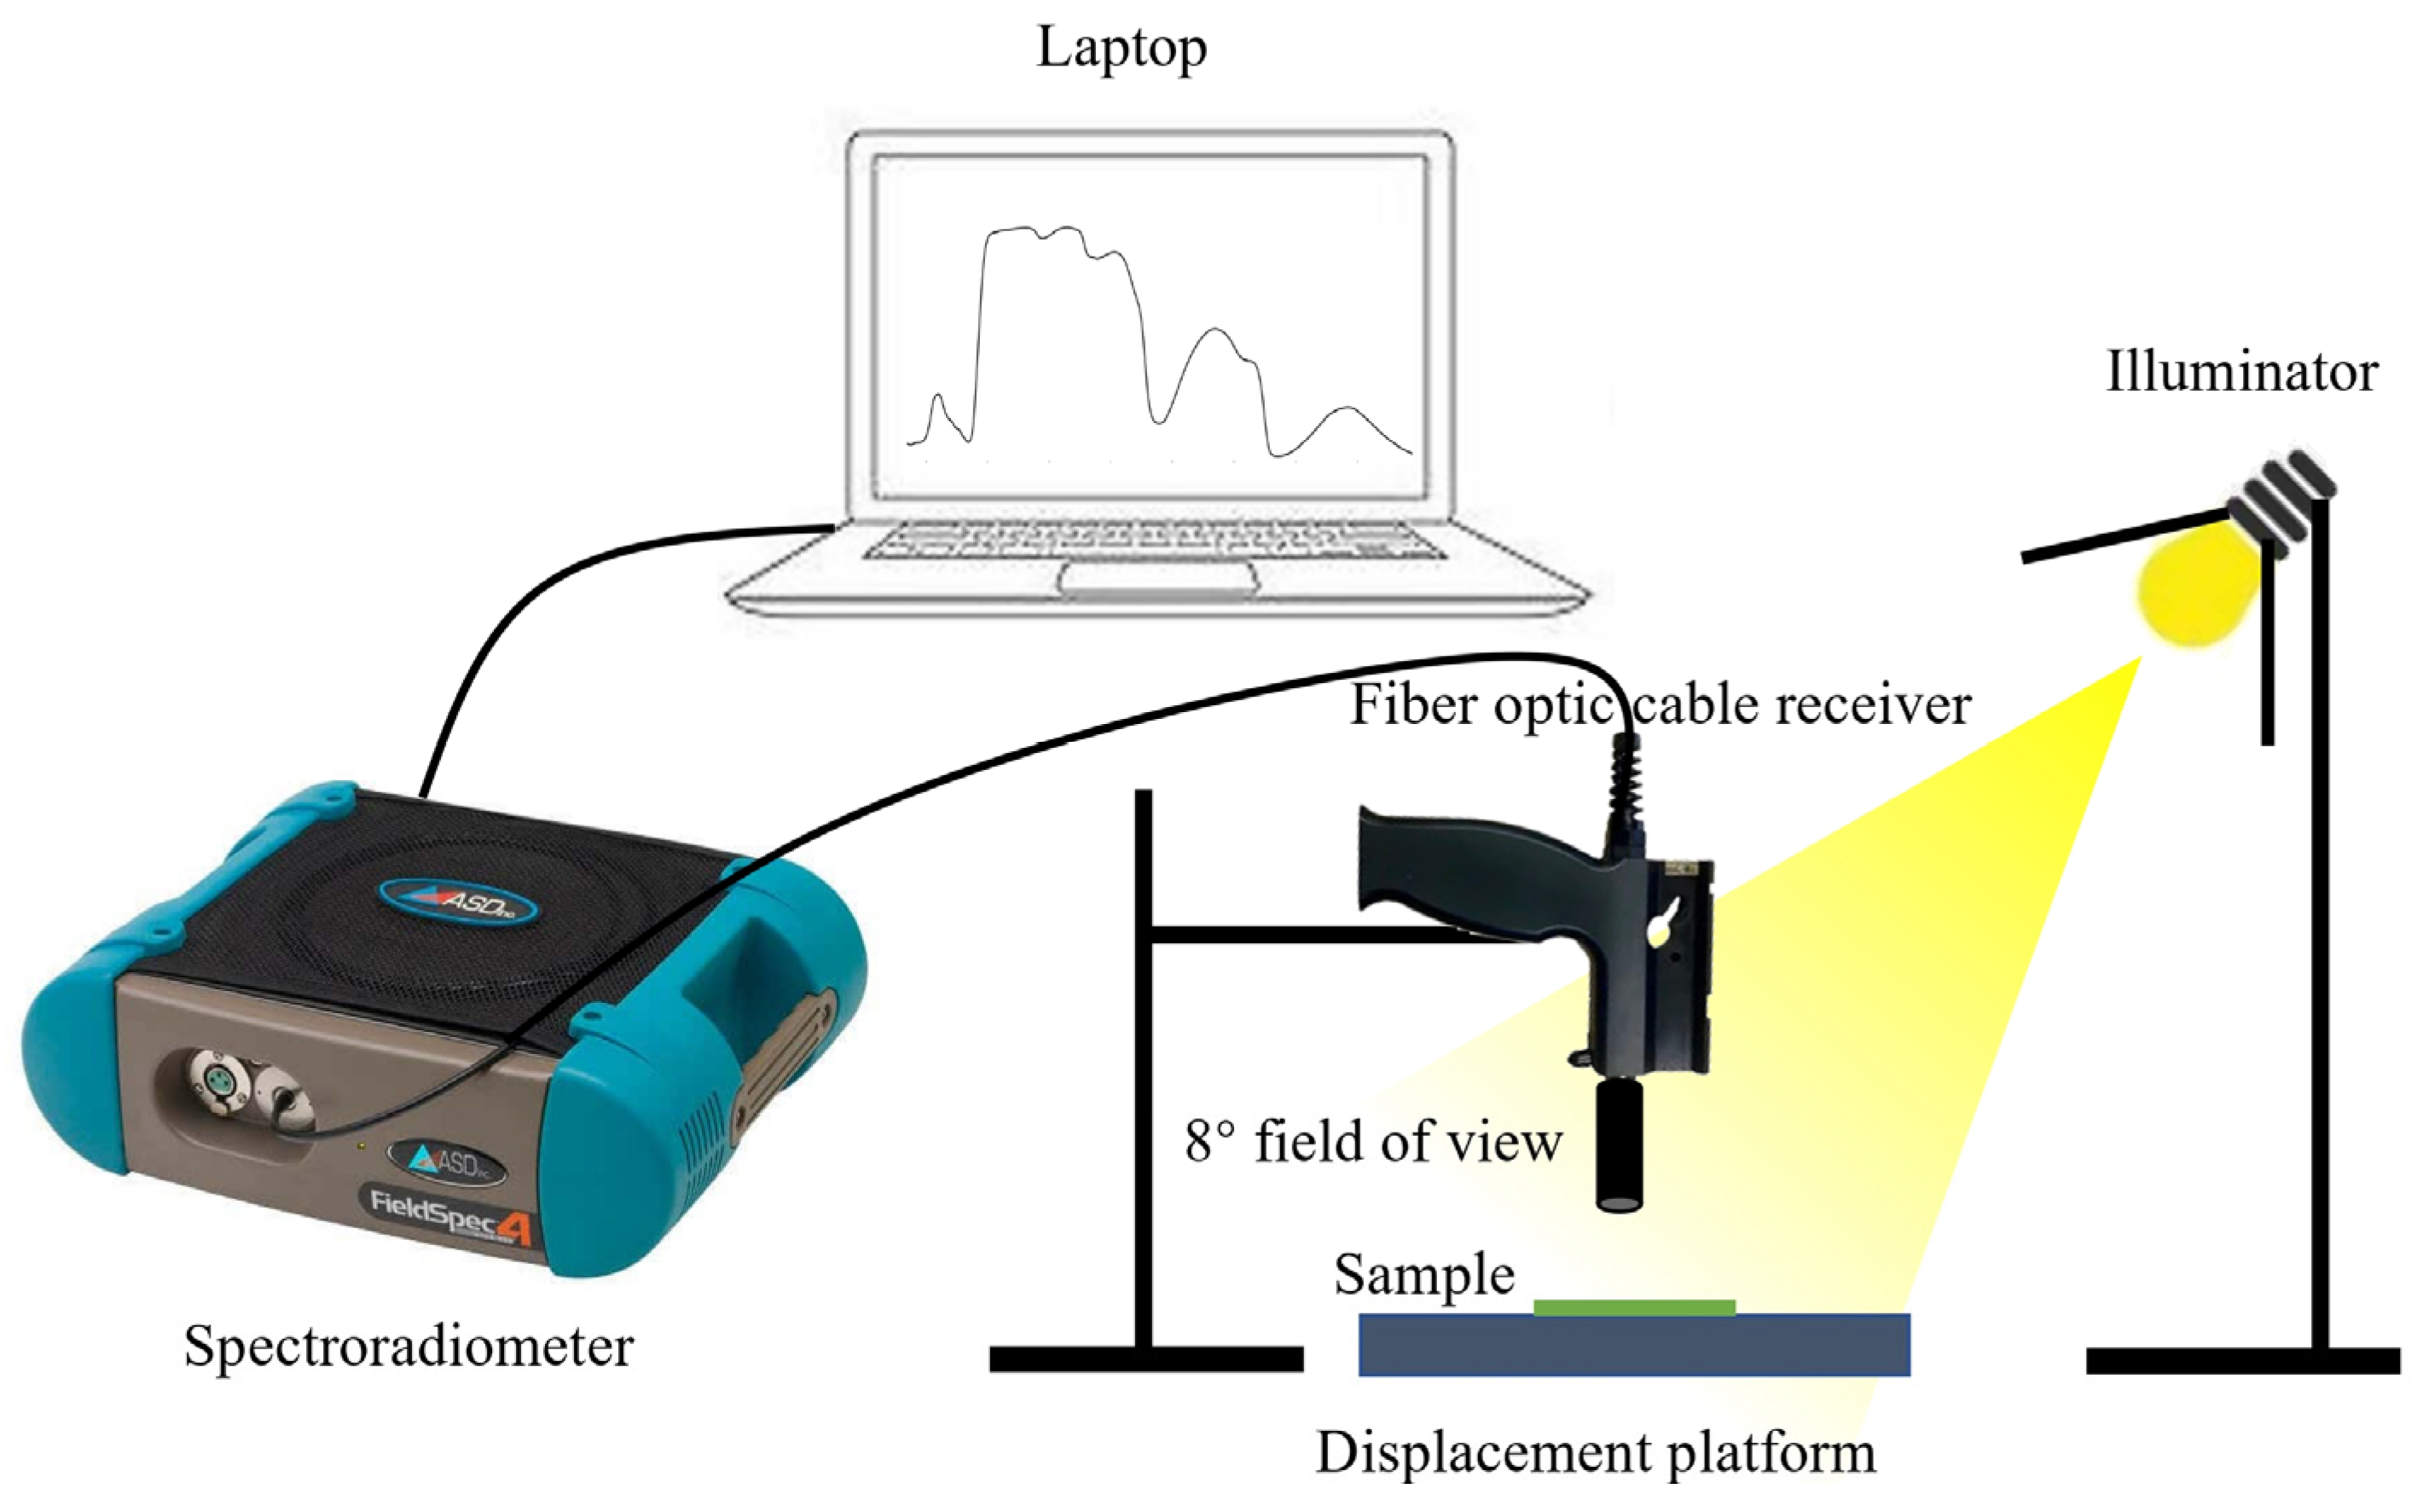
Figure 1. Experiment platform of the ASD system.
Applsci 13 11830 g001
Figure 2. Visible and near-infrared reflectance spectra of the four leafy vegetables; green curves (organic); red curves (non-organic).
Applsci 13 11830 g002
Figure 3. Average visible and near-infrared spectral curves of the four types of leafy vegetables.
Applsci 13 11830 g003
Figure 4. Visible and near-infrared reflectance spectra of the leaf and stem of leafy vegetables.
Applsci 13 11830 g004
Figure 5. Importance of GA-selected wavelengths, evaluated by (a) SS, (b) RF, and (c) ANOVA. GA, genetic algorithm; SS, stability selection; RF, random forest; ANOVA, analysis of variance.
Applsci 13 11830 g005
Figure 6. Chosen bands derived from the wavelengths (all the dots) selected by genetic algorithm, along with the locations of their first 10 significant wavelengths (the red dots) evaluated by the stability selection method. (a) The leaf spectra (550–910 nm, and 1380–1500 nm). (b) The stem spectra (750–900 nm and 1700–1820 nm).
Applsci 13 11830 g006
Figure 7. Confusion matrices of the classification results of the testing set by using selected bands in the visible and near-infrared spectrum. (a) The leaf spectra (550–910 nm and 1380–1500 nm). (b) The stem spectra (750–900 nm and 1700–1820 nm).
Applsci 13 11830 g007
Table 1. Confusion matrix of binary classification.
Predicted Label
True LabelPositiveNegative
PositiveTrue Positive
(TP)
False Negative
(FN)
NegativeFalse Positive
(FP)
True Negative
(TN)
Table 2. Classification accuracy of the LDA model in the test set using different spectral pretreatment methods (%).
SpectraRawSGSNVMSCSG + SNVSG + MSC
Leaf87.796.493.192.592.894.5
Stem88.196.994.894.690.191.1
Abbreviations: LDA, linear discriminant analysis; SG, Savitzky–Golay; SNV, standard normal variation; MSC, multiple scattering correction.
Table 3. Wavelengths selected by using genetic algorithm.
SpectraSelected Wavelengths (nm)
Leaf500, 577, 642, 655, 662, 687, 689, 691, 692, 741, 813, 815, 817, 821, 825, 832, 845, 1400, 1406, 1416, 1434, 1728, 2016, 2041, 2262, 2266, 2277, 2479
Stem723, 794, 810, 811, 813, 824, 827, 834, 842, 1687, 1716, 1717, 1726, 1750, 1756, 1757, 1776, 1807, 1812, 1819, 1904, 1969, 1990, 2390, 2423
Table 4. Classification results of the testing set of the leaf spectra by using selected wavelengths.
MethodWavelengthsSensitivity
(%)
Specificity
(%)
Accuracy
(%)
F1
(%)
SSFirst 1090.593.892.192.1
Last 1082.086.984.384.2
RFFirst 1084.285.784.984.8
Last 1081.486.584.083.6
ANOVAFirst 1083.577.680.581.0
Last 1080.182.581.181.1
The wavelengths were sorted in descending order of importance. Abbreviations: SS, stability selection; RF, random forest; ANOVA, analysis of variance.
Table 5. Classification results of the testing set of the stem spectra by using selected wavelengths.
MethodWavelengthsSensitivity
(%)
Specificity
(%)
Accuracy
(%)
F1
(%)
SSFirst 1087.694.691.190.6
Last 1077.991.384.783.3
RFFirst 1084.791.688.087.7
Last 1077.087.182.280.8
ANOVAFirst 1084.690.987.787.3
Last 1076.085.480.479.8
The wavelengths were sorted in descending order of importance. Abbreviations: SS, stability selection; RF, random forest; ANOVA, analysis of variance.
Table 6. Classification results of the testing set by using selected bands in visible and near-infrared spectrum (550–910 nm and 1380–1500 nm for the leaf spectra, 750–900 nm and 1700–1820 nm for the stem spectra).
SpectraSensitivity (%)Specificity (%)Accuracy (%)F1 (%)
Leaf98.398.498.398.3
Stem97.110098.398.5
Table 7. Classification results of the testing set of the leaf and stem spectra by using different methods.
SpectraMethodSensitivity
(%)
Specificity
(%)
Accuracy
(%)
F1
(%)
LeafPCA-LDA
with 10 principal variables
81.477.179.279.8
PCA-SVM
with 10 principal variables
86.977.782.383.1
PLS-DA
with 10 principal variables
92.191.191.691.7
GA-LDA
with first 10 important wavelengths
90.593.892.192.1
GA-LDA
with selected bands
98.398.498.398.3
StemPCA-LDA
with 10 principal variables
85.386.986.185.8
PCA-SVM
with 10 principal variables
87.986.987.487.4
PLS-DA
with 10 principal variables
87.692.890.389.9
GA-LDA
with first 10 important wavelengths
87.694.691.190.6
GA-LDA
with selected bands
97.110098.398.5
Abbreviations: PCA, principal component analysis; LDA, linear discriminant analysis; SVM, support vector machine; PLS-DA, partial least squares–discriminant analysis; GA, genetic algorithm. For the GA-LDA method, the important value of the GA-selected wavelengths was evaluated with SS (stability selection).
Disclaimer/Publisher’s Note: The statements, opinions and data contained in all publications are solely those of the individual author(s) and contributor(s) and not of MDPI and/or the editor(s). MDPI and/or the editor(s) disclaim responsibility for any injury to people or property resulting from any ideas, methods, instructions or products referred to in the content.