
Wind Load Distribution in Float Photovoltaic System

1
Trina Solar, Jongro-gu, Seoul 03142, Republic of Korea
2
SK E&S, Jung-gu, Seoul 03188, Republic of Korea
3
Department of Architectural Engineering, Gachon University, Sujeong-gu, Seongnam-si 13120, Republic of Korea
*
Author to whom correspondence should be addressed.
Appl. Sci. 2023, 13(22), 12144; https://doi.org/10.3390/app132212144
Submission received: 20 September 2023
/
Revised: 24 October 2023
/
Accepted: 6 November 2023
/
Published: 8 November 2023
(This article belongs to the Special Issue Structural Wind Engineering)
Abstract
:This paper investigates wind load distribution in float PV plants. Wave and wind load are dominant environmental load factors in determining design load in float PV plants. In particular, wind load is determined based on the numerical analysis results. The literature indicates that several input parameters exist, such as inlet angle and space between PV modules. An exemplary structure with ten arrays of PV modules was generated in this study. To investigate the wind load distribution in a float PV plant, the computational fluid dynamic (CFD) analysis was conducted with variables including wind direction (inlet angles) and three wind speeds (36.2, 51.7, and 70 m/s) in PV modules in the floating structure. Based on the numerical analysis, the wind load distribution of PV modules can be characterized with respect to the inlet angle and wind speed. The numerical results show that the wind loads in the central arrays are dominant.
1. Introduction
For decades, photovoltaic power generation technology has mainly focused on research that increases the efficiency of solar panel modules, and as a result, it has achieved “grid parity”, which is the point that the cost of photovoltaic power generation becomes the same as the cost from fossil fuels. However, considering the reality of the narrow land and an area-intensive industry, it seems difficult to build a large-scale power plant. Alternatively, floating photovoltaic generation is a technology derived to solve the problem of environmental destruction of such large-scale terrestrial photovoltaic power generation systems [1,2,3]. Yousuf et al. found that the average power capacity of floating photovoltaic (PV) panels is 11 higher than the average capacity of PV panels installed on the ground [1].
Recently, efforts have been actively made to preemptively prepare for climate disasters through carbon neutrality. Accordingly, research on PV structures, one of the new renewable energies, is actively underway.
Ryu and Lee confirmed the effects of wind load, flow characteristics, and inclination angle on floating PV panels and buoys through numerical analysis. As a result, the wind load increased as the inclination angle of the solar panel increased [4].
Lee et al. confirmed the structural safety evaluation of a 2 MW floating PV power generation structure through flow analysis and seaworthiness analysis. As a result, it was confirmed that the largest load occurred in the 1-row unit [5].
Choi et al. confirmed the effect of wind load on the solar panel array of a floating PV system through an indoor model experiment. Experiments have shown that the first and last rows of panels have the highest drag and lift coefficients because they are the first to encounter the wind [6].
Su et al. confirmed the effect of wave angle due to wind load on offshore PV panels through numerical analysis. The wind load on the offshore PV panels was determined throughout the wave cycle. Additionally, to maximize PV panel performance, pontoon movement should be considered when designing the PV system [7].
The load distribution caused by the wind load in the floating PV system was assessed using possible parametric studies with design parameters including wind speed, wind direction, and installation angle of PV modules. In this study, the design load was confirmed to install a floating PV power generation structure in salt-reclaimed land. In addition, the load effect on the structure was evaluated through the CFD analysis.
2. PV Generation System
2.1. Overview
When installing a solar module, the structure is fixed to the ground to resist the load on the ground, but when installed on the water surface, the boundary conditions are unstable, so proper design considerations are needed as a floating structure. Floating PV generation is a method of constructing a solar power plant on the surface of the water, and although it is similar in terms of system to existing solar power generation, it shows a big difference in installation method [1,2,3].
In the case of existing solar power plants, piles are installed on the ground, or existing structures to install solar modules and structures for fixing solar modules are built, and then solar systems are installed. Therefore, all the load on the solar module is transmitted to the foundation or ground through the piles.
Floating PV, however, does not require piles or foundations and is a system that floats on water using buoyancy and moorings, as shown in Figure 1. The transmission system from the power plant to the electric room and transmission track uses the same method as the existing ground solar power generation, except for the cable installation method. The cable from the solar power plant to the electric room is a method of building an underground line on the ground or transmitting power through an electric pole. However, water solar power generation mainly uses a method of diving cables underwater from power plants to the electric room through the riverbed topography or floating on the water to directly connect to the electric room.
The floating photovoltaic power system consists of floating structures to fix solar modules, buoyancy resisting gravitational loads transmitted from the structure, and a mooring system for fixing horizontal loads. The floating structure must provide strong support for the solar modules, be sufficiently resistant to external forces such as wind and wave loads, and ensure long-term durability against corrosion and fatigue given the special conditions of the water. In particular, in terms of structural safety and constructability, the structure is designed as a unit structure, and in order to be sensitive to the movement of the water surface, the connection of each structure is hinged to minimize the transmission of bending moment.
2.2. Mooring System
Most of the anchors used in conventional floating PV are gravity anchors that resist loads with their weight. However, in floating PV power plants, the load transmitted to the anchor from the mooring line is generated by the wind load on the power plant and the fluctuations caused by the movement of the water surface, and these loads are very difficult to predict. In addition, in the case of gravity-type anchors, the gravity-directed load can be simply predicted by its weight, but for horizontal forces, the friction force between the anchor and the ground is very difficult to predict, so it is problematic to predict the clear behavior related to ensuring overall mooring safety.
Figure 2 shows the load transfer mechanism for the floating PV structure. As shown in Figure 2, the mooring force due to the wind load can be estimated as a result of this study because all the loads applied to the PV panel are superimposed and transmitted to the mooring.
If the structure is placed continuously, the movement of the water surface may cause excessive bending moment loads on the structural members and destroy them, so it is competent to design and connect them at a certain length. Buoyancy materials applied to floating structures include concrete, steel, PE (Polyethylene), EPS (expanded styrofoam), EPP (expanded polypropylene), FRP (Fiber Reinforced Polymer), etc., depending on the application of the structure. But in floating solar power, plastic-based materials are mostly used for environmental, construction, and economic reasons. Buoyancy is the most important structural parameter to keep the PV plant on the water surface as it transfers the self-weight and gravitational loads of the plant to the water.
Therefore, long-term durability against buoyancy is a primary design concern, so not only short-term structural safety due to impact loads but also long-term durability against UV (ultraviolet) must be secured, and in terms of maintenance, it must be easy to repair and replace.
Mooring is a facility that fixes the displacement of the floating solar power plant, and while buoyant bodies resist gravitational loads, mooring must effectively resist rotational and horizontal loads. Considering the weather conditions in Korea, the water surface conditions also show excessive water level differences as the dry season and flood season are extreme.
Especially in the case of dams, the maximum water level difference can be more than 100 m, so the water level difference must be reflected in the design. When the water level drops, the power plant is likely to drift as the mooring line slackens, and when the water level rises, the mooring line pulls the power plant, causing the power plant to be submerged or destroyed. In addition, fixing the rotational displacement is also an important design factor for economic reasons, as the power generation is better when the solar module faces south.
In a conventional solar power plant, the structural facility transfers the load to the ground, and in a floating solar power plant, mooring plays a similar role to the foundation. The mooring system of floating PV power plants is divided into mooring lines and anchors, and mooring lines are mainly made of plastic materials, wire ropes, chains, etc. These ropes and other structural materials are only tension members, which can effectively resist tensile forces under applied loads but cannot resist compressive forces. Therefore, all loads acting on the anchor from the floating solar power plant are tensile forces acting in the opposite direction and horizontally to the direction of gravity.
3. Proposed Modeling Strategy
3.1. Analysis and Design of PV Power Plants
In designing the foundation of a PV power plant, it is necessary to consider the structural behavior of the power plant and the effects of the loads applied to it. In this paper, we investigated the design and load derivation methods for PV power plants through relevant design criteria and the existing research literature. In addition, the load effects required for the design of the foundation of the PV power plant were predicted.
The structural design of floating solar power plants in Korea is derived through the method proposed by the American Society of Civil Engineers (ASCE) provisions 7–16 and KDS 41 10 15 [8,9]. In the design of solar PV power plants, wind loads, snow loads, and live loads are considered and applied to the structural design, and structural safety is not evaluated independently from these loads but through load combinations for independently derived loads to consider all possible load effects. The load combinations proposed by ASCE 7–16 and KDS 41 10 15 are given in Table 1 [8,9].
The seismic, rainfall, and temperature loads are not considered in the design of PV power plants as lightweight structures, and the load effects of static, live, snow, wind, and fluid pressure are considered. In addition, fluid pressure is considered for floating PV power plants and not for ground PV power plants. Fluid loads in floating PV are mostly predicted by flow analysis, and there is no simple way to evaluate these loads. As the range of variables for the size of the plant, wave conditions, etc., is very large, it is not included in the scope of this research.
3.2. Evaluating Load Distribution
PV power plant consists of PV modules, a structure to support the PV modules, and a foundation to transfer the load to the ground. The structure is a plate structure, which has a relatively simple configuration to support the PV modules. In addition, the load is dominated by the wind load on the PV modules, so the structural design is determined by the wind load [10].
As shown in Figure 3, most PV structures use independent foundations, so the wind load distribution varies depending on the location of the power plant, so the results of this study can be used.
As a solar power plant is an area-intensive industry, the maximum amounts of solar modules are installed on a limited site with only enough spacing to prevent shading of the solar modules based on the winter solstice. Therefore, structures are installed according to the array direction of the solar modules, and each structure has an independent foundation.
The PV structure is a lightweight structure that meets the basic conditions of installing PV modules, and the structural calculation is very simple when deriving the load on the site area where it is installed. The loads applied to the design of PV structures were described earlier. In the structural design of the PV structure, the wind load is assumed to be applied in the horizontal direction, and the basic assumption is that it is calculated by considering the projected area of the structure [11,12].
So far, the load resistance performance of the PV power generation structures has been evaluated by reloading the wind load on the horizontal projected area for each structure installed independently according to the PV module array, as shown in Figure 3.
In structural design, the safety of the structure can be evaluated when the horizontal load is applied, but it is difficult to expect an accurate evaluation of the load transmitted to the ground. In other words, since the forward direction of the PV module is facing south, it is predicted that a large difference in the direction of the load transmitted to the ground will occur when the wind load is applied from the forward and backward directions of the PV module, respectively, and a large difference in the load transmitted to the power plant will occur depending on what flow characteristics the wind with fluid characteristics exhibits when passing through the PV module array as a whirlpool.
In addition, arbitrarily applying the wind load derived from the horizontal projection area without adding it is very inefficient in terms of structure, and it is difficult to expect positive economic effects. Therefore, considering that the wind load characteristics of the entire PV power plant will cause differences in load effects and considering this effect will lead to an economical design, in this service, flow analysis was performed to evaluate the wind load characteristics of the PV power plant, and the load characteristics transmitted to the ground were analyzed through the analysis results. By considering the load characteristics transmitted to the ground, it is intended to be utilized as a design basis for the foundation method.
4. Modeling Description
4.1. Design Variables for Wind Load Distribution for CFD Analysis
PV power plants transmit external loads based on independent foundations. The design standards suggest that only the horizontal projected area should be considered, but for the optimal design of the structural system, it is necessary to examine the wind load impact due to the geometry of the PV power plant, so the wind load impact on the PV modules was examined through flow analysis [13,14,15,16,17].
The wind load evaluation of solar panels was performed by a previous researcher. As a result, it was confirmed that the CFD analysis and the experimental results were consistent [18]. The wind tunnel test results showed that the average pressure coefficient and CFD simulation and experimental results were similar.
The PV power generation is most efficient when sunlight is incident perpendicular to the PV module. Considering the angle of incidence of sunlight, it is best to install PV modules at an angle of about 30, as addressed in Figure 4 [14]. However, the power production efficiency of solar modules has recently increased, and the power generation efficiency is not significantly different depending on the installation angle. When installing a PV power structure on the water, it is affected by various water levels and has the same effect when installed at 10 to 15 degrees [19,20]. Therefore, solar power plants installed in saltwater reclamation areas, which are being developed on a large scale, are mostly designed with a solar module angle of about 10 to 15 for economic reasons.
Considering the characteristics of PV power plants developed and constructed on a large scale in recent years, the installation angle of PV modules was assumed to be 12° in the flow analysis. In addition, since the wind load, which is the dominant load in the structural design of PV power plants, varies in each region, the design wind speed was divided into 30, 45, and 70 m/s to consider various regional characteristics, and the wind was divided into forward and backward directions relative to the PV module in consideration of the inclination angle of the PV module. These load design parameters are shown in Table 2. Two wind directions were considered forward (β = 0°) and backward (β = 180°), as shown in Figure 5.
4.2. Model Evaluation Strategy
The numerical analysis was performed by CFD analysis using ABAQUS [21]. The analysis model used a hexahedron-shaped trimmed mesh and consisted of a total of 81,758,581 grids. As the boundary condition, the velocity of the fluid was entered as the velocity condition in the air inlet. In the other air outlet, fluid flow was applied without back pressure under the pressure outlet condition. The pressure applied to the PV panel was extracted under the assumption that the airflow remains steady without considering the change over time as a steady state.
For the CFD analysis, it was assumed that about 189 solar modules would be installed, considering the efficiency of the analysis program. The CFD analysis was performed for the forward and backward directions of the PV module with the largest wind pressure area. The structural shape was first modeled considering the dimensions of the PV module, and the CFD model was constructed after setting the analysis conditions, including wind speeds. The analysis was divided into wind direction from the forward and backward of the PV modules.
Unlike the structural analysis, the number of finite elements in the analysis model is very large because the flow analysis must separately model the flow area where the fluid flow is induced in addition to the structural analysis model of the target structure. Therefore, considering the limitations of the program and the efficiency of the analysis, the flow analysis was performed on a power plant with 189 PV modules to evaluate the flow behavior caused by wind, as shown in Figure 6. The installation angle of the solar modules is assumed to be 12°, and the solar modules are 450 W modules from Company H, which are currently widely used in South Korea.
Considering the dimensions of these modules and the altitude of the sun, the spacing between the PV module arrays was calculated as the following Equation (1), and the spacing in the direction of the solar module arrays was assumed to be about 30 mm apart, considering the dimensions of the clamps to fix the modules in Figure 7.
where d is the allowable separation between the arrays (mm), l is the length of the longer side of the photovoltaic module (mm), is the installation angle of the photovoltaic module, and is the solar azimuth angle.
Figure 8 shows a schematic illustration of the structural geometry of the solar power plant, and the flow-influenced boundary induced by the fluid flow around the plant is modeled.
In Figure 9, the most dominant load on the PV power plant is the wind load, and since the structural form is very simple, the wind load on the power plant is transferred to the foundation, so the bottom of the PV module is assumed to be an arbitrary boundary condition. In general, the load transmitted to the foundation is derived through the reaction force of the boundary condition through structural analysis, but in flow analysis, the pressure applied to the solar module is directly derived by the behavior of the fluid, so an arbitrary boundary condition is assumed at the bottom of the solar module.
From these conditions, the load transmitted to the foundation was predicted by considering the fluid characteristics of the wind load on the PV power plant.
Figure 10 shows that the fluid flow was generated by dividing the flow field area into inlet and outlet, and the boundary of the side wall was given a resistance-free condition. For the inlet velocity, the boundary condition was the wind load under the normal speed. At the CFD analysis outlet pressure, an atmospheric pressure condition of 0 Pa was applied as the average static pressure condition.
Since the objective of the analysis is the wind load on the power plant, the wind pressure at each PV module array was applied. In order to evaluate the characteristics of the wind flow over the PV module array and the behavior at the end of the array, the wind pressure data can be extracted from the center and end of the PV module array.
5. Results and Analysis
5.1. CFD Results
The results of the CFD analysis to evaluate the load distribution characteristics of the PV power plant according to the wind behavior for each direction are shown in Figure 11 and Figure 12, and the velocity vectors for each direction are shown in Figure 13 and Figure 14.
As shown in Figure 11, as a result of forward direction analysis, it was confirmed that the one-array PV panel surface pressure increased as the inlet speed increased. As the wind quickly overflowed along the front of the solar module, a vortex was generated at the back of the first row, changing the angle of the wind incident on the solar module and causing the greatest wind pressure in the second row. In Figure 12, it is confirmed that the 10-array panel at the end generates a wind load that is about 52% lower than the wind load of the 10-array middle panel.
From the wind speed distributions and vectors in Figure 11 and Figure 12, it can be seen that the flow field region has dimensions about 15 times larger than the structural model, and judging from the wind load distribution, the wall boundary condition in the flow field region has a very small effect on the fluid behavior characteristics near the structural model.
As shown in Figure 13 and Figure 14, the wind from the forward and backward directions of the PV modules tends to decrease rapidly after the first row of PV module arrays is swept over. This means that the wind load on the PV modules decreases rapidly after the first row of PV modules is flown, which is characteristic of a fluid flowing over a certain obstacle.
It was confirmed that a wind load difference of up to 26% occurred between the wind load acting in the rear direction and the wind load acting in the front direction, depending on the wind direction.
The wind pressure along the array to check the pressure change at the center and end of the PV modules is presented in Table 3. The horizontal axis is the array of PV modules facing south, the vertical axis is the wind pressure generated on the PV modules, and the red and blue colors represent the wind pressure generated on the PV modules located at the end and center of the array.
When the wind is incident in the forward direction of the PV module, regardless of the wind speed, the pressure load on the PV module is the largest in the second row and decreases sharply from the third array, then increases gradually after passing through a certain array, and then decreases. In Choi et al.’s study, the drag and lift coefficients gradually decreased as the wind passed along the array [6].
Table 3 shows the difference in wind pressure on the array when the wind is incident from the forward and backward directions. In the case of the forward direction, it is predicted that the largest wind pressure force is generated in the second column as the wind is rapidly turbulent along the forward direction of the PV modules, and the angle of the wind incident on the PV modules is changed by generating vortices at the back of the first column, and the wind pressure force generated in the third column is rapidly reduced as the speed of the wind turbulent along the face of the PV modules Is reduced in the second column.
When the wind is incident from the backward direction, it is evaluated that the wind cannot naturally flow around the PV modules due to the geometry of the PV module installation, and the largest wind pressure is generated because the first row resists most of the wind. In addition, it is predicted that a larger wind pressure force is applied to the PV modules installed in the center than the PV modules installed at the ends due to the interference effect of the wind flowing in the outer peripheral area.
5.2. Evaluation of Wind Load Distribution
As a result of the flow analysis, in order to evaluate the load transmitted to the foundation by the wind load, the pressure shown in Table 3 was summarized as horizontal and vertical components in consideration of the area and installation angle of the PV module and shown in Table 4.
The pressure in Table 3 is summarized into horizontal and vertical partitioning forces considering the area and installation angle of the solar module in Table 4. Forward means the direction of wind incident on the forward direction of the PV module, the “−” sign for the horizontal direction (x-axis) is opposite to the direction of the wind, and the vertical direction (y-axis) is opposite to the direction of gravity. Also, the backward means the direction of wind incident on the back of the PV module, and the “−” sign for the vertical direction is opposite to the direction of gravity. The loads in each direction shown in Table 5 and Table 6 are graphically represented according to the array.
Table 4 shows a significant difference in the loads on the PV modules depending on the direction of wind incidence. It can be seen that the largest loads occur in the first and second rows of the PV module array when the wind enters from the forward direction, and then the load decreases rapidly. In addition, when the wind is incident from the backward direction, the first row is evaluated to have the largest load, and then the load decreases rapidly.
The vertical load distribution was evaluated similarly to the horizontal load distribution, and the wind loads on each column are shown in Table 6. It can be seen that when the wind is blowing from the forward direction, relatively large loads are generated in the first and second rows of the array, and the load decreases rapidly from the third row. When the wind is blowing from the backward direction, the largest load is generated in the first row, and the load decreases rapidly from the second row. In addition, larger loads are generated in the center of the module array than at the end of the module array, and this phenomenon can be attributed to the fluid behavior characteristics caused by interference at the end of the module array, as described earlier.
5.3. Determination of Wind Load Distribution
The load on the PV module obtained from Table 5 and Table 6 can be used as a structural design variable for the PV power plant, and although there are differences depending on the type of structure, the generated load on the PV module is transferred to the foundation, so it can be used for foundation design.
The wind loads to be applied to the PV power plant from the flow analysis results are summarized in Table 7 and Table 8. As shown in Figure 15, the number of columns is expressed based on the direction of the wind, and the first column in the forward direction means the last column in the backward direction, and vice versa; the first column in the reverse direction means the last column in the forward direction. A1-A10 is the array order.
In the forward wind direction, the largest load value from A1 and A2 was applied to the first and second arrays. From the third array, the largest wind load generated from A3 to A10 was applied to the remaining arrays.
In addition, for the backward direction, the largest load occurs in A1, and the load increases rapidly from A2, so the maximum value is applied to A1, as shown in Table 7, and the largest value is applied to the wind load in A2 through A10 after A2.
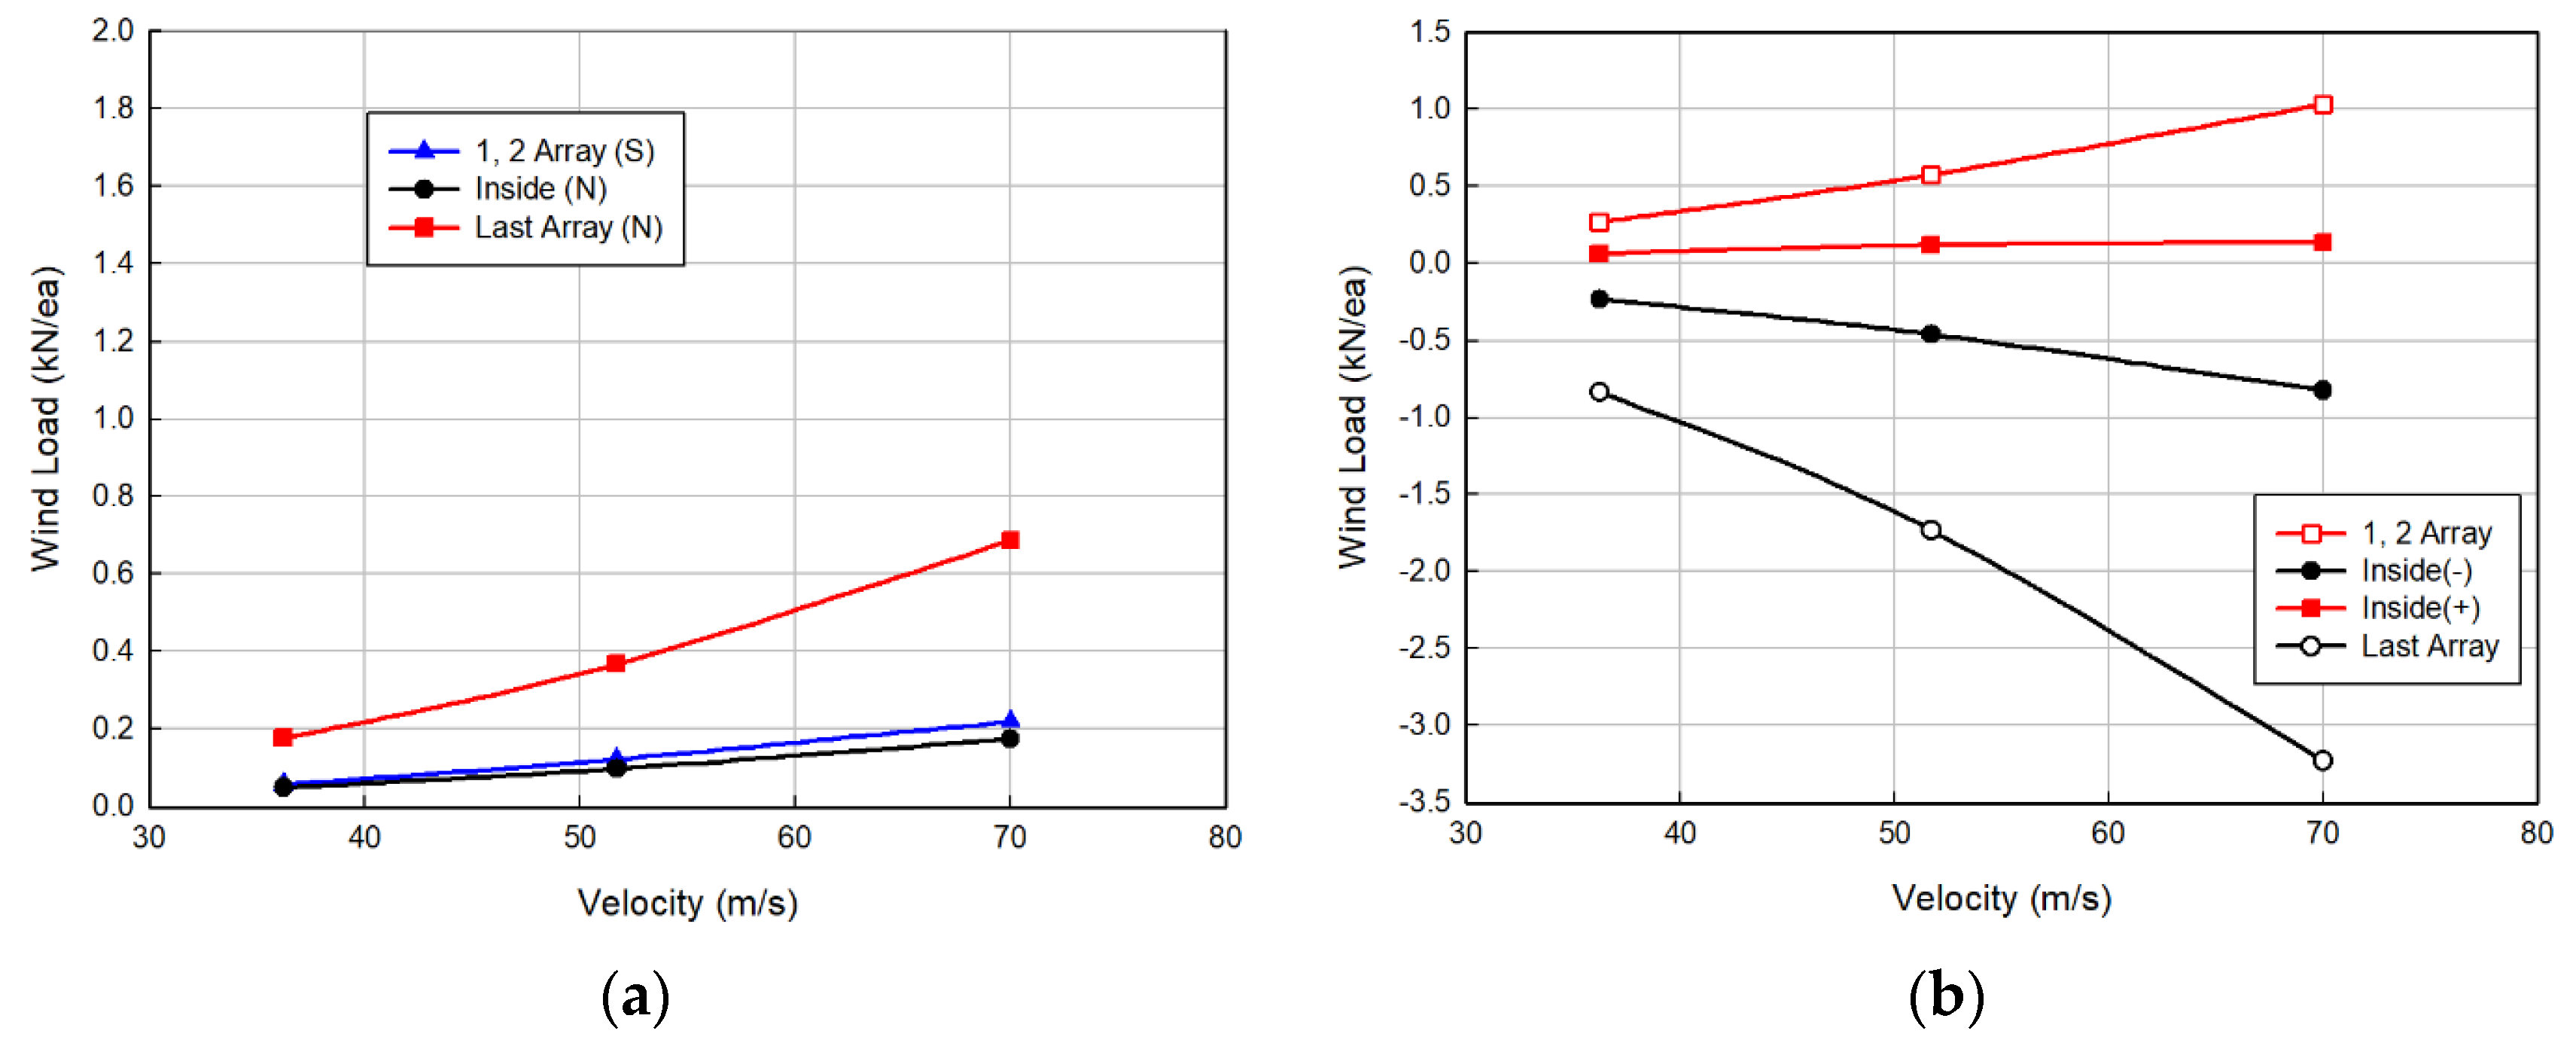
Considering the different fluid behavior of the wind depending on the direction of the wind load and the characteristics of the wind load on each module, the wind load on the PV power plant is shown in Figure 16. Figure 16 confirms the maximum value according to the location of the PV power plant regardless of the size and direction of the wind load for the convenience of design. The wind load is divided into the first, second, last, and inner arrays based on the face view, and as a result of comparing the wind load generated at the center and end of the array, a larger wind load is generated at the center, so the wind load is derived as the load generated at the center for safety design. The numerical analysis results show the maximum value. Figure 16a shows the maximum load on Arrays 1 and 2 in the case of southern wind. The largest value in the last array is the northern wind.
6. Conclusions
The load on the PV module can be utilized as a structural design variable for the PV power plant, and although there are differences depending on the type of structure, the load distribution caused by the wind load in the floating PV system was assessed using possible parametric studies with design parameters including wind speed, wind direction, and installation angle of PV modules. The following conclusion was driven.
Owing to wind load and flow velocity affecting the PV power plants, the load should be checked for the entire PV power plant. Wind load is evaluated as relatively low because only the projected area in the horizontal direction is considered in the design standard. Therefore, the wind load applied to all arrays of the PV power plant was evaluated through the CFD analysis. The maximum velocity for the outlet of the PV plant was confirmed through the cross-sectional velocity distribution of the flow area. In addition, the average pressure distribution for each array at the middle and end of the PV module due to wind was confirmed. To evaluate the effect of wind load, the pressure was checked based on the floating PV module.
As a result of the CFD analysis, the largest wind load is applied to the first and second arrays for the wind in the forward direction of the solar module, the largest load is generated in the first array for the backward direction, and the load is rapidly generated from the second array. After comparing the wind loads at the center and the ends of the array, the wind load is larger at the center, so the wind load is derived as the load at the center for safety.
The wind pressure generated in the PV module was greater than the wind speed generated from the rear when the wind speed was generated from the front. In addition, the wind pressure generated a large pressure only in the first PV panel and decreased toward the backward direction because the flow was stable.
Therefore, it is judged that the floating PV power plant is structurally more vulnerable to the wind acting from the backward direction.
In the future, we plan to install a solar power generation structure at an actual site and confirm the behavior of the PV module against wind pressure through field tests.
Author Contributions
Conceptualization, H.-J.J. and S.-J.H.; methodology, H.-J.J.; software, S.-H.K. and S.-J.H.; formal analysis, W.C. and H.-J.J.; data curation, S.-H.K.; writing—original draft preparation, W.C. and S.-H.K.; writing—review and editing, W.C. All authors have read and agreed to the published version of the manuscript.
Funding
This research received no external funding.
Institutional Review Board Statement
Not applicable.
Informed Consent Statement
Not applicable.
Data Availability Statement
Data are contained within the article.
Conflicts of Interest
Author Hyung-Joong Joo and Seong-Jun Heo are employed by the company Trina Solar Co., Ltd. and SK E&S, respectively. The remaining authors declare that the research was conducted in the absence of any commercial or financial relationships that could be construed as a potential conflict of interest.
References
- Yousuf, H.; Khokhar, M.Q.; Zahid, M.A.; Kim, J.; Kim, Y.; Cho, E.C.; Cho, Y.H.; Yi, J. A review on floating photovoltaic technology (FPVT). Curr. Photovolt. Res. 2020, 8, 67–78. [Google Scholar]
- Kim, S.H.; Yoon, S.J.; Choi, W.; Choi, K.B. Application of floating photovoltaic energy generation systems in South Korea. Sustainability 2016, 8, 1333. [Google Scholar] [CrossRef]
- Rosa-Clot, M.; Tina, G.M. Submerged and Floating Photovoltaic Systems: Modelling, Design and Case Studies; Academic Press: London, UK, 2017. [Google Scholar]
- Ryu, D.G.; Lee, K.B. Flow characteristics and wind loads on the solar panel and floating system of floating solar generato. J. Korea Acad.-Ind. Coop. Soc. 2019, 20, 229–235. [Google Scholar]
- Lee, C.R.; Lee, G.H.; Shim, J.Y.; Choi, D.H.; Lee, J.H. Structural safety evaluation through full modules analysis of 2 MW class floating photovoltaic power plant. J. Korean Sol. Energy Soc. 2021, 41, 109–118. [Google Scholar] [CrossRef]
- Choi, S.M.; Park, C.D.; Cho, S.H.; Lim, B.J. Effects of wind loads on the solar panel array of a floating photovoltaic system—Experimental study and economic analysis. Energy 2022, 256, 124649. [Google Scholar] [CrossRef]
- Su, K.C.; Chung, P.H.; Yang, R.Y. Numerical simulation of wind loads on an offshore PV panel: The effect of wave angle. J. Mech. 2021, 37, 53–62. [Google Scholar] [CrossRef]
- American Society of Civil Engineers. Minimum Design Loads and Associated Criteria for Buildings and Other Structures; American Society of Civil Engineers: Reston, VA, USA, 2017. [Google Scholar]
- KDS 41 10 15; Load Combination. Korean Design Standard. 2019. Available online: https://www.law.go.kr/%ED%96%89%EC%A0%95%EA%B7%9C%EC%B9%99/%EA%B1%B4%EC%B6%95%EA%B5%AC%EC%A1%B0%EA%B8%B0%EC%A4%80 (accessed on 11 October 2022).
- Schellenberg, A.; Maffei, J.; Telleen, K.; Ward, R. Structural analysis and application of wind loads to solar arrays. J. Wind Eng. Ind. Aerodyn. 2013, 123, 261–272. [Google Scholar] [CrossRef]
- Kim, S.H.; Baek, S.C.; Choi, K.B.; Park, S.J. Design and installation of 500-kW floating photovoltaic structures using high-durability steel. Energies 2020, 13, 4996. [Google Scholar] [CrossRef]
- Warsido, W.P.; Bitsuamlak, G.T.; Barata, J.; Chowdhury, A.G. Influence of spacing parameters on the wind loading of solar array. J. Fluids Struct. 2014, 48, 295–315. [Google Scholar] [CrossRef]
- Wood, G.S.; Denoon, R.O.; Kwok, K.C. Wind loads on industrial solar panel arrays and supporting roof structure. Wind Struct. 2001, 4, 481–494. [Google Scholar] [CrossRef]
- Shademan, M.; Hangan, H. Wind loading on solar panels at different inclination angles. In Proceedings of the 11th Americas Conference on Wind Engineering, San Juan, PR, USA, 22–26 June 2009. [Google Scholar]
- Wu, Z.; Gong, B.; Wang, Z.; Li, Z.; Zang, C. An experimental and numerical study of the gap effect on wind load on heliostat. Renew. Energy 2010, 35, 797–806. [Google Scholar] [CrossRef]
- Choi, S.M.; Park, C.D.; Cho, S.H.; Lim, B.J. Effects of various inlet angle of wind and wave loads on floating photovoltaic system considering stress distributions. J. Clean. Prod. 2023, 387, 135876. [Google Scholar] [CrossRef]
- Kopp, G.A.; Surry, D.; Chen, K. Wind loads on a solar array. Wind Struct. 2002, 5, 393–406. [Google Scholar] [CrossRef]
- Aly, A.M. On the evaluation of wind loads on solar panels: The scale issue. Sol. Energy 2016, 135, 423–434. [Google Scholar] [CrossRef]
- Joo, H.J.; Lee, N.H.; Lee, S.W. Floating photovoltaic power generation system. Korean Soc. Adv. Compos. Struct. 2013, 4, 31–39. [Google Scholar]
- Trapani, K.; Milar, D.L. Proposing offshore photovoltaic (PV) technology to the energy mix of the Maltese islands. Energy Convers. Manag. 2013, 67, 18–26. [Google Scholar] [CrossRef]
- Dassault Systemes (DS) Sinulia Corp. ABAQUS; Dassault Systemes (DS) Sinulia Corp.: Johnston, RI, USA, 2013. [Google Scholar]
Figure 1.
Configuration of floating photovoltaic system.
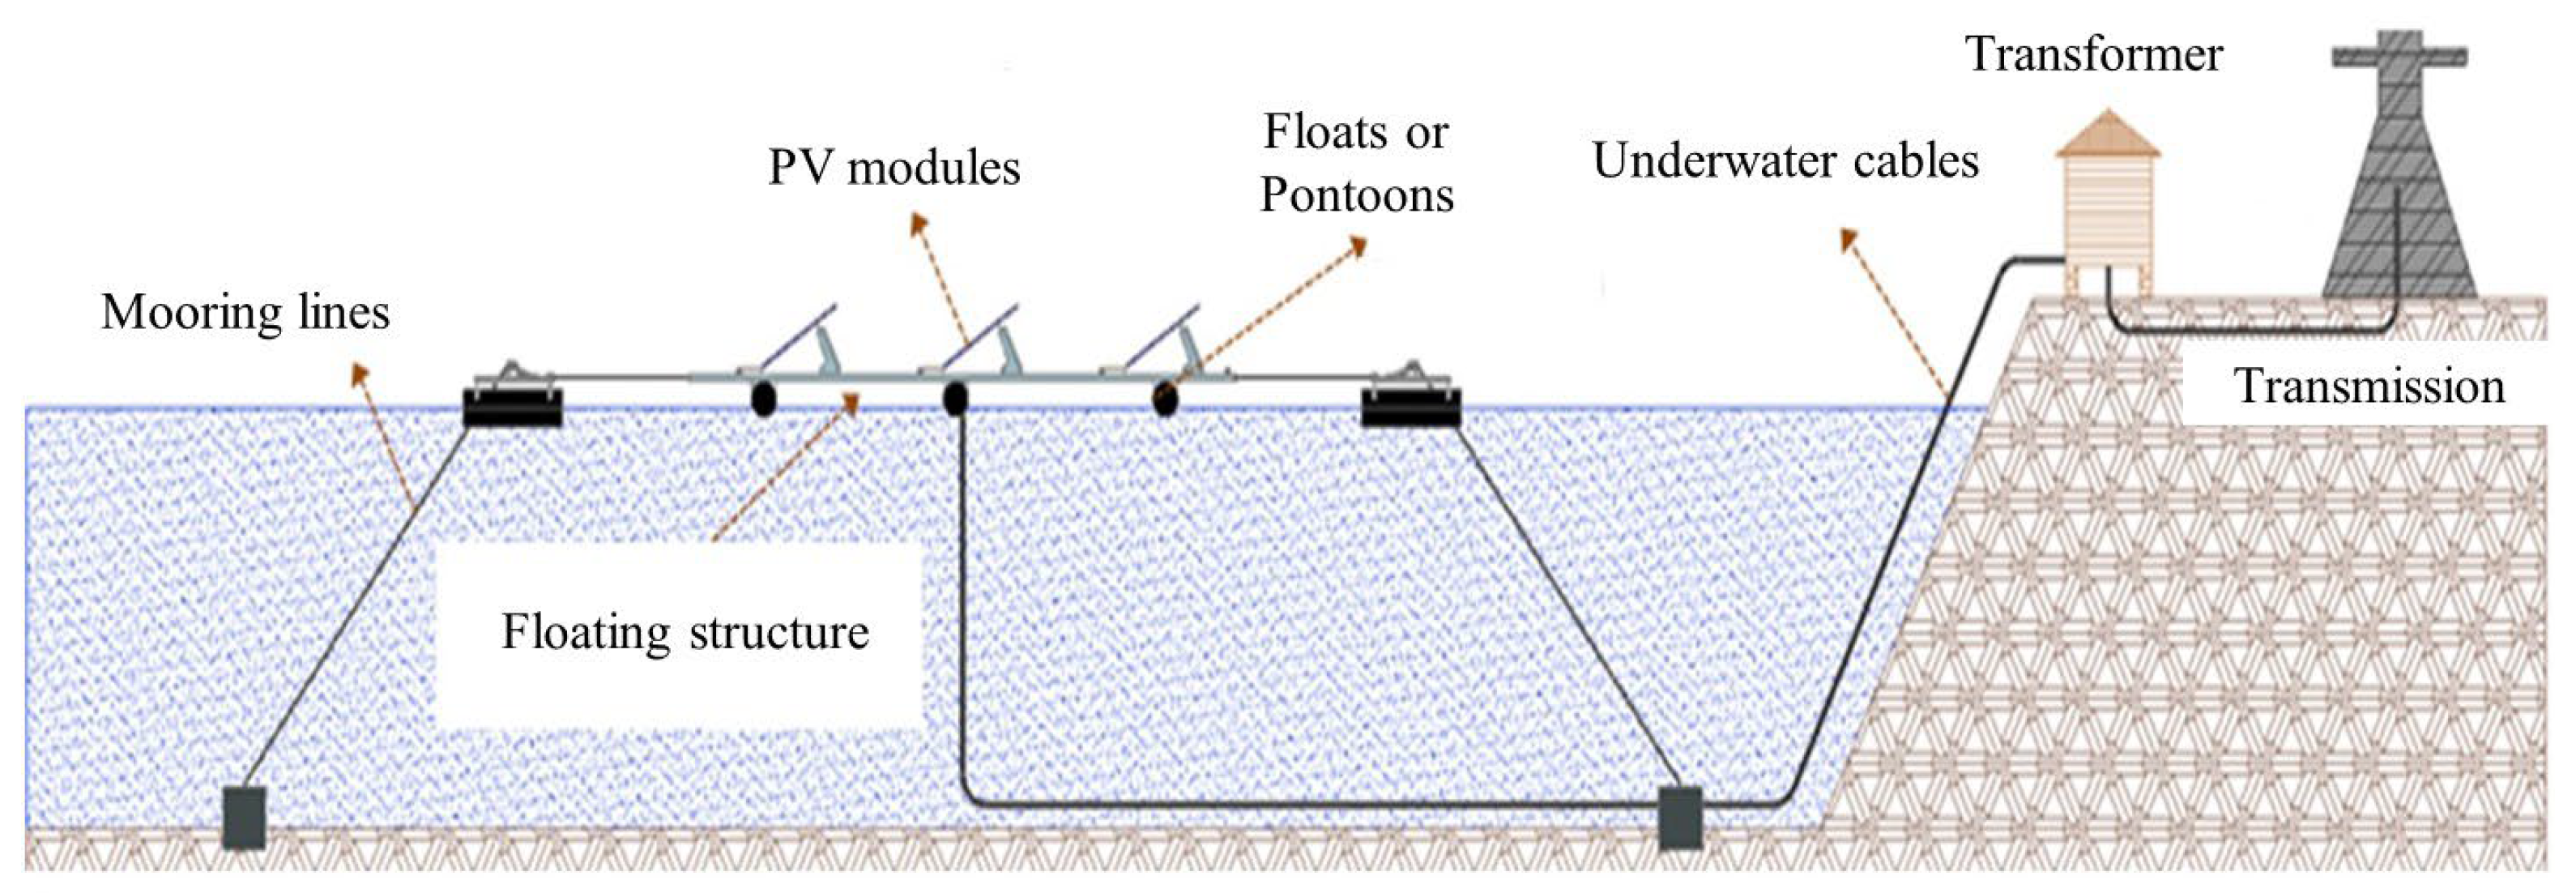
Figure 2.
Load transfer mechanism for floating PV farms.
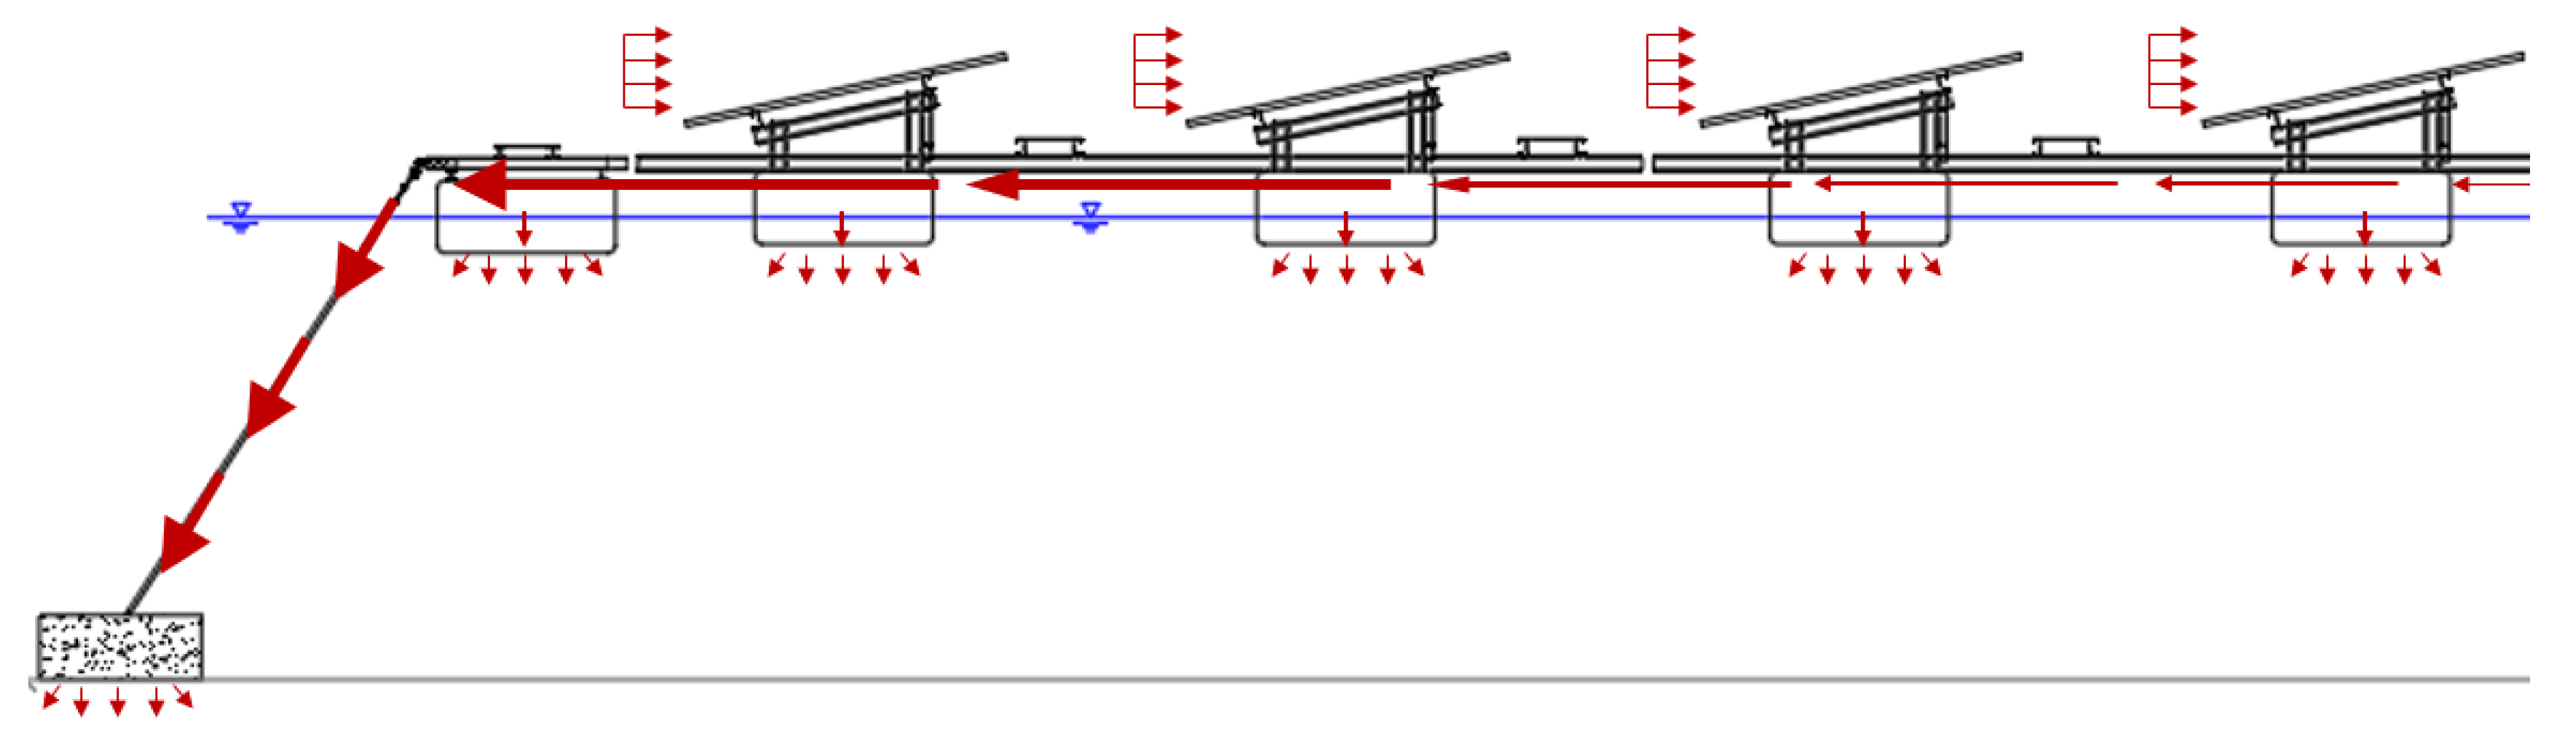
Figure 3.
Load transfer mechanism for floating PV plants.
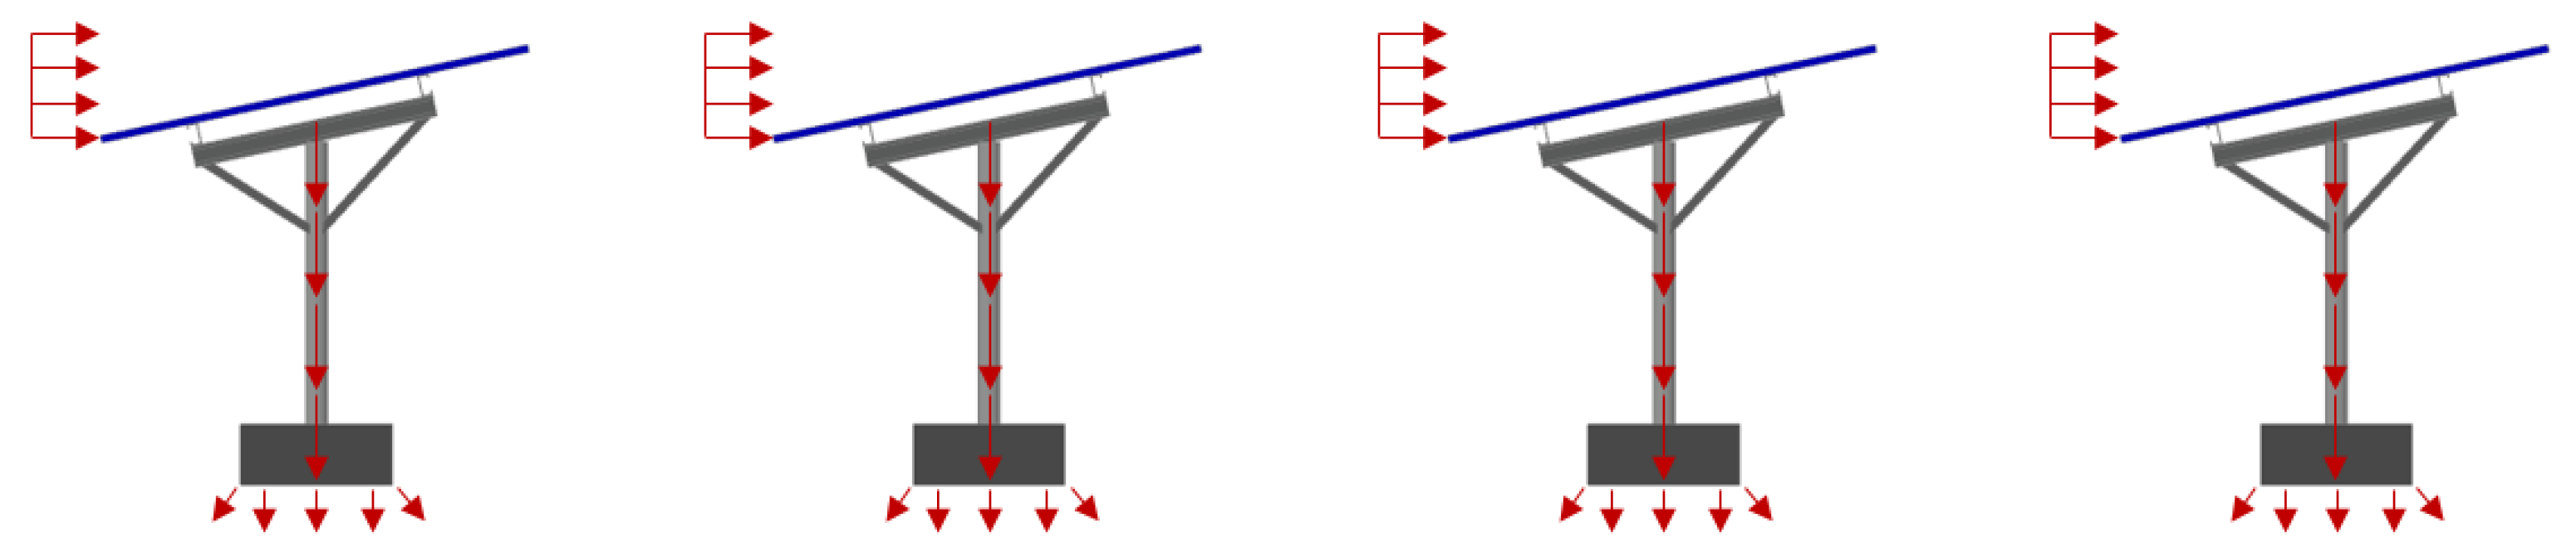
Figure 4.
Power generation and losses depending on the tilt angle of PV module.
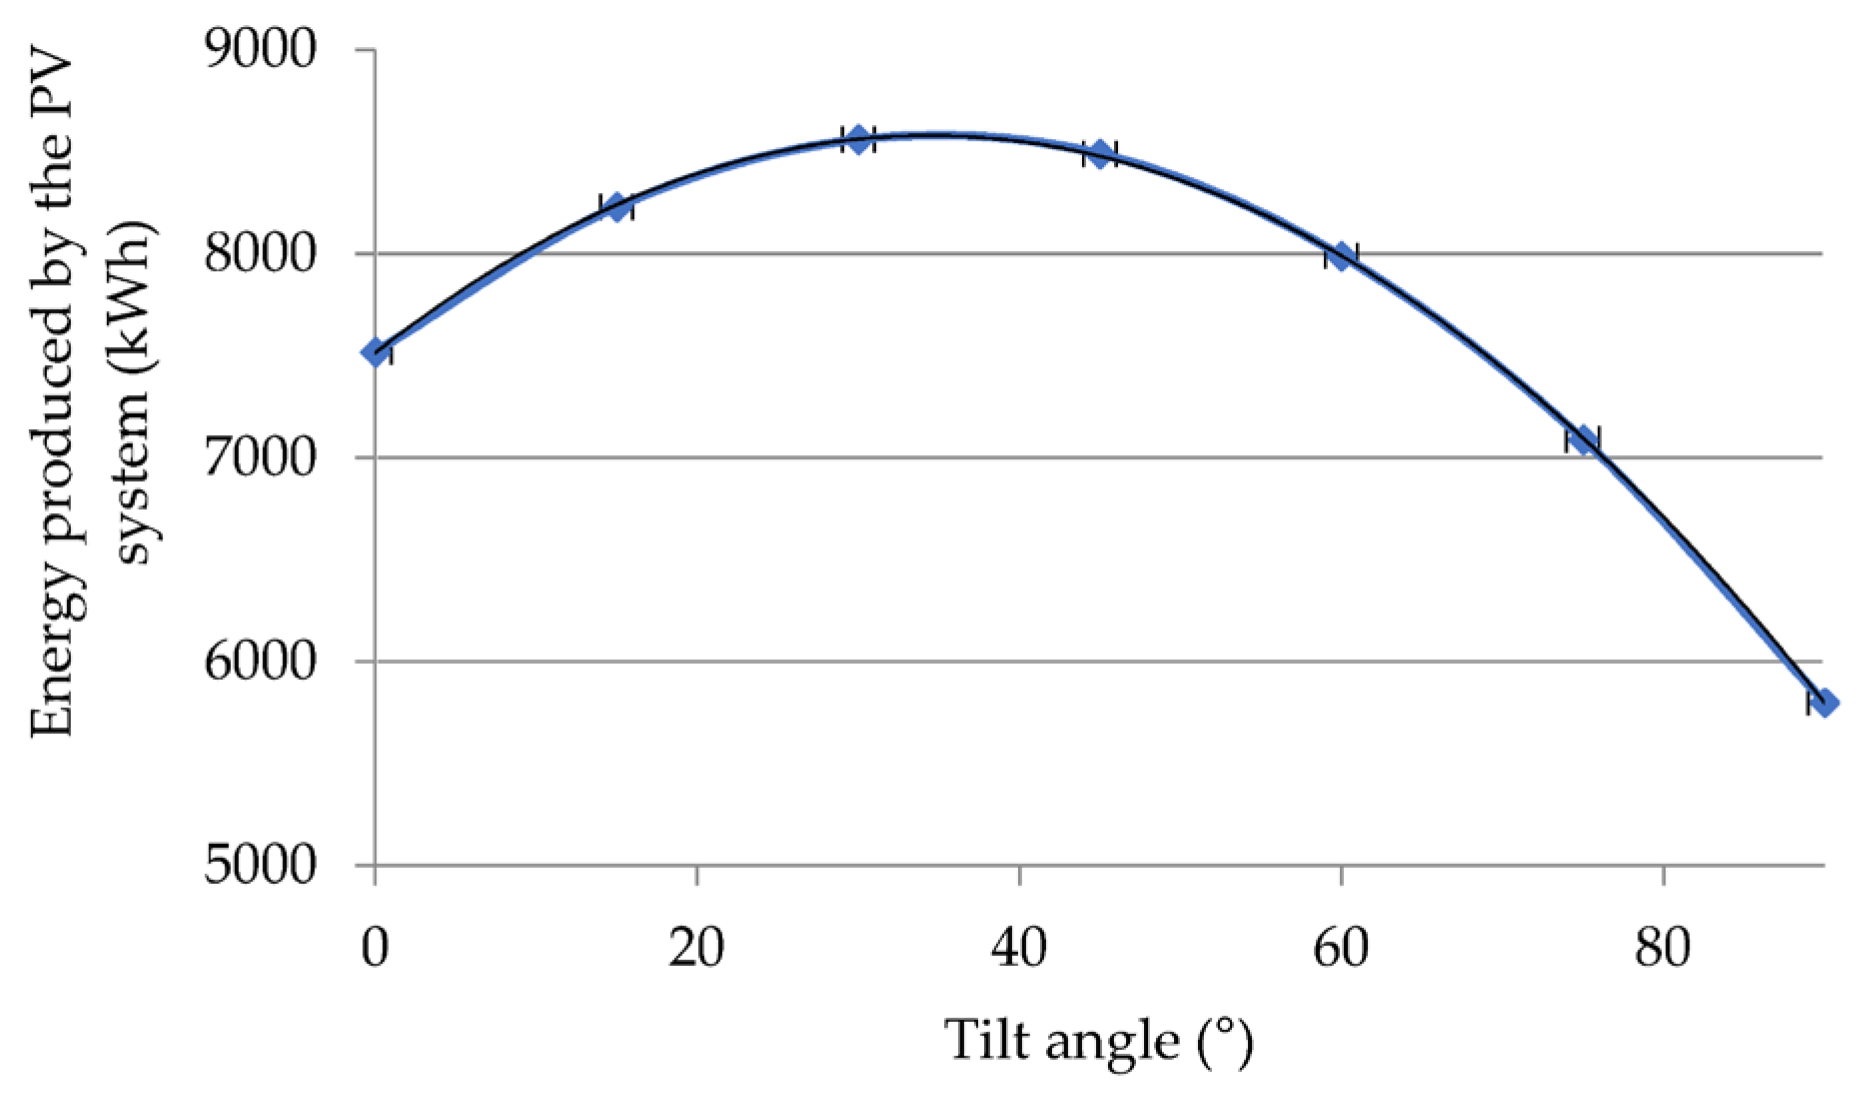
Figure 5.
Designation of applied wind load direction.

Figure 6.
Exemplary PV power plant.
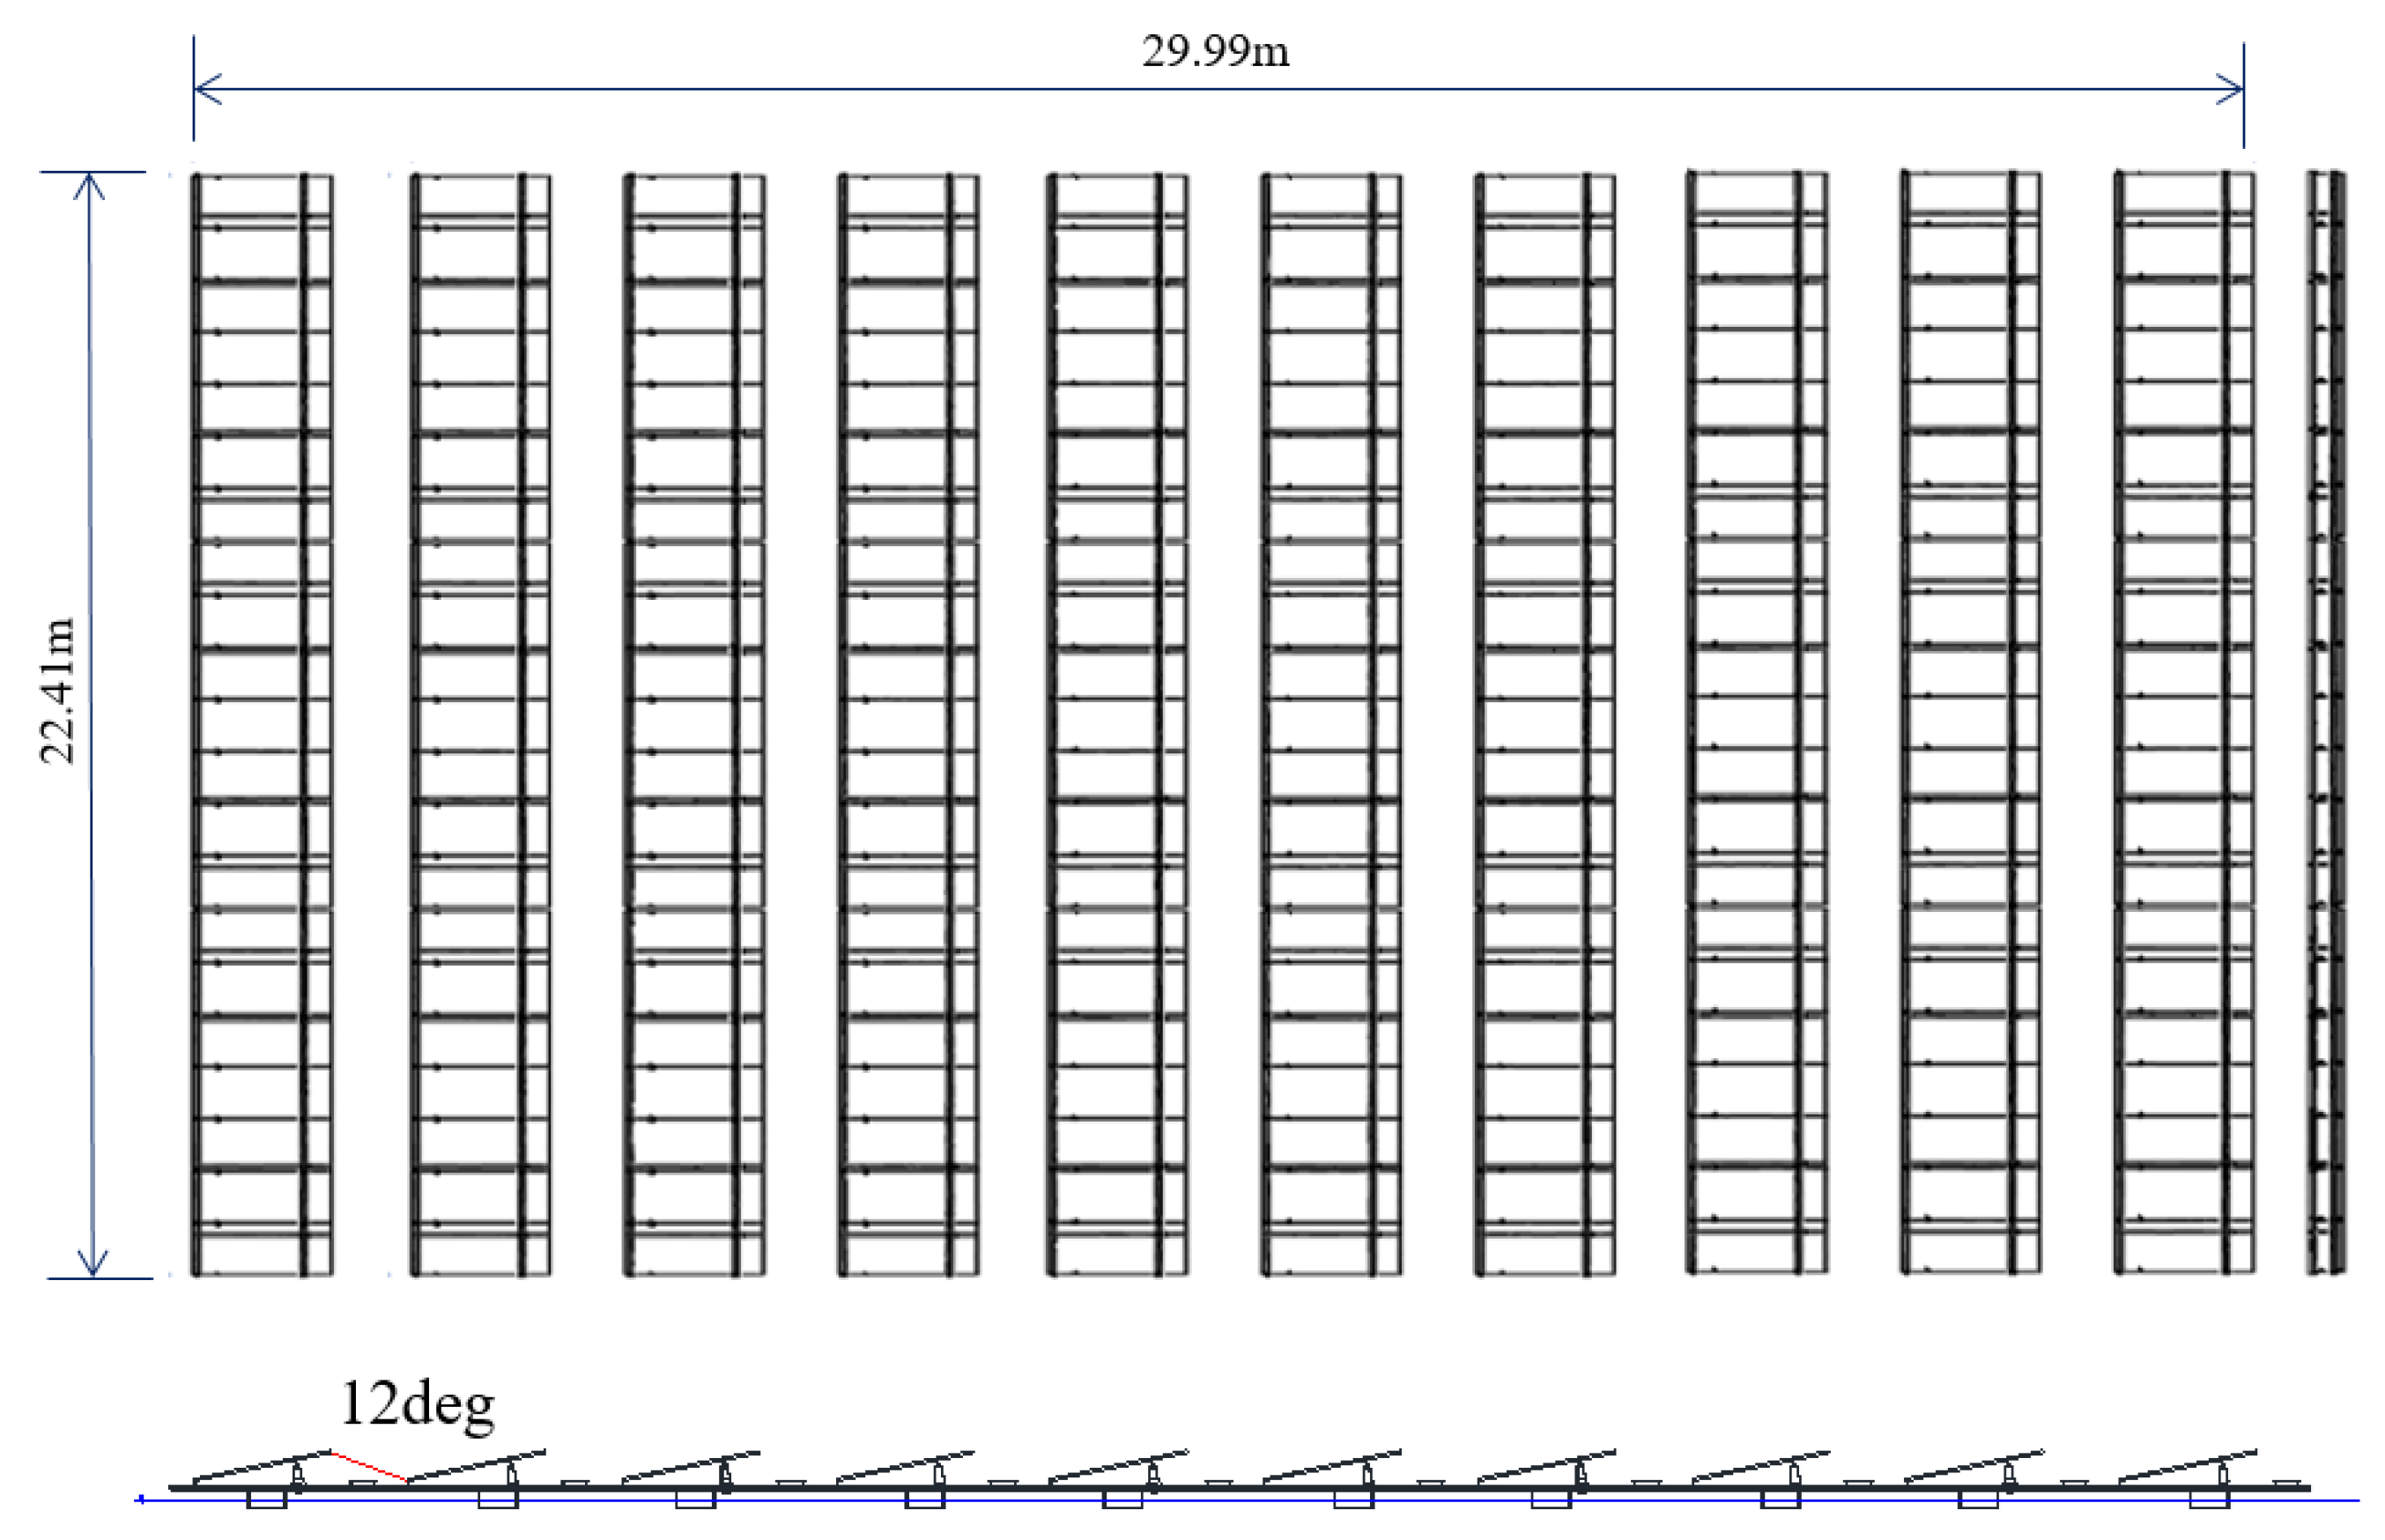
Figure 7.
Spacing PV module arrays.
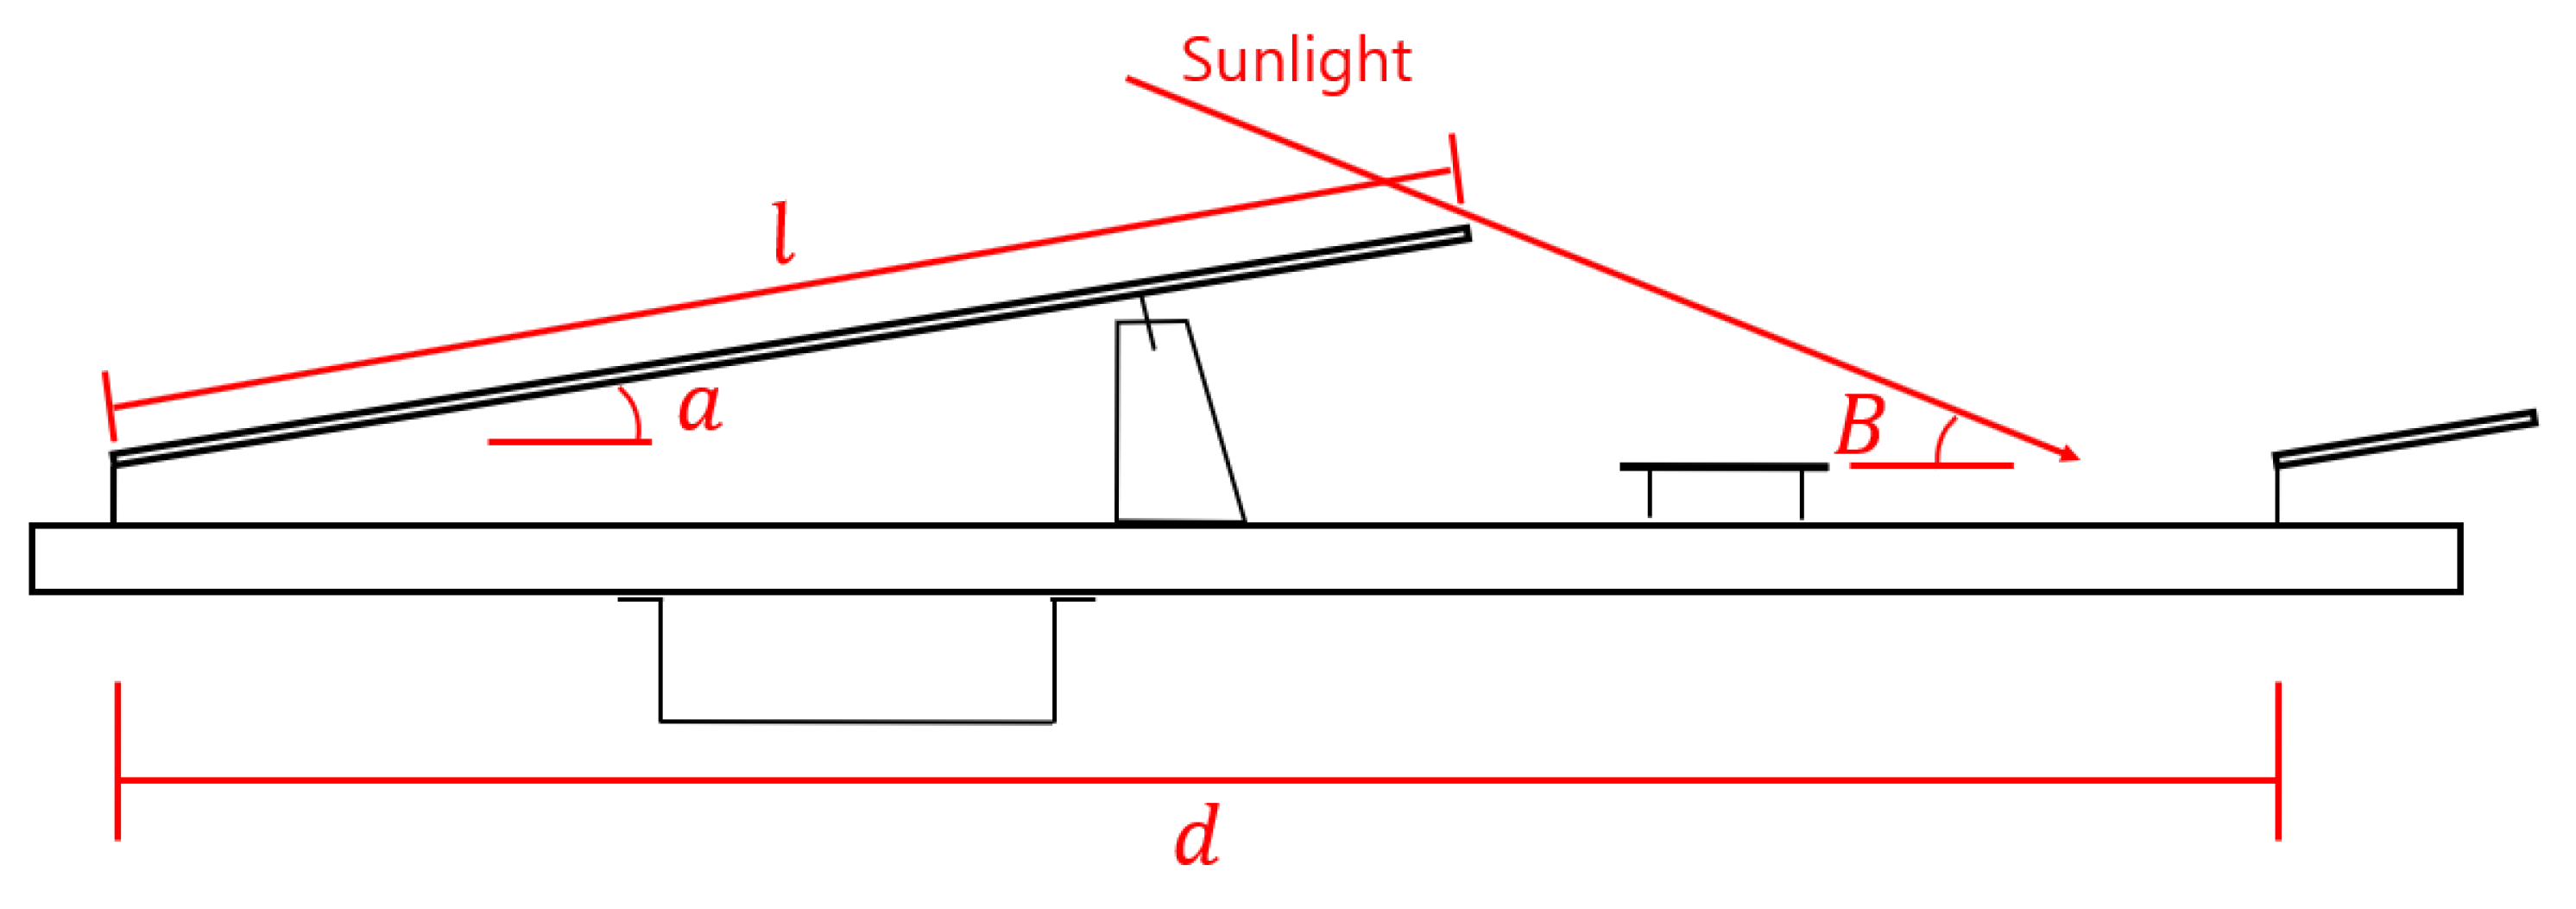
Figure 8.
Fluid analysis model. (a) Layout of floating PV power plant; (b) fluid boundary.

Figure 9.
Boundary condition for fluid analysis. (a) Forward direction wind load (β = 0°); (b) backward direction wind load (β = 180°).
Figure 9.
Boundary condition for fluid analysis. (a) Forward direction wind load (β = 0°); (b) backward direction wind load (β = 180°).
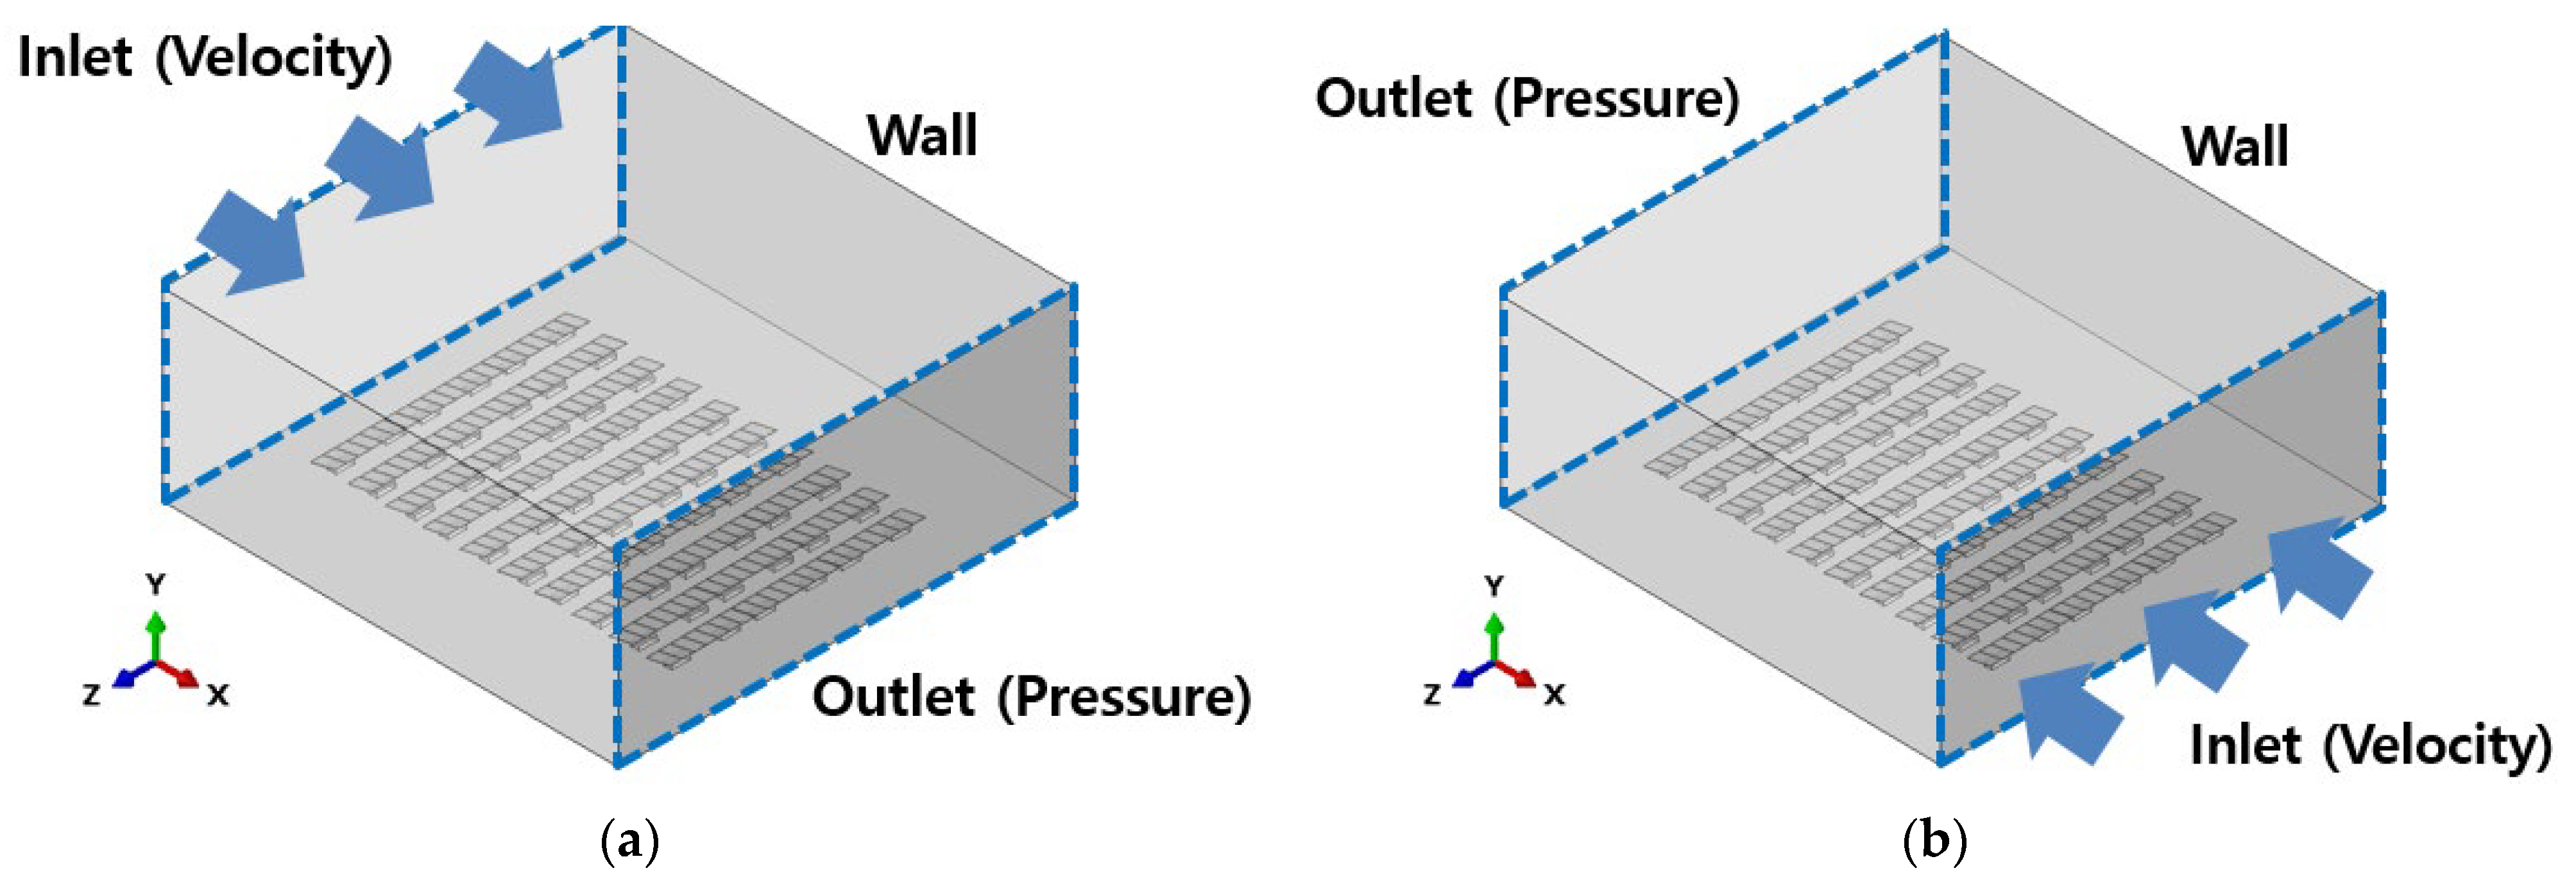
Figure 10.
Location for data collection of wind pressure.

Figure 11.
Distribution of wind speed for forward direction (β = 0°). (a) Wind speed of 36.2 m/s; (b) wind speed of 51.7 m/s; and (c) wind speed of 70.0 m/s.
Figure 11.
Distribution of wind speed for forward direction (β = 0°). (a) Wind speed of 36.2 m/s; (b) wind speed of 51.7 m/s; and (c) wind speed of 70.0 m/s.
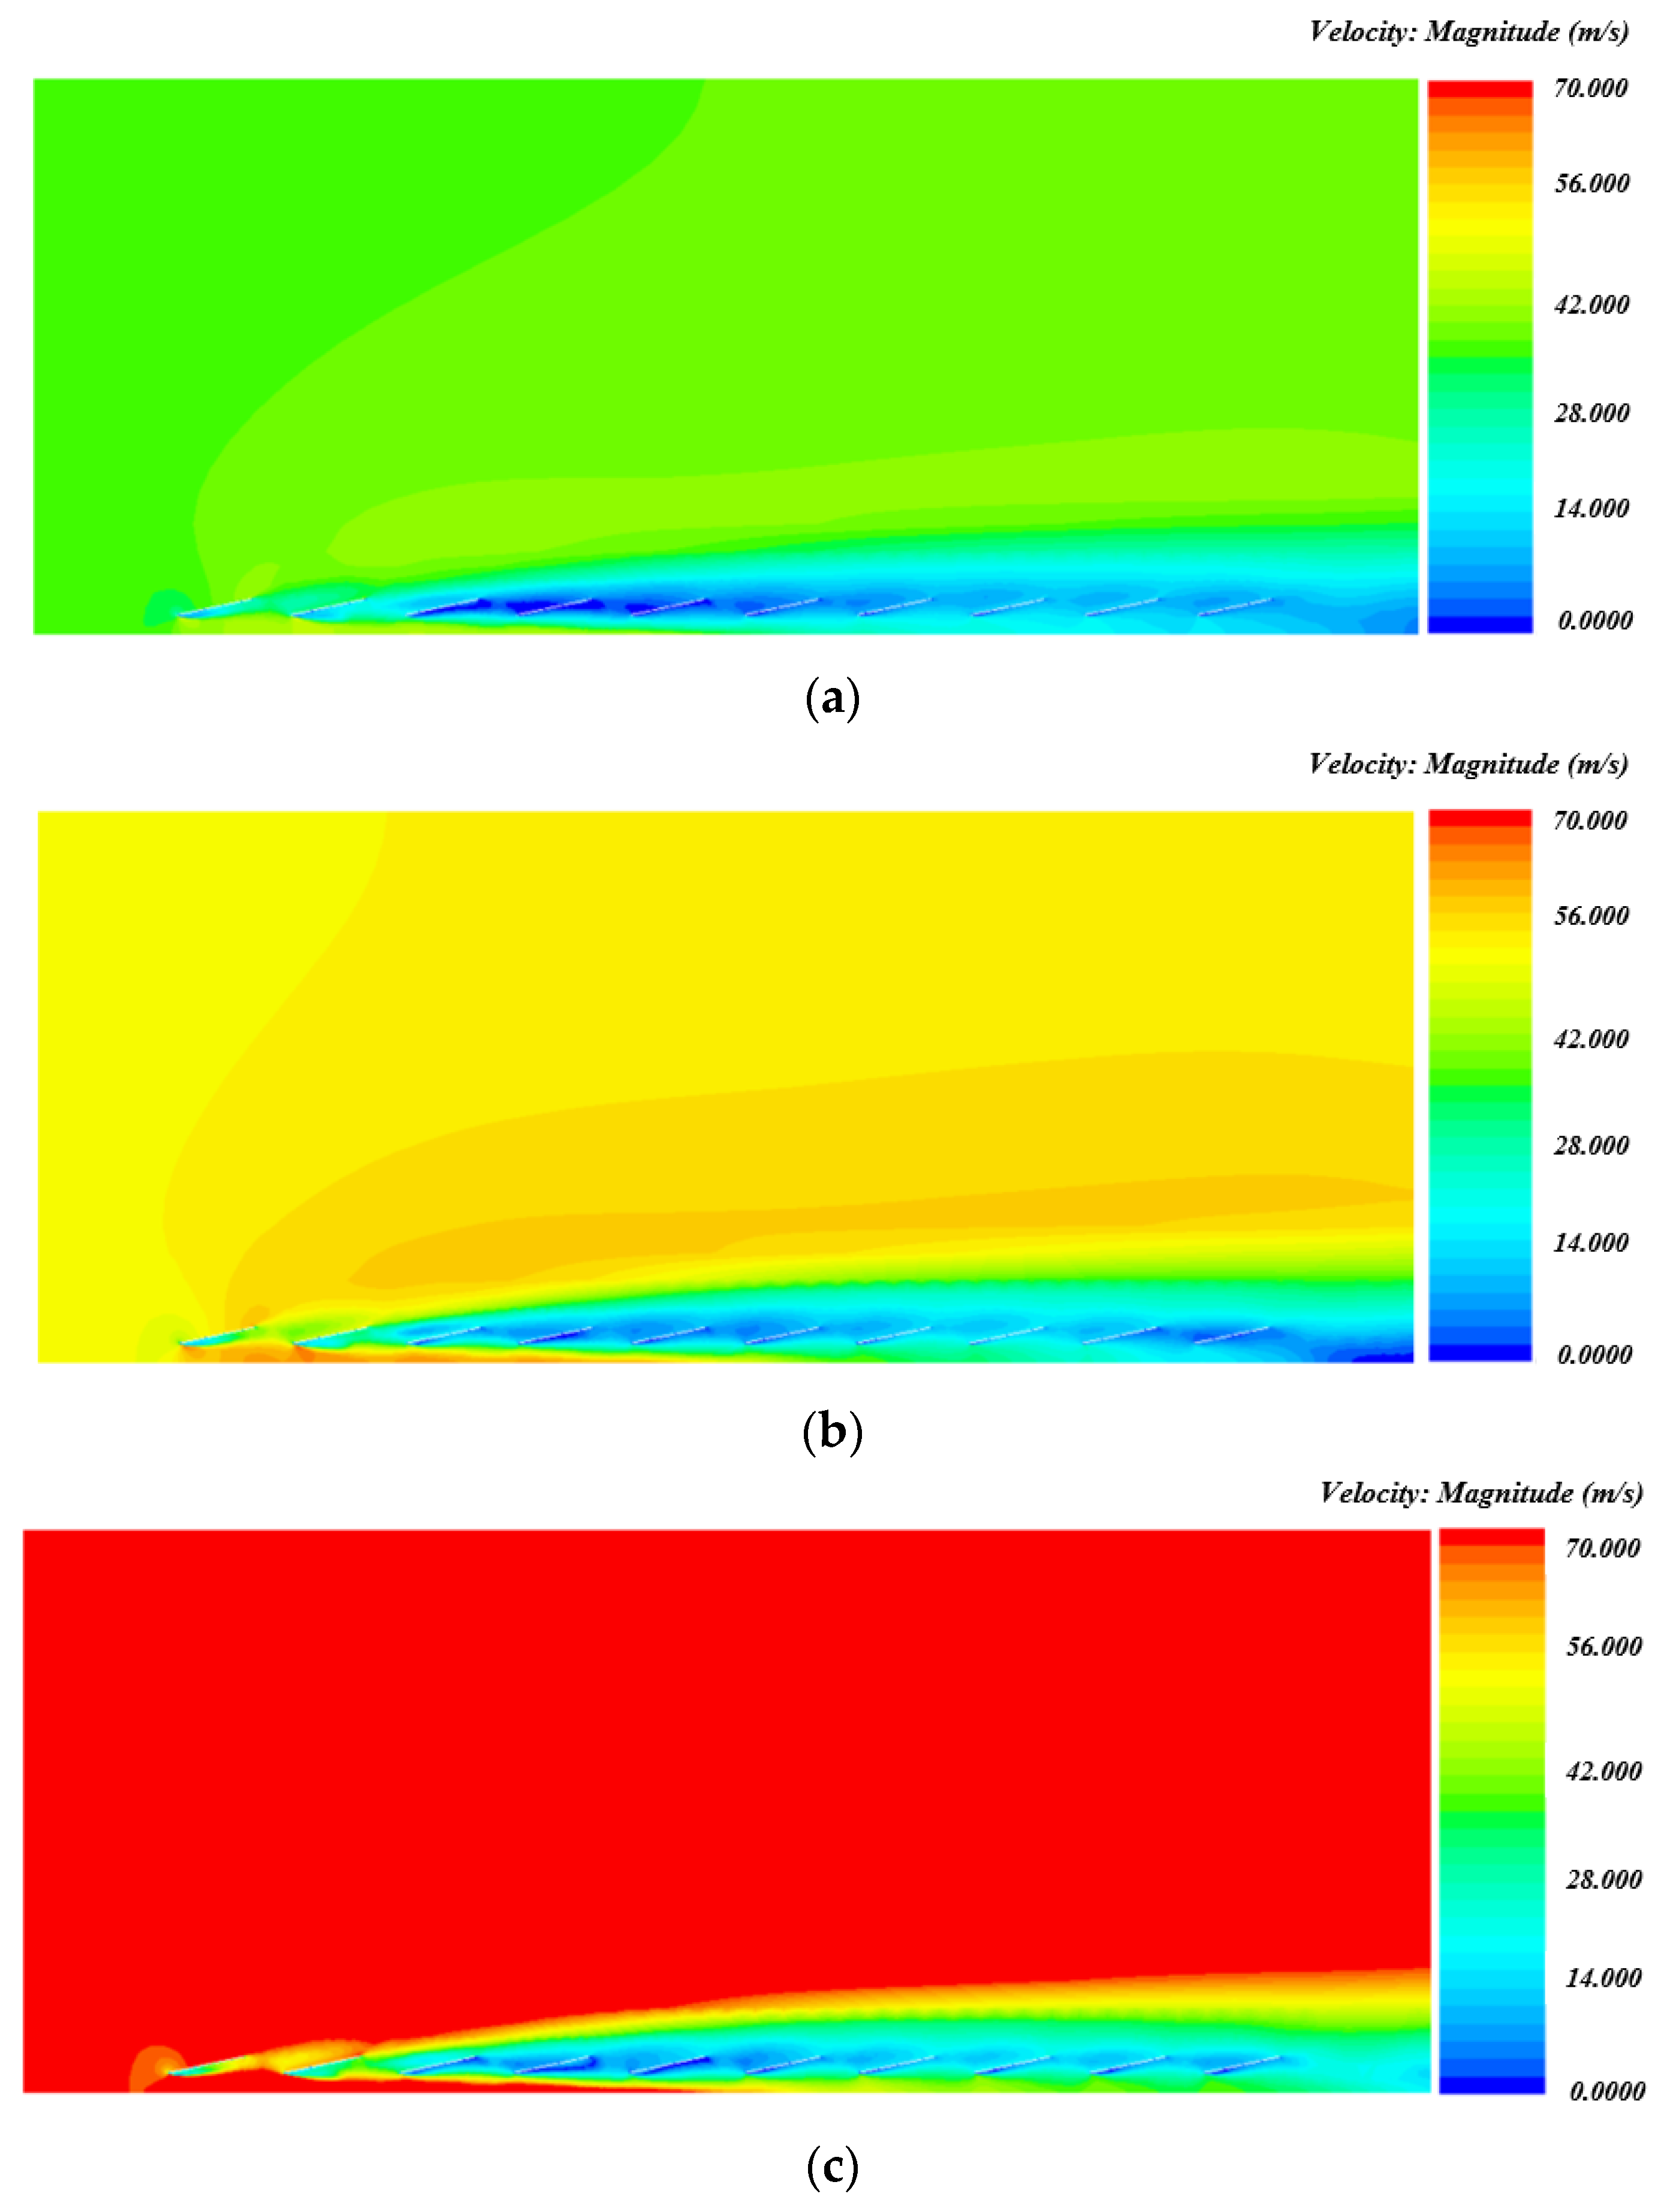
Figure 12.
Distribution of wind speed for backward direction (β = 180°). (a) Wind speed of 36.2 m/s; (b) wind speed of 51.7 m/s; and (c) wind speed of 70.0 m/s.
Figure 12.
Distribution of wind speed for backward direction (β = 180°). (a) Wind speed of 36.2 m/s; (b) wind speed of 51.7 m/s; and (c) wind speed of 70.0 m/s.
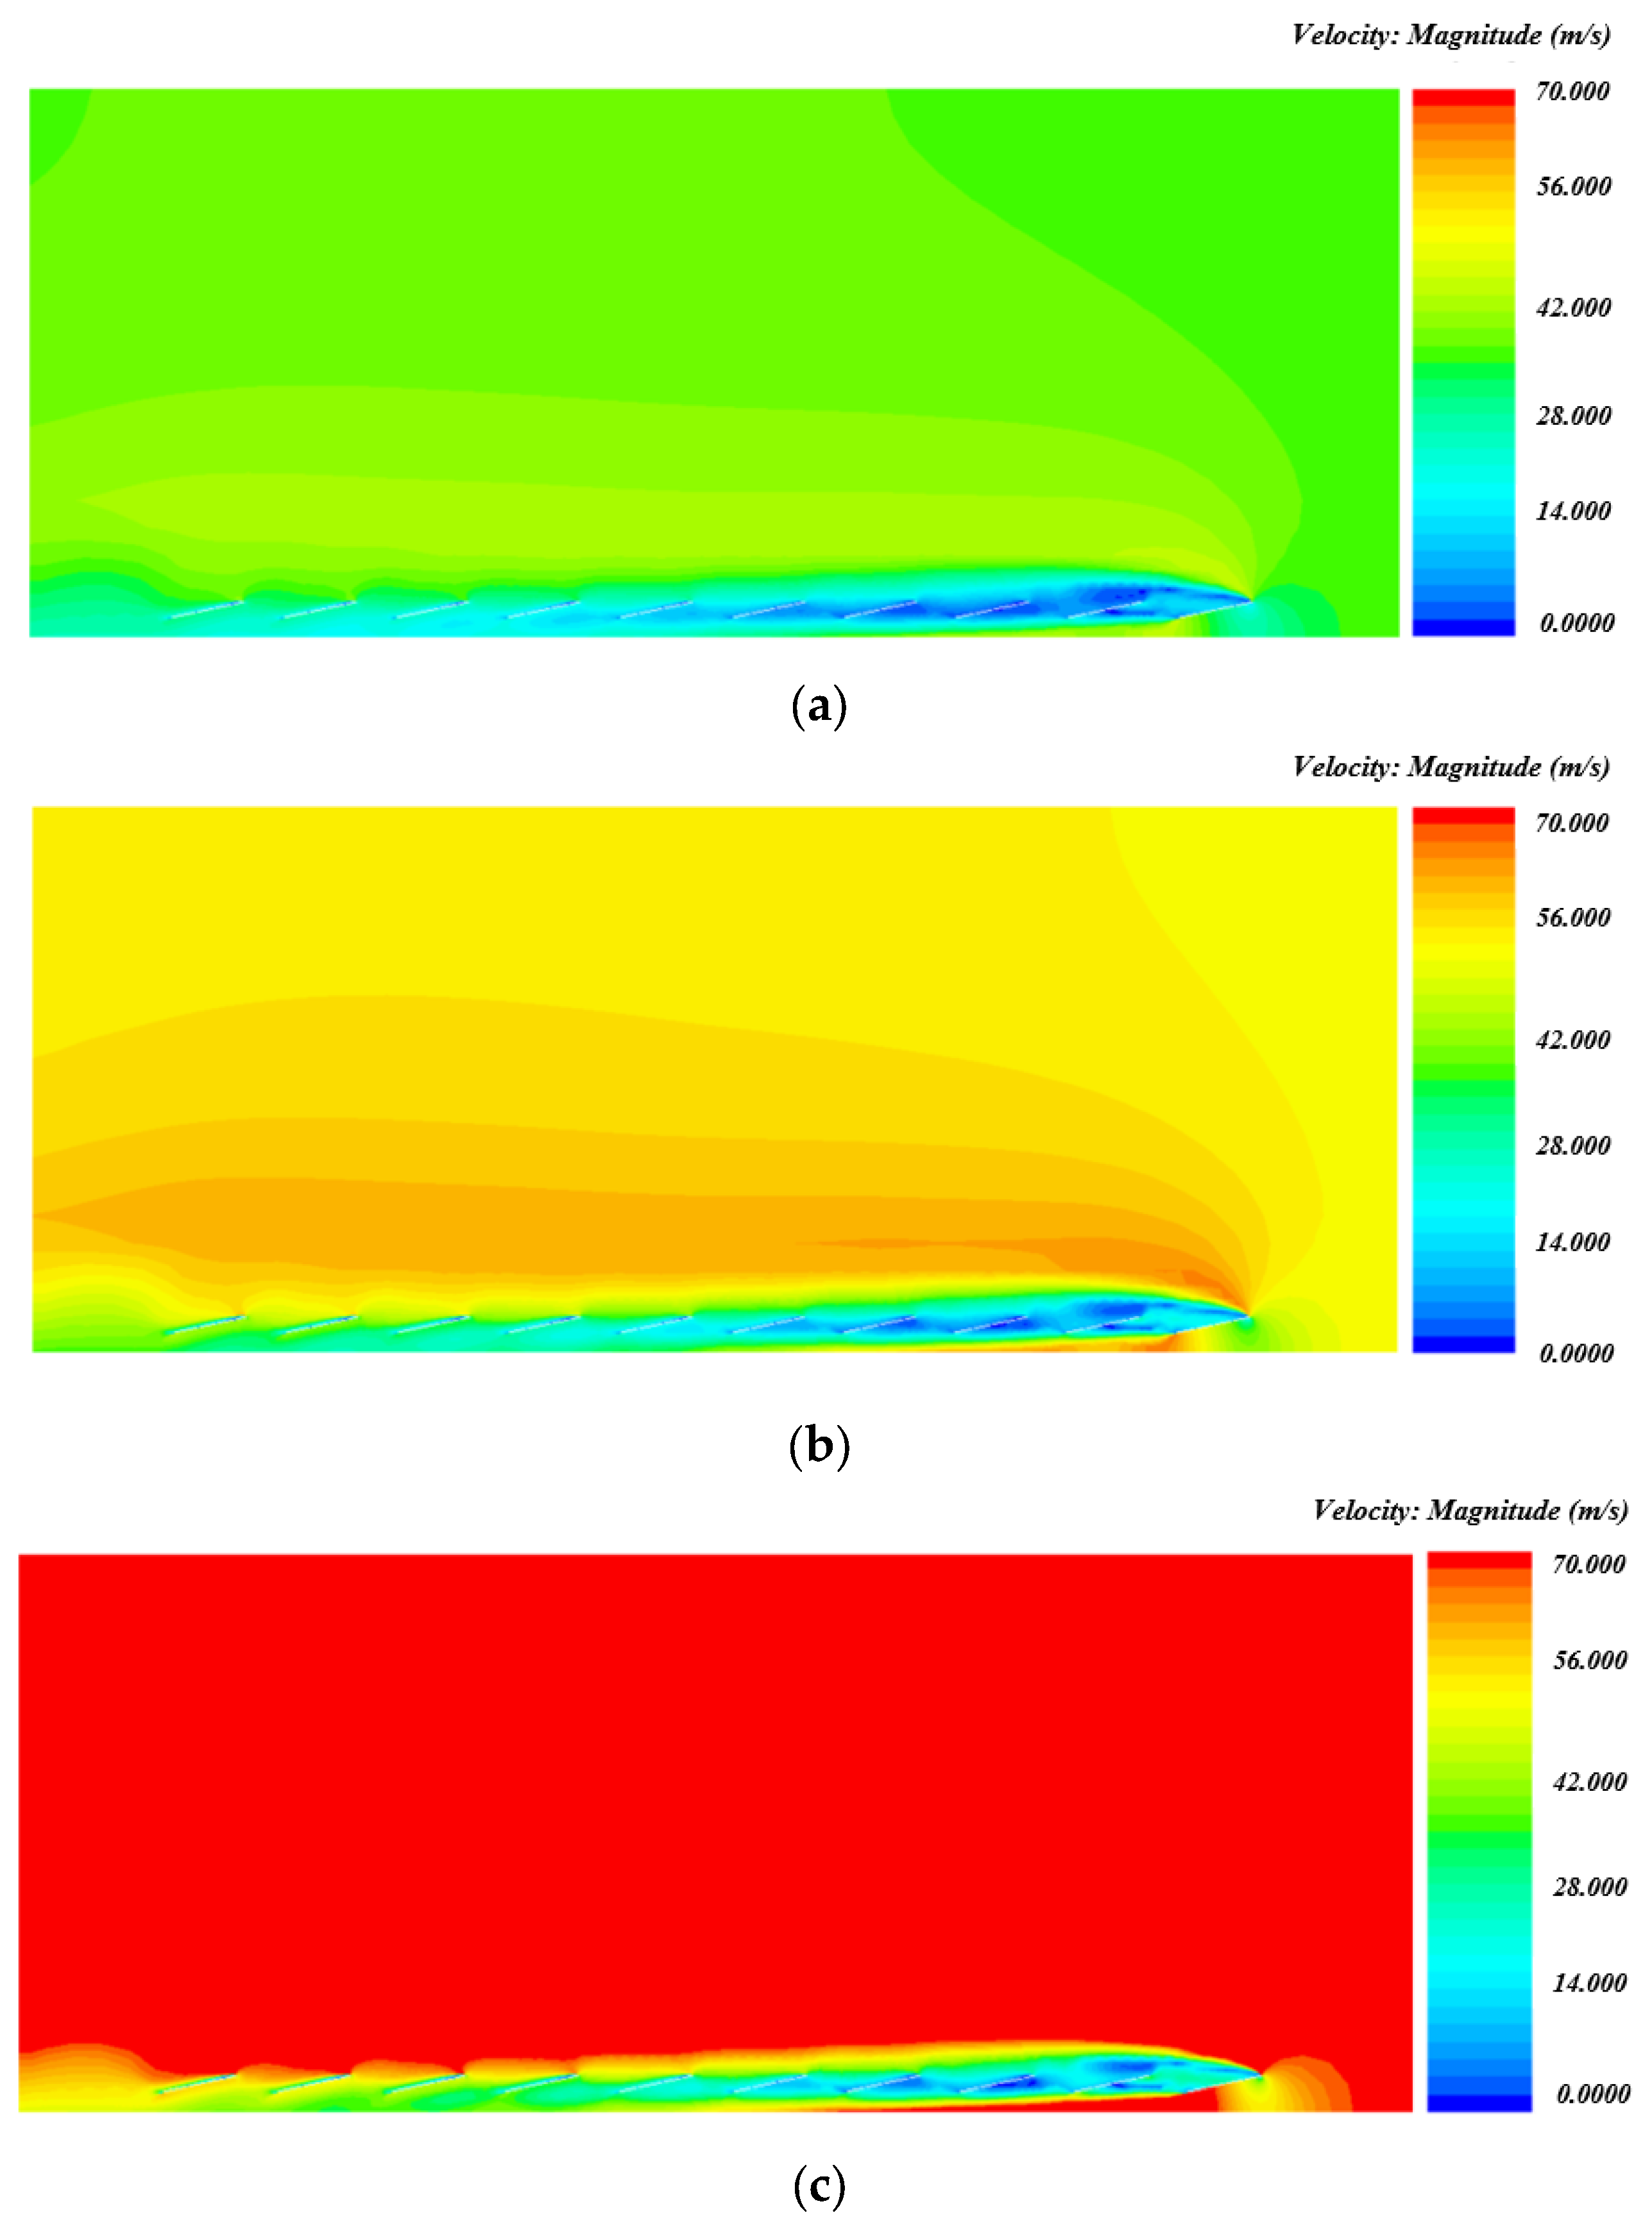
Figure 13.
Velocity vector for forward direction (β = 0°). (a) Wind speed of 36.2 m/s; (b) wind speed of 51.7 m/s; and (c) wind speed of 70.0 m/s.
Figure 13.
Velocity vector for forward direction (β = 0°). (a) Wind speed of 36.2 m/s; (b) wind speed of 51.7 m/s; and (c) wind speed of 70.0 m/s.
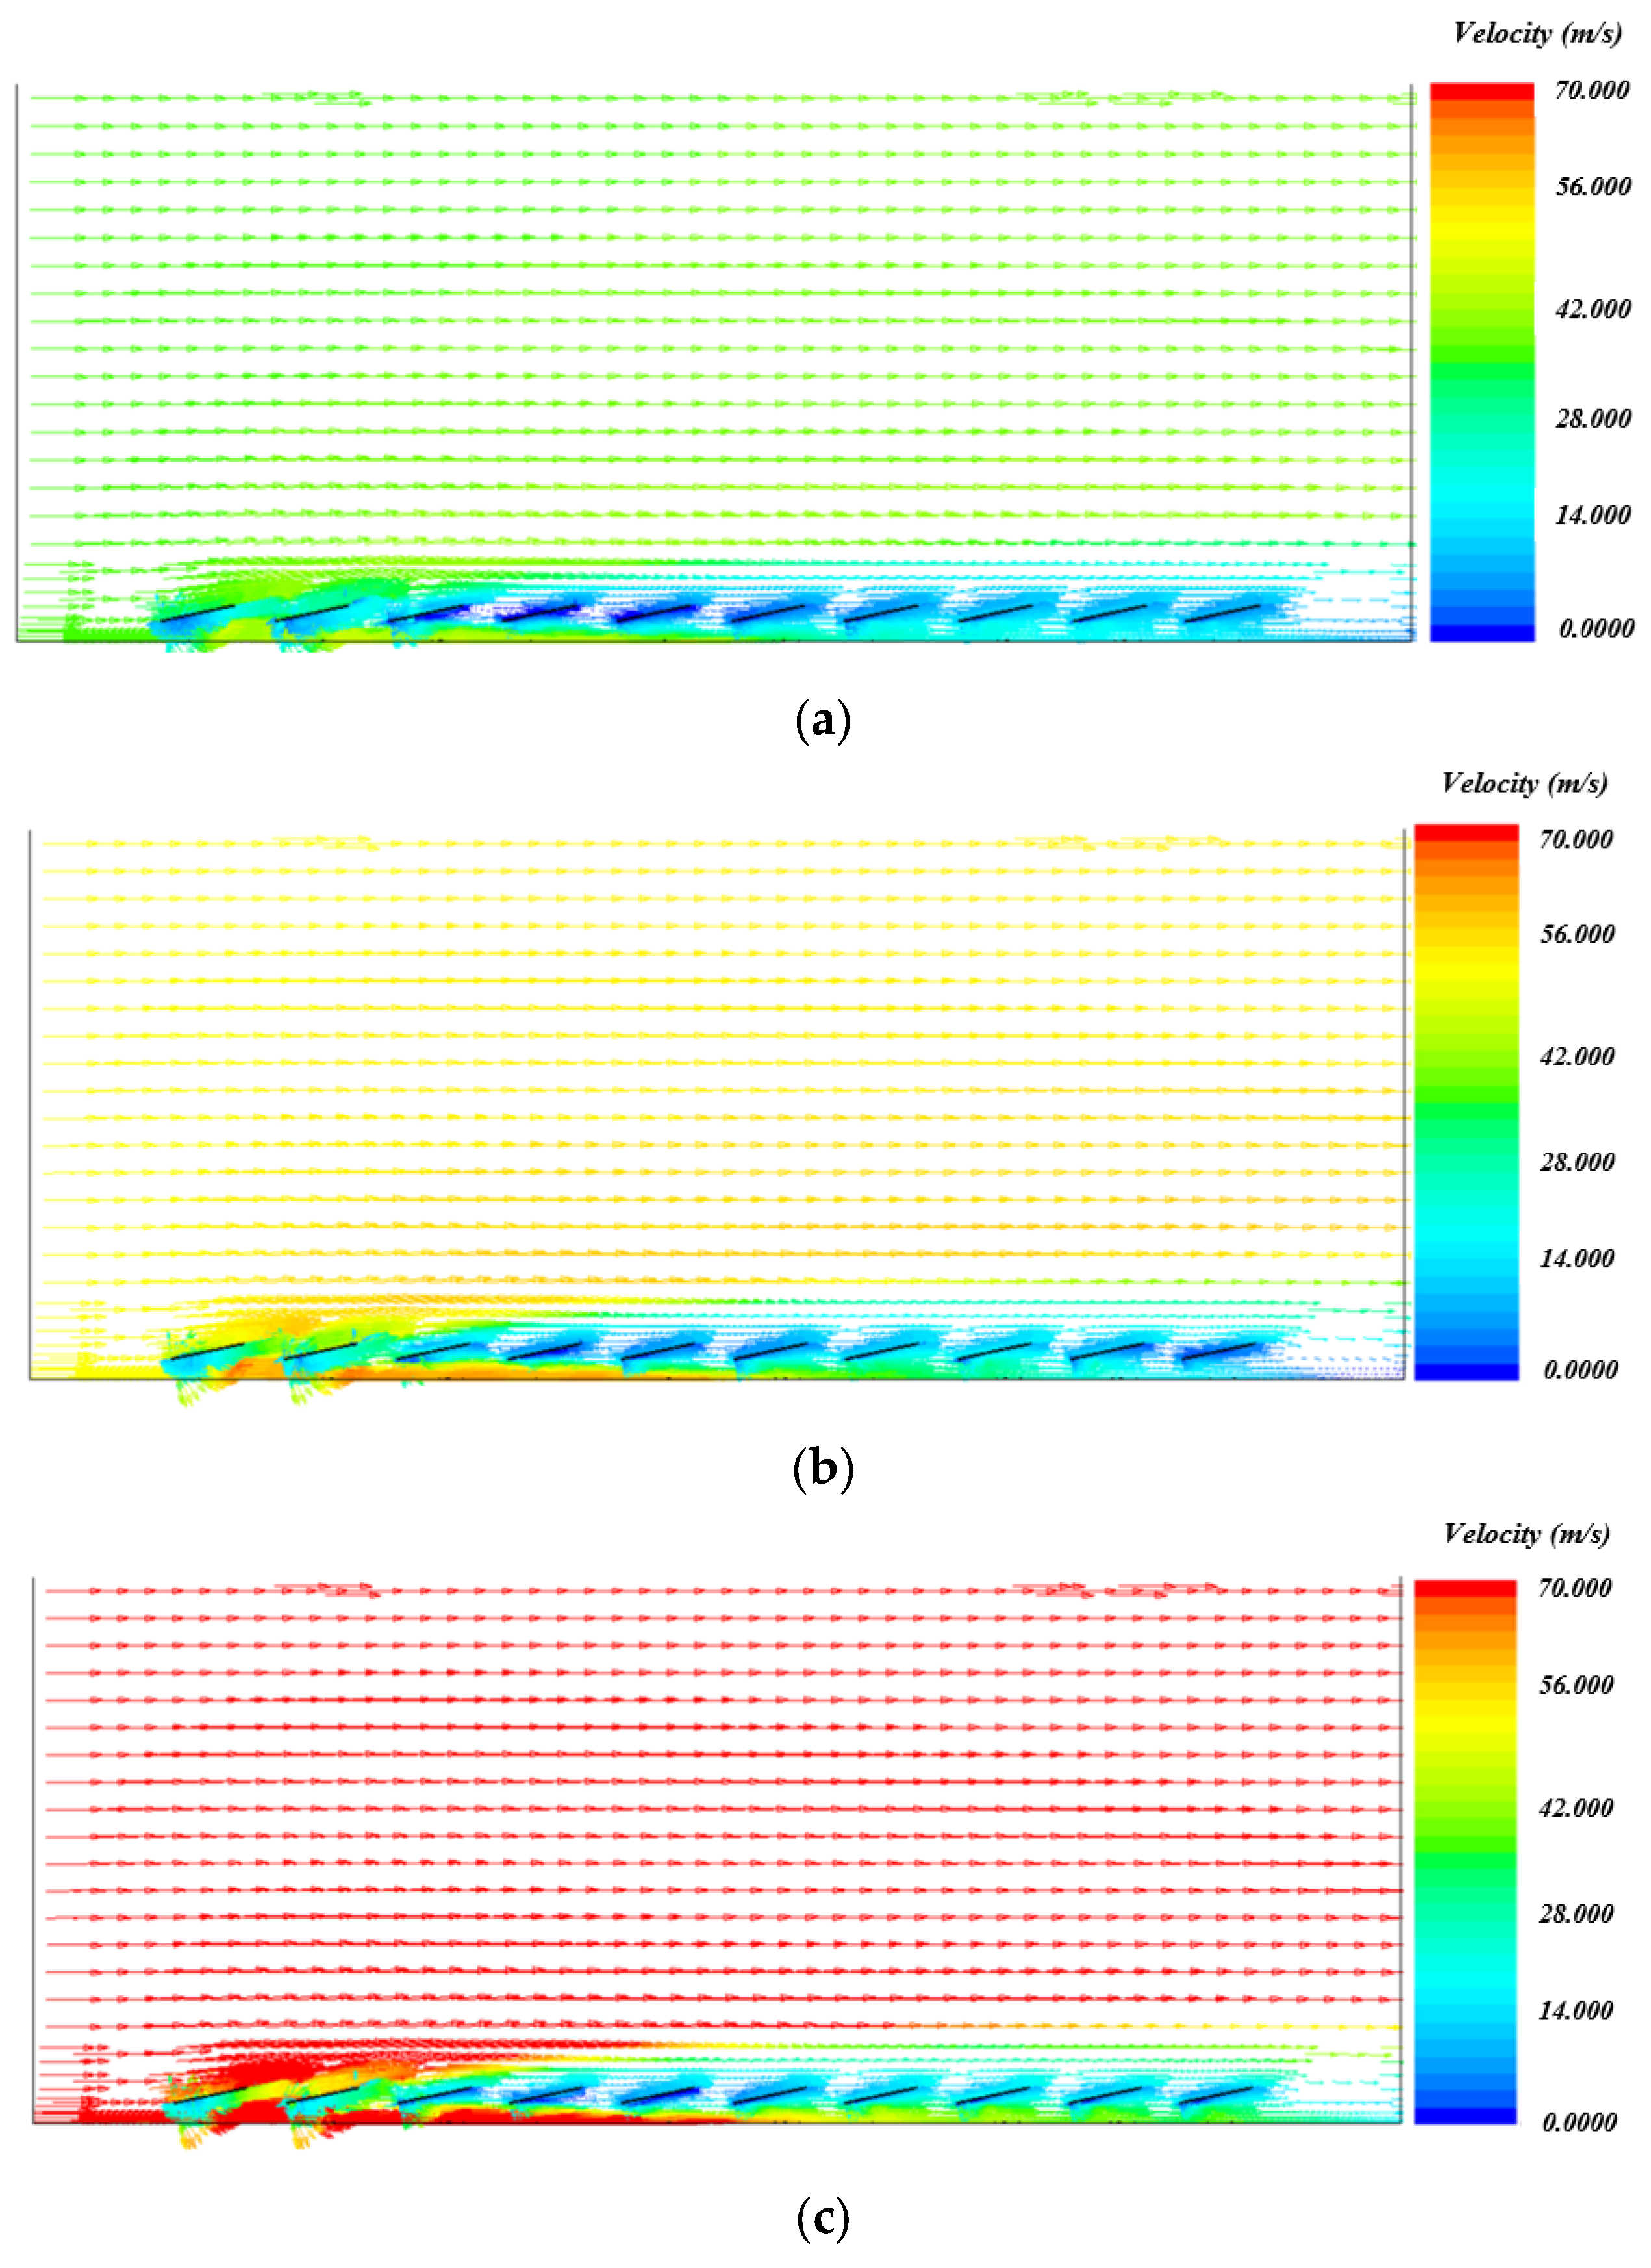
Figure 14.
Velocity vector for backward direction (β = 180°). (a) Wind speed of 36.2 m/s; (b) wind speed of 51.7 m/s; and (c) wind speed of 70.0 m/s.
Figure 14.
Velocity vector for backward direction (β = 180°). (a) Wind speed of 36.2 m/s; (b) wind speed of 51.7 m/s; and (c) wind speed of 70.0 m/s.
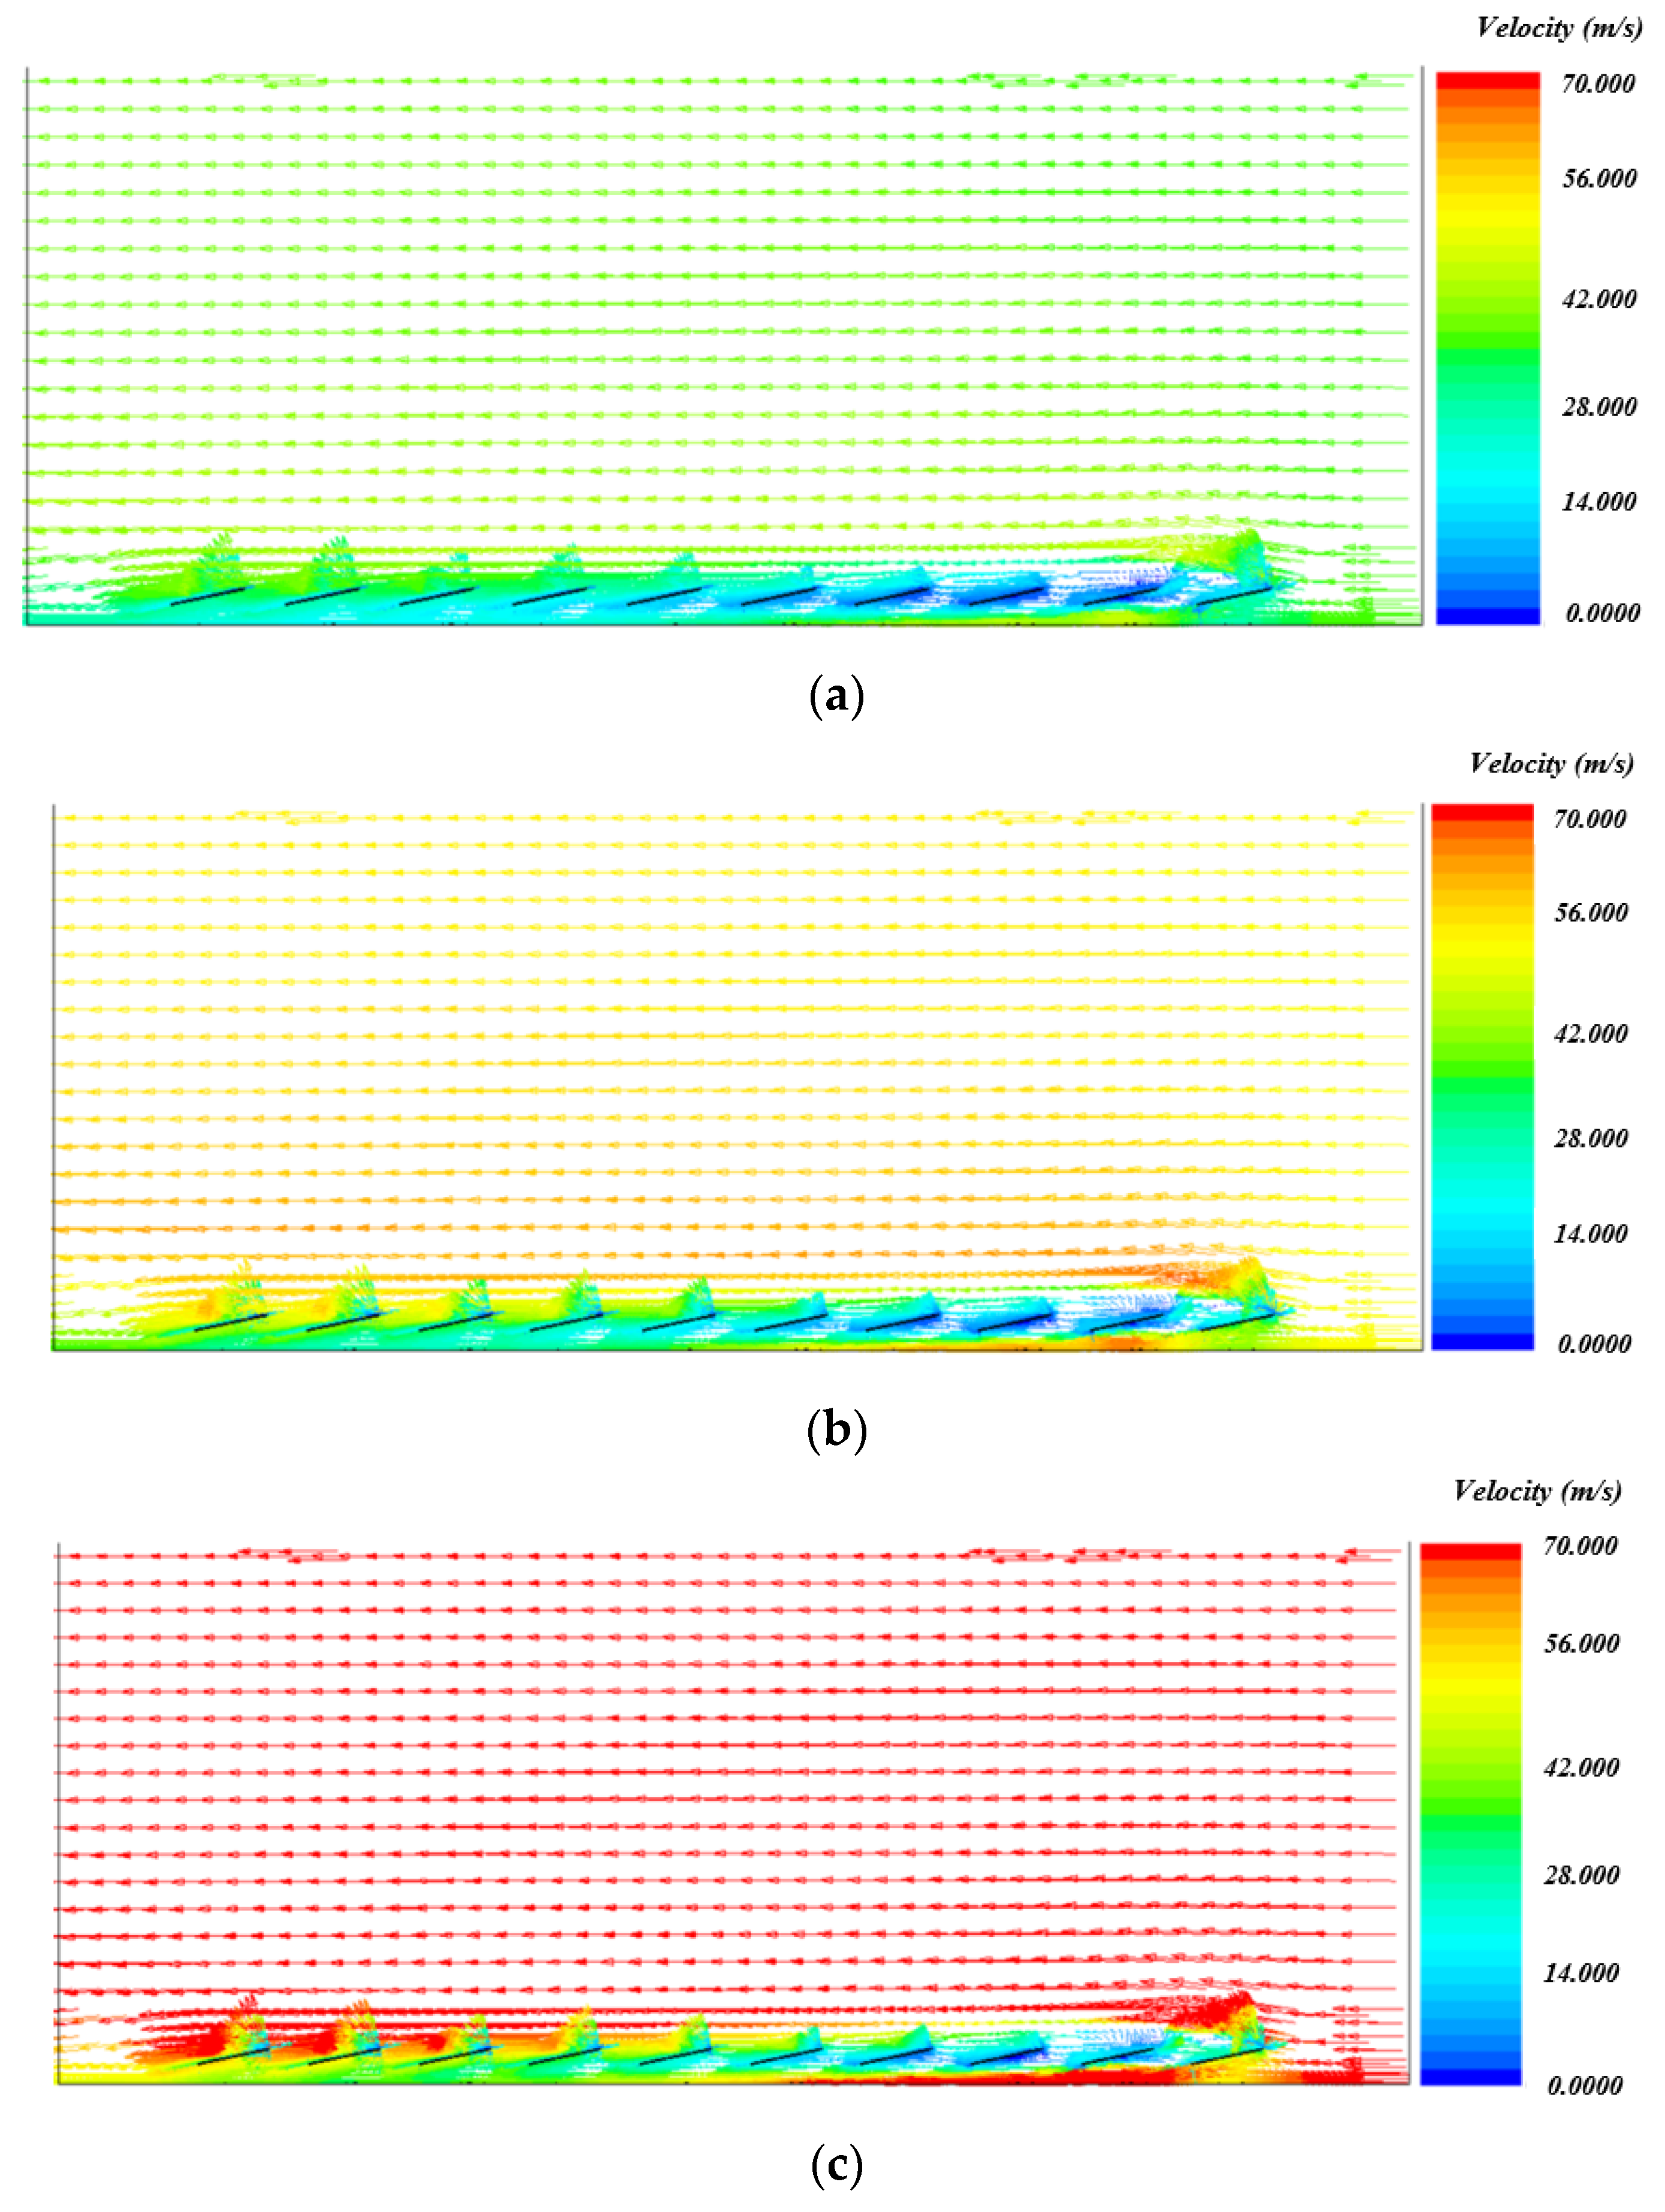
Figure 15.
Column of PV module.
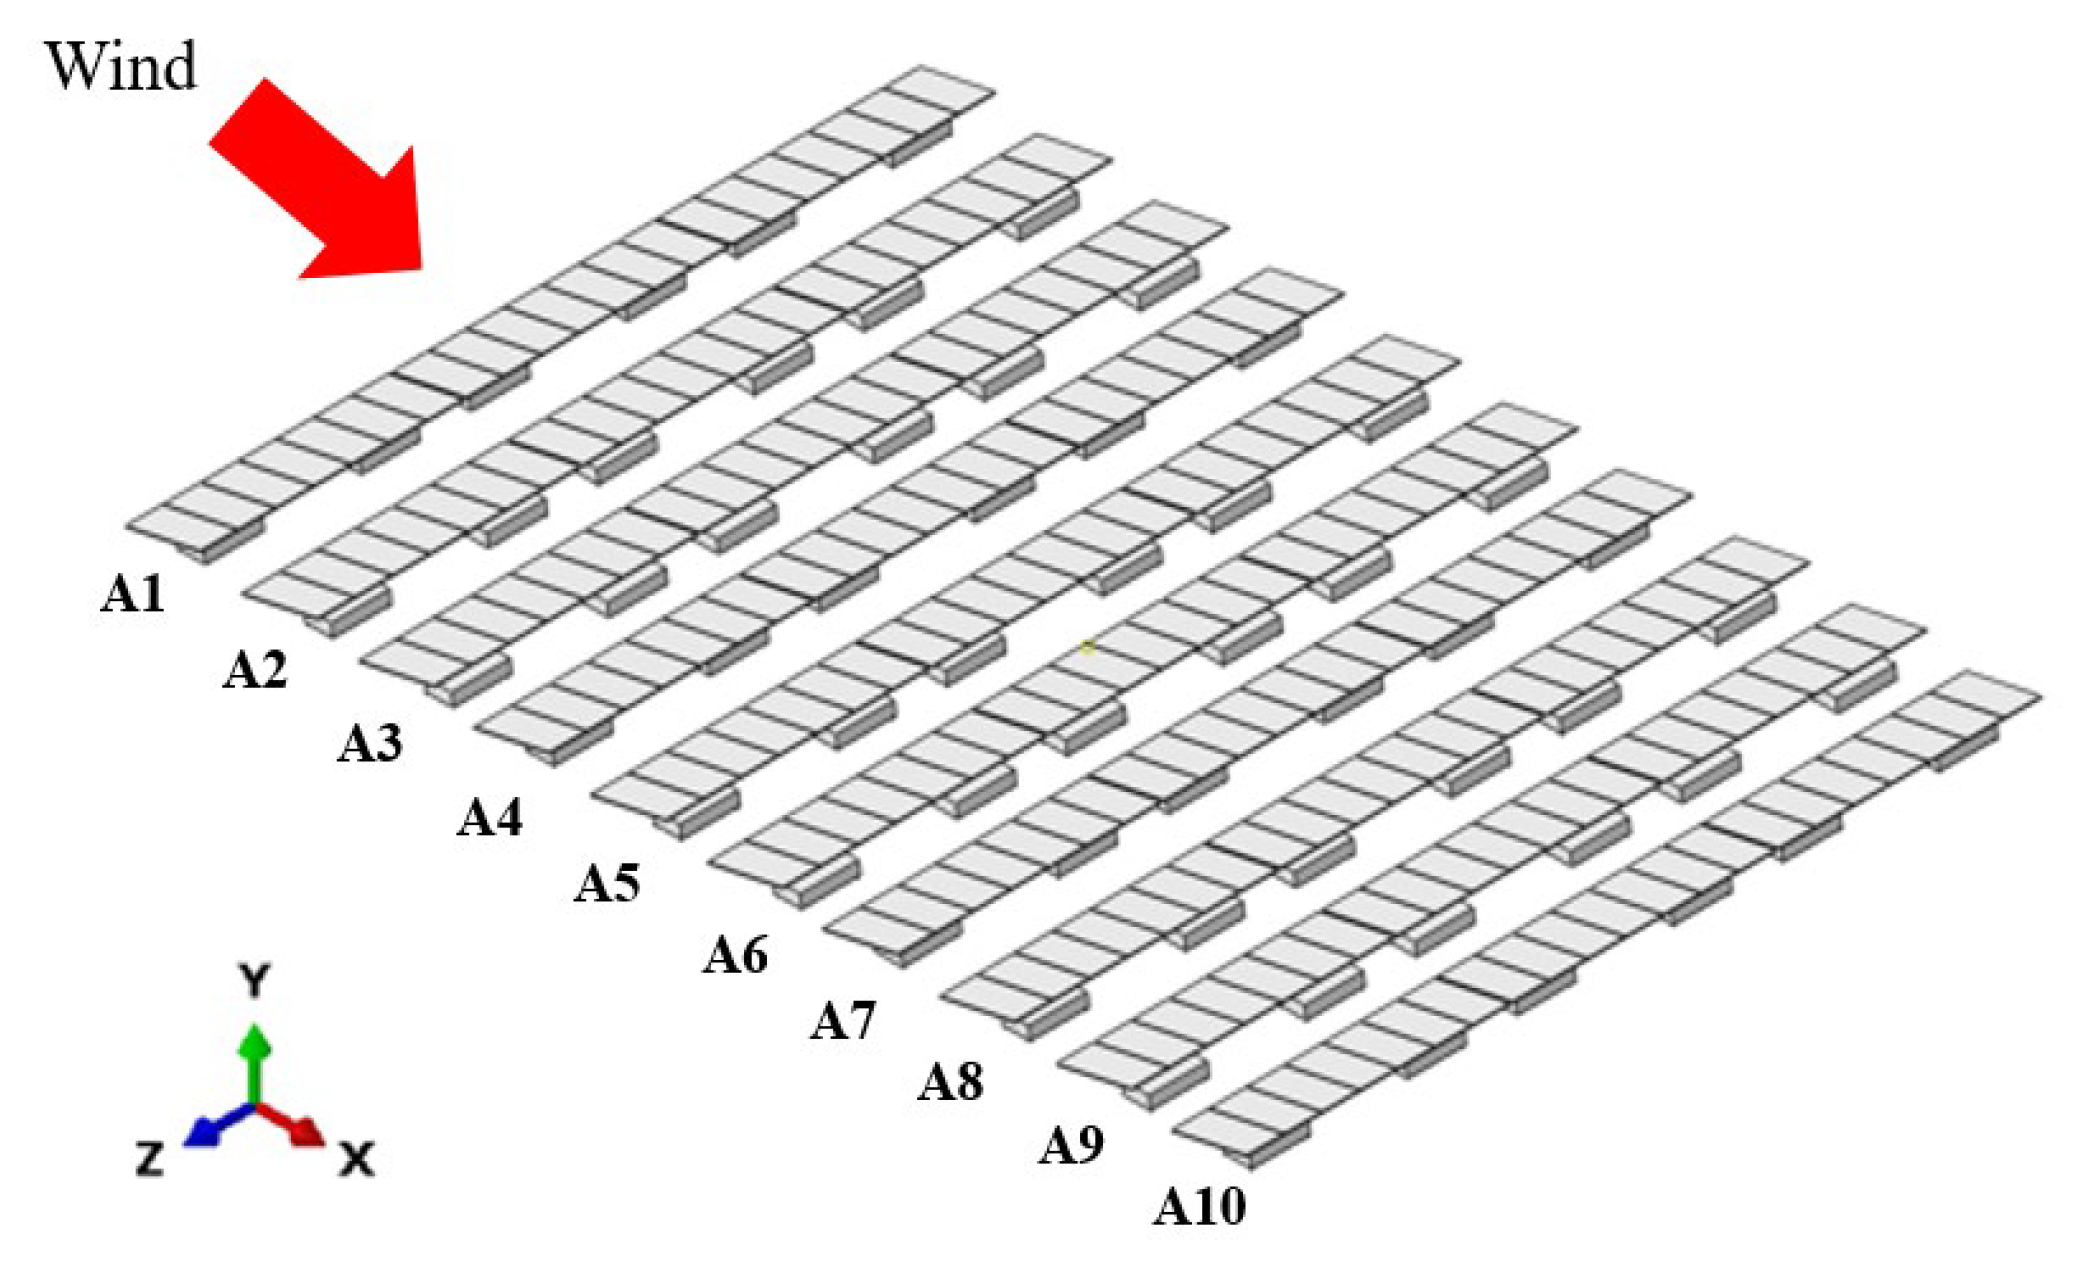
Figure 16.
Wind load distribution by wind velocity. (a) Horizontal direction; (b) vertical direction.
Figure 16.
Wind load distribution by wind velocity. (a) Horizontal direction; (b) vertical direction.

Table 1.
Load combinations.
| No. | Load Combinations |
|---|---|
| 1 | 1.4 (D + F) |
| 2 | 1.2 (D + F + T) + 1.6 L + 0.5 (Lr, S, R) |
| 3 | 1.2 D + 1.6 (Lr, S, R) + (1.0 L, 0.65 W) |
| 4 | 1.2 D + 1.3 W + 1.0 L + 0.5 (Lr, S, R) |
| 5 | 0.2 D + 1.0 E + 1.0 L + 0.2 S |
| 6 | 0.9 D + 1.3 W |
| 7 | 0.9 D + 1.0 E |
where D: fixed load; E: seismic load; F: fluid load; L: live load; Lr: roof live load; R: rainfall load; S: snow load; T: thermal load; and W: wind load.
Table 2.
Design parameters to determine wind load.
| Direction | Installed Angle (Deg.) | Wind Speed (m/s) | Etc. |
|---|---|---|---|
| Forward | 12 | 36.16 | Basic wind speed 32 m/s |
| 51.74 | Basic wind speed 45 m/s | ||
| 70.00 | Recorded maximum | ||
| Backward | 36.16 | Basic wind speed 32 m/s | |
| 51.74 | Basic wind speed 45 m/s | ||
| 70.00 | Recorded maximum |
Table 3.
Wind pressure distribution on PV modules.
| Wind Speed (m/s) | Wind Pressure (Pa) | |
|---|---|---|
| Forward (β = 0°) | Backward (β = 180°) | |
| 36.2 | 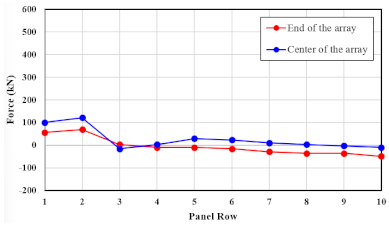 | 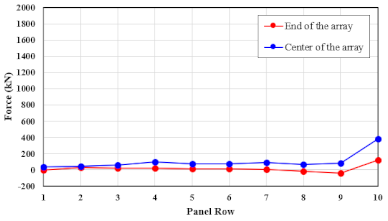 |
| 51.7 | 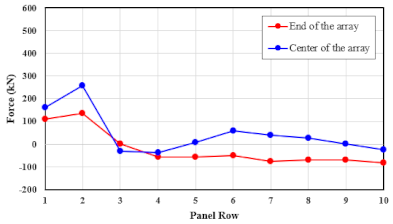 | 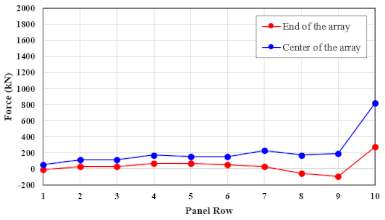 |
| 70.0 | 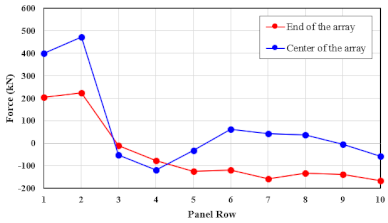 | 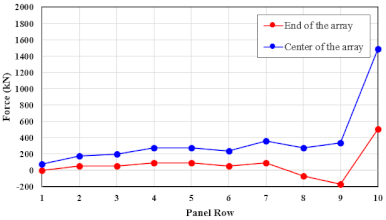 |
Table 4.
Wind load on PV modules.
| Description | Wind Load (kN) | |||||||||||
|---|---|---|---|---|---|---|---|---|---|---|---|---|
| Wind | Wind Speed (m/s) | Location | 1 Array | 2 Arrays | 3 Arrays | 4 Arrays | 5 Arrays | 6 Arrays | 7 Arrays | 8 Arrays | 9 Arrays | 10 Arrays |
| Forward (Horizontal) | 36.2 | Center | 0.0498 | 0.0572 | −0.0069 | 0.0009 | 0.0135 | 0.0119 | 0.0072 | 0.0038 | −0.0001 | −0.0064 |
| Edge | 0.0259 | 0.0306 | 0.0014 | −0.0031 | −0.0028 | −0.0066 | −0.0136 | −0.0151 | −0.0173 | −0.0210 | ||
| 51.7 | Center | 0.1006 | 0.1227 | −0.0125 | −0.0176 | 0.0068 | 0.0253 | 0.0178 | 0.0117 | 0.0021 | −0.0105 | |
| Edge | 0.0528 | 0.0648 | −0.0001 | −0.0241 | −0.0276 | −0.0256 | −0.0341 | −0.0314 | −0.0313 | −0.0394 | ||
| 70.0 | Center | 0.1829 | 0.2198 | −0.0229 | −0.0510 | −0.0101 | 0.0294 | 0.0230 | 0.0207 | −0.0014 | −0.0224 | |
| Edge | 0.0948 | 0.1043 | −0.0046 | −0.0343 | −0.0523 | −0.0525 | −0.0684 | −0.0612 | −0.0599 | −0.0756 | ||
| Forward (Vertical) | 36.2 | Center | 0.2345 | 0.2692 | −0.0326 | 0.0041 | 0.0634 | 0.0558 | 0.0337 | 0.0177 | −0.0003 | −0.0300 |
| Edge | 0.1218 | 0.1438 | 0.0066 | −0.0146 | −0.0134 | −0.0310 | −0.0638 | −0.0712 | −0.0815 | −0.0988 | ||
| 51.7 | Center | 0.4734 | 0.5774 | −0.0589 | −0.0830 | 0.0321 | 0.1193 | 0.0839 | 0.0551 | 0.0097 | −0.0496 | |
| Edge | 0.2485 | 0.3050 | −0.0005 | −0.1134 | −0.1300 | −0.1206 | −0.1602 | −0.1476 | −0.1473 | −0.1853 | ||
| 70.0 | Center | 0.8605 | 1.0339 | −0.1076 | −0.2398 | −0.0476 | 0.1381 | 0.1081 | 0.0973 | −0.0068 | −0.1055 | |
| Edge | 0.4461 | 0.4909 | −0.0217 | −0.1616 | −0.2459 | −0.2470 | −0.3219 | −0.2878 | −0.2820 | −0.3557 | ||
| Backward (Horizontal) | 36.2 | Center | 0.0109 | 0.0237 | 0.0274 | 0.0371 | 0.0376 | 0.0334 | 0.0492 | 0.0408 | 0.0445 | 0.1778 |
| Edge | −0.0046 | 0.0087 | 0.0107 | 0.0152 | 0.0167 | 0.0129 | 0.0137 | −0.0058 | −0.0174 | 0.0632 | ||
| 51.7 | Center | 0.0224 | 0.0472 | 0.0535 | 0.0732 | 0.0749 | 0.0660 | 0.0976 | 0.0800 | 0.0882 | 0.3680 | |
| Edge | −0.0089 | 0.0167 | 0.0198 | 0.0289 | 0.0321 | 0.0242 | 0.0276 | −0.0141 | −0.0390 | 0.1279 | ||
| 70.0 | Center | 0.0406 | 0.0851 | 0.0970 | 0.1328 | 0.1353 | 0.1179 | 0.1750 | 0.1404 | 0.1628 | 0.6864 | |
| Edge | −0.0172 | 0.0303 | 0.0356 | 0.0524 | 0.0567 | 0.0412 | 0.0458 | −0.0299 | −0.0772 | 0.2378 | ||
| Backward (Vertical) | 36.2 | Center | 0.0512 | 0.1116 | 0.1289 | 0.1745 | 0.1768 | 0.1570 | 0.2316 | 0.1918 | 0.2091 | 0.8365 |
| Edge | −0.0218 | 0.0411 | 0.0503 | 0.0715 | 0.0784 | 0.0607 | 0.0646 | −0.0274 | −0.0817 | 0.2973 | ||
| 51.7 | Center | 0.1055 | 0.2219 | 0.2517 | 0.3443 | 0.3524 | 0.3104 | 0.4594 | 0.3765 | 0.4149 | 1.7315 | |
| Edge | −0.0421 | 0.0787 | 0.0929 | 0.1358 | 0.1509 | 0.1140 | 0.1297 | −0.0664 | −0.1833 | 0.6017 | ||
| 70.0 | Center | 0.1908 | 0.4003 | 0.4567 | 0.6247 | 0.6367 | 0.5546 | 0.8235 | 0.6604 | 0.7658 | 3.2292 | |
| Edge | −0.0810 | 0.1427 | 0.1676 | 0.2463 | 0.2669 | 0.1936 | 0.2157 | −0.1409 | −0.3633 | 1.1187 | ||
Table 5.
Horizontal load on PV modules.
| Wind Speed (m/s) | Horizontal Load (kN) | |
|---|---|---|
| Forward (β = 0°) | Backward (β = 180°) | |
| 36.2 | 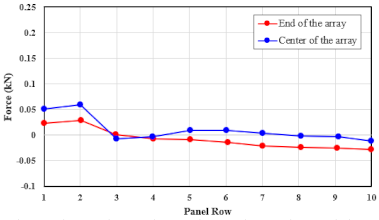 | 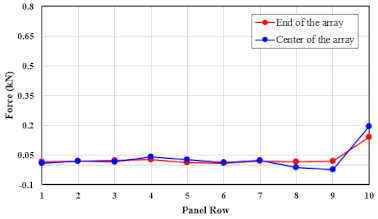 |
| 51.7 | 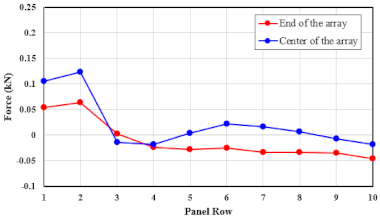 | 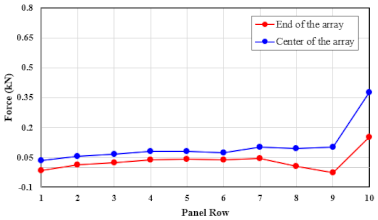 |
| 70.0 | 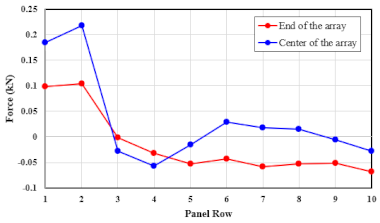 | 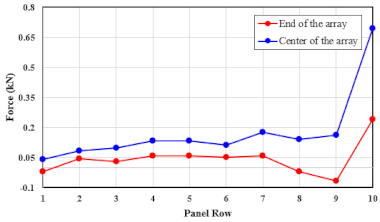 |
Table 6.
Vertical load on PV modules.
| Wind Speed (m/s) | Vertical Load (kN) | |
|---|---|---|
| Forward (β = 0°) | Backward (β = 180°) | |
| 36.2 |  | 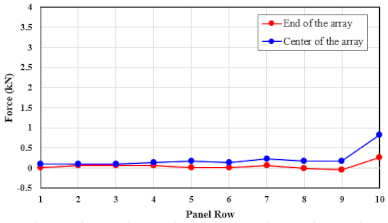 |
| 51.7 | 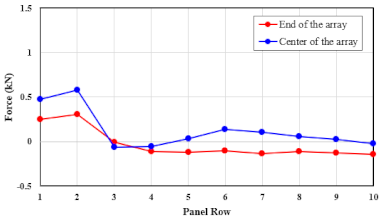 | 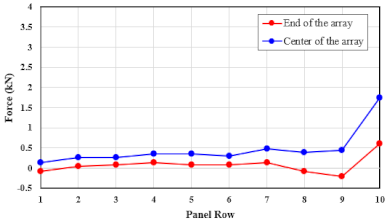 |
| 70.0 | 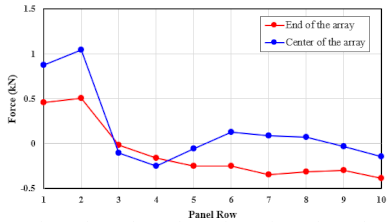 |  |
Table 7.
Design wind loads on PV modules (forward, β = 0°).
| Wind Speed (m/s) | Wind Load (kN) | ||
|---|---|---|---|
| Array 1 (A1) and Array 2 (A2) | From Array 3 (A3)~End | ||
| Horizontal direction | 36.2 | 0.0572 | 0.0135 |
| 51.7 | 0.1227 | 0.0253 | |
| 70.0 | 0.2198 | 0.0294 | |
| Vertical direction | 36.2 | 0.2692 | 0.0634 |
| 51.7 | 0.5774 | 0.119 | |
| 70.0 | 1.0339 | 0.1381 | |
Table 8.
Design wind loads on PV modules (backward, β = 180°).
| Wind Speed (m/s) | Wind Load (kN) | ||
|---|---|---|---|
| Array 1 (A1) | From Array 2 (A2)~End | ||
| Horizontal direction | 36.2 | 0.1778 | 0.0492 |
| 51.7 | 0.3680 | 0.0976 | |
| 70.0 | 0.6864 | 0.1750 | |
| Vertical direction | 36.2 | 0.8365 | 0.2316 |
| 51.7 | 1.7315 | 0.4595 | |
| 70.0 | 3.2292 | 0.8235 | |
Disclaimer/Publisher’s Note: The statements, opinions and data contained in all publications are solely those of the individual author(s) and contributor(s) and not of MDPI and/or the editor(s). MDPI and/or the editor(s) disclaim responsibility for any injury to people or property resulting from any ideas, methods, instructions or products referred to in the content. |
© 2023 by the authors. Licensee MDPI, Basel, Switzerland. This article is an open access article distributed under the terms and conditions of the Creative Commons Attribution (CC BY) license (https://creativecommons.org/licenses/by/4.0/).
Share and Cite
MDPI and ACS Style
Joo, H.-J.; Heo, S.-J.; Kim, S.-H.; Choi, W. Wind Load Distribution in Float Photovoltaic System. Appl. Sci. 2023, 13, 12144. https://doi.org/10.3390/app132212144
AMA Style
Joo H-J, Heo S-J, Kim S-H, Choi W. Wind Load Distribution in Float Photovoltaic System. Applied Sciences. 2023; 13(22):12144. https://doi.org/10.3390/app132212144
Chicago/Turabian StyleJoo, Hyung-Joong, Seong-Jun Heo, Sun-Hee Kim, and Wonchang Choi. 2023. "Wind Load Distribution in Float Photovoltaic System" Applied Sciences 13, no. 22: 12144. https://doi.org/10.3390/app132212144
Note that from the first issue of 2016, this journal uses article numbers instead of page numbers. See further details here.