Article

Extending the IFC-Based bim2sim Framework to Improve the Accessibility of Thermal Comfort Analysis Considering Future Climate Scenarios

by
Veronika Elisabeth Richter
*,
Marc Syndicus
,
Jérôme Frisch
and
Christoph van Treeck
Institute of Energy Efficiency and Sustainable Building (E3D), RWTH Aachen University, Mathieustr. 30, 52074 Aachen, Germany
*
Author to whom correspondence should be addressed.
Appl. Sci. 2023, 13(22), 12478; https://doi.org/10.3390/app132212478
Submission received: 17 October 2023 / Revised: 13 November 2023 / Accepted: 16 November 2023 / Published: 18 November 2023

Abstract

:
Future weather scenarios significantly affect indoor thermal comfort, influencing people’s well-being and productivity at work. Thus, future weather scenarios should be considered in the design phase to improve a building’s climate change resilience for new constructions as well as renovations in building stock. As thermal comfort is highly influenced by internal and external thermal loads resulting from weather conditions and building usage, only a dynamic building performance simulation (BPS) can predict the boundary conditions for a thermal comfort analysis during the design stage. As the model setup for a BPS requires detailed information about building geometry, materials, and usage, recent research activities have tried to derive the required simulation models from the open BIM (Building Information Modeling) Standard IFC (Industry Foundation Classes). However, even if IFC data are available, they are often faulty or incomplete. We propose a template-based enrichment of the BPS models that assists with imputing missing data based on archetypal usage of thermal zones. These templates are available for standardized enrichment of BPS models but do not include the required parameters for thermal comfort analysis. This study presents an approach for IFC-based thermal comfort analysis and a set of zone-usage-based templates to enrich thermal comfort input parameters.

Graphical Abstract

1. Introduction

Climate change necessitates future weather scenarios that will significantly affect humans’ everyday lives and pose challenges to housing design and construction. These challenges emphasize the need for measures such as shading, temperature peak reduction through thermal mass (if available), or night cooling ventilation [1]. Bell et al. [2] estimate an increase in cooling demand for buildings at up to 35% for the year 2050 and stress that BPS must be improved and advanced in order to serve as a reliable planning and prediction tool, for example, by properly incorporating not only warmer average temperatures due to climate change but also short yet extreme weather events. People in Western societies spend 90% of their time indoors throughout the day [3,4], and thermal comfort influences well-being and productivity at work, in schools, and at home [5,6,7]. Therefore, future annual weather conditions should be considered in a building’s design phase to improve the building’s climate change resilience for new constructions and renovations in existing buildings.
Since thermal comfort is strongly influenced by internal and external loads resulting from weather conditions and building usage, only a dynamic building performance simulation (BPS) can predict the boundary conditions for a thermal comfort analysis during the design stage. As the model setup for a BPS requires detailed information on building geometry, materials, and usage, recent research activities have attempted to derive the required simulation models from the open BIM (Building Information Modeling) Standard IFC (Industry Foundation Classes) [8]. However, even when the IFC data are available, it is often erroneous or incomplete. A template-based enrichment of the BPS models helps fill in missing data based on archetypal usage of thermal zones (e.g., for defining internal loads and schedules based on the usage of thermal zones). These templates are available for standardized enrichment of BPS models, but do not include the required parameters for thermal comfort analysis.
We propose a basic setup to integrate automated thermal comfort analysis into an IFC-based BPS setup. This setup enables the user to perform an IFC-based thermal comfort analysis in the design process with minimal additional effort. It assists in rapidly evaluating building designs and even small changes without major remodeling efforts. The impact of climate change on building design can be easily considered when comparing the impact of design decisions. Furthermore, this setup cannot only be used to minimize building operational costs but also consider, e.g., embodied carbon for different design strategies when optimizing the building’s design for maximum thermal comfort design. For a quick template-based model enrichment, we propose zone-usage-based thermal comfort parameters. These parameters are rough estimates but enable users to consider usage-specific setups and can be further specified for individual project needs.
After an introduction to the related research on thermal comfort and climate change, IFC-based BPS, and future weather scenarios, we present our approach for IFC-based thermal comfort simulation. This approach extends the existing IFC-based BPS approach bim2sim [9,10]. A set of thermal comfort parameters for template-based BPS model enrichment supports the presented bim2sim extension. The proposed methods and templates are evaluated on a case study IFC building applying a TMYx (2007–2021) and SSP5-8.5 (2050, 2080) weather scenarios for Cologne, Germany.

1.1. Related Research

The related research for our study is grouped into the three areas of (1) thermal comfort with respect to climate change, (2) general IFC-based methods for BPS, and (3) related research on future weather scenarios for the use in BPS.

1.1.1. Thermal Comfort and Climate Change

Thermal comfort in general and the Fanger [11] model in particular have been used in different simulation scenarios, but oftentimes for a specialized purpose or situation, such as thermal comfort in trains [12], the prediction of thermal comfort in indoor swimming pools [13], the heat exposure in a kitchen environment [14], or the investigation of rural heating systems’ efficacy [15]. In early design stages, suitable models for occupant behavior allow the designers to evaluate design decisions with respect to their combined influence on comfort and the building’s energy consumption [16]. Gritzki and Rösler [17] describe a simulation approach where BPS and HVAC system simulations were coupled with Computational Fluid Dynamics (CFD) in order to investigate the feasibility of Net-Zero Energy concepts in office buildings. Although their approach is quite extensive, including thermal and draught simulation as well as prediction of CO 2 distribution, it might prove beneficial to interface this approach with IFC to facilitate integration into the BIM process.
Barbosa et al. [18] describe an approach to investigate the vulnerability of Portuguese residential buildings, focusing on occupancy and insulation. Their multi-step procedure involves geometry and constructive data acquisition, acquisition of monitoring data, modeling in EnergyPlus as well as calibration against weather data and the final comfort assessment. The results emphasized the beneficial role of external insulation in increasing the adaptive capability of buildings. As stated by the authors, future replications should also include air-tightness of the building or additional shading devices in the simulation.
Applying the Simulation-based Large-scale uncertainty/sensitivity Analysis of Building Energy performance (SLABE) methodology, Escandón et al. [19] projected the impact of climate change on a building category with a case study object located in Seville, Spain. Generalization took place by Monte Carlo resampling of the EnergyPlus input parameters. Among the nine geometrical parameters, floor height, form ratio, floor area, and orientation had considerable influence. Among the 17 envelope parameters, the absorptance of the wall’s external layer showed the highest standard rank regression coefficient in that category. User behavior was identified as the major influence within the three analyzed operation parameters, but also among all categories, and its relevance was estimated to even increase with the progress of climate change. In line with previous studies, the authors project an overall worsening of the indoor thermal conditions towards the year 2050, resulting in elevated cooling demands (up to 250 % increase) and an increase in discomfort hours of about 36 %. Escandón and colleagues suggest and emphasize the usefulness of incorporating the approach as a plugin in BIM tools.
Aiming to improve multi-type building performance prediction as well as optimization, Yan et al. [20] propose a machine learning (ML)-based procedure, which was applied to dwellings by the Singaporean Housing Development Board. Transfer learning techniques, as well as multi-objective genetic optimization, were utilized to derive optimal performance and design parameters for daylight performance, energy efficiency, and thermal comfort from short to long-term future climate conditions.
Various approaches to evaluate the thermal resilience of buildings were reviewed by Siu et al. [21]. According to the authors, one of the main issues to be resolved is a lack of standardized procedures for the prediction and evaluation of a building’s thermal resilience with simulations. This holds true not only for the BPS part but also for the methods applied to create extreme weather data. Many of the studies projecting thermal comfort changes caused by climate change oftentimes focus on regions where heat is already present [22,23,24]. As no region will remain untouched by climate change or its consequences, it might prove beneficial to include a thermal comfort simulation and prediction component in BIM models.
The heat-balance guided thermal comfort model by P. O. Fanger [11] is implemented in current comfort-related standards such as the ASHRAE 55 [25] or DIN EN ISO 7730 [26]. Although the model has been criticized because of some shortcomings compared to adaptive approaches—such as its application focus on mechanically conditioned buildings—it is still one of the most common models applied to derive predictions for thermal comfort [27]. Besides the theoretically sound foundation on human heat exchange with the environment, the model is fairly easy to apply based on four physical (air temperature, radiant temperature, air velocity, and relative humidity) as well as two person-related (physical activity, clothing) variables. Both of the model’s metrics, the predicted mean vote (PMV) and the predicted percentage dissatisfied (PPD), are easy to interpret and present themselves as suitable variables for simulation purposes.

1.1.2. IFC-Based BPS

The use of Building Information Modeling (BIM) as a collaborative approach for building design is widely used in the European Union, but the implementation is heterogeneous [28]. IFC [8] is used as an open data exchange format for BIM data. The IFC-based setup of BPS models has been widely discussed in related research, but the IFC-based process still leads to errors (e.g., syntax, geometry, semantics, consistency) [29,30,31]. So far, the processes are not sufficiently supported and integrated by available software tools, preventing them from being more widely adopted in industry.
The basic concept of translating IFC-based geometry into BPS models utilizes the second level space boundaries (IFC4: IfcRelSpaceBoundary2ndLevel), initially introduced by Bazjanac [32]. These space boundaries describe the virtual heat-transmitting surfaces in-between thermal zones and the building’s surroundings, considering adjacent thermal zones and building constructions. While some studies discuss methods for generating second-level space boundaries for building simulation [33,34,35,36,37,38,39] or directly integrate space boundary generation methods in their IFC-based BPS approaches [39,40,41], other studies rely on the IFC4 schema-conform definition of space boundaries for the (semi-)automatic generation of BPS models [9,42,43,44,45]. To be able to rely on the quality of provided space boundaries, a validation and/or a correction process may need to be applied, as proposed by Ying and Lee [29], Richter et al. [30]. At least for minor corrections (e.g., surface normal orientation), the correction process, in most cases, has less computational costs than generating new space boundaries and should be preferred over generating a full set of new space boundaries.
With its modular and open-source approach for IFC-based BPS simulations, the bim2sim tool [9,10] provides a solid base for adapting the EnergyPlus-based BPS methods toward thermal comfort analysis. The bim2sim tool aims to support engineers with a geometric and semantic simulation model setup using IFC and template-based data. This drastically reduces the manual model setup time, while only minor manual model corrections are required after applying the bim2sim tool [10].
The structure of this open-source framework is displayed in Figure 1, showing the central data processing and enrichment steps for the two BPS plugins PluginEnergyPlus and PluginTEASER, using EnergyPlus and Modelica as simulation backends, respectively. A similar approach is available for HVAC simulations with the PluginAixLib, also using Modelica as a simulation backend. The modular approach of the bim2sim tool and the integrated HVAC simulation support the future implementation of a dynamic co-simulation setup of BPS and HVAC, which is not part of the proposed methods but could also be extended for the application of thermal comfort. The initial implementation of the bim2sim framework also includes plugins for exporting CFD boundary conditions for use in the commercial CFD-Software ANSYS FLUENT (Version 2022 R2) and an initial implementation supporting Life Cycle Assessment (LCA) [10].
All plugins start with the shared process of loading the IFC data. In the next step, the required elements for the BPS domain are created for the respective process (e.g., walls, slabs, windows, doors, and space boundaries). The available element properties within the IFC are identified, evaluated, and enriched (user input- or template-based) if properties are missing. This process is followed by plugin-specific settings, the export for the simulation backend, and the simulation itself.
The template-based enrichment in bim2sim builds on archetypal templates (e.g., for zone usage), which are derived within TEASER [46]. These use conditions represent the boundary conditions for zone types defined in DIN V 18599-10 [47] and VDI 2078 [48] and are further enriched by internal load profiles defined in SIA 2024 [49] (TEASER Documentation: https://rwth-ebc.github.io/TEASER//master/docs/code/teaser.logic.buildingobjects.html#teaser.logic.buildingobjects.useconditions.UseConditions, accessed on 12 November 2023).
Mahecha Zambrano et al. [16] state that the representation of occupant behavior in BPS, i.e., occupancy and occupancy-related schedules (internal loads due to lighting and equipment), is oversimplified, and that the development of a generalized model for occupant behavior is impossible due to the occupants’ diversity. For the simulation of thermal comfort, the hierarchy of occupant behavior needs to be evaluated, e.g., how the occupants decide on changing room set point temperatures and adjusting their clothing when feeling thermally uncomfortable [16]. The choice of the modeling approach for occupant behavior in related research is based on the type of behavior, the building design stage, or the spatial scale of the simulation. Depending on the scale of the simulation, stochastic occupancy models can be used to derive suitable occupancy profiles for the buildings. To minimize the (manual and computational) effort in considering occupant behavior, Mahecha Zambrano et al. [16] suggest using a pre-processed set of schedules for occupant behavior with an estimation of the probability of these scenarios. This schedule set could support the designer in the decision-making process when considering extreme events. However, as the available occupant models lack validation, standardized validation approaches are required to be able to compare the results of different studies [16].
The bim2sim tool acts as basis for further development of IFC-based thermal comfort methods within the present study. However, thermal comfort parameters are yet not sufficiently represented within the usage-based TEASER templates.

1.1.3. Future Weather Scenarios

For the generation of future weather scenarios, General Circulation Models (GCMs) are downscaled from their worldwide scale of typically 1–5° latitude and longitude [50] (i.e., about 111–555 km) to regional scale high-resolution Regional Climate Models (RCMs) with a resolution of 4 km or less [51]. Wilby and Wigley [52] introduced four statistical downscaling approaches: regression, weather pattern approaches, stochastic weather generators, and limited-area climate models. Belcher et al. [53] further refined these approaches to dynamical downscaling, stochastic weather generation, interpolation, and introduced morphing. While dynamical downscaling is computationally expensive, stochastic weather generation requires large input data sets, and interpolation may lead to biased resulting data; the proposed morphing technique has low computational cost and builds upon real climate data [53]. However, even though this technology produces consistent future weather data based on future climate predictions, the resulting characteristics are still mainly influenced by the input weather data and, thus, do not reflect changed characteristics and variability (e.g., heat waves) in future climate [53].
Zeng et al. [54] present a recent critical review on these generation approaches of future weather data for building performance simulation, giving advice for the choice of future weather files according to the application (i.e., energy analysis, thermal resilience, HVAC design, utility analysis). For the analysis of thermal resilience, they recommend the use of future extreme weather data instead of typical year weather data. However, morphed weather data (unable to reflect actual future weather variability) was still used in related research [54].
Nielsen and Kolarik [55] presented a review on existing climate research. They discovered that more than half of their 47 analyzed studies (2015 and newer) used the outdated weather data of CMIP3 (Phase 3 of the Coupled Model Intercomparison Project (CMIP), supporting the fourth assessment report of the Intergovernmental Panel on Climate Change (IPCC) based on weather data mostly generated in 2005 and 2006: https://pcmdi.github.io/mips/cmip3/, accessed on 12 November 2023), partially due to the availability through the CCWorldWeatherGen Tool that easily generates EnergyPlus Weather files. Only five out of the analyzed studies underlined why they chose the selected climate model even though the resulting weather files show high variance and may lead to an erroneous interpretation of the simulation results. The ways to deal with solar radiation data for BPS are manifold in related research, as global horizontal irradiance from GCM and RCM have to be converted to direct normal irradiance and diffuse horizontal irradiance for the use in BPS [55]. They published the results of their study on a continuously updated webpage (FutureWeatherBPS: www.futureweatherbps.com, accessed on 12 November 2023), currently (November 2023) including data from 82 studies and a total of 210 locations.
Rodrigues et al. [56] propose an open-source morphing tool for future weather data, as the existing tools (CCWorldWeatherGen [50], Weather Morph [57], WeatherShift (https://weathershift.com/, accessed on 17 November 2023)) have limited accessibility (i.e., not open-source), rely on outdated data models, or are not free to use and, thus, may not be accessible for researchers with limited funding.
Hong et al. [58] discuss ten questions on building’s and occupants adaptation to climate changes. Considering changes in the outdoor environment and their impact on the buildings, they list general climate trends and local weather conditions, urban microclimate and heat island effects and hazards as influential on thermal resilience of buildings.

1.2. Aim of Study

The current study integrates thermal comfort analysis into an existing IFC-based BPS approach. In this way, we address the need for an automated thermal comfort model setup to avoid remodeling when considering design alternatives [21]. Zone usage-based thermal comfort parameters were derived for template-based enrichment of thermal zones, aiming to extend the existing templates. The proposed methods were evaluated on a case study building represented in IFC4. From the BPS-based thermal comfort analysis results, thermal zones with critical thermal comfort situations were identified. The case study assessed the applicability of state-of-the-art comfort metrics and the resilience of the building in future weather scenarios.

2. Materials and Methods

This section starts with an introduction to the thermal comfort approaches used in our study for thermal comfort analysis. In the following Section 2.2, we propose the implementation of our bim2sim PluginComfort, which extends the existing bim2sim EnergyPlus methods by an additional thermal comfort analysis. Section 2.3 addresses the extension of the TEASER templates by activity (Section 2.3.1) and clothing parameters (Section 2.3.2) used for thermal comfort analysis for each archetypal thermal zone. Finally, in Section 2.4, we describe the weather data used in our study.

2.1. Evaluate Thermal Comfort Models

EnergyPlus provides the implementation of the adaptive comfort analysis according to DIN EN 15251 [59], which has been withdrawn and replaced by DIN EN 16798-1 [60], which is not yet implemented in EnergyPlus. With the standard’s transition, the methods for thermal comfort still rely on ISO 7730 [26]. While methods to calculate the running mean outdoor temperature have not changed, the standards for acceptable temperatures have changed (cf. Table 1), i.e., the lower boundary for each comfort category has been reduced by one degree Celsius, and thus, slightly cooler temperatures are defined to be acceptable. However, since the calculation of temperatures itself did not change with the transition to DIN EN 16798-1, the available EnergyPlus implementation of the DIN EN 15251 can still be used with minor modifications in the evaluation of results.
The template values we derived for the clothing parameters are static throughout the whole year as a simplification for template-based model enrichment. In further research, we could use ASHRAE Standard 55 [25] dynamic clothing model in comparison to our static template-based clothing parameter set. ASHRAE 55 enables dynamic clothing based on outdoor air temperatures. This may not be applicable to office and other formal situations (e.g., in formal office or meeting situations), so zone-usage-based clothing may be more applicable in this case.

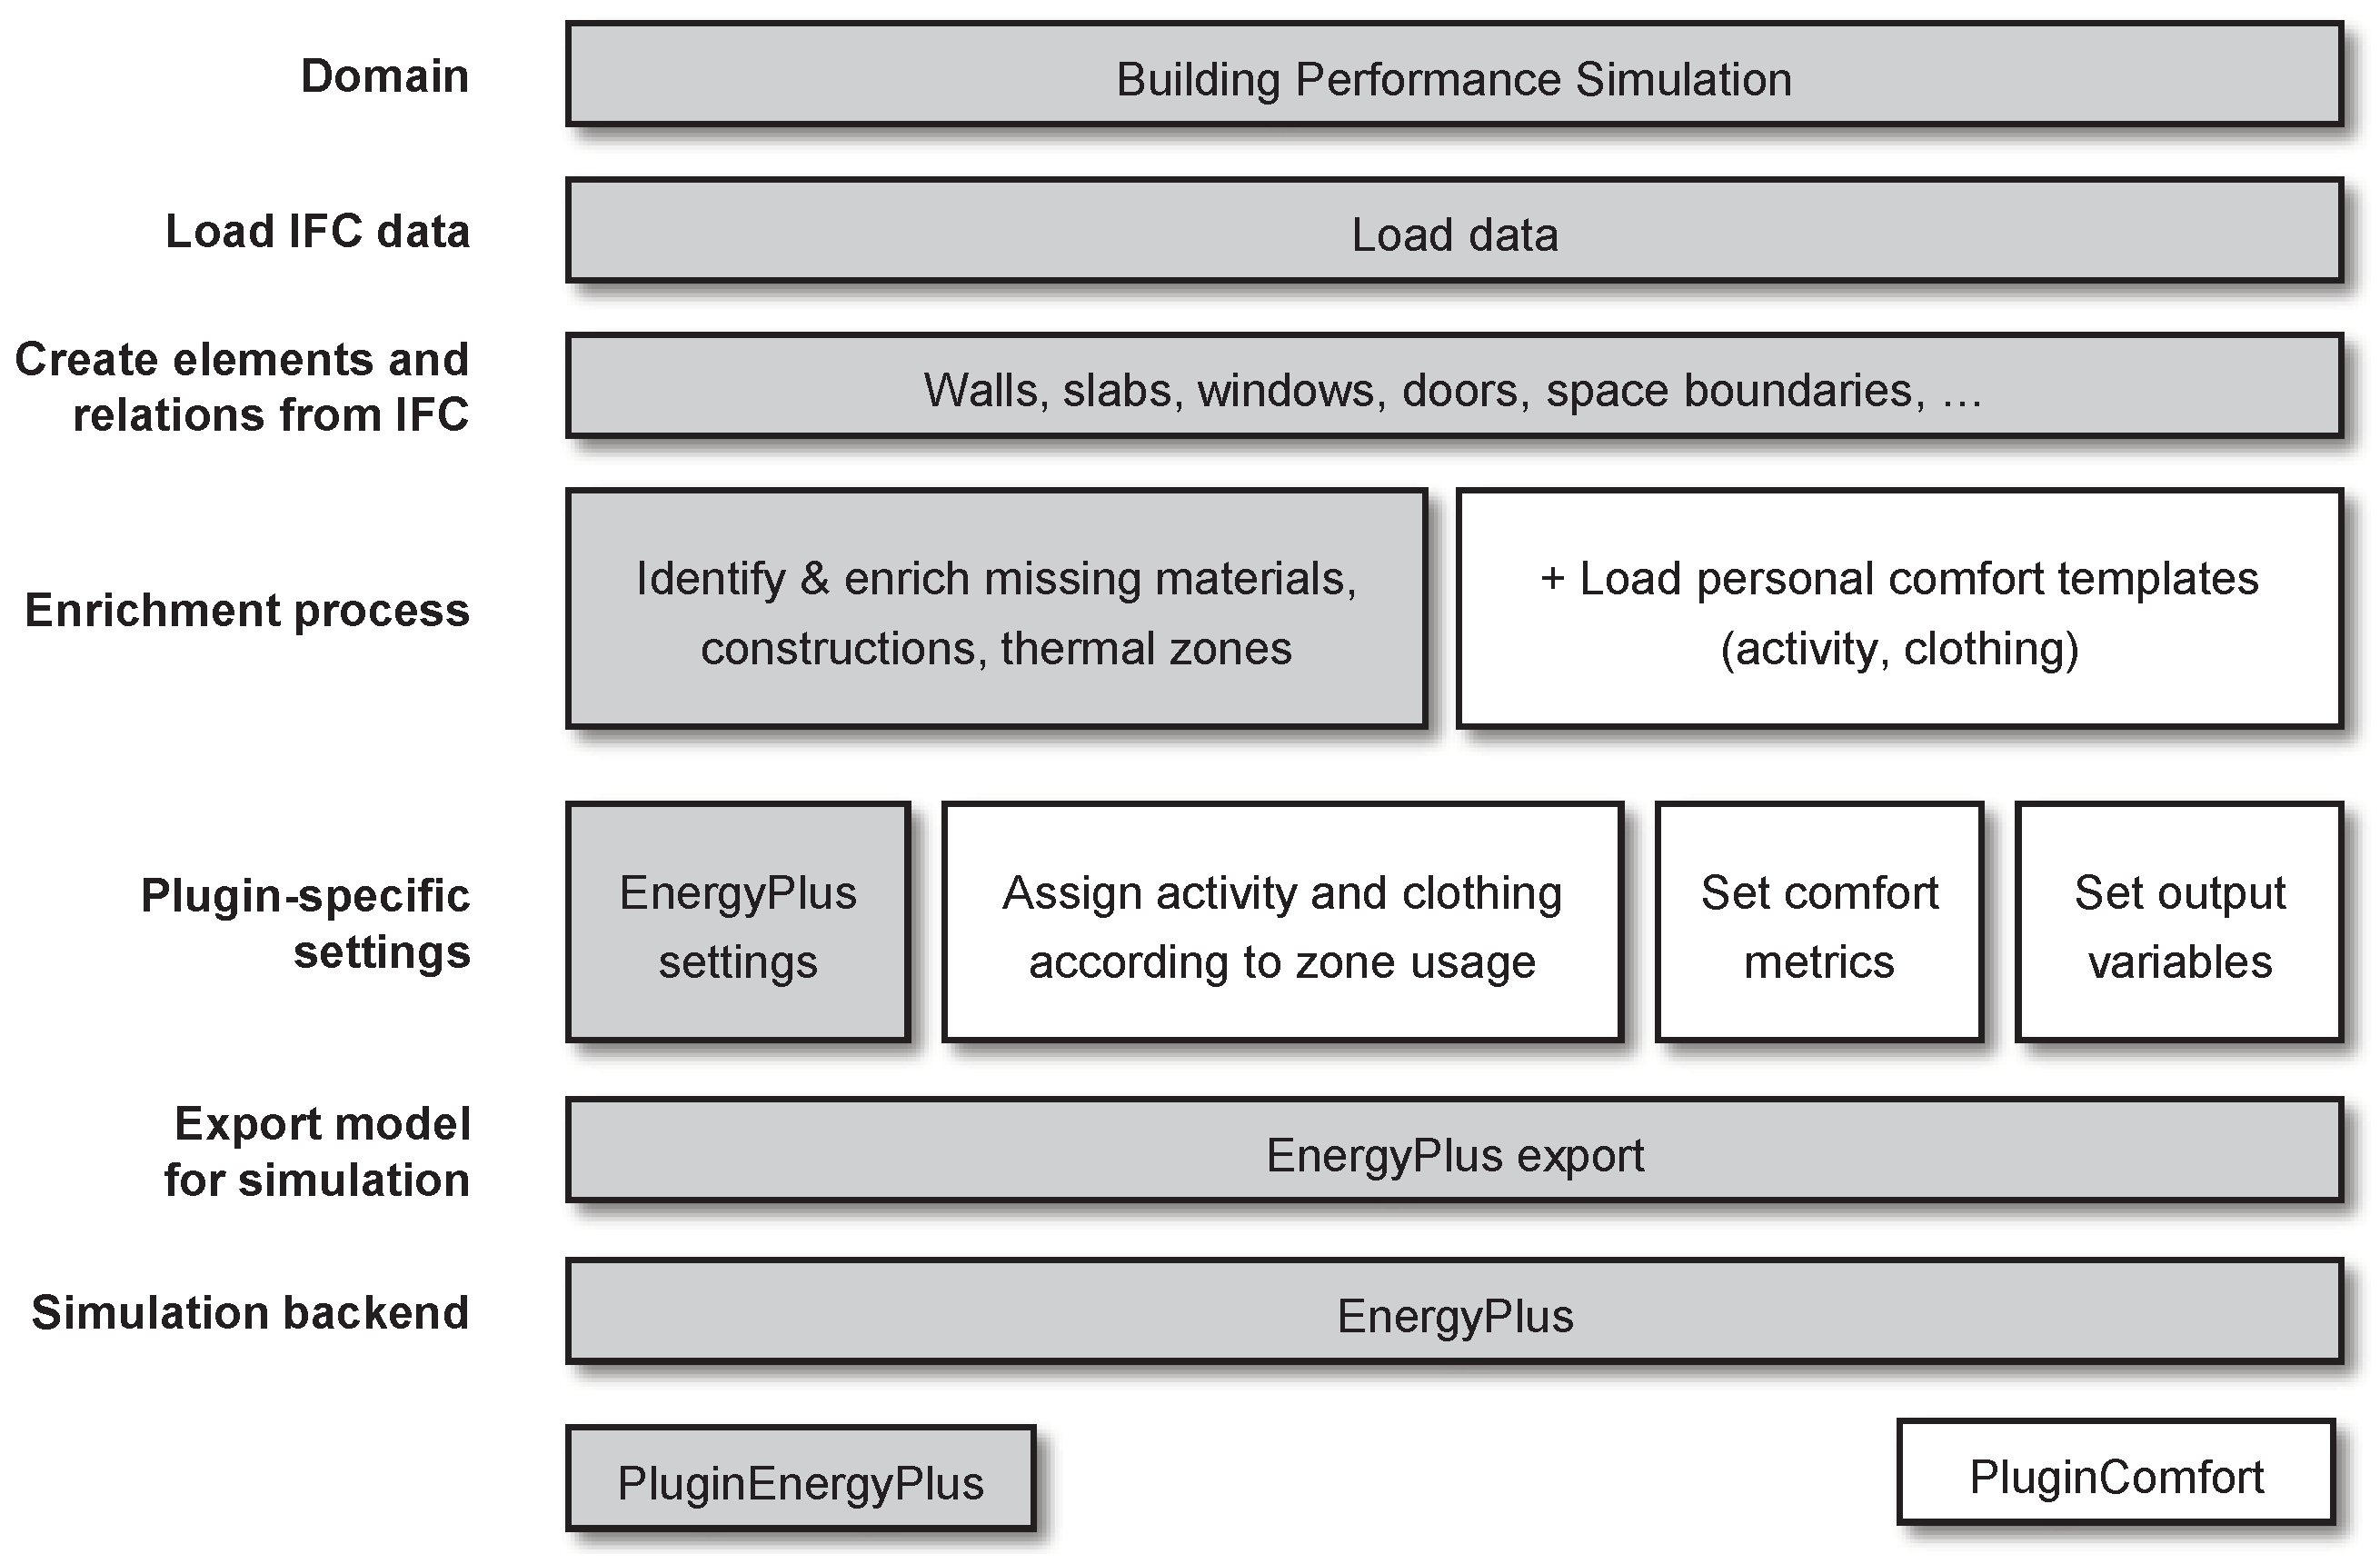
2.2. Implementation of PluginComfort for bim2sim

The proposed PluginComfort is an extension of the bim2sim PluginEnergyPlus (cf. Figure 1). This new plugin requires comfort parameters for each thermal zone, introduced as simplified usage-based parameters in Section 2.3.
Figure 2 visualizes the structure of the proposed thermal comfort plugin. This plugin builds upon the existing implementation of the PluginEnergyPlus within the bim2sim framework, as described in Figure 1. While the general tasks like loading IFC data and general element setup from IFC are the same as for all other plugins within the bim2sim environment, additional template-based data are loaded within the enrichment process of the thermal zones, adding personal comfort parameters for activity and clothing. If this data are available from the given IFC data, these personal parameters could also be loaded directly from IFC. However, since IFC does not yet provide standardized property sets for these personal parameters, the current implementation only considers a template-based enrichment for personal parameters.
Within the plugin-specific settings, the implementation of the PluginEnergyPlus is extended by adding the personal comfort parameters for activity and clothing to the individual thermal zones according to their zone usage. Furthermore, the applicable comfort metrics are selected, and the related output variables are set. The export of the EnergyPlus simulation model is the same as for the PluginEnergyPlus. The simulation results of the PluginComfort can be evaluated with suitable visualizations to support design decisions within the design stages of the building.
With this IFC-based thermal comfort plugin, BPS models for design variants can quickly be created, minimizing the manual effort to remodel the geometry. Applying future weather data within the IFC-based BPS assists in evaluating the impact of climate change and the thermal resilience of the design variants. For this evaluation, the heating and cooling loads are related to the resulting thermal comfort of the building. Considering the modular structure of the bim2sim framework, an additional analysis of the embodied carbon of the design variants could easily be added to further support the design decisions by extending the existing implementation of the LCA Plugin PluginLCA [10].

2.3. Enrichment of Thermal Comfort Parameters for Archetypal Zone Usage

Richter et al. [61] outline the input requirements for an IFC-based thermal comfort analysis. Although many parameters for thermal comfort analysis, as specified in ISO 7730, can be derived at runtime from a BPS simulation (e.g., air/radiant/floor temperature, air velocity, humidity), parameters for clothing insulation and metabolic rates must be defined prior to simulation. This parameter definition is specific for the conditions of the simulated environment. They also suggest that these parameters can be included in the underlying IFC or be defined in room-specific templates, similar to the approach used in TEASER for archetypal simulations.
In our study, we expand on and refine the existing archetypal TEASER templates (cf. Section 1.1.2) for these activity degree and clothing parameters. These parameters are derived from established standards and are mapped to TEASER’s archetypal zones. The following sections provide a detailed description of this extending and mapping process.

2.3.1. Enrichment of Activity Degree Parameters for Archetypal Zone Usage

The existing TEASER templates already include archetypal data for different usage of thermal zones, including occupant activity degree data and occupant heat flow in W / person . These parameters are derived from values provided by the Swiss standard SIA 2024 [49], which provides data to calculate the energy demand of buildings in early building design stages. However, these available activity degrees are standardized (mostly either 1.2   met or 2.0   met ) and do not reflect the expected variations in activity due to individual zone usage. Therefore, these parameters are unsuitable for evaluating zone-usage-based thermal comfort, as shown by a first comparison of the existing TEASER activity data with standards for thermal comfort analysis [26,62].
There are several national and international standards for defining the activity degree of occupants. DIN EN ISO 8996 [63] provides data to accurately determine the metabolic rate in working environments. This standard also provides calculation methods to determine the metabolic rates for various activities, taking into account human conditions such as gender, age, and body weight. However, since we extend a template-based approach that provides approximate data to enrich archetypal zone setups, we require more generalized metabolic data at this stage. For this purpose, DIN EN ISO 8996 [63] categorizes metabolic rates in its Annex A, ranging from (0) Resting (100– 125   W / person ) to (4) Very high metabolic rate (> 465   W / person ). As these categories are broad, each covering a range of metabolic rates of about 100   W / person , we rely on other international standards and guidelines (i.e., ISO 7730 [26], ASHRAE Fundamentals [62]) for more specific metabolic data related to particular activities.
ISO 7730 [26] provides metabolic rates and heat flows for different activities in Table A.5 and Table B.1. The ASHRAE Fundamentals [62] give a detailed introduction to thermal comfort analysis in Chapter 9, providing typical metabolic rates for an average adult person (person’s body surface area A = 1.8   m 2 ) in Table 4.
Table 2 displays an excerpt of the activity values for the archetypal room types in the existing TEASER template (cf. Table A1 for full set of parameters for all zone types), along with the corresponding derived activity values obtained from ISO 7730 and ASHRAE Fundamentals. To make the data derivation process transparent, we list the activity types mapped to each room type from both sources (columns (4) and (5)) and their related individual metabolic rates. The metabolic rates from ISO 7730 and ASHRAE Fundamentals show only minor deviations (mostly 0 0.2   met ), although the matched activities vary due to differences in specifications. The newly derived (and combined) activity degree is calculated as the mean of columns (6) and (7), rounded up to the nearest decimal place. This value is rounded up because a higher activity degree results in higher cooling loads and an increased risk of occupant overheating during summer. On the basis of this combined activity degree, the heat flow ( W / person ) is displayed in column (10), calculated with 1   met = 58.1   m 2 and the average adult surface area of A = 1.8   m 2 [62].
Columns (9) and (11) show the absolute difference to the original activity parameters from the TEASER Templates given in columns (2) and (3), respectively. While some of the metabolic rates correspond to the previous TEASER values, the new values for the heat flow per person greatly exceed the previous values (mostly between 79 and 169 %, referring to the full parameter set in Table A1).
Updating the activity data in the TEASER Templates is necessary for thermal comfort analysis, as they show high deviations from the metabolic rates reported in existing thermal comfort standards. Since the activity values provided in ASHRAE Fundamentals and ISO 7730 show only small deviations, the derived combined values give a reasonable estimate for these corrected parameter values.

2.3.2. Enrichment of Clothing Insulation Parameters for Archetypal Zone Usage

Contrary to the derivation of activity parameters, the TEASER templates do not provide pre-existing values for clothing insulation parameters. Thus, these values have to be derived from scratch. These values could be derived from the detailed clothing combinations in the international standard DIN EN ISO 9920 [64], which focuses on detailed descriptions of clothing settings. However, similar to the DIN EN ISO 8996 [63] standard for activity degrees, the DIN EN ISO 9920 [64] describes the clothing insulation with such high detail that it is not easily applicable for deriving standardized clothing insulation settings for extending the pre-existing templates. We only expect these more detailed clothing parameters to increase the accuracy of the simulation results if we perform a massive study on average clothing in buildings.
Similar to the previous section, ISO 7730 [26], Table C.1 and the ASHRAE Fundamentals [62], Chapter 9, Table 7 provide data for predefined clothing sets. Opposite to activity degrees, clothing parameters may vary with the seasons. ISO 7730 states operative temperatures for summer and winter, referring to a general clothing value of 0.5   clo (summer) and 1.0   clo (winter). However, as for the individual archetypal room settings (e.g., offices), specific clothing standards may apply that do not vary with the seasons. The first version of the data set only provides a single clothing parameter since the set point cooling and heating temperatures also do not vary with the seasons in the TEASER templates.
The calculation of the complete clothing insulation I T consists of multiple parts, e.g., base insulation (clothing insulation I c l ), air insulation I a , and clothing area factor f c l [64]. The position of the human body (e.g., seated, standing) and the surroundings (e.g., chair if seated, bed if sleeping) also affect the person’s insulation. ASHRAE Fundamentals [62] state that a factor of up to 0.15 clo should be added to the clo value caused by clothing when a person is seated on a chair. Nevertheless, clothing insulation and air insulation cannot simply be added, as the clothing affects the air layers [64]. The surrounding insulation significantly affects the effective insulation of a person in bedding systems. However, as our study proposes a new set of generalized templates for archetypal zone usage that is used for simple estimation of thermal comfort in the design phase, we decided to add clothing insulation values as additional insulation factors, such as chairs (when seated) or beds (when sleeping). The reduced accuracy of the clothing insulation is covered by the general assumption of an estimation of an average/standard setup (of person, clothing, and activity degrees) per archetypal zone usage.
In the proposed template (see Table 3 for an excerpt and cf. Table A2 for the full parameter set), we split the insulation parameter into two parts: clothing insulation and surrounding insulation. By splitting these parameters, we ensure transparency of our assumptions. We consider the sum of these two parameters for our further thermal comfort analysis.
Depending on climate zones as well as culture, bedding systems vary with regard to insulation, materials, and general configuration. However, as Zhang et al. [65] describe, the filling of the bedding materials has a minor effect on the resulting insulation of the bedding system. Still, it highly depends on the weight per unit area of the bedding system. Thus, even a study on Chinese bedding systems can be considered for Western Europe if the weight of the bedding system is chosen appropriately. Zhang et al. [65] measured bedding system insulation between 1.53 and 4.89   clo depending on the percentage of body coverage and system. As we aim for a surrounding insulation factor that we can add to the clothing insulation, we estimate an additional surrounding insulation factor of 2.0   clo . This surrounding insulation factor for bedding already incorporates a reduction of the combined clothing and surrounding insulation value (clothing and surrounding insulation factor follow the principles of superposition, such that for the general template value, we decided to keep the clothing value fixed, while we reduce the surrounding insulation value). We keep in mind that this surrounding insulation factor highly depends on the bedding system weight (that may be changed due to weather conditions), body coverage, and even sleeping posture. A more detailed statistical study on average sleeping parameters should be considered in further research. For PMV calculations in ISO 7730, the maximum clo value is limited to 2.0   clo , which the proposed combinations of clothing and additional insulation may exceed. Thus, the applicability of the ISO 7730 needs to be further tested.
As the effect of surrounding insulation is rather small (e.g., for wooden stools), these parameters can be considered optional and used for the fine-tuning of models (e.g., in classroom or meeting room settings, where all people are expected to be seated on a chair). We expect the additional insulation of the bedding systems to be crucial for thermal comfort, while office chairs are negligible. However, the impact of clothing and surrounding insulation factors on the general thermal comfort within the room should be elaborated in more detailed case studies.

2.4. Definition of Weather Data

For evaluating the impact of climate change by using our proposed IFC-based thermal comfort analysis, we use TMYx weather (2007–2021) for Cologne Bonn, as this matches with the German construction setup from TEASER templates. On this weather data, we applied the open-source morphing tool Future Weather Generator [56] to generate future weather predictions for 2050 (i.e., median months from 2036 to 2065) and 2080 (i.e., median months from 2066 to 2095) [56] based on the up-to-date CMIP6 Global Climate Model EC-Earth3 [66]. For simplicity, the years of the future weather scenarios are denoted in the following as 2050 and 2080. For further evaluation of the proposed methods, we choose the IPCC Scenario SSP5-8.5, following the recommendation of Zeng et al. [54] to use extreme weather data for analysis of thermal resilience. We choose the worst-case scenario to underline the potential of thermal comfort analysis during design stage, keeping in mind that all weather data only represent predictions of future scenarios. By using the morphing tool by Rodrigues et al. [56], we address the criticism that much research still relies on the outdated climate model CMIP3 [55]. However, for a detailed analysis of climate change’s impact on thermal comfort, CMIP6-weather data should be used with specific predictions that match the actual design purpose (e.g., extreme weather summer periods for determination of overheating risks), which has not been taken into account within our proposed demonstration case.
Figure 3 displays the outdoor temperature for the selected weather scenarios per month. The monthly median temperatures in the SSP5-8.5 scenarios are for 2050 up to 4.37 C higher than the TMYx baseline and 6.4 C higher for the corresponding 2080 weather data. Since the weather data was transformed to the future weather scenario using morphing, the general characteristics (e.g., amount of outliers per month) are approximately similar to the baseline weather. As already criticized by Zeng et al. [54], the variability of current weather data is preserved through the morphing methodology, such that changes in the variability (or even developed phenomena like heat islands) are not represented in the morphed data.
Our proposed study focuses on climate trends morphed for local weather conditions. The analysis of urban microclimate, heat islands, and hazards is part of further research and can easily be built upon our proposed IFC-based thermal comfort framework.
To evaluate the use of the IFC-based thermal comfort, we use the SSP5-8.5 weather data for 2080 to further analyze the results. As we do not have specific hot summer design weather data available for the latest IPCC scenario, the 2080 data are the most extreme data that are available for our current comfort analysis.

3. Results

The simulation models are generated using the proposed template-based thermal comfort data and the IFC-based bim2sim workflow with the proposed PluginComfort for BPS-based thermal comfort analysis. The evaluation in Section 3.2 and Section 3.3 analyzes the impact of the future weather scenarios on thermal comfort with and without cooling, compared to the current weather. As the present study addresses IFC-based evaluations of climate change impact on buildings using a case study in Germany, the results focus on the evaluation of summer comfort, since the climate change increases the observed temperatures throughout the year (cf. Figure 3).

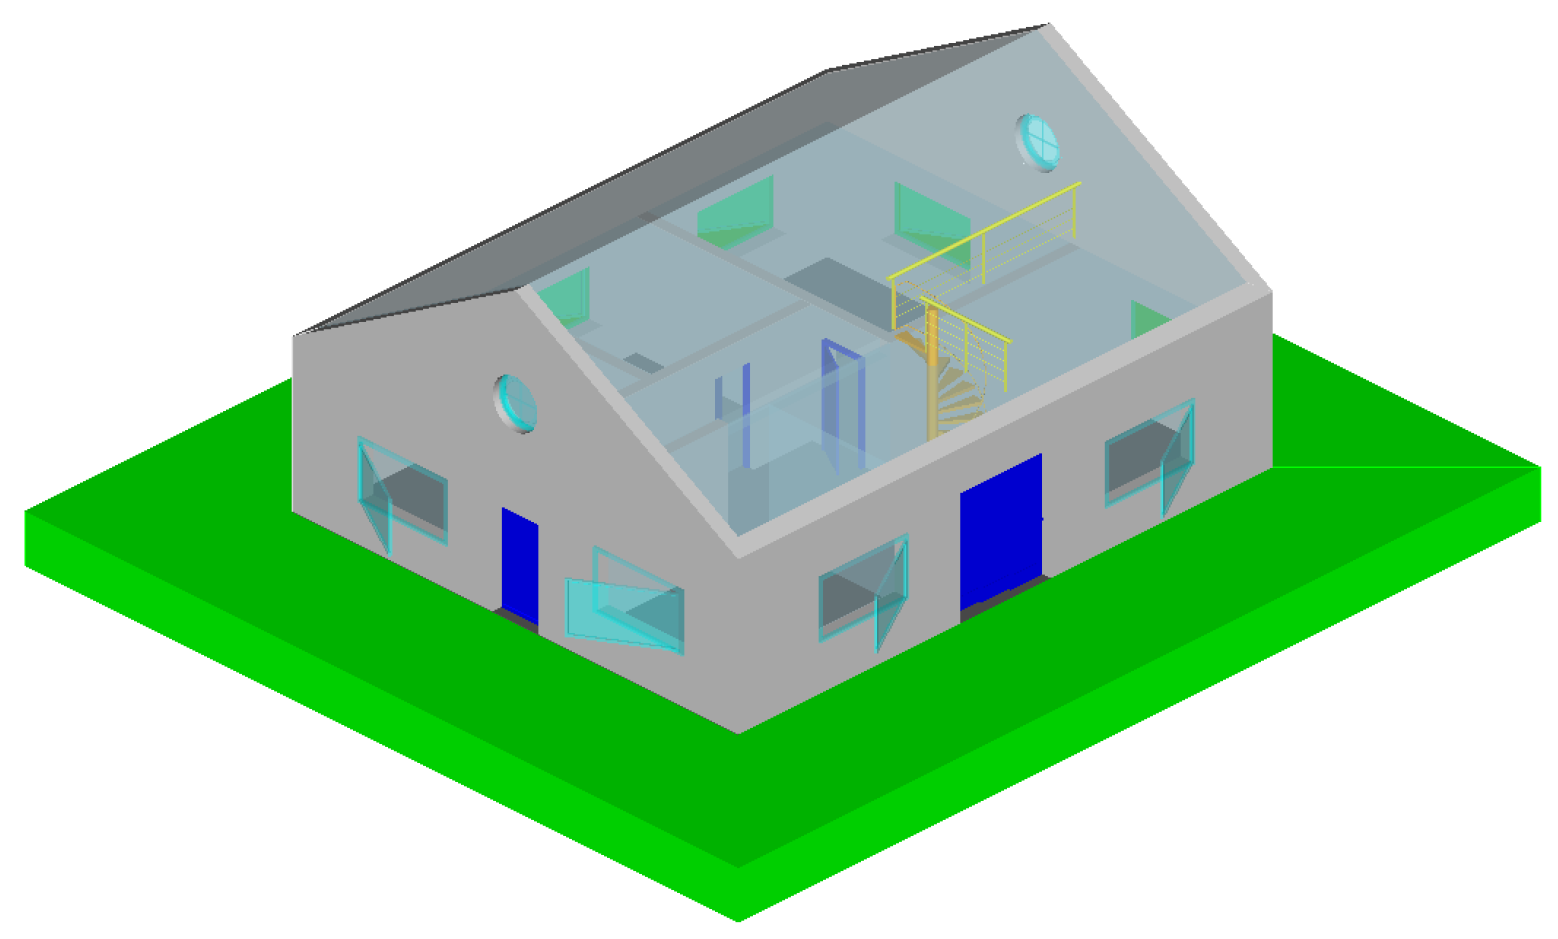
3.1. Use Case: FZK-Haus

The use case building for demonstrating the proposed IFC-based thermal comfort setup is the KIT FZK-Haus (FZK-Haus (IFC4), provided by Institute for Automation and Applied Informatics (IAI) / Karlsruhe Institute of Technology (KIT): https://www.ifcwiki.org/index.php?title=KIT_IFC_Examples, accessed on 12 November 2023) (total floor area: 208.55   m 2 ) displayed in Figure 4. The simulation setup is based on the structure of the archetypal templates used for TEASER [46], which are also used in bim2sim. For the choice of materials and constructions, the construction type is selected as heavy, and the materials and constructions are set for a building construction year between 1995 and 2015. The thermal zone usage templates are modified to match the use case of a residential house and further extended by the derived templates for activity and clothing (cf. Table 2 and Table 3). The set points for heating and cooling (cf. Table 4) are derived from SIA 2024 [49] and do not include a night setback. Spaces that do not have cooling requirements according to SIA 2024 [49] are defined to have a maximum indoor temperature of 32 C . The simulation setup uses ideal loads to meet the desired set points for heating and cooling in Section 3.2, and heating without cooling in Section 3.3.
The occupancy schedules are derived and adapted from Mitra et al. [67] and displayed in Figure A1. Schedules and loads for lighting and technical equipment are adapted from Remmen et al. [46] and SIA 2024 [49]. Natural ventilation set points are adapted from Remmen et al. [46] and DIN V 18599-10 [47].

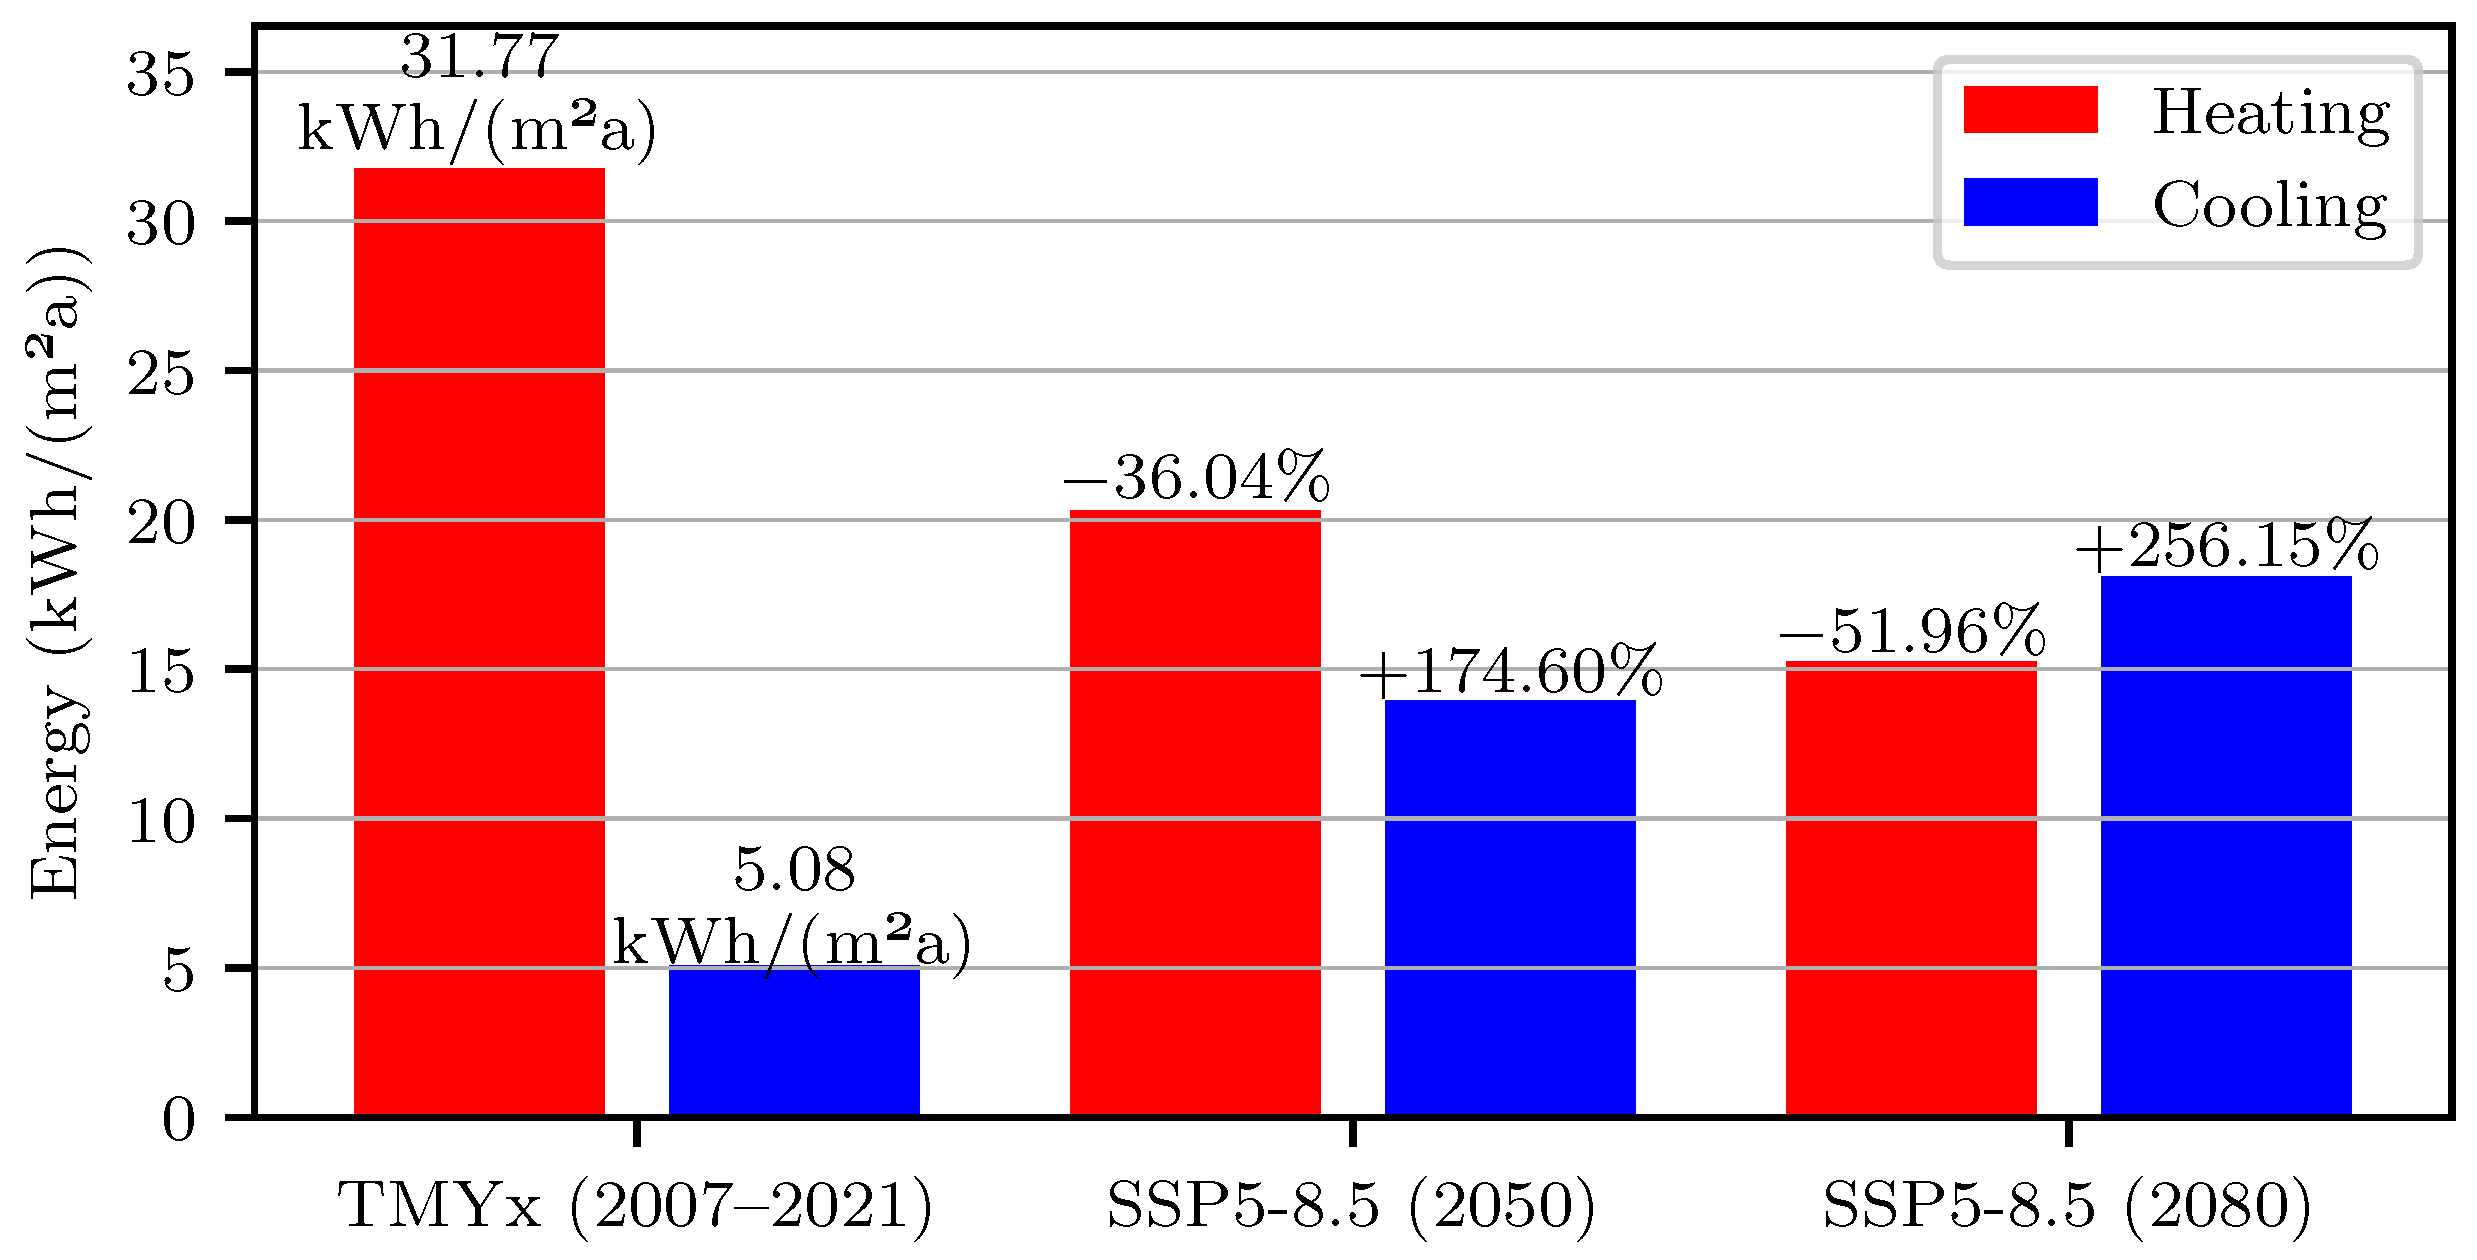
3.2. Template-Based Thermal Comfort with Cooling

To get insights into the impact of future weather scenarios for heating and cooling loads, the use case is first simulated with enabled heating and cooling set points. Figure 5 displays heating and cooling loads for the weather scenarios, showing a major decrease of the heating loads ( 36.04 % for 2050 and 51.96 % for 2080). The observed cooling loads drastically increase by 174.60 % for 2050 and 256.15 % for 2080. These calculated energy loads for heating and cooling align with the observations from related research [19,68] for future climate scenarios for the years 2050–2100.
The analysis of the heating and cooling loads shows that in future climate scenarios, significantly higher energy demands occur to meet the cooling set points and likewise the thermal comfort requirements. For an overview on the impact of climate change on thermal comfort under the previously defined conditions, Figure 6 and Figure 7 display the daily mean PMV values per thermal zone (solid lines) and the daily mean outdoor temperature (dashed line) for the summer months between April and October.
For TMYx (2007–2021), the daily mean PMV ranges from 1.21 (Living_2) in December to 1.73 (Bedroom) in July. For SSP5-8.5 (2080), the daily mean PMV ranges from 1.04 (Living_2) in January to 2.06 (Traffic area) in August. The characteristics of the PMV reflect the set points and weather data that have been used for simulation. The cooling set points are reflected in the PMV data, where the PMV reaches a “plateau” in summer (e.g., for the Single office) since the choice of cooling set points indirectly limits the level of PMV. The weather data are reflected in the PMV, where the outdoor temperature has a qualitatively high similarity with the PMV, which is true for the PMV in Figure 6 for the TMYx weather data, but only in April, May, and October for the SSP-5-8.5 weather data in Figure 7. We can observe a stronger correlation between outdoor temperature and PMV for the TMYx data here since the cooling set points are only reached for a smaller period in summer than for the SSP5-8.5 weather scenario.
For TMYx (2007–2021) data, the low PMV during winter is caused by larger differences between zone mean air temperature (used for set point control) and the actual operative air temperature that has been used to calculate the PMV (i.e., even with a set point of 21 C , the actual operative temperature was below 20 C , causing occupants to feel cold). For the SSP5-8.5 (2080) scenario, the least comfortable status can be seen in the thermal zones without cooling (e.g., traffic area). For the analysis of the proposed clothing and activity parameters, a larger range of set points and building types needs to be tested, ideally supported by measured data and validation.
In Germany, most of the building stock (residential but also a large amount of public office buildings and schools) rely on natural ventilation and do not have cooling devices. Thus, as for fully conditioned buildings, thermal comfort can be accomplished by spending more energy (or by choosing a resilient building design during the design stage, which also could be supported by our proposed methods); we perform a more detailed analysis of our approach without cooling.

3.3. Template-Based Thermal Comfort Analysis without Cooling

For the use case without cooling, we added natural ventilation, which generally increases the heating load of the building through more added outdoor air. The heating loads for this use case are displayed in Figure 8. Here, since with increasing temperature natural ventilation increases the heat loss through the windows, the decrease of heating demand is lower compared to the previous use case with cooling, reducing the heating energy by 27.51 % until 2050 and by 36.65 % until 2080.
As this use case without mechanical cooling allows a more in-depth analysis of the impact of climate change on thermal comfort, further results are visualized for different levels of granularity. Starting in Section 3.3.1 with an annual comparison of the mean PMV values and hours within individual PMV ranges, calendar plots highlight the changes in the daily mean PMV values, while in Section 3.3.2 further diagrams give insights into the adaptive thermal comfort per room.

3.3.1. Analysis of Fanger’s PMV

Figure 9 displays an overview of the annual PMVs in the individual thermal zones. This mean annual PMV value does not take into account seasonal differences in the PMV but still outlines that for the given weather data of TMYx and SSP5-8.5 (2080), the annual PMV increases combined over all thermal zones about 0.44 (mean PMV over all thermal zones).
Figure 10 displays the changes between the two climate scenarios per thermal zone. Here, the number of hours per thermal zone within a specific PMV range is displayed for TMYx (2007–2021) in Figure 10a, for SSP5-8.5 (2080) in Figure 10c, and the changes between these scenarios in Figure 10b. The results in Figure 10b highlight that the number of hours that are rather cold (PMV smaller 0) drastically shifts to warmer predicted temperature perceptions, resulting in more than 700   hours with a PMV larger than 2 in the kitchen. In the SSP5-8.5 scenario for 2080, all zones show PMVs larger than 2, while none of the thermal zones have shown so much discomfort for the baseline scenario.
To gain more insights on the actual changes of the daily PMV variations through the year, the changes in the PMV data are visualized in Figure 11 and Figure 12 for the exemplary thermal zones Living and Kitchen using calendar plots highlighting the 24 h mean PMV values per thermal zone. These calendar plots give a quick impression on the seasonal changes in the thermal comfort, highlighting seasonal shifts between the years TMYx (2007–2021) and SSP5-8.5 (2080).
For the thermal zone Living in Figure 11 with TMYx (2007–2021) weather data, the PMV ranges between −2 and +2 for the whole year, showing several longer periods of PMV below −1 within the months of November through March, mixed with periods of PMV between −1 and 0. This highlights that the heating set points for this thermal zone may not be sufficiently set to meet the comfort requirements or that the proposed clothing or activity values are too low for the winter months. Comparing the daily mean PMV values for the years of TMYx (2007–2021) and SSP5-8.5 (2080), the number of PMV below −1 drastically reduced in the winter months, while the summer months (especially July and August) for SSP5-8.5 (2080) show a longer period of days with a PMV greater 1, and 10 days with a PMV between 2 and 3 and, thus, high discomfort for the occupants.
For the thermal zone Kitchen in Figure 12, the PMV index in scenario TMYx (2007–2021) ranges between 0 and 1 (September through March) and a mix between 0 and 2 (April through August). With the 2080 weather data, the PMV between 1 and 2 is no longer mixed with PMV below 1 from May through September, but from June to August, 29 days with a higher PMV than 2 occur, resulting in longer periods of high discomfort.
The heating loads in the kitchen are generally higher than in the other rooms. Additional mechanical ventilation may help reduce the heating loads during kitchen use to prevent overheating. However, due to the predicted climatic changes, a residential kitchen with natural ventilation may just not be able any longer to reach a thermally comfortable status throughout the year.
These calendar plots reflect the daily mean PMV index, including the observed cool-down during the night. The actual maximum heat loads can be higher than the presented values of the calendar plots. Calendar plots for the other thermal zones are placed in Appendix A.4 in Figure A2, Figure A3, Figure A4, Figure A5 and Figure A6.

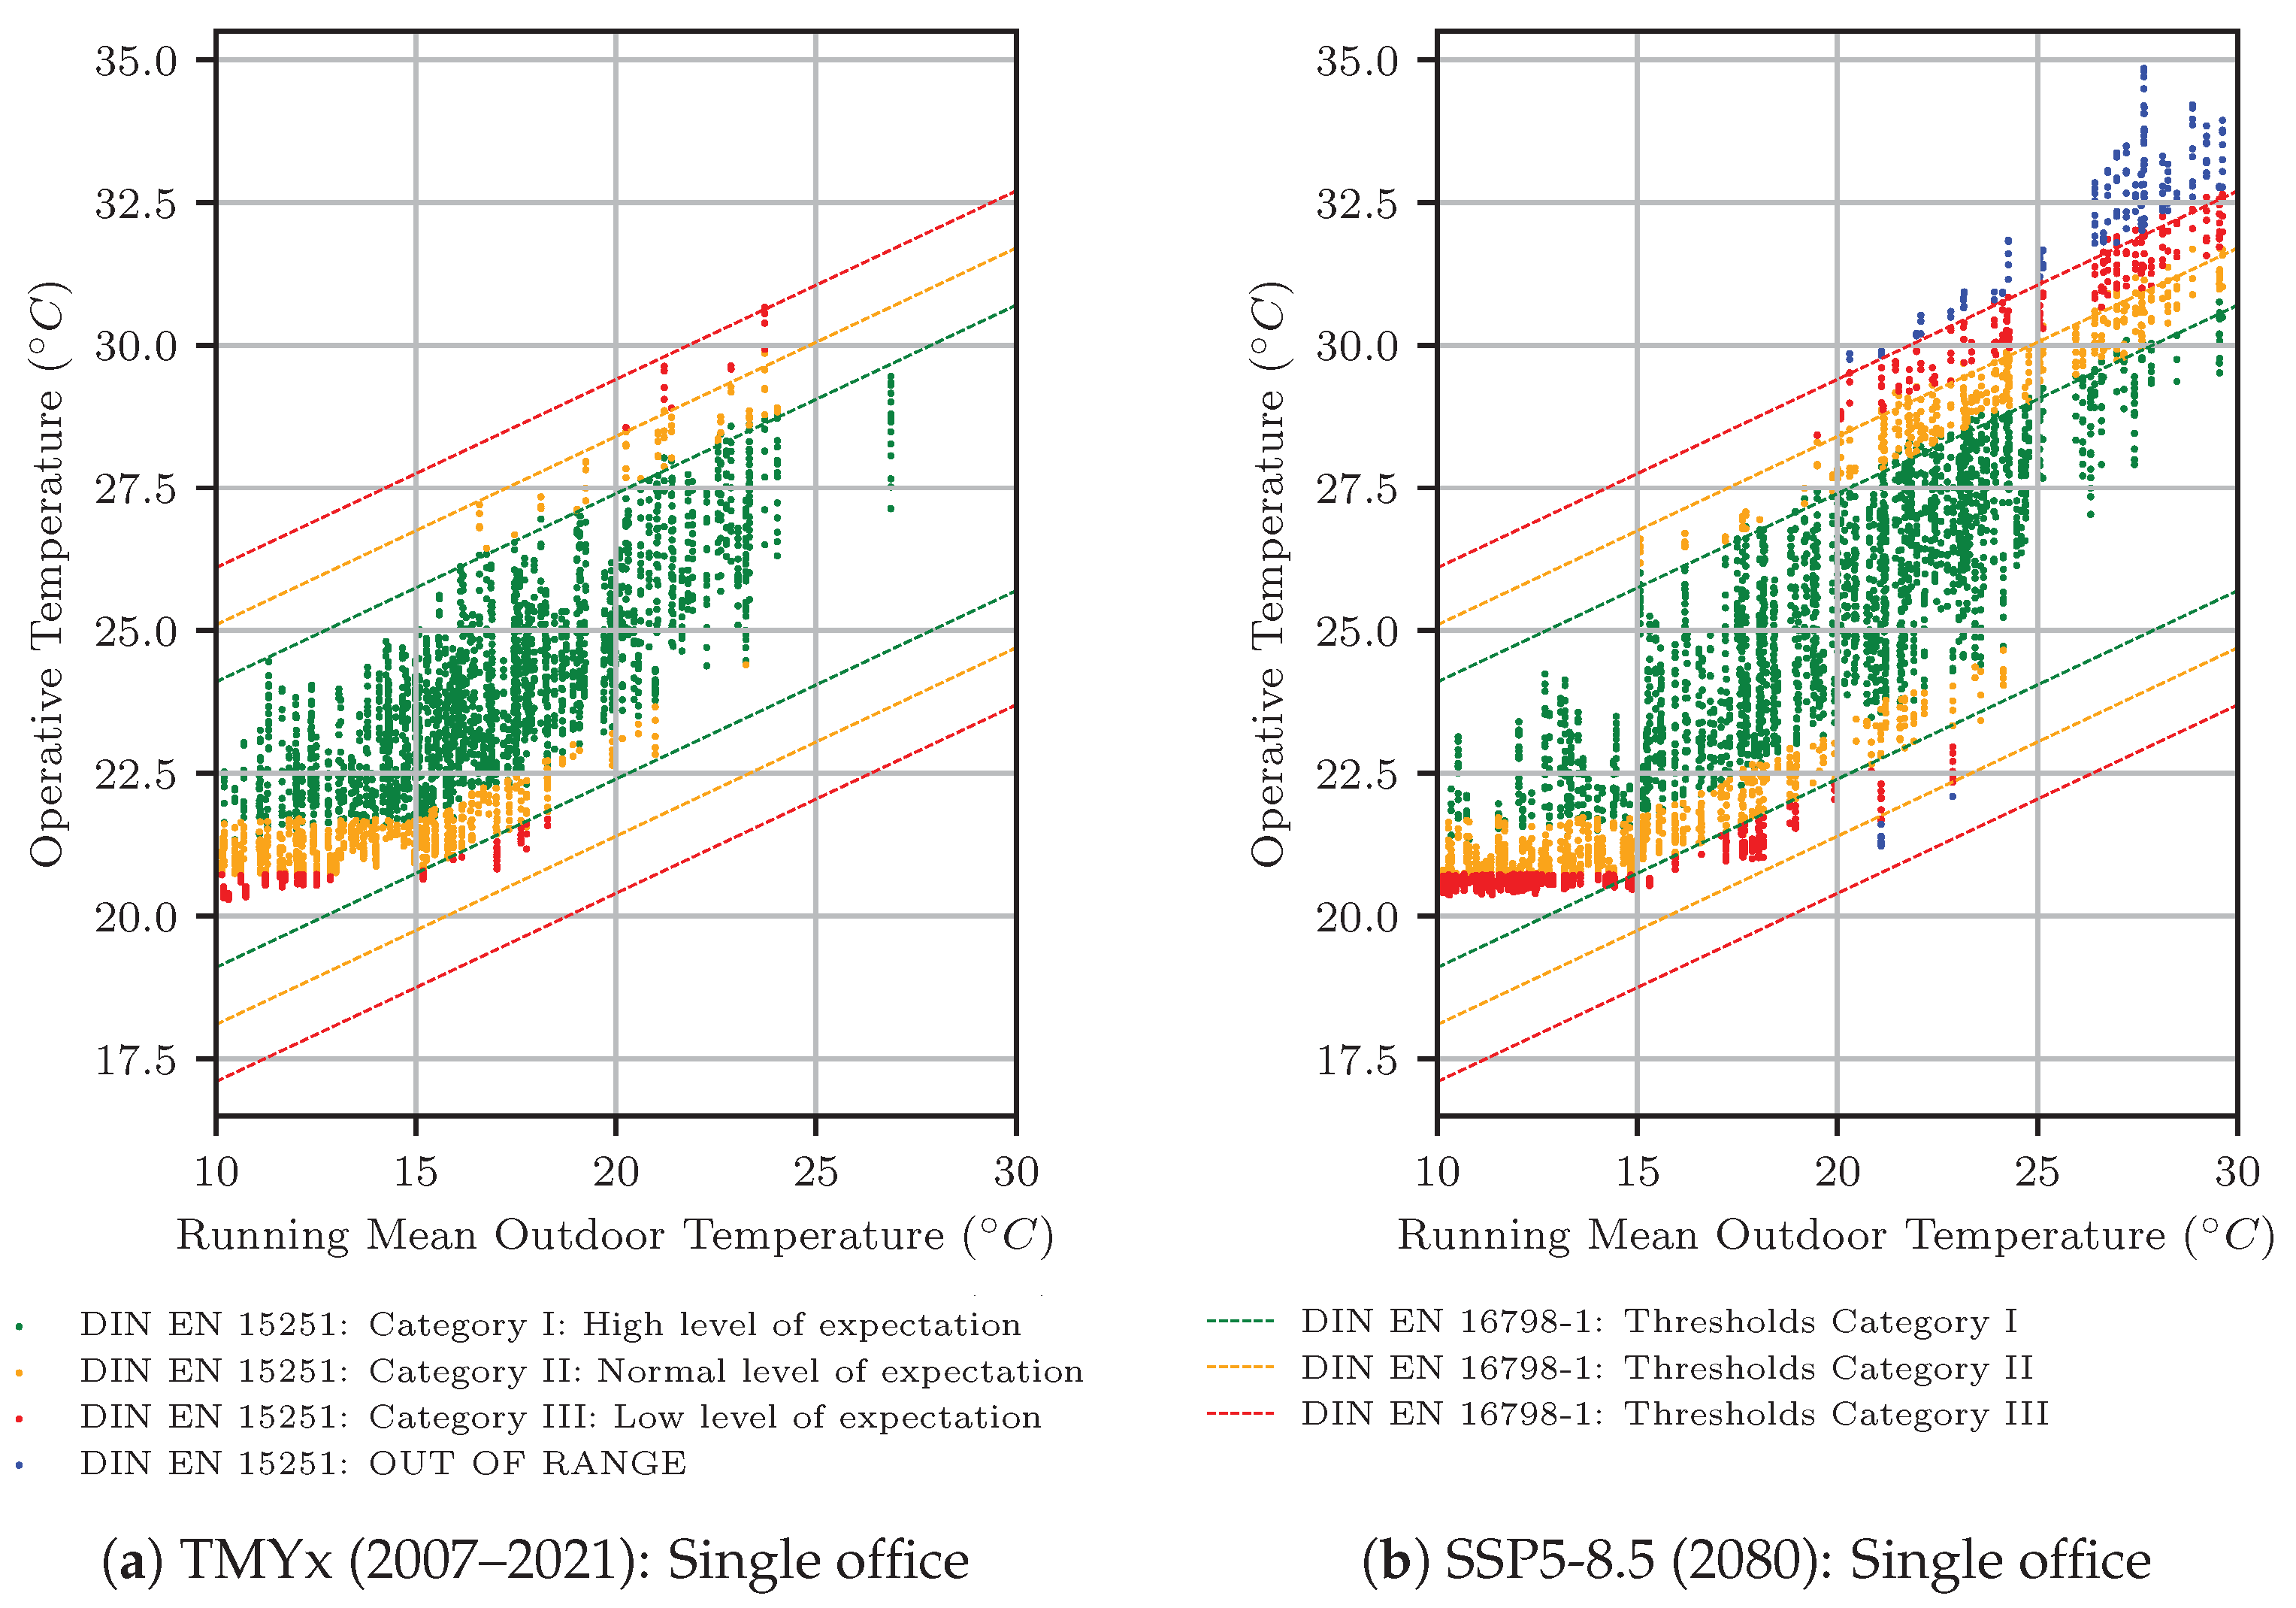
3.3.2. Analysis of Adaptive Comfort

With increasing indoor temperatures due to the lack of cooling, adaptive comfort measures may better represent the actual thermal sensation of occupants. For the evaluation of adaptive thermal comfort we apply the adaptive comfort metrics according to DIN EN 15251 [59] (withdrawn) and DIN EN 16798-1 [60]. As mentioned in Section 2.1, DIN EN 15251 is implemented and available in EnergyPlus, but DIN EN 16798-1 is not. Thus, we combine their results to highlight the differences between these two standards. For the analysis of the acceptable operative temperature, the main difference for DIN EN 16798-1 is that the acceptable lower bound of the operative temperature per category is decreased by 1 C compared to DIN EN 15251. The upper boundaries are not changed. Both standards include three categories regarding the level of expectation towards thermal comfort within the room, ranging from Category I (high level of expectation) to Category III (low level of expectation).
In Figure 13, the operative indoor temperature (vertical axis) is plotted over the running mean outdoor temperature (horizontal axis) within the outdoor temperature range of 10 C to 30 C for thermal zone “Living”. Each scattered point in the diagram is colored according to its category in DIN EN 15251. The dashed lines visualize the upper and lower thresholds of the DIN EN 16798-1 categories. For the baseline weather, the operative temperatures are in the lower categories of DIN EN 15251, while with the reduced thresholds in DIN EN 16798-1, the operative temperatures mostly vary within the ranges of Category I and II. For this baseline weather scenario, only a very limited amount of time crosses the upper band of Category I. The range of the mean outdoor temperature is mostly below 24 C . For The SSP5-8.5 (2080) scenario in the right plot, operative indoor temperatures are widely spread over the mean outdoor temperature range, and the upper thresholds of the Categories are often crossed; some operative temperatures are even beyond the upper threshold of Category III.
Figure 14 displays the adaptive comfort according to DIN EN 15251 and DIN EN 16798-1 for the kitchen zone. Compared to Figure 13, the indoor operative temperatures are higher in general, which is due to the high internal loads of kitchen equipment. For the weather data of TMYx (2007–2021), the operative temperatures are balanced between the thresholds of the categories of DIN EN 16798-1, while for the SSP5-8.5 scenario, again, even the upper band of Category III is exceeded multiple times. As described for Figure 12, natural cooling is not sufficient in this scenario to even keep a low standard of thermal comfort.
For adaptive comfort diagrams for “Living_2” (Figure A7), “Bedroom” (Figure A8), and “Single office” (Figure A9) see the appendix. The thermal zones of the bathroom and traffic area do not show enough occupancy according to the standards to be applicable to the adaptive comfort analysis.
We additionally evaluate the percentage of time within the individual thermal comfort categories for each thermal zone (Figure 15). All percentages of the TMYx (2007–2021) data refer on the total number of 4728   hours within the applicable range of the DIN EN 16798-1 (running outdoor temperature between 10 C and 30 C ) and 6744   hours for the SSP5-8.5 (2080) scenario, neglecting the actual occupancy time for this evaluation.
The evaluation shows that for the base scenario, we have most of the time inside Categories I and II (in Category III: only 1 % for the kitchen and 2 % for traffic area), while we have in the SSP5-8.5 scenario between 0– 10 % in Category III and even between 0– 4 % worse than Category III. While the conditions of the TMYx (2007–2021) scenario need a further evaluation of the actual occupancy hours to determine if they are still within the acceptable thermal comfort range (max. 1 % of the occupancy time worse than Category II according to DIN EN 16798-1 [60]), the SSP5-8.5 scenario is far out of range.

4. Discussion and Limitations

The present study proposes an extension to the IFC-based bim2sim framework to facilitate thermal comfort analysis. The study also introduces an extension to a simplified data set (i.e., TEASER [46]) used to provide the thermal comfort parameters, which are unavailable in the IFC standard. This extended data set is proposed in a manner similar to the original template and builds upon the existing dataset used in bim2sim. This simplified set of thermal comfort parameters has certain limitations that users should consider.
First, the template values provide only an estimate of the number of occupants in each thermal zone. We derived the clothing and activity parameters on the basis of assumed zone usage and with the support of existing standards. To better understand the parameters, we listed the decisions and fundamentals of each individual parameter. This listing enables further users of the templates to determine if the individual parameters are applicable to their case or if they require modification.
The proposed parameters do not account for seasonal variations (or even current outdoor weather conditions also depending on day-/nighttime) regarding clothing, as this reflection would unnecessarily complicate the parameter set. For certain types of zones, such as offices and meeting rooms, seasonal clothing changes may not even be applicable. Further research should test either various sets of clothing parameters, including summer and winter attire, or a range of clothing parameters for each zone on the basis of outdoor temperature. The latter would adapt the dynamic clothing described in ASHRAE 55, but also consider minimum and maximum clothing requirements for specific zone types.
We disregarded regional and cultural differences in clothing in the proposed templates. Since, even within the same culture, clothing standards in offices vary across businesses, the template values need to be adjusted to fit individual circumstances. Furthermore, the template considers only standardized body shapes and activity levels, represented by a body surface area of 1.8   m 2 . Gender specifications are not included, nor are individuals who are shorter, taller, underweight, or overweight. To ensure the thermal comfort for underrepresented groups, noise should be introduced to clothing and activity parameters, allowing for the computation of thermal comfort to be repeated and evaluated for a wider range of occupant parameters. Since only standardized clothing has so far been evaluated, no skirts or dresses are included in the proposed clothing template.
We presented a simplified set of parameters for the surrounding insulation. For the sake of simplicity, we suggest adding this value to the occupant’s clothing parameter, even though they may not physically add up to the total clo value. Further evaluation is necessary. Additionally, the ISO 7730 PMV only accounts for clothing up to 2 clo, but our mixed furniture approach may result in higher clothing values. To remain within the range of ISO 7730 applicability, we have to limit the PMV to 2 clo, select an alternative comfort index, or expand and validate the ISO 7730 PMV approach for clo values exceeding 2. Similarly to the classic Fanger model, which omits occupant adaptive measures including clothing changes, we also disregard such variability. As predicting individual variations in clothing can be difficult, we suggest adding a clo value increment during colder seasons to account for additional clothing layers worn, and a decrement during warmer seasons to account for reduced clothing. While this approach is crude, it can limit clothing adaptability and assist in incorporating variability driven by human behavior into the simulation.
As stated by Mahecha Zambrano et al. [16], occupants decide to adjust clothing or change the room’s set point temperature. Furthermore, they state that developing generalized models for occupant behavior is not possible due to the diversity of occupants. However, the use of standardized occupancy schedules is crucial for computationally efficient decision-making in the early design stages. The approach to generate a set of schedules along with a probability of the occurrence of these scenarios [16] could assist to further improve the accuracy of our proposed IFC-based thermal comfort analysis.
For the evaluation of the results, we modified, as described, more parameters than just the proposed clothing and activity parameters compared to the original TEASER templates [46] to meet the requirements of our residential building. Some parts of the TEASER templates originate from the DIN V 18599-10 [47], which has been designed for energetic validation and rating of buildings and, thus, may not be fully applicable for engineering tasks within the design stage of buildings. For a further use of our proposed thermal comfort parameters as addition to the TEASER template set, the full set of templates should also be tested for consistency. As an example: in the TEASER templates, the bedroom has full occupancy 24/7 while a hotel room is only occupied during the night.
Taking a closer look at the thermal comfort analysis itself, it has to be noted that BPS using EnergyPlus only calculates a single-node-per-zone PMV measure, neglecting any kind of furniture or people position within the room. The BPS engineer should be aware of the BPS limitations and also of the inaccuracies due to the choice of parameters. For a detailed thermal comfort analysis, the user must apply a much more detailed CFD analysis, which could be focused on building parts that show a high dissatisfaction with thermal comfort discovered in the BPS analysis.
When we take a closer look at the impact of the weather data, the presented results and examples only show the potential of our IFC-based approach. This study does not evaluate or compare actual design alternatives but focuses on proposing the IFC-based thermal comfort approach itself. Other weather files representing other climate change scenarios will lead to different results. However, our approach can be easily repeated using different weather files representing a variety of climate change scenarios. Design alternatives can be evaluated using our IFC-based approach without manual remodeling. However, our simulation results (heating and cooling loads) match the observations from related research [19,68], even though the results can only be qualitatively compared as the building geometry, construction, location, and weather data vary from the cases from related literature. The development of benchmark cases could help to evaluate the accuracy of our proposed methods.
A more general limitation of our proposed methods is that the selected timeframe for weather prediction should be chosen according to the predicted use of the analyzed buildings. The timespan of climate prediction from our use case is only used to highlight the potential of our proposed methods. However, until we reach the SSP5-8.5 (2080) scenario, the building can be refurbished multiple times (HVAC, insulation), or even demolished, or the usage has changed (used as an office of a smaller company vs. used as a holiday apartment), such that the comfort predictions and energy savings do not apply anymore. The construction weight and the resulting resilience of the building due to thermal mass in comparison to the embodied carbon can still be evaluated with our methods even for such large timespans of sixty years, but the occupancy schedules and internal loads can hardly be predicted.
However, as long as the user is aware of the input data limitations when interpreting the thermal comfort results, the reduced model setup time due to enriched IFC data is still highly beneficial to the decision-making within the design process.

5. Conclusions

The IFC-based BPS approach has the capability to reduce the effort for setting up models of design variants for energy and thermal comfort analysis of buildings. The template-based approach assists in rapidly filling in missing thermal comfort parameters. However, the application engineers should be aware of the simplifications that come with the template-based enrichment and should validate the model and its results for plausibility. With the use of our proposed IFC-based thermal comfort analysis plugin for the bim2sim tool, buildings providing IFC data in the design phase can quickly be evaluated for their robustness towards climate change. In this way, design variants can be tested for their resilience regarding different climate change scenarios.

Author Contributions

Conceptualization, V.E.R. and J.F.; methodology, V.E.R. and M.S.; software, V.E.R.; validation, V.E.R.; formal analysis, V.E.R.; investigation, V.E.R.; resources, V.E.R.; data curation, V.E.R.; writing—original draft preparation, V.E.R. and M.S.; writing—review and editing, V.E.R., M.S. and J.F.; visualization, V.E.R.; supervision, J.F. and C.v.T.; project administration, V.E.R.; funding acquisition, V.E.R., J.F. and C.v.T. All authors have read and agreed to the published version of the manuscript.

Funding

This research was funded by the Federal Ministry for Economic Affairs and Climate Action within the project “BIM2Praxis” (grant number 3EN1050A).

Institutional Review Board Statement

Not applicable.

Informed Consent Statement

Not applicable.

Data Availability Statement

The source code of the bim2sim tool is available on github: https://github.com/BIM2SIM/bim2sim, accessed on 12 November 2023.

Conflicts of Interest

The authors declare no conflict of interest. The funders had no role in the design of the study; in the collection, analyses, or interpretation of data; in the writing of the manuscript; or in the decision to publish the results.

Abbreviations

The following abbreviations are used in this manuscript:
BPSBuilding Performance Simulation
BIMBuilding Information Modeling
CFDComputational Fluid Dynamics
CMIPCoupled Model Intercomparison Project
IFCIndustry Foundation Classes
IPCCIntergovernmental Panel on Climate Change
IQRInterquartile Range
LCALife Cycle Assessment
MLMachine Learning
PMVPredicted Mean Vote
PPDPredicted Percentage Dissatisfied

Appendix A. Thermal Comfort Templates

Appendix A.1. Activity Parameters

Table A1. Deriving activity parameters for archetypal enrichment of thermal zones based on ASHRAE Fundamentals and ISO 7730, including a comparison to existing TEASER template values. Columns: (1) Room type according to TEASER templates, (2) Activity degree from TEASER templates ( met ), (3) Heat flow from TEASER templates ( W / person ), (4) Chosen activity type according to ASHRAE Fundamentals, Chapter 9 Table 4, (5) Chosen activity type according to ISO 7730, Tables A.5 and B.1, (6) ASHRAE activity degree ( met ), (7) ISO 7730 activity degree ( met ), (8) Resulting combined activity degree ( met ), (9) Absolute deviation from TEASER activity degree ( met ), (10) Resulting heat flow ( W / person ), (11) Absolute deviation from TEASER heat flow ( W / person ).
(1) Room Type(2)(3)(4) ASHRAE Fundamentals(5) ISO 7730(6)(7)(8) Activity Degree (met)(9)(10) Heat flow (W/person)(11)
Single office1.270Office, TypingA.5, Single office1.11.21.20.012555
Group Office (between 2 and 6 employees)1.270Office, TypingA.5, Landscape office1.11.21.20.012555
Open-plan Office (7 or more employees)1.270Office, TypingA.5, Landscape office1.11.21.20.012555
Meeting, Conference, seminar1.270Office, TypingA.5, Conference Room1.11.21.20.012555
Main Hall, Reception1.270Office WalkingB.1, Standing, light activity1.71.61.70.5178108
Retail, department store1.270Office, Filing, StandingA.5, Department store1.41.61.50.315787
Retail with cooling1.270Office, Filing, StandingA.5, Department store1.41.61.50.315787
Class room (school), group room (kindergarden)1.270Office, WritingA.5, Kindergarten11.41.20.012555
Lecture hall, auditorium1.270Office, TypingA.5, Auditorium1.11.21.20.012555
Bed room1.270Resting, SleepingB.1, Reclining0.70.80.80.48414
Hotel room1.270Resting, SleepingB.1, Reclining0.70.80.80.48414
Canteen1.270Office, Filing, SeatedA.5, Cafeteria/restaurant1.21.21.20.012555
Restaurant1.270Office, Filing, SeatedA.5, Cafeteria/restaurant1.21.21.20.012555
Kitchen in non-residential buildings1.270CookingB.1, Standing, medium activity1.821.90.7199129
Kitchen—preparations, storage290CookingB.1, Standing, medium activity1.821.90.1199109
WC and sanitary rooms in non-residential buildings1.270Resting, Seated, quietB.1, Seated, relaxed1110.210535
Further common rooms1.270Office, TypingB.1, Sedentary activity1.11.21.20.012555
Auxiliary areas (without common rooms)1.270Office WalkingA.5, Department store1.71.61.70.5178108
Traffic area1.270Office WalkingB.1, Walking, 2 km/h1.71.91.80.6188118
Stock, technical equipment, archives290Office, Filing, StandingB.1, Standing, light activity1.41.61.50.515767
Data center1.270Office, Filing, StandingB.1, Standing, light activity1.41.61.50.315787
Commercial and industrial Halls—heavy work, standing activity290Machine work, heavyB.1, Walking, 5 km/h43.43.71.7387297
Commercial and industrial Halls—medium work, standing activity1.680Machine work, light (electrical industry)B.1, Standing, medium activity2.222.10.5220140
Commercial and industrial Halls—light work, standing activity1.270Machine work, sawingB.1, Standing, light activity1.81.61.70.5178108
Spectator area (theater and event venues)1.270Resting, Seated, quietA.5, Auditorium11.21.10.111545
Foyer (theater and event venues)1.270Resting, Standing, relaxedB.1, Standing, light activity1.21.61.40.214676
Stage (theater and event venues)290Dancing, socialB.1, Walking, 3 km/h3.22.42.80.8293203
Exhibition, congress1.270Office, Filing, StandingA.5, Department store1.41.61.50.315787
Exhibition room and museum conservational demands1.270Resting, Standing, relaxedB.1, Standing, light activity1.21.61.40.214676
Library—reading room1.270Office, Reading, seatedB.1, Sedentary activity11.21.10.111545
Library—open stacks1.270Office, Filing, standingB.1, Standing, light activity1.41.61.50.315787
Library—magazine and depot1.270Office, Filing, standingB.1, Standing, light activity1.41.61.50.315787
Gym (without spectator area)3120Calisthenics/exerciseB.1, Walking, 5 km/h3.53.43.50.5366246
Parking garages (office and private usage)035Office WalkingB.1, Walking, 2 km/h1.71.91.81.8188153
Parking garages (public usage)035Office WalkingB.1, Walking, 2 km/h1.71.91.81.8188153
Sauna area1.270Resting, Seated, quietB.1, Seated, relaxed1110.210535
Exercise room3120Office, WritingA.5, Classroom1112.010515
Laboratory1.270Office, Filing, SeatedB.1, Sedentary activity1.21.21.20.012555
Examination- or treatment room1.270Office, Filing, standingB.1, Standing, light activity1.41.61.50.315787
Special care area1.270Office, Lifting/packingB.1, Standing, medium activity2.122.10.9220150
Corridors in the general care area1.270Office WalkingB.1, Walking, 2 km/h1.71.91.80.6188118
Medical and therapeutic practices1.270Office, Filing, SeatedB.1, Standing, light activity1.21.61.40.214676
Storehouse, logistics building290Office, Lifting/packingB.1, Standing, medium activity2.122.10.1220130
Living1.270Resting, Seated, quietB.1, Sedentary activity11.21.10.111545
Classroom170Office, WritingA.5, Classroom11.21.10.111545

Appendix A.2. Clothing Parameters

Table A2. Deriving clothing parameters for archetypal enrichment of thermal zones based on ASHRAE Fundamentals and ISO 7730. Columns: (1) Room type according to TEASER templates, (2) Chosen clothing type according to ASHRAE Fundamentals, Chapter 9 Table 7, (3) Chosen clothing type according to ISO 7730, (4) ASHRAE clothing (clo), (5) ISO 7730 clothing (clo), (6) Resulting combined clothing parameter (clo), (7) Chosen surrounding insulation type, (8) Surrounding insulation (clo).
(1) Room Type(2) ASHRAE Fundamentals(3) ISO 7730(4)(5)(6) Clothing Insulation (clo)(7) Surrounding Insulation Description(8) Surrounding Insulation (clo)
Single officeTrousers, long-sleeved shirtUnderwear, shirt, trousers, socks, shoes0.610.70.66ISO 7730, C.3 Executive chair0.15
Group Office (between 2 and 6 employees)Trousers, long-sleeved shirtUnderwear, shirt, trousers, socks, shoes0.610.70.66ISO 7730, C.3 Standard office chair0.1
Open-plan Office (7 or more employees)Trousers, long-sleeved shirtUnderwear, shirt, trousers, socks, shoes0.610.70.66ISO 7730, C.3 Standard office chair0.1
Meeting, Conference, seminarTrousers, long-sleeved shirt, suit jacketUnderwear, shirt, trousers, socks, shoes0.960.70.83ISO 7730, C.3 Wooden stool0.01
Main Hall, ReceptionTrousers, long-sleeved shirt, suit jacketUnderwear with short sleeves and legs, shirt, trousers, jacket, socks, shoes0.9610.98ISO 7730, C.3 Standard office chair0.1
Retail, department storeTrousers, long-sleeved shirt, long-sleeved sweater, T-shirtPanties, shirt, trousers, jacket, socks, shoes1.0111.01None
Retail with coolingTrousers, long-sleeved shirt, long-sleeved sweater, T-shirtPanties, shirt, trousers, jacket, socks, shoes1.0111.01None
Class room (school), group room (kindergarden)Trousers, long-sleeved shirtUnderwear, shirt, trousers, socks, shoes0.610.70.66ISO 7730, C.3 Wooden stool0.01
Lecture hall, auditoriumTrousers, long-sleeved shirtUnderwear, shirt, trousers, socks, shoes0.610.70.66ISO 7730, C.3 Wooden stool0.01
Bed roomWalking shorts, short-sleeved shirtPanties, T-shirt, shorts, light socks, sandals0.360.30.33Average based on Zhang et al. [65]2
Hotel roomWalking shorts, short-sleeved shirtPanties, T-shirt, shorts, light socks, sandals0.360.30.33Average based on Zhang et al. [65]2
CanteenTrousers, long-sleeved shirtUnderwear, shirt, trousers, socks, shoes0.610.70.66ISO 7730, C.3 Wooden stool0.01
RestaurantTrousers, long-sleeved shirtUnderwear, shirt, trousers, socks, shoes0.610.70.66ISO 7730, C.3 Wooden stool0.01
Kitchen in non-residential buildingsLong-sleeved overalls, T-ShirtUnderpants, shirt, trousers, smock, socks, shoes0.720.90.81None
Kitchen—preparations, storageLong-sleeved overalls, T-ShirtUnderpants, shirt, trousers, smock, socks, shoes0.720.90.81None
WC and sanitary rooms in non-residential buildingsTrousers, long-sleeved shirtUnderwear, shirt, trousers, socks, shoes0.610.70.66None
Further common roomsTrousers, long-sleeved shirtUnderwear, shirt, trousers, socks, shoes0.610.70.66ISO 7730, C.3 Wooden stool0.01
Auxiliary areas (without common rooms)Trousers, long-sleeved shirtUnderwear, shirt, trousers, socks, shoes0.610.70.66None
Traffic areaTrousers, long-sleeved shirtUnderwear, shirt, trousers, socks, shoes0.610.70.66None
Stock, technical equipment, archivesTrousers, long-sleeved shirtUnderwear, shirt, trousers, socks, shoes0.610.70.66None
Data centerTrousers, long-sleeved shirtUnderwear, shirt, trousers, socks, shoes0.610.70.66None
Commercial and industrial Halls—heavy work, standing activityTrousers, long-sleeved shirtUnderwear, shirt, trousers, socks, shoes0.570.70.64None
Commercial and industrial Halls—medium work, standing activityTrousers, long-sleeved shirtUnderwear, shirt, trousers, socks, shoes0.570.70.64None
Commercial and industrial Halls—light work, standing activityTrousers, long-sleeved shirtUnderwear, shirt, trousers, socks, shoes0.570.70.64None
Spectator area (theater and event venues)Trousers, long-sleeved shirt, suit jacketUnderwear, shirt, trousers, socks, shoes0.960.70.83ISO 7730, C.3 Wooden stool0.01
Foyer (theater and event venues)Trousers, long-sleeved shirt, suit jacketUnderwear, shirt, trousers, socks, shoes0.960.70.83None
Stage (theater and event venues)Trousers, long-sleeved shirtUnderwear, shirt, trousers, socks, shoes0.610.70.66None
Exhibition, congressTrousers, long-sleeved shirt, suit jacketUnderwear, shirt, trousers, socks, shoes0.960.70.83None
Exhibition room and museum conservational demandsTrousers, long-sleeved shirt, suit jacketUnderwear, shirt, trousers, socks, shoes0.960.70.83None
Library—reading roomTrousers, long-sleeved shirtUnderwear, shirt, trousers, socks, shoes0.610.70.66ISO 7730, C.3 Wooden stool0.01
Library—open stacksTrousers, long-sleeved shirtUnderwear, shirt, trousers, socks, shoes0.610.70.66None
Library—magazine and depotTrousers, long-sleeved shirtUnderwear, shirt, trousers, socks, shoes0.610.70.66None
Gym (without spectator area)Walking shorts, short-sleeved shirtUnderpants, shirt with short sleeves, light trousers, light socks, shoes0.360.50.43None
Parking garages (office and private usage)Trousers, long-sleeved shirt, long-sleeved sweater, T-shirtPanties, shirt, trousers, jacket, socks, shoes1.0111.01None
Parking garages (public usage)Trousers, long-sleeved shirt, long-sleeved sweater, T-shirtPanties, shirt, trousers, jacket, socks, shoes1.0111.01None
Sauna areaNot applicableNot applicable000ISO 7730, C.3 Wooden stool0.01
Exercise roomTrousers, long-sleeved shirtUnderwear, shirt, trousers, socks, shoes0.610.70.66ISO 7730, C.3 Wooden stool0.01
LaboratoryLong-sleeved overalls, T-ShirtUnderpants, shirt, trousers, smock, socks, shoes0.720.90.81ISO 7730, C.3 Wooden stool0.01
Examination- or treatment roomLong-sleeved overalls, T-ShirtUnderpants, shirt, trousers, smock, socks, shoes0.720.90.81ISO 7730, C.3 Wooden stool0.01
Special care areaLong-sleeved overalls, T-ShirtUnderpants, shirt, trousers, smock, socks, shoes0.720.90.81Average based on Zhang et al. [65]2
Corridors in the general care areaLong-sleeved overalls, T-ShirtUnderpants, shirt, trousers, smock, socks, shoes0.720.90.81None
Medical and therapeutic practicesLong-sleeved overalls, T-ShirtUnderpants, shirt, trousers, smock, socks, shoes0.720.90.81ISO 7730, C.3 Wooden stool0.01
Storehouse, logistics buildingLong-sleeved overalls, T-ShirtUnderwear, shirt, trousers, socks, shoes0.720.70.71None
LivingTrousers, long-sleeved shirtUnderwear, shirt, trousers, socks, shoes0.610.70.66ISO 7730, C.3 Executive chair0.15
ClassroomTrousers, long-sleeved shirtUnderwear, shirt, trousers, socks, shoes0.610.70.66ISO 7730, C.3 Wooden stool0.01

Appendix A.3. Simulation Setup for Use Case 1: FZK-Haus

Figure A1. Occupancy profiles derived from Mitra et al. [67].
Applsci 13 12478 g0a1

Appendix A.4. Additional Simulation Results for Use Case 1: FZK-Haus

Figure A2. 24 h mean PMV values for thermal zone “Single office” for TMYx (2007–2021) and SSP5-8.5 (2080).
Applsci 13 12478 g0a2
Figure A3. 24 h mean PMV values for thermal zone “Traffic area” for TMYx (2007–2021) and SSP5-8.5 (2080).
Applsci 13 12478 g0a3
Figure A4. 24 h mean PMV values for thermal zone “Bedroom” for TMYx (2007–2021) and SSP5-8.5 (2080).
Applsci 13 12478 g0a4
Figure A5. 24 h mean PMV values for thermal zone “Bathroom” for TMYx (2007–2021) and SSP5-8.5 (2080).
Applsci 13 12478 g0a5
Figure A6. 24 h mean PMV values for thermal zone “Living 2” for TMYx (2007–2021) and SSP5-8.5 (2080).
Applsci 13 12478 g0a6
Figure A7. Adaptive comfort according to DIN EN 16798-1/DIN EN 15251 for zone “Living2”for TMYx (2007–2021) and SSP5-8.5 (2080).
Applsci 13 12478 g0a7
Figure A8. Adaptive comfort according to DIN EN 16798-1/DIN EN 15251 for zone “Bedroom” for TMYx (2007–2021) and SSP5-8.5 (2080).
Applsci 13 12478 g0a8
Figure A9. Adaptive comfort according to DIN EN 16798-1/DIN EN 15251 for zone “Single office” for TMYx (2007–2021) and SSP5-8.5 (2080).
Applsci 13 12478 g0a9

References

  1. Holmes, M.J.; Hacker, J.N. Climate change, thermal comfort and energy: Meeting the design challenges of the 21st century. Energy Build. 2007, 39, 802–814. [Google Scholar] [CrossRef]
  2. Bell, N.; Bilbao, J.; Kay, M.; Sproul, A. Future climate scenarios and their impact on heating, ventilation and air-conditioning system design and performance for commercial buildings for 2050. Renew. Sustain. Energy Rev. 2022, 162, 112363. [Google Scholar] [CrossRef]
  3. Klepeis, N.E.; Nelson, W.C.; Ott, W.R.; Robinson, J.P.; Tsang, A.M.; Switzer, P.; Behar, J.V.; Hern, S.C.; Engelmann, W.H. The National Human Activity Pattern Survey (NHAPS): A resource for assessing exposure to environmental pollutants. J. Expo. Sci. Environ. Epidemiol. 2001, 11, 231–252. [Google Scholar] [CrossRef] [PubMed]
  4. Krause, C.; Schulz, C. Aufenthaltszeiten der deutschen Bevölkerung im Innenraum, im Freien, im Straßenverkehr [German population’s time spent indoors, outdoors, in traffic]. Umweltmed. Forsch. Und Prax. 1998, 3, 249. [Google Scholar]
  5. Zomorodian, Z.S.; Tahsildoost, M.; Hafezi, M. Thermal comfort in educational buildings: A review article. Renew. Sustain. Energy Rev. 2016, 59, 895–906. [Google Scholar] [CrossRef]
  6. Antoniadou, P.; Papadopoulos, A.M. Occupants’ thermal comfort: State of the art and the prospects of personalized assessment in office buildings. Energy Build. 2017, 153, 136–149. [Google Scholar] [CrossRef]
  7. Andargie, M.S.; Touchie, M.; O’Brien, W. A review of factors affecting occupant comfort in multi-unit residential buildings. Build. Environ. 2019, 160, 106182. [Google Scholar] [CrossRef]
  8. ISO 16739; Industry Foundation Classes (IFC) for Data Sharing in the Construction and Facility Management Industries—Part 1: Data Schema. Technical Report 16739. International Organization for Standardization: Geneva, Switzerland, 2018.
  9. Jansen, D.; Mehrfeld, P.; Müller, D.; Fichter, E.; Richter, V.; Barz, A.; Brunkhorst, J.; Dahncke, M.; Jahangiri, P.; Warnecke, C.; et al. BIM2SIM—Development of semi-automated methods for the generation of simulation models using Building Information Modeling. In Proceedings of the Building Simulation 2021: 17th Conference of International Building Performance Simulation Association, Bruges, Belgium, 1–3 September 2021. [Google Scholar] [CrossRef]
  10. Müller, D.; Jansen, D.; van Treeck, C.; Fichter, E.; Richter, V.; Lüdemann, B.; Jahangiri, P.; Brunkhorst, J.; Dahnke, M.; Warnecke, C. BIM2SIM—Methodenentwicklung zur Erstellung von Simulationsmodellen aus Daten des Building Information Modeling: Gemeinsamer Endbericht: Berichtszeitraum: 1 May 2018–31 October 2021; RWTH Aachen University: Aachen, Germany, 2021. [Google Scholar] [CrossRef]
  11. Fanger, P.O. Thermal Comfort. Analysis and Applications in Environmental Engineering; Danish Technical Press: Copenhagen, Denmark, 1970. [Google Scholar]
  12. Barone, G.; Buonomano, A.; Forzano, C.; Palombo, A. Enhancing trains envelope–heating, ventilation, and air conditioning systems: A new dynamic simulation approach for energy, economic, environmental impact and thermal comfort analyses. Energy 2020, 204, 117833. [Google Scholar] [CrossRef]
  13. Limane, A.; Fellouah, H.; Galanis, N. Three-dimensional OpenFOAM simulation to evaluate the thermal comfort of occupants, indoor air quality and heat losses inside an indoor swimming pool. Energy Build. 2018, 167, 49–68. [Google Scholar] [CrossRef]
  14. Luo, M.; Guo, J.; Feng, X.; Chen, W. Studying occupant’s heat exposure and thermal comfort in the kitchen through full-scale experiments and CFD simulations. Indoor Built Environ. 2023, 32, 928–943. [Google Scholar] [CrossRef]
  15. Li, G.; Chi, L.; Guo, J.; Liu, C.; Luo, Y.; She, C. Numerical simulation on indoor thermal comfort of a new integrated rural heating system. Procedia Eng. 2015, 121, 1111–1117. [Google Scholar] [CrossRef]
  16. Mahecha Zambrano, J.; Filippi Oberegger, U.; Salvalai, G. Towards integrating occupant behaviour modelling in simulation-aided building design: Reasons, challenges and solutions. Energy Build. 2021, 253, 111498. [Google Scholar] [CrossRef]
  17. Gritzki, R.; Rösler, M. Komfort für Passivhaus-Büros- Planungsunterstützung mit Hilfe gekoppelter Gebäude-, Anlagen-und Strömungssimulation. Bauphysik 2013, 35, 8–15. [Google Scholar] [CrossRef]
  18. Barbosa, R.; Vicente, R.; Santos, R. Climate change and thermal comfort in Southern Europe housing: A case study from Lisbon. Build. Environ. 2015, 92, 440–451. [Google Scholar] [CrossRef]
  19. Escandón, R.; Suárez, R.; Sendra, J.J.; Ascione, F.; Bianco, N.; Mauro, G.M. Predicting the impact of climate change on thermal comfort in a building category: The Case of Linear-type Social Housing Stock in Southern Spain. Energies 2019, 12, 2238. [Google Scholar] [CrossRef]
  20. Yan, H.; Ji, G.; Yan, K. Data-driven prediction and optimization of residential building performance in Singapore considering the impact of climate change. Build. Environ. 2022, 226, 109735. [Google Scholar] [CrossRef]
  21. Siu, C.Y.; O’Brien, W.; Touchie, M.; Armstrong, M.; Laouadi, A.; Gaur, A.; Jandaghian, Z.; Macdonald, I. Evaluating thermal resilience of building designs using building performance simulation—A review of existing practices. Build. Environ. 2023, 234, 110124. [Google Scholar] [CrossRef]
  22. Katavoutas, G.; Founda, D.; Kitsara, G.; Giannakopoulos, C. Climate change and thermal comfort in top tourist destinations—The case of Santorini (Greece). Sustainability 2021, 13, 9107. [Google Scholar] [CrossRef]
  23. Mahadevia, D.; Pathak, M.; Bhatia, N.; Patel, S. Climate Change, Heat Waves and Thermal Comfort—Reflections on Housing Policy in India. Environ. Urban. ASIA 2020, 11, 29–50. [Google Scholar] [CrossRef]
  24. Thapa, S.; Rijal, H.B.; Pasut, W.; Singh, R.; Indraganti, M.; Bansal, A.K.; Panda, G.K. Simulation of thermal comfort and energy demand in buildings of sub-Himalayan eastern India-Impact of climate change at mid (2050) and distant (2080) future. J. Build. Eng. 2023, 68, 106068. [Google Scholar] [CrossRef]
  25. ASHRAE Standard 55. ANSI/ASHRAE Standard 55: Thermal Environmental Conditions for Human Occupancy; Technical report; ASHRAE Special Publications: Peachtree Corners, GA, USA, 2017. [Google Scholar]
  26. ISO 7730; Ergonomics of the Thermal Environment—Analytical Determination and Interpretation of Thermal Comfort Using Calculation of the PMV and PPD Indices and Local Thermal Comfort Criteria. International Organization for Standardization: Geneva, Switzerland, 2005.
  27. Van Hoof, J. Forty years of Fanger’s model of thermal comfort: Comfort for all? Indoor Air 2008, 18, 182–201. [Google Scholar] [CrossRef] [PubMed]
  28. Charef, R.; Emmitt, S.; Alaka, H.; Fouchal, F. Building Information Modelling adoption in the European Union: An overview. J. Build. Eng. 2019, 25, 100777. [Google Scholar] [CrossRef]
  29. Ying, H.; Lee, S. A rule-based system to automatically validate IFC second-level space boundaries for building energy analysis. Autom. Constr. 2021, 127, 103724. [Google Scholar] [CrossRef]
  30. Richter, V.; Malhotra, A.; Fichter, E.; Hochberger, A.; Frisch, J.; van Treeck, C. Validation of IFC-based Geometric Input for Building Energy Performance Simulation. In Proceedings of the 2022 Building Performance Modeling Conference and SimBuild Co-Organized by ASHRAE and IBPSA-USA, Chicago, IL, USA, 14–16 September 2022. [Google Scholar] [CrossRef]
  31. Di Biccari, C.; Calcerano, F.; D’Uffizi, F.; Esposito, A.; Campari, M.; Gigliarelli, E. Building information modeling and building performance simulation interoperability: State-of-the-art and trends in current literature. Adv. Eng. Inform. 2022, 54, 101753. [Google Scholar] [CrossRef]
  32. Bazjanac, V. Space Boundary Requirements for Modeling of Building Geometry for Energy and Other Performance Simulation. In Proceedings of the CIB W78 2010: 27th International Conference, Cairo, Egypt, 16–18 November 2010; International Council for Research and Innovation in Building and Construction: Kanata, ON, Canada, 2010. [Google Scholar]
  33. van Treeck, C.; Rank, E. Dimensional reduction of 3D building models using graph theory and its application in building energy simulation. Eng. Comput. 2007, 23, 109–122. [Google Scholar] [CrossRef]
  34. Rose, C.M.; Bazjanac, V. An algorithm to generate space boundaries for building energy simulation. Eng. Comput. 2015, 31, 271–280. [Google Scholar] [CrossRef]
  35. Jones, N.L.; McCrone, C.J.; Walter, B.J.; Pratt, K.B.; Greenberg, D.P. Automated Translation and Thermal Zoning of Digital Building Models for Energy Analysis. In Proceedings of the BS2013: 13th Conference of International Building Performance Simulation Association, Chambéry, France, 26–28 August 2013. [Google Scholar]
  36. Lilis, G.N.; Giannakis, G.I.; Rovas, D.V. Automatic generation of second-level space boundary topology from IFC geometry inputs. Autom. Constr. 2017, 76, 108–124. [Google Scholar] [CrossRef]
  37. Ying, H.; Lee, S. Generating second-level space boundaries from large-scale IFC-compliant building information models using multiple geometry representations. Autom. Constr. 2021, 126, 103659. [Google Scholar] [CrossRef]
  38. Fichter, E.; Richter, V.; Frisch, J.; van Treeck, C. Automatic generation of second level space boundary geometry from IFC models. In Proceedings of the Building Simulation 2021: 17th Conference of International Building Performance Simulation Association, Bruges, Belgium, 1–3 September 2021. [Google Scholar] [CrossRef]
  39. Mediavilla, A.; Elguezabal, P.; Lasarte, N. Graph-Based methodology for Multi-Scale generation of energy analysis models from IFC. Energy Build. 2023, 282, 112795. [Google Scholar] [CrossRef]
  40. Giannakis, G.I.; Katsigarakis, K.I.; Lilis, G.N.; Rovas, D.V. A Workflow for Automated Building Energy Performance Model Generation Using BIM. In Proceedings of the Building Simulation 2019; Corrado, V., Ed.; International Building Performance Simulation Association: Rome, Italy, 2019. [Google Scholar]
  41. Nytsch-Geusen, C.; Rädler, J.; Thorade, M.; Ribas Tugores, C. BIM2Modelica—An open source toolchain for generating and simulating thermal multi-zone building models by using structured data from BIM models. In Proceedings of the 13th International Modelica Conference, Regensburg, Germany, 4–6 March 2019; Linköing University Electronic Press: Linköing, Sweden, 2019; pp. 33–38. [Google Scholar] [CrossRef]
  42. O’Donnell, J.; See, R.; Rose, C.; Maile, T.; Bazjanac, V. SimModel: A domain data model for whole building energy simulation. In Proceedings of the Building Simulation 2011: 12th Conference of International Building Performance Simulation Association, Sydney, Australia, 14–16 November 2011. [Google Scholar]
  43. Andriamamonjy, A.; Saelens, D.; Klein, R. An automated IFC-based workflow for building energy performance simulation with Modelica. Autom. Constr. 2018, 91, 166–181. [Google Scholar] [CrossRef]
  44. Cao, J. SimModel Transformation Middleware for Modelica-based Building Energy Modeling and Simulation. Ph.D. Thesis, RWTH Aachen University, Aachen, Germany, 2018. [Google Scholar]
  45. Chen, Z.; Deng, Z.; Chong, A.; Chen, Y. AutoBPS-BIM: A toolkit to transfer BIM to BEM for load calculation and chiller design optimization. Build. Simul. 2023. [Google Scholar] [CrossRef]
  46. Remmen, P.; Lauster, M.; Mans, M.; Fuchs, M.; Osterhage, T.; Müller, D. TEASER: An open tool for urban energy modelling of building stocks. J. Build. Perform. Simul. 2018, 11, 84–98. [Google Scholar] [CrossRef]
  47. DIN V 18599-10; Energy Efficiency of Buildings—Calculation of the Net, Final and Primary Energy Demand for Heating, Cooling, Ventilation, Domestic Hot Water and Lighting—Part 10: Boundary Conditions of Use, Climatic Data. Deutsches Institut für Normung: Berlin, Germany, September 2018.
  48. VDI 2078; Calculation of Thermal Loads and Room Temperatures (Design Cooling Load and Annual Simulation). Verein Deutscher Ingenieure: Düsseldorf, Germany, June 2015.
  49. SIA 2024; Standard-Nutzungsbedingungen für die Energie- und Gebäudetechnik. Schweizerischer Ingenieur- und Architektenverein (SIA) (engl. Swiss Society of Engineers and Architects): Zürich, Switzerland, 2006.
  50. Jentsch, M.F.; James, P.A.; Bourikas, L.; Bahaj, A.S. Transforming existing weather data for worldwide locations to enable energy and building performance simulation under future climates. Renew. Energy 2013, 55, 514–524. [Google Scholar] [CrossRef]
  51. Tapiador, F.J.; Navarro, A.; Moreno, R.; Sánchez, J.L.; García-Ortega, E. Regional climate models: 30 years of dynamical downscaling. Atmos. Res. 2020, 235, 104785. [Google Scholar] [CrossRef]
  52. Wilby, R.L.; Wigley, T. Downscaling general circulation model output: A review of methods and limitations. Prog. Phys. Geogr. Earth Environ. 1997, 21, 530–548. [Google Scholar] [CrossRef]
  53. Belcher, S.E.; Hacker, J.N.; Powell, D.S. Constructing design weather data for future climates. Build. Serv. Eng. Res. Technol. 2005, 26, 49–61. [Google Scholar] [CrossRef]
  54. Zeng, Z.; Kim, J.H.; Tan, H.; Hu, Y.; Rastogi, P.; Wang, J.; Muehleisen, R. A critical analysis of future weather data for building and energy modeling. In Proceedings of the Building Simulation 2023: 18th Conference of IBPSA, Shanghai, China, 4–6 September 2023. [Google Scholar]
  55. Nielsen, C.N.; Kolarik, J. Utilization of Climate Files Predicting Future Weather in Dynamic Building Performance Simulation—A review. J. Phys. Conf. Ser. 2021, 2069, 012070. [Google Scholar] [CrossRef]
  56. Rodrigues, E.; Fernandes, M.S.; Carvalho, D. Future weather generator for building performance research: An open-source morphing tool and an application. Build. Environ. 2023, 233, 110104. [Google Scholar] [CrossRef]
  57. Jiang, A.; Liu, X.; Czarnecki, E.; Zhang, C. Hourly weather data projection due to climate change for impact assessment on building and infrastructure. Sustain. Cities Soc. 2019, 50, 101688. [Google Scholar] [CrossRef]
  58. Hong, T.; Malik, J.; Krelling, A.; O’Brien, W.; Sun, K.; Lamberts, R.; Wei, M. Ten questions concerning thermal resilience of buildings and occupants for climate adaptation. Build. Environ. 2023, 244, 110806. [Google Scholar] [CrossRef]
  59. DIN EN 15251; Indoor Environmental Input Parameters for Design and Assessment of Energy Performance of Buildings Addressing Indoor Air Quality, Thermal Environment, Lighting and Acoustics, German Version. Deutsches Institut für Normung: Berlin, Germany, December 2012.
  60. DIN EN 16798-1; Energy Performance of Buildings—Ventilation for Buildings—Part 1: Indoor Environmental Input Parameters for Design and Assessment of Energy Performance of Buildings Addressing Indoor Air Quality, Thermal Environment, Lighting and Acoustics—Module M1-6, German Version. Deutsches Institut für Normung: Berlin, Germany, March 2022.
  61. Richter, V.; Lorenz, C.L.; Syndicus, M.; Frisch, J.; van Treeck, C. Framework for automated IFC-based thermal comfort analysis based on IFC model maturity. In Proceedings of the Building Simulation 2023: 18th Conference of IBPSA, Shanghai, China, 4–6 September 2023. (to be published). [Google Scholar]
  62. 2017 ASHRAE Handbook: Fundamentals, si ed.; ASHRAE: Atlanta, GA, USA, 2017.
  63. DIN EN ISO 8996; Ergonomics of the Thermal Environment—Determination of Metabolic Rate (ISO 8996:2021); German Version. Deutsches Institut für Normung: Berlin, Germany, October 2022.
  64. DIN EN ISO 9920; Ergonomics of the Thermal Environment—Estimation of Thermal Insulation and Water Vapour Resistance of a Clothing Ensemble (ISO 9920:2007, Corrected version 2008-11-01); German Version. Deutsches Institut für Normung: Berlin, Germany, October 2009.
  65. Zhang, N.; Cao, B.; Zhu, Y. An effective method to determine bedding system insulation based on measured data. Build. Simul. 2023, 16, 121–132. [Google Scholar] [CrossRef]
  66. EC-Earth Consortium. EC-Earth-Consortium EC-Earth3 model output prepared for CMIP6 CMIP. [CrossRef]
  67. Mitra, D.; Steinmetz, N.; Chu, Y.; Cetin, K.S. Typical occupancy profiles and behaviors in residential buildings in the United States. Energy Build. 2020, 210, 109713. [Google Scholar] [CrossRef]
  68. Elnagar, E.; Gendebien, S.; Georges, E.; Berardi, U.; Doutreloup, S.; Lemort, V. Framework to assess climate change impact on heating and cooling energy demands in building stock: A case study of Belgium in 2050 and 2100. Energy Build. 2023, 298, 113547. [Google Scholar] [CrossRef]
Figure 1. Simplified representation of the main bim2sim workflow; for Building Performance Simulation including the PluginEnergyPlus (white) and the PluginTEASER (gray, solid line), and for HVAC simulations the PluginAixlib (gray, dashed line).
Applsci 13 12478 g001
Figure 2. Simplified representation of the workflow of the bim2sim-based thermal comfort plugin PluginComfort; the new plugin builds upon the existing parts of the PluginEnergyPlus (gray) by loading additional data in the enrichment process and comfort-related settings in the plugin-specific settings (white).
Applsci 13 12478 g002
Figure 3. Monthly outdoor temperature for TMYx (2007–2021) and SSP5-8.5 for 2050 and 2080 weather data (Boxplots defined by median and Interquartile Range (IQR) from 25th to 75th percentile and whiskers limited by ± 1.5 IQR).
Applsci 13 12478 g003
Figure 4. Use Case: FZK Haus.
Applsci 13 12478 g004
Figure 5. Annual energy demand for heating and cooling per building floor area.
Applsci 13 12478 g005
Figure 6. TMYx (2007–2021) mean daily PMV with cooling.
Applsci 13 12478 g006
Figure 7. SSP5-8.5 (2080) mean daily PMV with cooling.
Applsci 13 12478 g007
Figure 8. Annual energy demand for heating per building floor area.
Applsci 13 12478 g008
Figure 9. Mean annual PMV per thermal zone comparing the scenarios for TMYx (2007–2021) and SSP5-8.5 (2080) weather data.
Applsci 13 12478 g009
Figure 10. Number of hours of the individual thermal zones within PMV ranges for TMYx (2007–2021) (a), SSP5-8.5 (2080) (c) and the difference between TMYx (2007–2021) and SSP5-8.5 (2080) (b).
Applsci 13 12478 g010aApplsci 13 12478 g010b
Figure 11. 24 h mean PMV values for thermal zone “Living” for TMYx (2007–2021) and SSP5-8.5 (2080).
Applsci 13 12478 g011
Figure 12. 24 h mean PMV values for thermal zone “Kitchen” for TMYx (2007–2021) and SSP5-8.5 (2080).
Applsci 13 12478 g012
Figure 13. Adaptive comfort according to DIN EN 16798-1/DIN EN 15251 for zone “Living” for TMYx (2007–2021) and SSP5-8.5 (2080).
Applsci 13 12478 g013
Figure 14. Adaptive comfort according to DIN EN 16798-1/DIN EN 15251 for zone “Kitchen” for TMYx (2007–2021) and SSP5-8.5 (2080).
Applsci 13 12478 g014
Figure 15. Adaptive comfort according to DIN EN 16798-1, percentage of hours per category.
Applsci 13 12478 g015
Table 1. Differences in running mean outdoor temperatures as set points for thermal comfort categories in DIN EN 15251 [59], DIN EN 16798-1 [60].
DIN EN 15251DIN EN 16798-1
Category I, upper threshold24.1…30.7 °C
Category I, lower threshold21.75…26.7 °C19.1…25.7 °C
Category II, upper threshold25.1…31.7 °C
Category II, lower threshold20.75…25.7 °C18.1…24.7 °C
Category III, upper threshold26.1…32.7 °C
Category III, lower threshold18.1…24.7 °C17.1…23.7 °C
Applicable for running mean temperature:
Upper threshold10…30 °C
Lower threshold15…30 °C10…30 °C
Table 2. Deriving activity parameters for archetypal enrichment of thermal zones based on ASHRAE Fundamentals and ISO 7730, including a comparison to existing TEASER template values. Columns: (1) Room type according to TEASER templates, (2) Activity degree from TEASER templates ( met ), (3) Heat flow from TEASER templates ( W / person ), (4) Chosen activity type according to ASHRAE Fundamentals, Chapter 9 Table 4, (5) Chosen activity type according to ISO 7730, Table A.5 and B.1, (6) ASHRAE activity degree ( met ), (7) ISO 7730 activity degree ( met ), (8) Resulting combined activity degree ( met ), (9) Absolute deviation from TEASER activity degree ( met ), (10) Resulting heat flow ( W / person ), (11) Absolute deviation from TEASER heat flow ( W / person ).
(1) Room Type(2)(3)(4) ASHRAE Fundamentals(5) ISO 7730(6)(7)(8) Activity Degree (met)(9)(10) Heat Flow (W/Person)(11)
Single office1.270Office, TypingA.5, Single office1.11.21.20.012555
Bed room1.270Resting, SleepingB.1, Reclining0.70.80.80.48414
Kitchen in nonresidential buildings1.270CookingB.1, Standing, medium activity1.821.90.7199129
WC and sanitary rooms in non-residential buildings1.270Resting, Seated, quietB.1, Seated, relaxed1110.210535
Traffic area1.270Office WalkingB.1, Walking, 2 km/h1.71.91.80.6188118
Living1.270Resting, Seated, quietB.1, Sedentary activity11.21.10.111545
Table 3. Deriving clothing parameters for archetypal enrichment of thermal zones based on ASHRAE Fundamentals and ISO 7730. Columns: (1) Room type according to TEASER templates, (2) Chosen clothing type according to ASHRAE Fundamentals, Chapter 9 Table 7, (3) Chosen clothing type according to ISO 7730, (4) ASHRAE clothing (clo), (5) ISO 7730 clothing (clo), (6) Resulting combined clothing parameter (clo), (7) Chosen surrounding insulation type, (8) Surrounding insulation (clo).
(1) Room Type(2) ASHRAE Fundamentals(3) ISO 7730(4)(5)(6) Clothing Insulation (clo)(7) Surrounding Insulation Description(8) Surrounding Insulation (clo)
Single officeTrousers, long-sleeved shirtUnderwear, shirt, trousers, socks, shoes0.610.70.66ISO 7730, C.3 Executive chair0.15
Bed roomWalking shorts, shortsleeved shirtPanties, T-shirt, shorts, light socks, sandals0.360.30.33Average based on Zhang et al. [65]2
Kitchen in nonresidential buildingsLong-sleeved overalls, T-ShirtUnderpants, shirt, trousers, smock, socks, shoes0.720.90.81None
WC and sanitary rooms in non-residential buildingsTrousers, long-sleeved shirtUnderwear, shirt, trousers, socks, shoes0.610.70.66None
Traffic areaTrousers, long-sleeved shirtUnderwear, shirt, trousers, socks, shoes0.610.70.66None
LivingTrousers, long-sleeved shirtUnderwear, shirt, trousers, socks, shoes0.610.70.66ISO 7730, C.3 Executive chair0.15
Table 4. Heating and cooling set points.
Heating [ C ]Cooling [ C ]
Living2128
WC Residential2432
Kitchen Residential2026
Single office2126
Traffic area1832
Bedroom2128
Disclaimer/Publisher’s Note: The statements, opinions and data contained in all publications are solely those of the individual author(s) and contributor(s) and not of MDPI and/or the editor(s). MDPI and/or the editor(s) disclaim responsibility for any injury to people or property resulting from any ideas, methods, instructions or products referred to in the content.

