
Behavior of Two-Chord Steel–Concrete Composite Columns under Axial Compression

Faculty of Civil Engineering Subotica, University of Novi Sad, Kozaračka 2a, 24000 Subotica, Serbia
*
Author to whom correspondence should be addressed.
Appl. Sci. 2023, 13(23), 12634; https://doi.org/10.3390/app132312634
Submission received: 10 October 2023
/
Revised: 10 November 2023
/
Accepted: 13 November 2023
/
Published: 23 November 2023
(This article belongs to the Section Civil Engineering)
Abstract
:Experimental and numerical research on axially compressed columns made from built-up two-chord concrete-filled steel tubes (TCCFSTs) is presented in this study. The columns were constructed from two parallel circular high-strength steel tubes connected by five batten tubes. The chord tubes were filled with high-strength concrete. The yield stress of the steel used was 600 MPa, while the cylinder compressive strength of the concrete was 95 MPa. Hollow specimens were also tested to serve as a control group. An experimental analysis investigated the influence of the compressive strength of the concrete fill on the load-bearing capacity of the column and the influence of the concrete fill on the slenderness of the column. The behavior under load, stress and strain development, and the failure modes of the specimens were also analyzed. The results of the tests showed that all parts of the built-up column participated in the load-bearing process. The load-bearing capacity of the hollow two-chord columns was improved by around 1.74 times, and the slenderness increased by 16% with the concrete infill. The columns filled with concrete exhibited almost linear behavior with a higher ultimate strength and stiffness than the hollow built-up steel columns. Furthermore, the application of three calculation codes to forecast the capacity of the TCCFST columns was evaluated. Additionally, finite element method (FEM) modeling was used to investigate the stresses, strains, deformations, and ultimate capacity of the TCCFST column models loaded with axial compressive force. The FEM model showed good predictions of strength, stresses, deformations, and buckling.
1. Introduction
Existing reinforced concrete (RC) structures are often in need of improvements to their strength, capacity, and structural response. Many RC structures have insufficient resistance to meet the increased demands made by new seismic codes. Moreover, the need to strengthen an RC structure may arise from enlarged loads, the extension of buildings, or even oversights in the design or construction process. A concrete-filled steel tube (CFST) was successfully used as a solution to improve the strength and ductility of an existing RC column as it was presented in [1]. RC structures strengthened with CFST have an improved load-bearing capacity for additional permanent, variable, accidental, and seismic loads. Columns built from CFST take advantage of the coupling effect formed between the concrete fill and the steel tube; this allows for the formation of hoop stress in the steel tube wall, which can raise the ultimate capacity of the column [2,3]. The formation of tangential hoop stress will cause the development of a biaxial (plane) state of stresses in the tube and the development of a 3D stress state in the concrete infill. Furthermore, the concrete infill will also prevent the buckling of the tube’s wall in an inward direction.
The solution to improving the RC structure investigated in this research is the use of a built-up two-chord column made from vertical steel tubes (chords) filled with concrete. Two vertical circular tubes are sparsely interconnected with hollow horizontal tubes (battens). Two-chord columns could be used in existing RC structures as additional columns or a bracing system, or they could be used as the main load-bearing elements in different structures, such as residential or industrial buildings, bridges, and stadiums. Since the chords are primarily subjected to axial forces, they can take full advantage of the improved compressive properties of a CFST element, and slender CFST chords with relatively small cross-sections could be used. Latticed CFST models are lighter in weight and have increased flexural stiffness compared with singular CFST models with an equal ultimate capacity. In CFST columns, the most influential property of the concrete is the compressive strength. When the steel tubes are filled with normal-strength concrete (30–50 N/mm2), the concrete weight can represent a considerable addition to the intrinsic weight of the structure. High-strength and ultra-high-strength concrete infills provide the same beneficial effects as a steel–concrete composite with a significantly lower weight increase.
The cross-section used for CFST latticed columns usually consists of two, three, or four chords, among which the four-chord ones are mostly used in practice. Kawano et al. [4,5,6] conducted experiments to determine the behavior of circular two-legged CFST latticed member loaded with cyclic lateral force. The results indicated that the deformability and load-bearing capacity of composite member were significantly better than those of the equivalent steel member owing to the presence of the concrete fill in the chord elements. Over time, researchers successively investigated the behavior of three- and four-legged CFST latticed member [7,8,9,10,11,12,13]. The factors considered in the investigations included axial capacities, the strength of the concrete in the chords, slenderness ratios, diameter-to-thickness ratios in the tubular battens and chords, the arrangement of the battens or braces, and seismic excitations. The applicability of high-strength steel and high-strength concrete as materials for composite columns was investigated in [14,15,16,17]. High-strength materials yield the potential for weight and material reduction as a way to produce efficient structures. The utilization of high-strength steel enhances the overall behavior of structural elements. The usage of high-strength concrete indicated that the performance of a column could be improved by increasing the diameter-to-thickness ratio of a steel tube and by lowering the axial compression ratio. The instability behavior of prismatic multi-tube latticed steel columns using the proposed elastic buckling loads and the modification of slenderness ratios was presented by Guo [18]. An experimental investigation of composite columns made from CFST connected by steel linking plates was analyzed by Xu [19]. The experimental program studied the slenderness ratio, the thickness of the steel linking plates, and load eccentricities. It was demonstrated that members with a greater slenderness had lesser load-bearing capabilities; additionally, the steel connector plates had a significant influence on containing the specimens’ side deflections. The connector plate was proven to be an important element of the shear force transferring process by Zhou [20].
The presented research investigates the behavior of two-chord hollow steel tube (TCHST) columns and two-chord concrete-filled steel tube (TCCFST) columns. The objectives of this study are to present the results of a series of experimental tests, to investigate the influence of concrete compressive strength on the performance of TCCFST members, and to define the axial load-carrying capacity of TCCFST members using current design codes or standards. The novelty of the presented research is in the application of high-strength materials in the formation of a built-up two-chord steel–concrete composite column. In this study, a two-chord column is made with only horizontal battens instead of the typical lattice shape with diagonal and diagonal + horizontal bracings. Moreover, the column plastic capacities obtained from the codes AISC-360 [21], DBJ/T-13 [22], and Eurocode 4 [23] in determining the plastic resistance of the TCCFST columns are validated. The strengths of the materials used in this research are higher than the limits defined in the codes AISC-360 and Eurocode 4. High-strength materials are widely available for structural application, but the use of those materials in composite columns is still restricted due to the lack of design guidelines and insufficient field experience. Thus, an additional aim of this study is to provide recommendations on the application of TCCFST made from high-strength materials.
2. Experimental Program
2.1. Column Models
The experiments presented in this study were carried out on models of TCHST and TCCFST columns. The dimensions of the column models correlated with those of actual physical structures at a ratio of one by three; i.e., the models were three times smaller than the equivalent pillar in a typical structure. Considering that a typical residential building has a 3 m floor height, the experimental model was adopted to have a height of one meter. The global size of the experimental specimens was also selected while taking into consideration the laboratory testing equipment limitations, in which the largest test specimen could be around 1000 mm high. Additional properties of the experimental models, such as the dimensions of the column’s cross-section, the width and wall thickness of the steel tubes, and the concrete aggregate sizes, were properly scaled.
Five axially compressed two-chord built-up composite columns were tested. The specimens were separated into two groups. The first set of two columns were specimens made as hollow two-chord columns (labels S-21 and S-22), while the second set of three models were TCCFST columns filled with high-strength concrete (labels SC-21, SC-22, and SC-23). The hollow and the filled columns had cross-sections made from two parallel 1000 mm high main steel tubes placed at a 200 mm distance apart. Along the height of the specimens, the main tubes were interconnected via five horizontal steel members. The diameter of the main chord tubes was 60.3 mm, and they had a wall thickness of 4 mm, while the connecter members were made from 33.7 mm diameter and 3 mm thick wall tubes. A horizontal batten tube was then welded to a vertical chord tube at a distance of 239 mm, starting at 22 mm from the top and bottom of the column. The dimensions of the column models are presented in Figure 1a. The inside surfaces of the chord tubes were cleaned to remove rust and oil deposits, and the chords were carefully filled with high-strength concrete. Fresh concrete was poured in layers and then compacted with a steel rod (Figure 1b). Only vertical tubes were filled with concrete. The test specimens were kept at a temperature of 20 °C and a 60% humidity to air-dry. A 280 mm × 80 mm × 15 mm steel plate was welded to each end of the test specimens. The bottom plate was welded before the casting of the fill concrete, while the top plate was welded four weeks after the concrete had cured.
One of the parameters evaluated in the experimental analysis was the global nominal slenderness ratio () of the hollow and the filled specimens. The slenderness ratio was calculated as follows:
where is the height of the specimen; is the effective length factor that depends on the boundary condition so that k = 0.7 for a column that is fixed at both ends [24]; and I and A are the moments of inertia and the total area of the chord members in the cross-section, respectively. For the TCHST specimens, and , while for the TCCFST specimens, I and A are characteristics of the idealized composite cross-section calculated as and . In previous expressions, and are the total areas of the steel tubes and the concrete infill, and and are the moment of inertia of the steel tubes and the concrete infill, respectively. In the presented study, the cross-section had both material and non-material axes. However, only buckling around the material axis was investigated, as, due to the size and shape of the cross-section, buckling instability could occur only around the material axis. By material axis, we mean the axis that goes through both chords longitudinally over the cross-section (cuts through material), while the non-material axis goes across the battens.
Table 1 shows the specimen labels and the main properties of the tested columns, where Nu is the ultimate bearing capacity of the specimen registered during the experiment, while ξ is the confinement factor.
2.2. Material Properties
In the case of normal-strength concrete and normal-strength steel, the peak strain of concrete is very close to the steel yield strain, which implies that the materials are strain compatible. Because of that, both materials in the composite section can simultaneously reach their full strengths. However, high-strength concrete and steel are not strain compatible since concrete reaches its peak strain before the yielding of high-strength steel is attained. Steel is unable to develop its full strength since concrete will fail before steel, causing a partial utilization of the materials’ capacities. The highest strength of structural steel and concrete that can be fully exploited in a composite section can be determined using the strain compatibility method. In this study, steel with a yield strength of 600 N/mm2 was used in combination with concrete that had a cylinder compressive strength of 95 N/mm2, ensuring full strain compatibility.
The composition of the concrete mix was formulated for the required compressive strength class. The proportions of the fresh concrete mixture were as follows: cement 670 kg/m3, coarse aggregate 600 kg/m3, fine aggregate 984 kg/m3, fly ash 85 kg/m3, water 135 kg/m3, and superplasticizer 12 kg/m3. Crushed diabase rock was used as the coarse aggregate, while quartz sand was the fine aggregate, and the cement was CEM I 52.5. A high-range water-reducing admixture was utilized to ensure sufficient viscosity for the casting of the fresh concrete into the chord tubes. The standard test specimens used to define the properties of the cured concrete included 150 mm cubes, 150 mm × 300 mm cylinders, and 100 mm × 100 mm × 400 mm prisms according to SRPS EN 12390-1 [25]. All test specimens were cast and cured under conditions similar to those of the TCCFST column specimens according to SRPS EN 12390-2 [26]. The mean values for the cylinder, cube, and characteristic compressive strength are listed in Table 2. Additionally, the flexural tensile strength, hardened concrete density, Poisson’s ratio, and elastic modulus are listed. The mechanical properties of the concrete were determined on the same day when the testing of the TCCFST specimens was performed. The tests were conducted according to SRPS EN 12390-3 [27] (compressive strength), SRPS EN 12390-5 [28] (flexural tensile strength), and SRPS EN 12390-7 [29] (density). Thus, the characteristics of the used concrete were precisely identified at the moment of the column model testing. The stress–strain curves of the concrete prism recorded during the compressive test are presented in Figure 2a. The axial () and the lateral () strains were measured with strain gauges placed in the middle of the test prism (Figure 2b). Under axial compression, the concrete exhibited an almost linear response up to around ; the deformations then increased, and sudden brittle failure occurred after reaching , which is typical behavior of high-strength concrete.
All steel tubes used for built-up column models were factory-manufactured. Three standard test samples were cut from the original steel tubes and were tested in tension according to SRPS EN ISO 6892-1 [30]. Since there were no significant differences between the test samples, only the representative tensile stress–strain curve of the steel is presented in Figure 3a. The test samples are shown in Figure 3b. In these tests, the material properties of the chord steel tube were determined. The measured parameters included the outer diameter (D), wall thickness (t), yield strength (fy), ultimate tensile strength (fu), static elastic modulus (Es), Poisson’s ratio (μs), and elongation at break (δ). The average test results are presented in Table 3. Since the effects of residual stresses and initial specimen imperfections were minimized by the concrete infill in the steel tubes, as noted in [2], the residual stresses were not taken into account in the value of the yield strength. With the ratio of the outer width and thickness of the wall determined as D/t = 15, the limit condition D/t < 90·235/fy = 35 specified in Eurocode 4 [23] was satisfied. The cross-section of the hollow chord was, following Eurocode 3 [31], classified as Class 1. For this class, the cross-section has a significant rotational capacity and can develop full plastic moment resistance, which allows for the usage of a global plastic analysis.
2.3. Test Setup
Two types of deformations were examined in the presented research. The first type was local deformations, e.g., the longitudinal and lateral strains, and the second type was global deformations of the columns, such as shortening and out-of-plane deflections. The specific strains were measured using eight strain gauges placed on a section positioned between the second and third batten. The strain gauges were positioned symmetrically along the longitudinal axis of the column, as presented in Figure 4a. The strain gauges used to measure axial strains were labeled with V (e.g., the vertical direction), while the strain gauges used to measure strains in the lateral direction were labeled with H (e.g., the horizontal direction). The out-of-plane deflections at the mid-height of the chord were measured using two electrical displacement transducers and two mechanical gauge dials, as shown in Figure 4b. An additional two displacement transducers (DTs) were used to measure the deformations in the axial direction. The shortening of the specimen was measured by DT1, while DT2 was used to track down any support movement. The readings from the electronic displacement gauges and strain gauges were automatically recorded throughout the loading process by two HBM SPIDER 8 acquisition devices. The analysis of the tested specimens included the tracking of the stresses and deformations of all parts of the built-up column, the load-bearing capacity, the mode of deformation at failure, and the force distribution over the composite cross-section parts. This study investigated only short-term loading, and the effects of the shrinkage and/or creep of the concrete were not considered.
The testing of the column models was accomplished using a hydraulic press with a 2 MN capacity. A column was carefully positioned in the center of the bottom rigid steel plate of the press to eliminate any potential secondary bending moments. Concentric force was applied to the column model via the top and bottom thick steel load-bearing plates. The force was applied in an upward direction, pushing it against the top support plate. Figure 4a presents a schematic representation of the test setup and the positions of the used instruments. All column models were continuously loaded until failure occurred. The hydraulic press was operated using a force control technique in which a load step of 1/10 of the expected ultimate capacity of the tested model was used. The load-bearing capacities of the TCHST and TCCFST models were estimated using a finite element analysis. Every load interval was maintained for about 2 min. After the applied load reached 50% of the estimated ultimate load, or if a change in the slope was recorded in the force–displacement curve, the value of the load step was changed to 1/20 of the estimated load-bearing capacity. The progression of global deformations, the mode of failure, and the ultimate capacity of the column models were all noted. The test ended when the load on the column fell under 80% of the highest recorded value or when the lateral displacement in the middle of the specimen reached L/25. The TCCFST specimen just before the start of the test is presented in Figure 4b.
3. Results of the Experiments
3.1. TCHST Specimens
Two axially loaded, hollow steel, built-up specimens were tested for comparison purposes with the results of the concrete-filled specimens. Both columns in this group exhibited similar behavior. The measured axial load (N) vs. strains (ε) and load vs. displacement relationships are presented in diagrams in Figure 5a,b, respectively. A linear response of the specimens could be observed from the beginning of the load process to the steel yield strain in the axial direction (Figure 5a). The yield strain limits are marked with vertical dashed lines (εy). After reaching the yield strain, the models demonstrated a nonlinear increase in deformations. The specimens reached failure soon after the strains in the lateral direction attained the yield level. This is typical behavior for axially loaded steel columns made from hollow circular steel tubes, for which a biaxial stress state develops. The longitudinal strains in the steel at failure were around 6 to 8‰, while the normal stress in the steel tube calculated from the maximal load on the specimen was 513 N/mm2. Both chords of the same specimen had almost identical axial strains, which meant that minimal or no initial imperfections, such as an eccentric placement of the specimen on the testing machine, were introduced to the specimen. Figure 5b shows the load (N) vs. axial shortening (Δℓ), and load vs. mid-height lateral deflections (Um). In the presented diagrams, it could be observed that the specimen exhibited uniform axial shortening up to approximately 70% of the bearing capacity. Afterwards, an increase in vertical deformations occurred at 90% of the ultimate load when the specimen started to buckle, which was noted via an increase in lateral deformations. Labels Um,L and Um,R represent the recordings from two opposed displacement transducers placed on the left (L) and the right (R) sides of a single chord.
The members of the built-up hollow tube specimens showed a good interaction, and the cracking of the welding on the chord–batten contacts was unnoticeable. In the first part of the load process, the TCHST specimens exhibited elastic behavior, and only small lateral deformations could be detected. However, when the yield strain (εy) limits were reached, noticeable global deformations of the columns were observed. The specimens were in the plastic range until the peak load was achieved. When the load on the specimen reached around 90% of the capacity, an increase in out-of-plane deflections was observed, attributable to the loss of stability and second-order effects, as shown in Figure 6a,b. When the peak load was attained, outward buckling at the mid-height of the chords was observed, and the load that the specimen could take began to decrease. Behavior in the post-peak range was represented by a gradual load drop. Local buckling of the steel tube wall was not detected, and no buckling or deformations were observed in the battens. The load-bearing capacities of the specimens measured in the experiments are given in Table 1, whereas the average values are presented in Table 4. The variation in the results between the specimens was around 1%.
3.2. TCCFST Specimens
The experimental testing of the TCCFST models was conducted in a similar manner to that of the specimens of the hollow group to ensure that the results of both groups could be effectively studied. Thus, a direct assessment of the effect of the compressive strength of the concrete on the ultimate capacity of the built-up two-chord column was possible. Figure 7 shows a diagram of the compressive force versus axial and lateral strains. The yield strains of steel (εy) are indicated by the dashed lines. In the initial loading stage, or for forces up to 50% of the maximal load, the TCCFST specimens were in the elastic state, and the response of the specimens was linear. Afterwards, the models demonstrated an indistinct nonlinear increase in deformations, and a noticeable increase in the deformations was observed for the forces around 70 to 80% of the peak load or when the yield strain in the axial direction was reached. At the maximal load on the specimen, the calculated values of normal stresses in the steel tube and the concrete fill were 515 N/mm2 and 121 N/mm2, respectively. It was observed in the diagrams that the axial strains of the steel tubes were fairly similar, which led to the conclusion that the specimens behaved as axially loaded members and that the initial imperfections or material variations were negligible.
A diagram of the axial load leading to longitudinal shortening and mid-height lateral deformations of the specimens is presented in Figure 8. The specimens exhibited uniform axial shortening almost to the bearing capacity. As for the previous group, for forces over 90% of the ultimate load, the column started to buckle, which was followed by a sudden increase in side displacements Um at the mid-height of the specimen, as shown in Figure 8.
Similar behavior was observed in all TCCFST specimens. Mainly, the axial strains of the filled specimen attained the yield strain before the specimen reached its bearing capacity, which can indicate full utilization of the steel’s strength. The effective confining of the concrete infill was uniformly achieved over the entire height of the column. An increase in the load over the elastic limit initiated the stretching of the tube’s wall, which influenced the bond between the steel tube and the concrete fill. Regardless, the steel tube was still able to deliver partial confinement of the fill concrete, which resulted in a continued load-bearing response of the specimen. At that time, the response mainly depended on the compressive strength of the concrete. Failure of the specimens occurred when the steel tube could not provide confinement to the concrete, and a further increase in the force led to the crushing of the concrete and the buckling of the chords. The top of the SC-22 specimen is presented in Figure 9a,b. As for the previous group, neither cracks in the welds nor local buckling was detected on the wall of the steel tube. Also, no buckling or deformations were detected in the battens.
The two-chord column models filled with concrete after the experiments are shown in Figure 10. The breakdown of the columns with the composite cross-section was attributed to a combination of out-of-plane buckling, concrete cracking, and yielding of the steel. The load-bearing forces of the TCSFST columns recorded in the experiments are listed in Table 1. The statistically analyzed results, which include the mean value, standard deviation, and coefficient of variation, are presented in Table 4. The variation between the results was under 1%.
3.3. Comparative Analysis of the Test Results
The comparative relationships between the axial load and the lateral and axial strains in the steel tubes for all tested models are presented in Figure 11, where the negative and positive values indicate the compressive and tensile strains, respectively. The compressive and tensile yield strains of the steel are marked with vertical dashed lines. It was observed that specimens of both groups behaved in a similar manner and that the chords and the battens were engaged in load bearing.
The models of both groups showed linear behavior until they reached the steel yield stresses in the axial direction. The behavior of the built-up columns outside the elastic range largely influenced whether the chord was filled or not. The TCHST specimens exhibited a nonlinear increase in deformations, while the TCCFST specimens exhibited almost a linear response until the peak load. After the load reached approximately 90% of the bearing capacity, the strains in the lateral direction reached the yield strain of the steel, and the out-of-plane deformations increased considerably. Because of the second-order effect and the loss of stability, the columns entered the plastic stress range. After achieving the peak load, excessive lateral deformations led to a sudden loss of the load-bearing capability. All columns failed after the loss of global stability as out-of-plane deflections of the chords developed. The chords of both groups performed as flexible members without observable local buckling of the steel tube walls throughout the experiment. Local failure along the battens or weld fracture, at their connections with the chords, where the maximal internal forces in the battens are reached, was not detected. A minor variance among the ultimate strains of the columns of both groups yielded the conclusion that the high-strength concrete infill had a comparatively low influence on the column’s ductility.
The relationships of axial force vs. axial shortening for typical specimens are shown in Figure 12. Similarly to the previous figure, it can be seen that the concrete in the chords significantly enhanced the load-bearing capacity and overall stiffness of the column and that the specimens with filled chords had a linear increase in deformations almost to the maximum capacity.
The battened two-chord specimens for in-plane conditions behaved like frame structures, where the chords were subjected to axial load and bending moments, while the bending and shear deformations affected the batten’s behavior. The compressive strength of a hollow steel tube member could significantly be improved with concrete infill, as shown in Figure 11 and Figure 12. The ultimate capacity and the initial stiffness of the specimens with concrete-filled chords were substantially greater than those of the built-up specimens with hollow chords.
The mean value of load-bearing forces, the standard deviation (Sn) of the forces, and the coefficient of variation (COV) for the column models of both groups are shown in Table 4. Additionally, the coefficient of enhanced strength of the two-chord column with the concrete-filled tubes in comparison with the hollow tube two-chord column (ks) is given. The coefficient is calculated as a ratio:
where and are the mean values of the ultimate forces for the filled and hollow two-chord columns, respectively. Coefficient ks shows that, in this research, the two-chord built-up columns with high-strength concrete-filled steel tubes will have a 1.74 times higher ultimate load.
The axial load (Ni) applied in load increments (i) to a built-up composite steel–concrete column is divided among its parts so that
where and are the forces on the concrete and steel in one load increment, respectively. The theoretic distribution of the load on parts of the column’s cross-section could be calculated using the equivalence of the axial strain because, in the composite cross-section, all parts must have identical strains in the axial direction. The distribution of the applied force Ni can be calculated from ratios:
The modified area of the concrete () and steel () part and the idealized area of the composite cross-section (A*) are determined as follows:
The elastic modulus of the steel was chosen as the comparative modulus of elasticity (E*) for the cross-section of a composite member. The theoretical distribution of the force between two parts of the TCCFST chord was determined in the form of a load percentage. In the analyzed member, the concrete fill carried 42% of the applied load, whereas the steel tube carried 58% of the applied load. This distribution is presented in the first column in Figure 13.
The confinement factor, or the relative strength ratio (ξ), is generally used to assess the compressive response of concrete-filled steel tubes, as noted in [32,33,34]. As one of the major factors in interactions between the steel tube and the concrete fill, it was defined as follows:
where Ac and As are the total areas of the concrete and steel tubes, respectively, while fy is the steel’s yield strength. The characteristic concrete compressive strength fck is determined from the cube strength (fcu) as follows:
with the coefficients and . Details on the reduction coefficients are given in Ref. [35]. The values of the concrete compressive strengths are given in Table 3, while the confinement factor value is shown in Table 1. In concrete-filled steel tube columns with a high confinement factor, the steel tube is stronger and is less likely to be influenced by the local buckling of walls, and more confinement is provided to the concrete infill. The relationship between the cube’s compressive strength and the confinement factor is presented in Figure 14. Additionally, the value of the confinement factor for the TCCFST test specimen is also given. It can be observed that the values of ξ decrease with the increase in the compressive strength of the concrete, which means that the TCCFST column filled with low-strength concrete is relatively more confined by the steel tube than the TCCFST column model filled with high-strength concrete. The lower confinement factor for the test specimen provided by the steel tube is a direct consequence of the high concrete strength used in this research. Furthermore, a composite column with a higher ξ factor will have considerable ductile behavior, which was shown in [36]. Generally, the TCCFST column’s load-bearing capacity increases with a higher compressive strength of the infill concrete. It was shown that, when the confinement factor increases, the influence of the concrete strength on the coefficient of the enhanced strength, ks, decreases [1].
After the concluded experiments, the steel tube was partially removed from one chord of the TCCFST column to investigate the mode of failure and to note the cracking and/or crushing of the concrete fill. Figure 15a shows the TCCFST specimen with exposed concrete. Cracks in the concrete were only observed in the middle of the chord (Figure 15b). Before reaching the ultimate load, the column started to buckle, which was followed by an increase in side displacements in the middle of the column’s height. Due to the loss of stability, a second-order effect developed, and, in addition to the axial force, a bending moment occurred, which means that, instead of a pure compressive stress state in the chords, bending stresses formed. This failure mode is typical behavior for slender CFST columns, and the formation of a shear plane was not observed.
The strength of the TCCFST column models was defined through the bending failure that occurred in the planes where the normal stresses reached their maximum. Besides that, the steel tube reached the value of yielding stress and was no longer efficient in further confinement of the concrete. After that, cracks formed in the concrete, and side deformations were exaggerated, which led to the loss of the specimen’s capacity.
4. The Design Strength of TCCFST Members
The two-chord concrete-filled steel tube column was analyzed to validate whether the design codes developed for composite steel–concrete elements are suitable for TCCFST columns. The ultimate capacity of the TCCFST columns measured during the experiments was compared with the plastic capacity calculated using the guidelines of AISC 360-16 [21], Eurocode 4 (EC-4) [23], and DBJ/T13–51 [22] structural codes. The influence of global and local buckling on the sectional capacity of the composite steel–concrete columns was taken into account in predicting the column’s compressive strength. The capacity of the composite columns decreased with the strength reduction factor, which incorporates the influence of slenderness.
4.1. Axial Capacity
4.1.1. Eurocode 4
Eurocode 4 [23] ascribes the plastic capacity of axially loaded composite members using high-strength concrete to the confining stresses if the relative slenderness is . The axial strength of a CFST member (Nu,EC4) is defined as follows:
where D is the outer diameter, t is the wall thickness of the tube, and the correction factors for enhanced strength are and . The relative slenderness is determined from the characteristic value of a section’s plastic capacity, which is defined as , and from the critical buckling force , with the effective stiffness of a composite member cross-section being , where Ic and Is are the second moments of area of the filled concrete and the steel tube, respectively. Since Eurocode 4 is limited to concrete with a compressive strength between class C20/25 and class C50/60, in the presented study, the EC-4 method was expanded over the upper limit using the concrete strength reduction coefficient from Reference [37]. The effective compressive strength was determined as . With this approach, the cylinder’s compressive strength was decreased from fc = 95.2 N/mm2 to fc,eff = 73.6 N/mm2. The influence of the slenderness was included in coefficient χ and k = 0.7 [24]. The use of Eurocode 4 is also limited for steel with a yield strength between 235 N/mm2 and 460 N/mm2. In this research, the yield stress of 600 N/mm2 was used without any reduction.
4.1.2. AISC 360-16 Code
The AISC 360-16 [21] structural code defines the nominal capacity of axially compressed composite members with a doubly symmetric round and compact cross-section (Nnorm,AISC) as follows:
The limiting width-to-thickness ratio for the compact section in composite members subjected to an axial compressive force is set to . The interaction between the concrete infill and the steel tube is not considered by the standard. The design capacity is governed by the resistance factor , so that
where , while the critical buckling force is calculated with the effective flexural stiffness . Coefficient was calculated for the column used in the presented analysis. In the section for composite columns, AISC 360-16 allows for the usage of normal-weight concrete with a cylinder strength in the range of 21–70 N/mm2 and steel with a maximal yield strength of 525 N/mm2. The properties of the steel and concrete in the presented research were used without reduction.
4.1.3. DBJ/T13-51 Code
The DBJ/T13-51-2010 [22] structural code defines the plastic capacity of axially compressed concrete-filled steel columns with a circular section (Nu,DBJ) with the following expression:
where the slenderness coefficient can be obtained from the buckling curves defined in the code as a function of the steel ratio and the member’s slenderness. The total area of the cross-section is . The increase in the concrete compressive strength due to the confining stresses is included in the code in the confinement factor, ξ, which is defined using Equation (6), while the concrete’s characteristic compressive strength () is determined using Equation (7).
4.2. Discussion of the Results
The applicability of the three design codes in the analysis of the axial load-bearing strength of the TCCFST column was examined. Comparisons of the calculated (Nu,(code)) and the experimental ultimate forces (Nu,ex.) are presented in Table 5 as absolute force values and Nu,(code)/Nu,ex. ratios. Code AISC 360-16 gives the most conservative predictions mainly because of the relatively high resistance factor. Additionally, the code does not consider the enhanced concrete compressive strength induced by the steel tube. The average ratio of the forces Nu,AISC/Nu,ex. is 0.61. Eurocode 4 also yields conservative predictions, with the mean value of Nu,EC4/Nu,ex. = 0.80. It has to be noted that, although Eurocode 4 considers the enhanced material properties, because of the relative slenderness of , those properties are not used in calculations. Code DBJ/T13-51 gives the best forecasts of the results, with the average Nu,DBJ/Nu,ex. ratio of 1.06. The advantage of the DBJ/T13-51 code arises from the enhanced concrete compressive strength due to the confining effect provided by the steel tube.
The sectional capacities determined by the experimental and design code analysis are comparatively presented in Figure 16. Eurocode 4 and AISC 360-16 both gave conservative predictions, which were well over the 10% limits, while the DBJ/T13-51 code gave a very good prediction.
The bearing capacity and deformational behavior of CFST columns greatly depend on the value of the relative strength ratio, ξ, which was also noted by Han et al. [33] and Chen et al. [35]. The improved concrete compressive strength in the CFST member is less obvious as the concrete compressive strength increases because high-strength concrete exhibits stiffer behavior than regular-strength concrete (Figure 14).
In the presented analysis, it can be seen that the mentioned design codes can be used to determine the compressive ultimate axial force of the TCCFST column. The summation of the concrete and steel strengths is used in the design codes to calculate the plastic sectional resistance of the TCCFST columns. This approach provides a reasonable estimation of the column’s load-bearing capacity, among which the code DBJ/T13-51-2010 gives the best predictions. An additional investigation is needed to predict the ductile response of steel–concrete composite members, which is often misjudged. Further analysis could include the improved strength of the concrete under different values of the confinement factor provided by the steel tube and the analysis of TCCFST columns made from steel tubes with different cross-section classes.
5. Numerical Modeling
5.1. FEM Model
A simulation of the tested specimens was conducted utilizing the finite element method (FEM) using ANSYS Mechanical R17.0 software. The modeling included the nonlinear behavior of the steel and the concrete, the contact of the concrete fill with the steel tube, and the global buckling of the specimen using initial imperfections. The steel tubes, the concrete infill, and the top and bottom rigid plates of the TCCFST column were modeled. Using symmetry conditions allowed for only one-half of the model to be simulated (Figure 17a). The concrete infill was modeled with the SOLID65 element, while the steel elements, which included the cords, the battens, and the upper and the lower loading rigid plates, were simulated using the SOLID181 element. The interaction between the concrete infill and the steel parts of the column was modeled using the contact elements CONTA174 and TARGE170. The contact of the concrete core with the bearing plates and with the inner part of the steel tube was simulated as a frictional connection with a friction coefficient of 0.7. All other connections between the column parts were modeled as bonded contact to simulate fully welded connections.
The FEM model consisted of 179163 elements with 64227 nodes. The quality of the mesh was tested in order to optimize the accuracy of the solution with computational time. The concrete was modeled with 10 mm elements, while the load-bearing plates were modeled with 8 × 8 × 5 mm elements. Since the geometry of the steel chords and battens was complex, the adaptive mesh size was applied. Two or three layers of solid finite elements were used to model the wall thickness of the steel chord and batten tubes to evade any issues with the computational stability of the solution (Figure 17b). The boundary conditions included the suppression of all degrees of movement and rotation for the lower bearing plate (ux = uy = uz = 0 and φx = φy = φz = 0), while the upper bearing plate was only free to move in the y-direction (ux = uz = 0 and φx = φy = φz = 0). Movement u and rotation φ are the model’s degrees of freedom in the global coordinate system. The force imposed on the specimen during the experiment was applied to the FEM model over the top bearing plate as a 1 MN concentric force in the direction of the y-axis. A linear buckling analysis was used to define the initial geometrical imperfections of the model, and a scale factor of L/1000 was applied as a multiplier for the first modal shape. The results were used to simulate the deformed geometry of the model. Because of the expected significant deflections of the model, a nonlinear response was simulated with a large deflection behavior employing the arc-length control and the full Newton–Raphson option. Since the stiffness matrix becomes asymmetrical when a coefficient of friction is applied, an unsymmetrical solver was used in the simulations [38].
5.2. Material Models for Steel and Concrete
An interaction between the concrete and steel tube can develop in CFST columns subjected to axial compressive force, and, due to the confinement effect provided by the steel tube, the concrete will have increased compressive strength. Tensile hoop stress will develop in the steel tube, which will lead to a reduction in the load-bearing capacity in the axial direction [39]. The confining stresses will change during the loading process, and local buckling of the steel tube’s wall can also occur; all of these affect the interaction between the concrete infill and the steel tube. The mutual influence of the mentioned factors is fairly complex and must be considered in the modeling of the material’s response.
The steel tube was modeled as an elastic–plastic model with a strain-hardening effect. The elastic characteristics of the steel are presented in Table 3, while the plastic characteristics were defined as a multilinear isotropic function. The stress–strain curve is shown in Figure 18a. The load-bearing plates were also modeled as a steel material model considering only linear elastic properties.
The calculation model for concrete requires a definition of the linear and multilinear isotropic properties [40]. In CFST columns, the steel tube provides the confinement necessary for an increase in the compressive strength and ductility of the concrete [2,41]. The confinement of concrete is passive in nature and relatively difficult to reflect. The confinement factor, ξ, is often used to quantify the intensity of the concrete confinement [2]. The model used in this study was developed in [42,43]. The compressive part of the stress–strain curve of the concrete in the steel tube was determined via
where coefficient is defined as . The strength of the confined concrete and the corresponding strain are and , respectively. The residual stress is , while and are coefficients of the stress–strain curve. The increased concrete compressive strength due to the confinement effect was determined as follows:
with the limits of the stress ratio . The value of stress is set in MPa.
The strain that corresponds to is defined in the micro-strains as follows:
The residual strength of the confined concrete is
Coefficient , which describes the ascending part of the stress–strain curve, is defined as
where correction coefficient with a value ranging from 1 to 1.3 is calculated via
Coefficient defines the shape of the descending part of the stress–strain curve:
The compressive strength of the concrete used in the experiments was determined with the enhanced strength of the concrete due to the confining effect. The stress vs. strain relationship is shown in Figure 18b. In the presented FEM analysis, the negative slope of the stress–strain curve was omitted to avoid convergence issues [44]. Poisson’s ratio was 0.22, while the modulus of elasticity for the concrete was calculated as , where and are the initial strength of the confined concrete and the corresponding strain.
The tensile part of the stress–strain diagram was modeled as a linear relationship. The concrete’s tensile strength, , was calculated from the split cylinder tensile strength, , as presented in [42]. For concrete without added silica fume, the tensile strength is
5.3. Verification Study
The results of the numerical analysis were compared with the results obtained from the conducted experiments to validate the accuracy of the FEM model, similarly as in [44]. The factors explored in the analysis included normal, shear, and equivalent strains and stresses; deformations in global axis directions; and reaction forces. The columns’ bearing capacities obtained from the numerical analysis (Nu,FEM) are presented in Table 5. The FEM result matched the peak load from the experimental study with the ratio Nu,FEM/Nu,e = 1.01. It has to be noted that the forces from the FEM analysis must be doubled since only half of the column was modeled. A comparison between the curves for load (N) vs. axial shortening (Δℓ) and load vs. lateral displacements (Um) is presented in Figure 19a. The numerical results showed a good agreement with the experimental results. The initial stiffness of the FEM model was to some extent higher because the ANSYS model did not consider the column’s geometric imperfections, an effect that is often present in experimental results [45]. The total deformations of the finite element model presented in Figure 19b are obtained from the FEM analysis at the last converged load step. Figure 19b compares the predicted and experimental failure modes of the column. The FEM model was found to have good predictions in terms of overall strength and buckling.
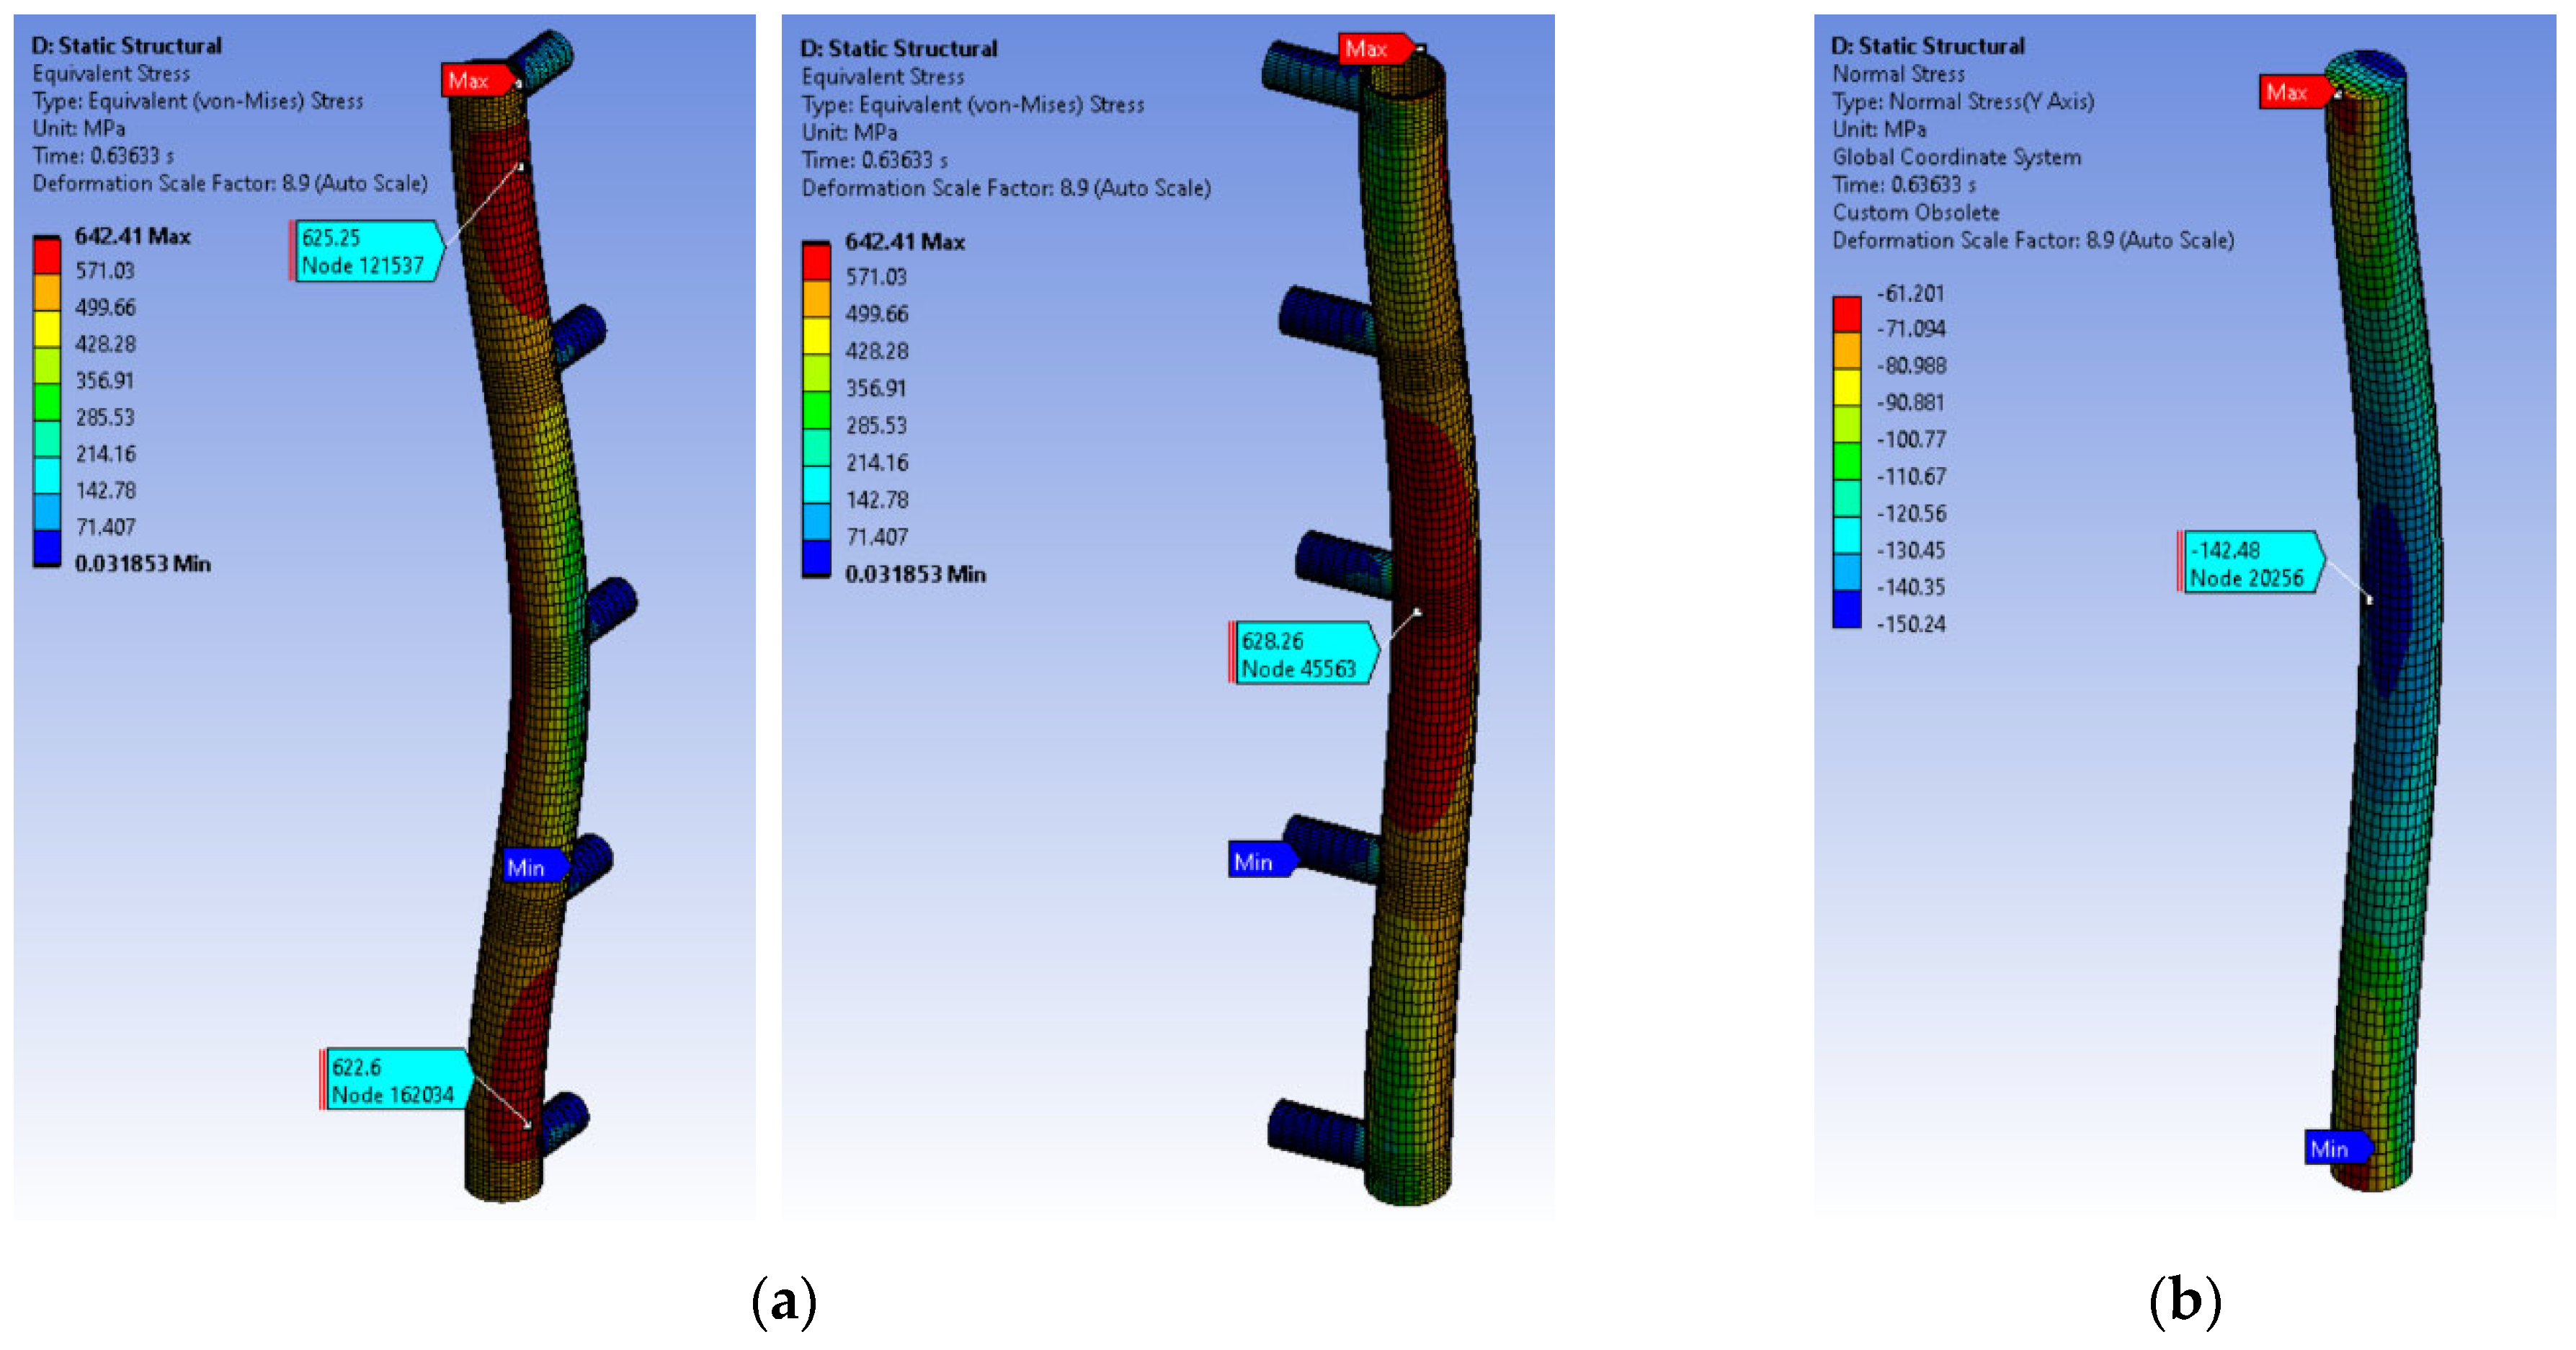
In order to compare the failure mode between the FEM and experimental results, von Mises stresses were developed, and they are presented in Figure 20a. The maximal value of stress in steel is equal to the ultimate stress , while in large areas on both ends and the middle of the chord, stresses are higher than the yield stress value. From these results, it could be concluded that failure of the steel occurred. The compressive normal stresses in the concrete infill are shown in Figure 20b. The maximal value of the stress at the peak load was lower than the enhanced compressive strength of the concrete . This observation could indicate that the strength of the concrete was not entirely exploited. However, because the yielding of the steel started, the concrete could not be efficiently confined anymore, and it was reduced to its regular strength . After that, the crushing of the concrete started, and the column failed. The collapse of the TCCFST column model occurred as a combination of steel yielding, global buckling, and concrete crushing.
6. Conclusions
The following conclusions were drawn based on the test parameter ranges:
- (1)
- In this research, steel with a 600 N/mm2 yield stress was used in combination with concrete with a cylinder compressive strength of 95 N/mm2. During the experiments, both materials reached their maximum strength at approximately the same strain level; thus, the full potential of the high-strength steel and the high-strength concrete was utilized.
- (2)
- The load-bearing capacity of the hollow two-chord columns improved by around 1.74 times due to the concrete infill, while the presence of the concrete infill in the chords increased the slenderness of the column by 16%.
- (3)
- The filled specimens exhibited a stiffer behavior than and a similar deformational capacity to the hollow steel tube column models. The failure of the column models occurred as a result of the global buckling of the chords, the crushing of the filled concrete, and steel yielding.
- (4)
- A load distribution analysis indicated that composite action between all cross-section parts was achieved. It was observed that 36% of the load was carried by the concrete, while 64% of the load was carried by the steel tube.
- (5)
- A hoop stress effect was registered in the steel tube; i.e., a plane state of stress was formed, which led to the enhanced properties of the concrete due to the confining effect provided by the steel tube.
- (6)
- The behavior of the TCCFST column could be divided into two parts, mainly the behavior before and after reaching the yield stress of the steel tube. In the first part, the structural response of the column was linear, and, after reaching the yield stress, the buckling of the chords occurred.
- (7)
- All three analyzed structural codes gave relatively good forecasts of the axial compressive capacity of the TCCFST column. The Eurocode 4 and AISC 360 predictions were proven to be underestimated. The DBJ/T13-51 design code gave the best predictions and, thus, could be recommended for the calculation of the design strength of TCCFST columns.
- (8)
- A numerical analysis can be successfully applied if the appropriate material models are correctly entered into the FEM model. The FEM model showed good predictions of strength, stresses, deformations, and buckling.
The validity of the presented research is limited to TCCFST columns with a nominal slenderness of around 30, as well as to the high-strength steel and high-strength concrete with the full strain compatibility. Further research is required on the material and geometric properties of TCCFST so that the validity of the DBJ/T13-51 predictions can be verified.
Author Contributions
Conceptualization, M.B. and J.K.-S.; methodology, M.B.; software, A.L.; validation, M.B., A.L. and A.Č.; formal analysis, J.K.-S.; investigation, J.K.-S.; resources, J.K.-S.; data curation, J.K.-S. and A.L.; writing—original draft preparation, A.L.; writing—review and editing, A.L. and A.Č.; visualization, A.L.; supervision, M.B.; project administration, J.K.-S.; funding acquisition, J.K.-S. and A.Č. All authors have read and agreed to the published version of the manuscript.
Funding
This research was funded by The Provincial Secretariat for Higher Education and Scientific Research, Autonomous Province of Vojvodina, Republic of Serbia (Project No. 142-451-2640/2021-01).
Institutional Review Board Statement
Not applicable.
Informed Consent Statement
Not applicable.
Data Availability Statement
The data that support the findings of this study are available from the corresponding author upon reasonable request. The data are not publicly available because they are part of the ongoing doctoral research of the first author.
Acknowledgments
For support in the realization of the experimental research, the authors are thankful to their colleagues from the Laboratory for Material and Structure Testing at the Faculty of Civil Engineering Subotica, University of Novi Sad, Republic of Serbia.
Conflicts of Interest
The authors declare no conflict of interest.
Abbreviations
A list of the used abbreviations.
| RC | reinforced concrete |
| CFST | concrete-filled steel tube |
| TCHST | two-chord hollow steel tube |
| TCCFST | two-chord concrete-filled steel tube |
| DT | displacement transducer |
| SG | strain gauge |
| COV | coefficient of variation |
| EC | Eurocode |
| FEM | finite element method |
References
- Landović, A.; Bešević, M. Experimental Research on Reinforced Concrete Columns Strengthened with Steel Jacket and Concrete Infill. Appl. Sci. 2021, 11, 4043. [Google Scholar] [CrossRef]
- Han, L.H.; Li, W.; Bjorhovde, R. Developments and advanced applications of concrete filled steel tubular (CFST) structures: Members. J. Constr. Steel Res. 2014, 100, 211–228. [Google Scholar] [CrossRef]
- Ellobody, E.; Young, B.; Lam, D. Behaviour of normal and high strength concrete-filled compact steel tube circular stub columns. J. Constr. Steel Res. 2006, 62, 706–715. [Google Scholar] [CrossRef]
- Kawano, A.; Matsui, C.; Sakino, Y. An experimental study on the elasto-plastic behavior and deformability of concrete-filled tubular truss beam-columns under cyclic loading. J. Struct. Constr. Eng. Archit. Inst. Jpn. 1996, 482, 141–150. (In Japanese) [Google Scholar] [CrossRef] [PubMed]
- Kawano, A.; Matsui, C. The deformation capacities of parallel chord trusses with concrete filled tubular chords. J. Struct. Constr. Eng. Archit. Inst. Jpn. 1999, 522, 129–135. (In Japanese) [Google Scholar] [CrossRef]
- Kawano, A.; Sakino, Y. Seismic resistance of CFT trusses. Eng. Struct. 2003, 25, 607–619. [Google Scholar] [CrossRef]
- Ou, Z.; Chen, B.; Hsieh, K.H.; Halling, M.W.; Barr, P.J. Experimental and analytical investigation of concrete filled steel tubular columns. J. Struct. Eng. 2011, 137, 635–645. [Google Scholar] [CrossRef]
- Yang, Y.-F.; Liu, M.; Fu, F. Experimental and numerical investigation on the performance of three-legged CFST latticed columns under lateral cyclic loadings. Thin-Walled Struct. 2018, 132, 176–194. [Google Scholar] [CrossRef]
- Yang, Y.-F.; Liu, M.; Hou, C.; Bie, X.-M. Behaviour of four-legged square CFST latticed members under lateral cyclic loading. J. Constr. Steel Res. 2019, 156, 54–74. [Google Scholar] [CrossRef]
- Zheng, L.-Q.; Li, G.-H.; Zhou, J.-Z.; Wang, Z.-Z. Behavior of three-chord concrete-filled steel tube built-up columns subjected to eccentric compression. J. Constr. Steel Res. 2021, 177, 106435. [Google Scholar] [CrossRef]
- Yuan, H.-H.; She, Z.-M.; Wu, Q.-X.; Huang, Y.-F. Experimental and parametric investigation on elastoplastic seismic response of CFST battened built-up columns. Soil Dyn. Earthq. Eng. 2021, 145, 106726. [Google Scholar] [CrossRef]
- Yuan, H.-H.; Wu, Q.-X.; Huang, Y.-F. Experimental and theoretical studies on the seismic performance of CFST battened built-up column piers. Eng. Struct. 2020, 206, 110099. [Google Scholar] [CrossRef]
- Chen, L.; Zuo, R.; Zhang, Y.; Yang, D.; Li, J.; Wu, Z.; Ji, X. Study on Seismic Performance Optimization of Assembly Concrete-Filled Steel Tubular (CFST)-Laced Piers. Sustainability 2023, 15, 8318. [Google Scholar] [CrossRef]
- Javidan, F.; Heidarpour, A.; Zhao, X.-L.; Minkkinen, J. Application of high strength and ultra-high strength steel tubes in long hybrid compressive members: Experimental and numerical investigation. Thin-Walled Struct. 2016, 102, 273–285. [Google Scholar] [CrossRef]
- Nassirnia, M.; Heidarpour, A.; Zhao, X.-L.; Minkkinen, J. Innovative hollow corrugated columns comprising corrugated plates and ultra high-strength steel tubes. Thin-Walled Struct. 2016, 101, 14–25. [Google Scholar] [CrossRef]
- Luo, Y.; Zhao, Y.; Chen, Y.; Lin, X.; Yan, J. Experimental Studies on Seismic Performance of UHPSFRC-Filled Square Steel Tubular Columns. Buildings 2022, 12, 798. [Google Scholar] [CrossRef]
- Wei, J.; Xie, Z.; Zhang, W.; Yang, Y.; Luo, X.; Chen, B. Axial compressive property of UHPC plate-CFST laced composite columns. Case Stud. Constr. Mater. 2022, 16, e01085. [Google Scholar] [CrossRef]
- Guo, Y.; Wang, J. Instability behavior and application of prismatic multi-tube latticed steel column. J. Constr. Steel Res. 2009, 65, 12–22. [Google Scholar] [CrossRef]
- Xu, M.; Zhou, T.; Chen, Z.; Li, Y.; Bisby, L. Experimental study of slender LCFST columns connected by steel linking plates. J. Constr. Steel Res. 2016, 127, 231–241. [Google Scholar] [CrossRef]
- Zhou, T.; Chen, Z.; Liu, H. Seismic behavior of special shaped column composed of concrete filled steel tubes. J. Constr. Steel Res. 2012, 75, 131–141. [Google Scholar] [CrossRef]
- AISC 360-16; Specification for Structural Steel Buildings. American Institute of Steel Construction: Chicago, IL, USA, 2016.
- DBJ/T13-51-2010; Technical Specification for Concrete-Filled Steel Tubular Structures. The Construction Department of Fujian Province: Fuzhou, China, 2010. (In Chinese)
- EN 1994-1-1; Eurocode 4: Design of Composite Steel and Concrete Structures. Part 1–1: General Rules and Rules for Buildings. Comité Européen de Normalisation (CEN): Brussels, Belgium, 2004.
- AS5100.6-2004; Bridge Design, Part 6: Steel and Composite Construction. Standards Australia: Sydney, Australia, 2004.
- SRPS EN 12390-1; Testing Hardened Concrete—Part 1: Shape, Dimensions and Other Requirements for Specimens and Moulds. Institute for Standardization of Serbia: Belgrade, Serbia, 2021.
- SRPS EN 12390-2; Testing Hardened Concrete—Part 2: Making and Curing Specimens for Strength Tests. Institute for Standardization of Serbia: Belgrade, Serbia, 2019.
- SRPS EN 12390-3; Testing Hardened Concrete—Part 3: Compressive Strength of Test Specimens. Institute for Standardization of Serbia: Belgrade, Serbia, 2019.
- SRPS EN 12390-5; Testing Hardened Concrete—Part 5: Flexural Strength of Test Specimens. Institute for Standardization of Serbia: Belgrade, Serbia, 2019.
- SRPS EN 12390-7; Testing Hardened Concrete—Part 7: Density of Hardened Concrete. Institute for Standardization of Serbia: Belgrade, Serbia, 2019.
- SRPS EN ISO 6892-1; Metallic Materials—Tensile Testing—Part 1: Method of Test at Room Temperature. Institute for Standardization of Serbia: Belgrade, Serbia, 2019.
- EN 1993-1-1; Eurocode 3: Design of Steel Structures. Part 1-1: General Rules and Rules for Buildings. Comité Européen de Normalisation (CEN): Brussels, Belgium, 2005.
- Han, L.-H.; Liu, W.; Yang, Y.-F. Design calculations on concrete-filled thin-walled steel tubes subjected to axially local compression. In Proceedings of the 12th International Symposium on Tubular Structures, Shanghai, China, 8–10 October 2008; pp. 85–91. [Google Scholar]
- Han, L.H.; Zhao, X.L.; Tao, Z. Tests and mechanics model of concrete filled SHS stub columns, columns and beam-columns. Steel Compo. Struct. 2001, 1, 51–74. [Google Scholar] [CrossRef]
- Yang, Y.F.; Han, L.H. Experiments on rectangular concrete-filled steel tubes loaded axially on a partially stressed cross-sectional area. J. Constr. Steel Res. 2009, 65, 1617–1630. [Google Scholar] [CrossRef]
- Chen, B.; Lai, Z.; Yan, Q.; Varma, A.H.; Yu, X. Experimental behavior and design of CFT-RC short columns subjected to concentric axial loading. J. Struct. Eng. 2017, 143, 04017148. [Google Scholar] [CrossRef]
- Hoang, A.L.; Fehling, E. A review and analysis of circular UHPC filled steel tube columns under axial loading. Struct. Eng. Mech. 2017, 61, 417–430. [Google Scholar] [CrossRef]
- Chiew, S.P.; Cai, Y.Q. Design of High Strength Steel Reinforced Concrete Columns: A Eurocode 4 Approach; CRC Press: Boca Raton, FL, USA; Taylor & Francis Group: Boca Raton, FL, USA, 2018; ISBN 978-0815384601. [Google Scholar]
- ANSYS Inc. ANSYS Theory Reference; ANSYS Inc.: Canonsburg, PA, USA, 2016. [Google Scholar]
- Lai, Z.; Varma, A.H. Effective stress-strain relationships for analysis of noncompact and slender filled composite (CFT) members. Eng. Struct. 2016, 124, 457–472. [Google Scholar] [CrossRef]
- Shaker, F.M.F.; Daif, M.S.; Deifalla, A.F.; Ayash, N.M. Parametric Study on the Behavior of Steel Tube Columns with Infilled Concrete—An Analytical Study. Sustainability 2022, 14, 14024. [Google Scholar] [CrossRef]
- Liew, J.Y.R.; Xiong, D.X. Ultra-high strength concrete filled composite columns for multi-storey building construction. Adv. Struct. Eng. 2012, 15, 1487–1503. [Google Scholar] [CrossRef]
- Samani, A.K.; Attard, M.M. A stress-strain model for uniaxial and confined concrete under compression. Eng. Struct. 2012, 41, 335–349. [Google Scholar] [CrossRef]
- Katwal, U.; Tao, Z.; Hassan, K.; Wang, W.-D. Simplified Numerical Modeling of Axially Loaded Circular Concrete-Filled Steel Stub Columns. J. Struct. Eng. 2017, 143, 04017169. [Google Scholar] [CrossRef]
- Nwankwo, C.O.; Ede, A.N. Flexural strengthening of reinforced concrete beam using a natural fibre reinforced polymer laminate: An experimental and numerical study. Mater. Struct. 2020, 53, 142. [Google Scholar] [CrossRef]
- Milašinović, D.D.; Landović, A. Rheological-dynamic model for load-bearing capacity of composite columns due to concrete core failure. Mater. Struct. 2023, 56, 75. [Google Scholar] [CrossRef]
Figure 1.
Dimensions of column models (a); filling of the chords with fresh concrete (b).

Figure 2.
Stress−strain curves for concrete in compression (a); test prism (b).

Figure 3.
Representative tensile stress−strain curve for steel (a); test specimens (b).

Figure 4.
The instrument arrangement (a); specimen SC-21 before testing (b).
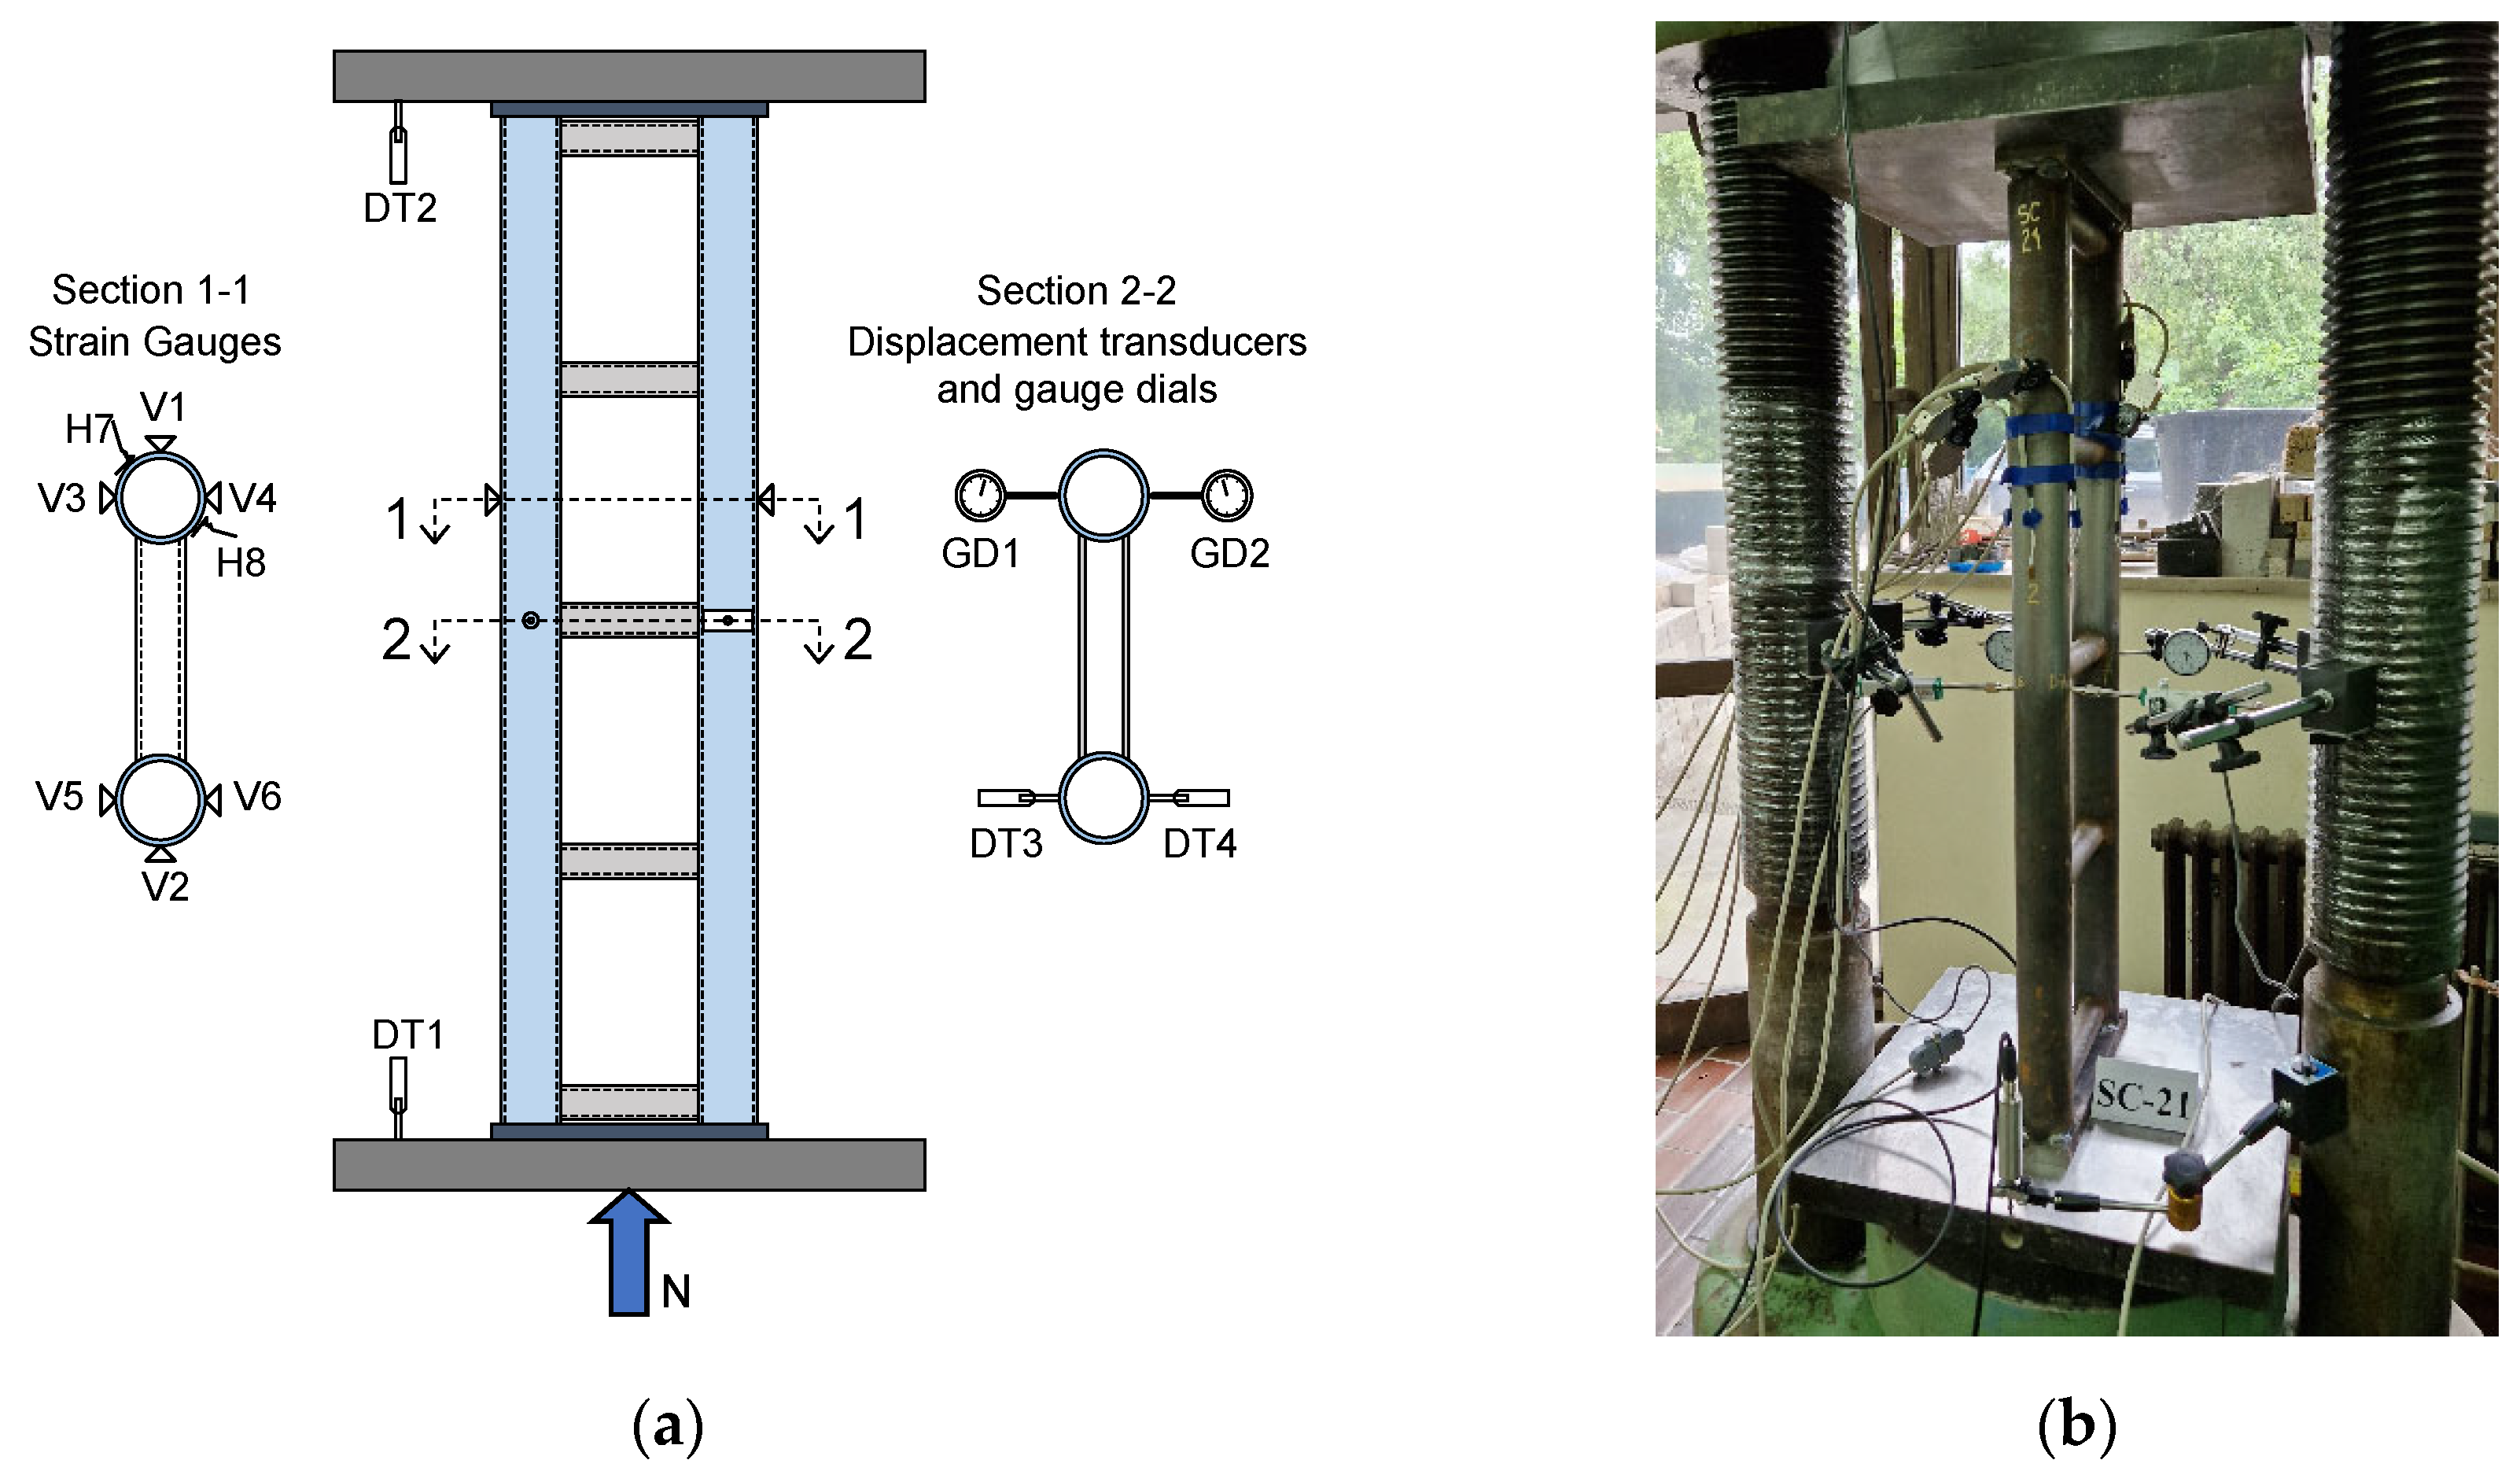
Figure 5.
Strains vs. axial load (a); deformations vs. axial force (b) for hollow steel tube specimens.
Figure 5.
Strains vs. axial load (a); deformations vs. axial force (b) for hollow steel tube specimens.

Figure 6.
Failure modes of hollow built-up column S-21 (a) and column S-22 (b).
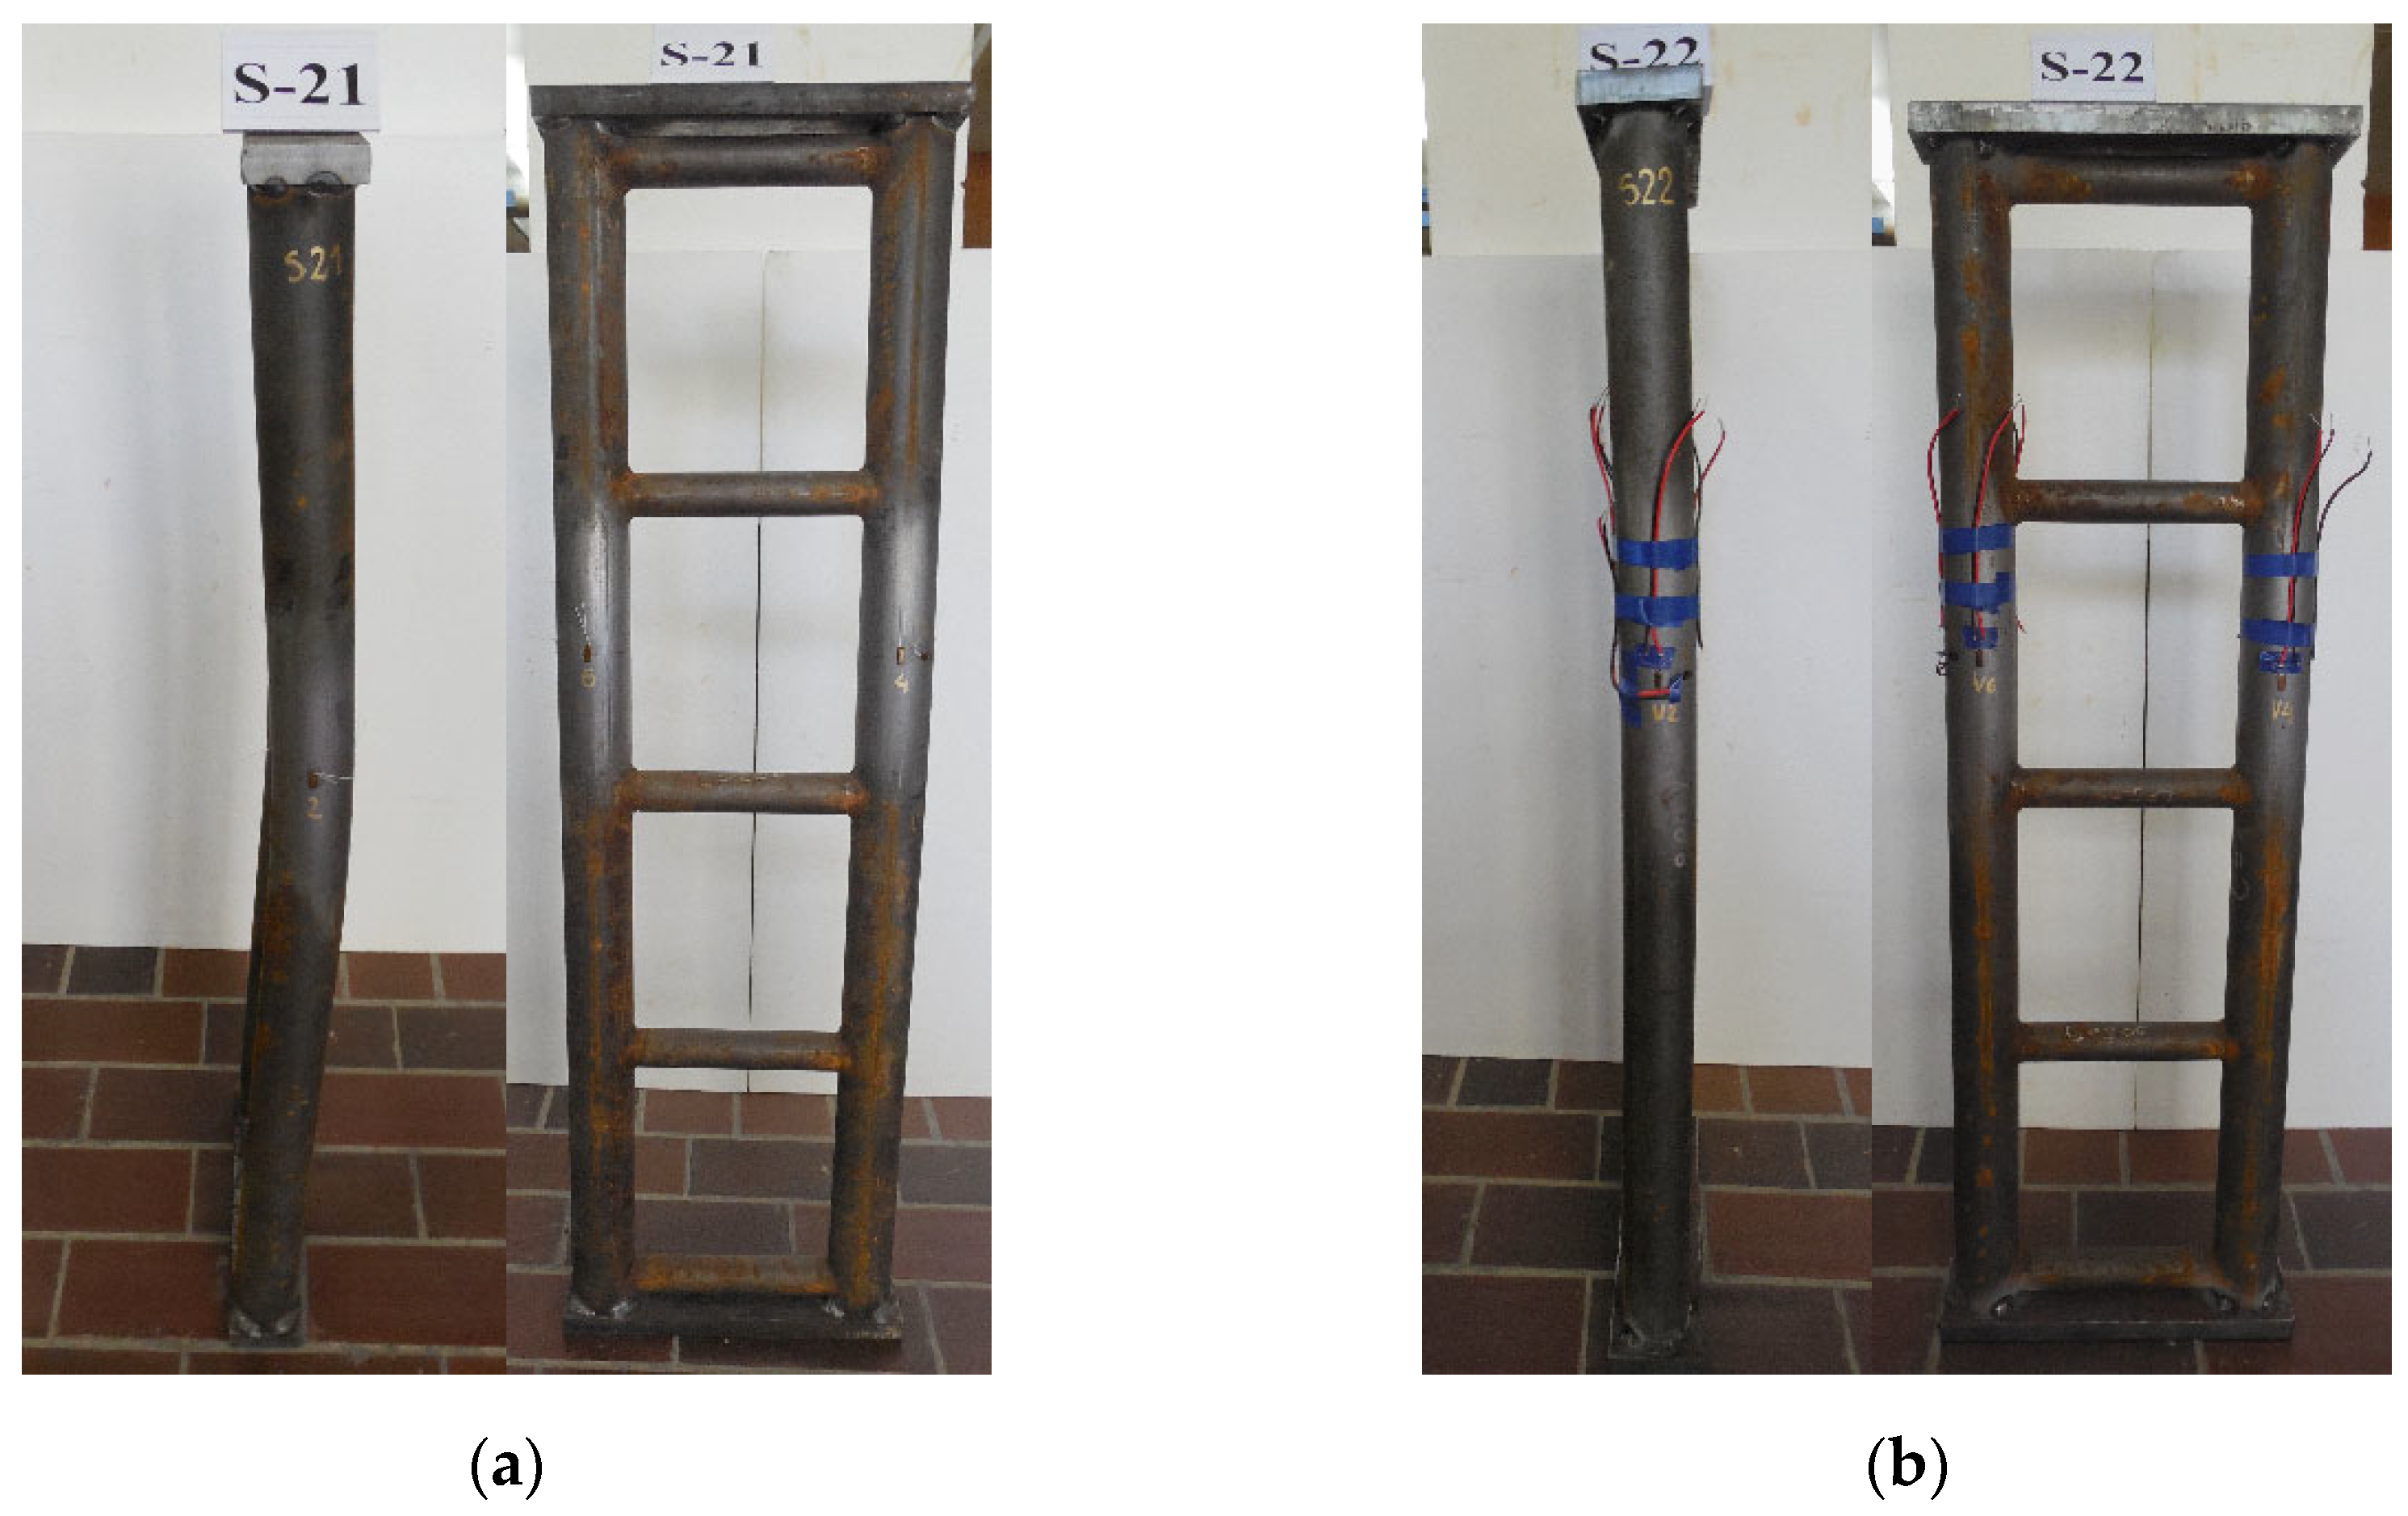
Figure 7.
Measured strains vs. axial load for the filled specimens.
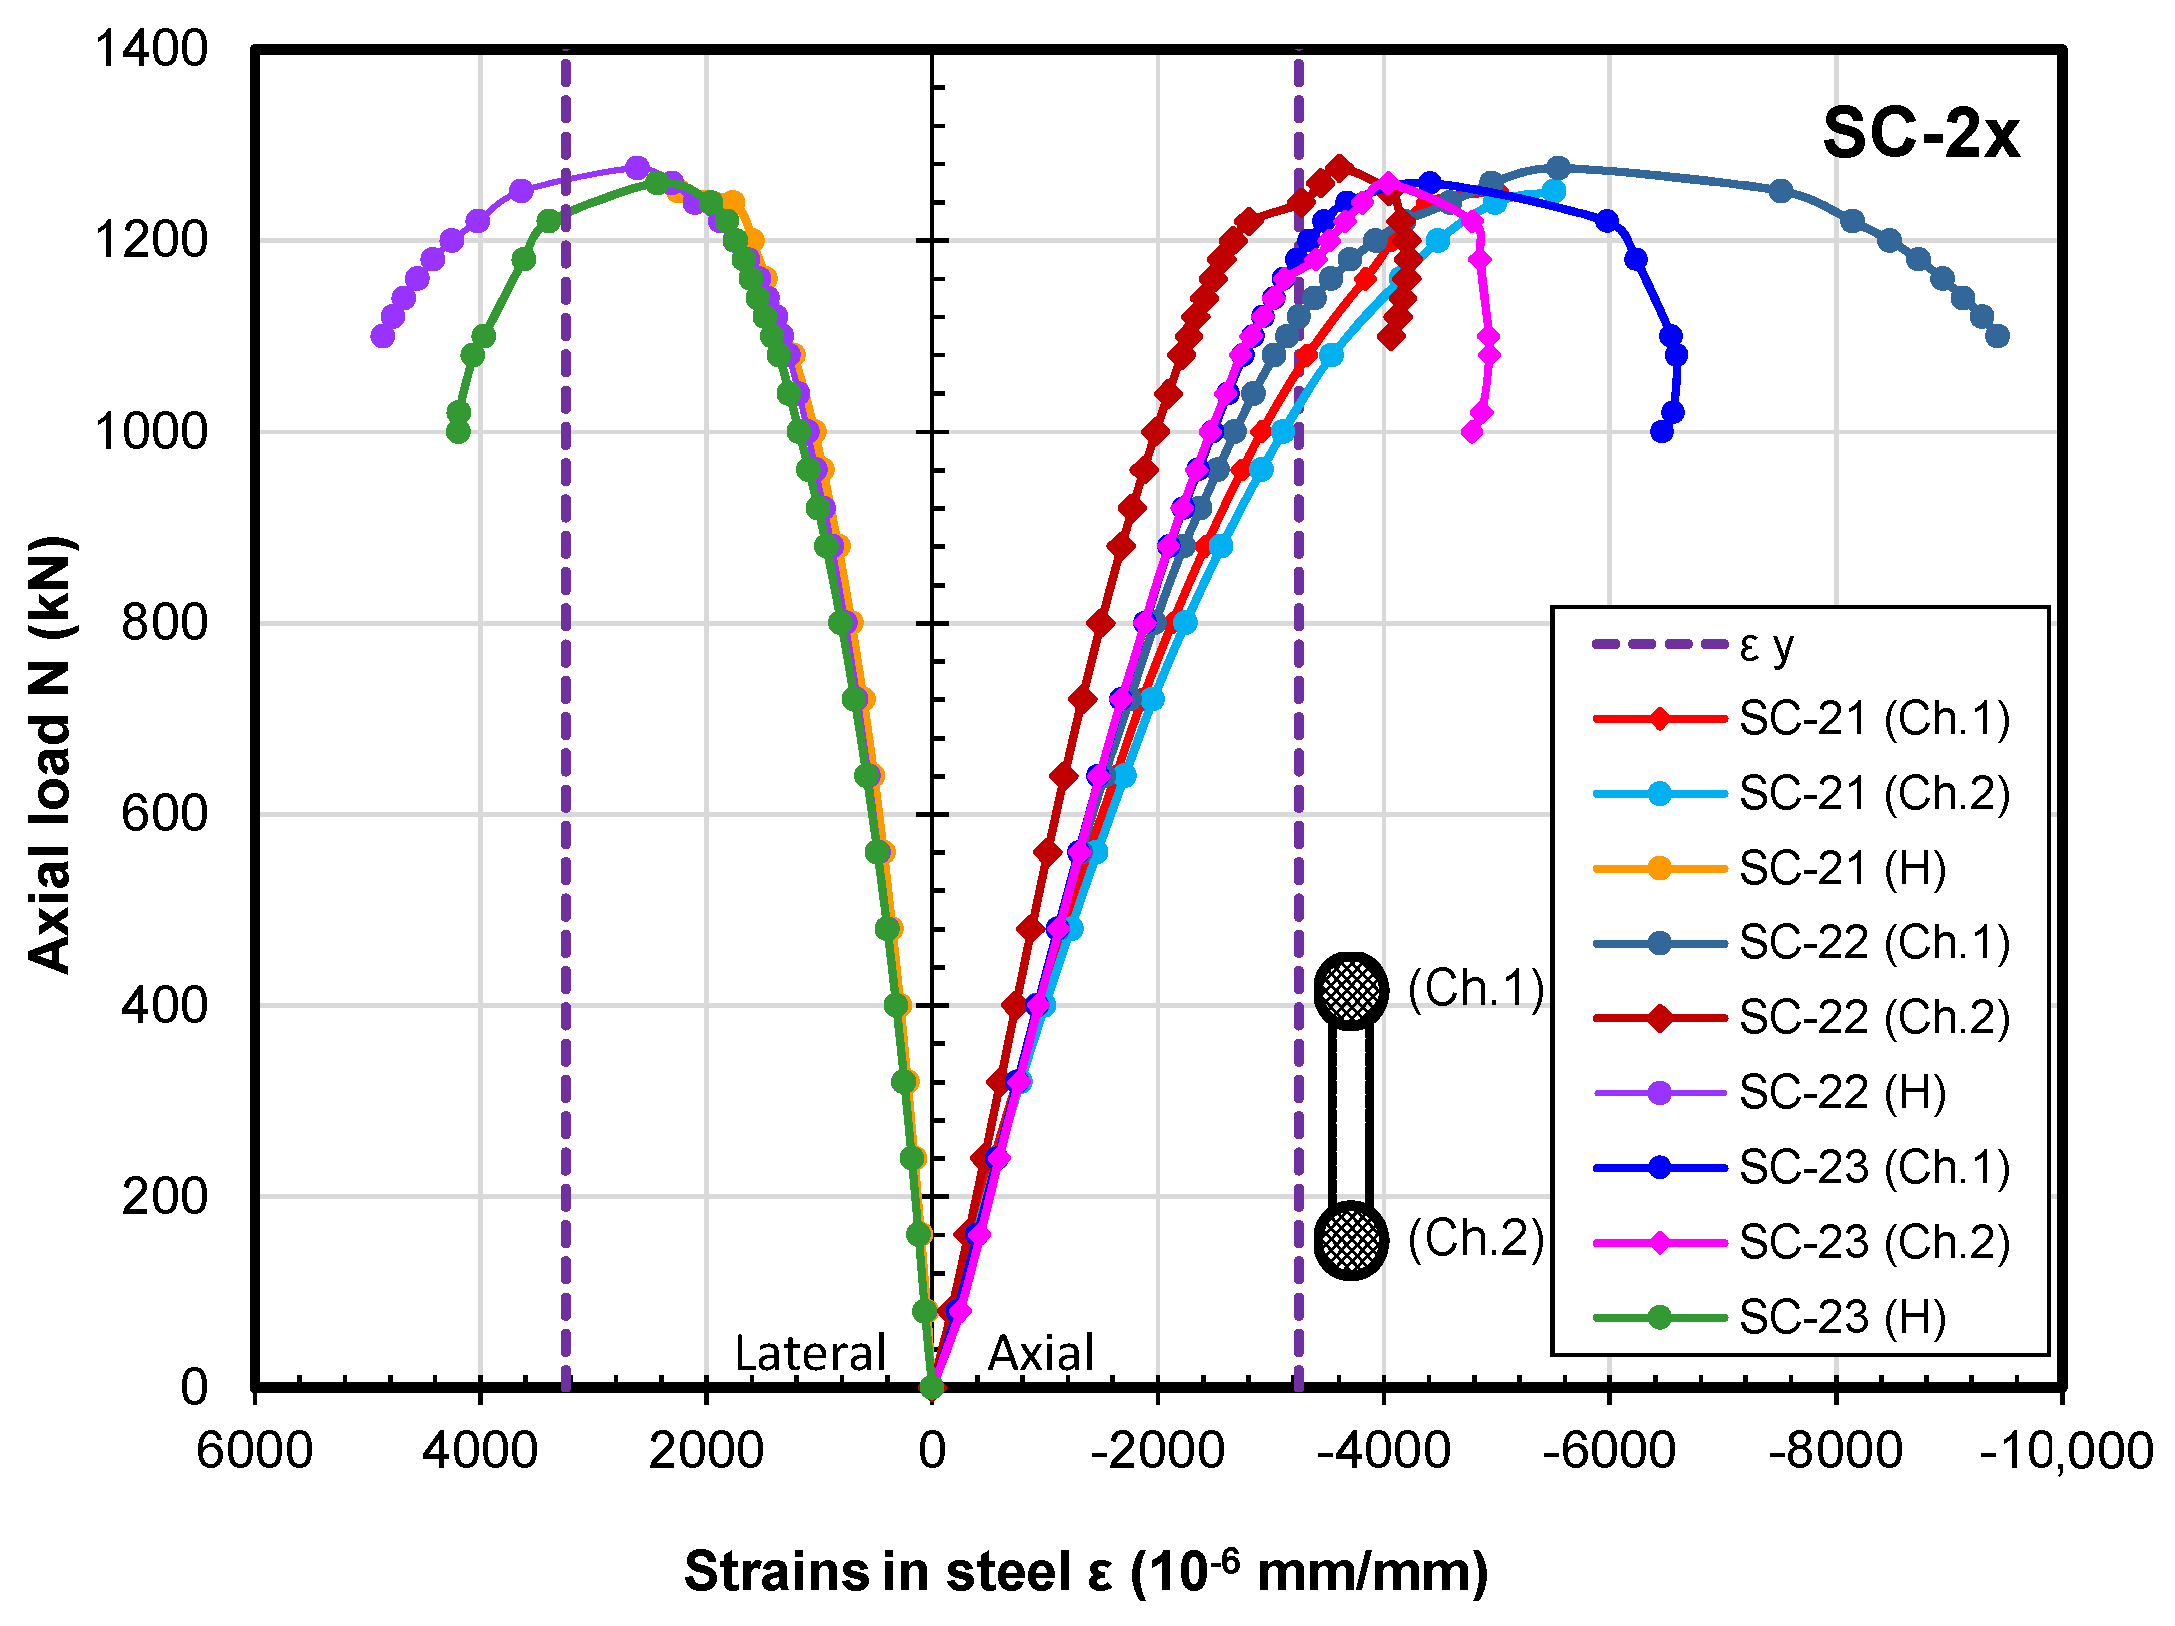
Figure 8.
Measured axial load versus deformations of concrete-filled steel tube specimens.
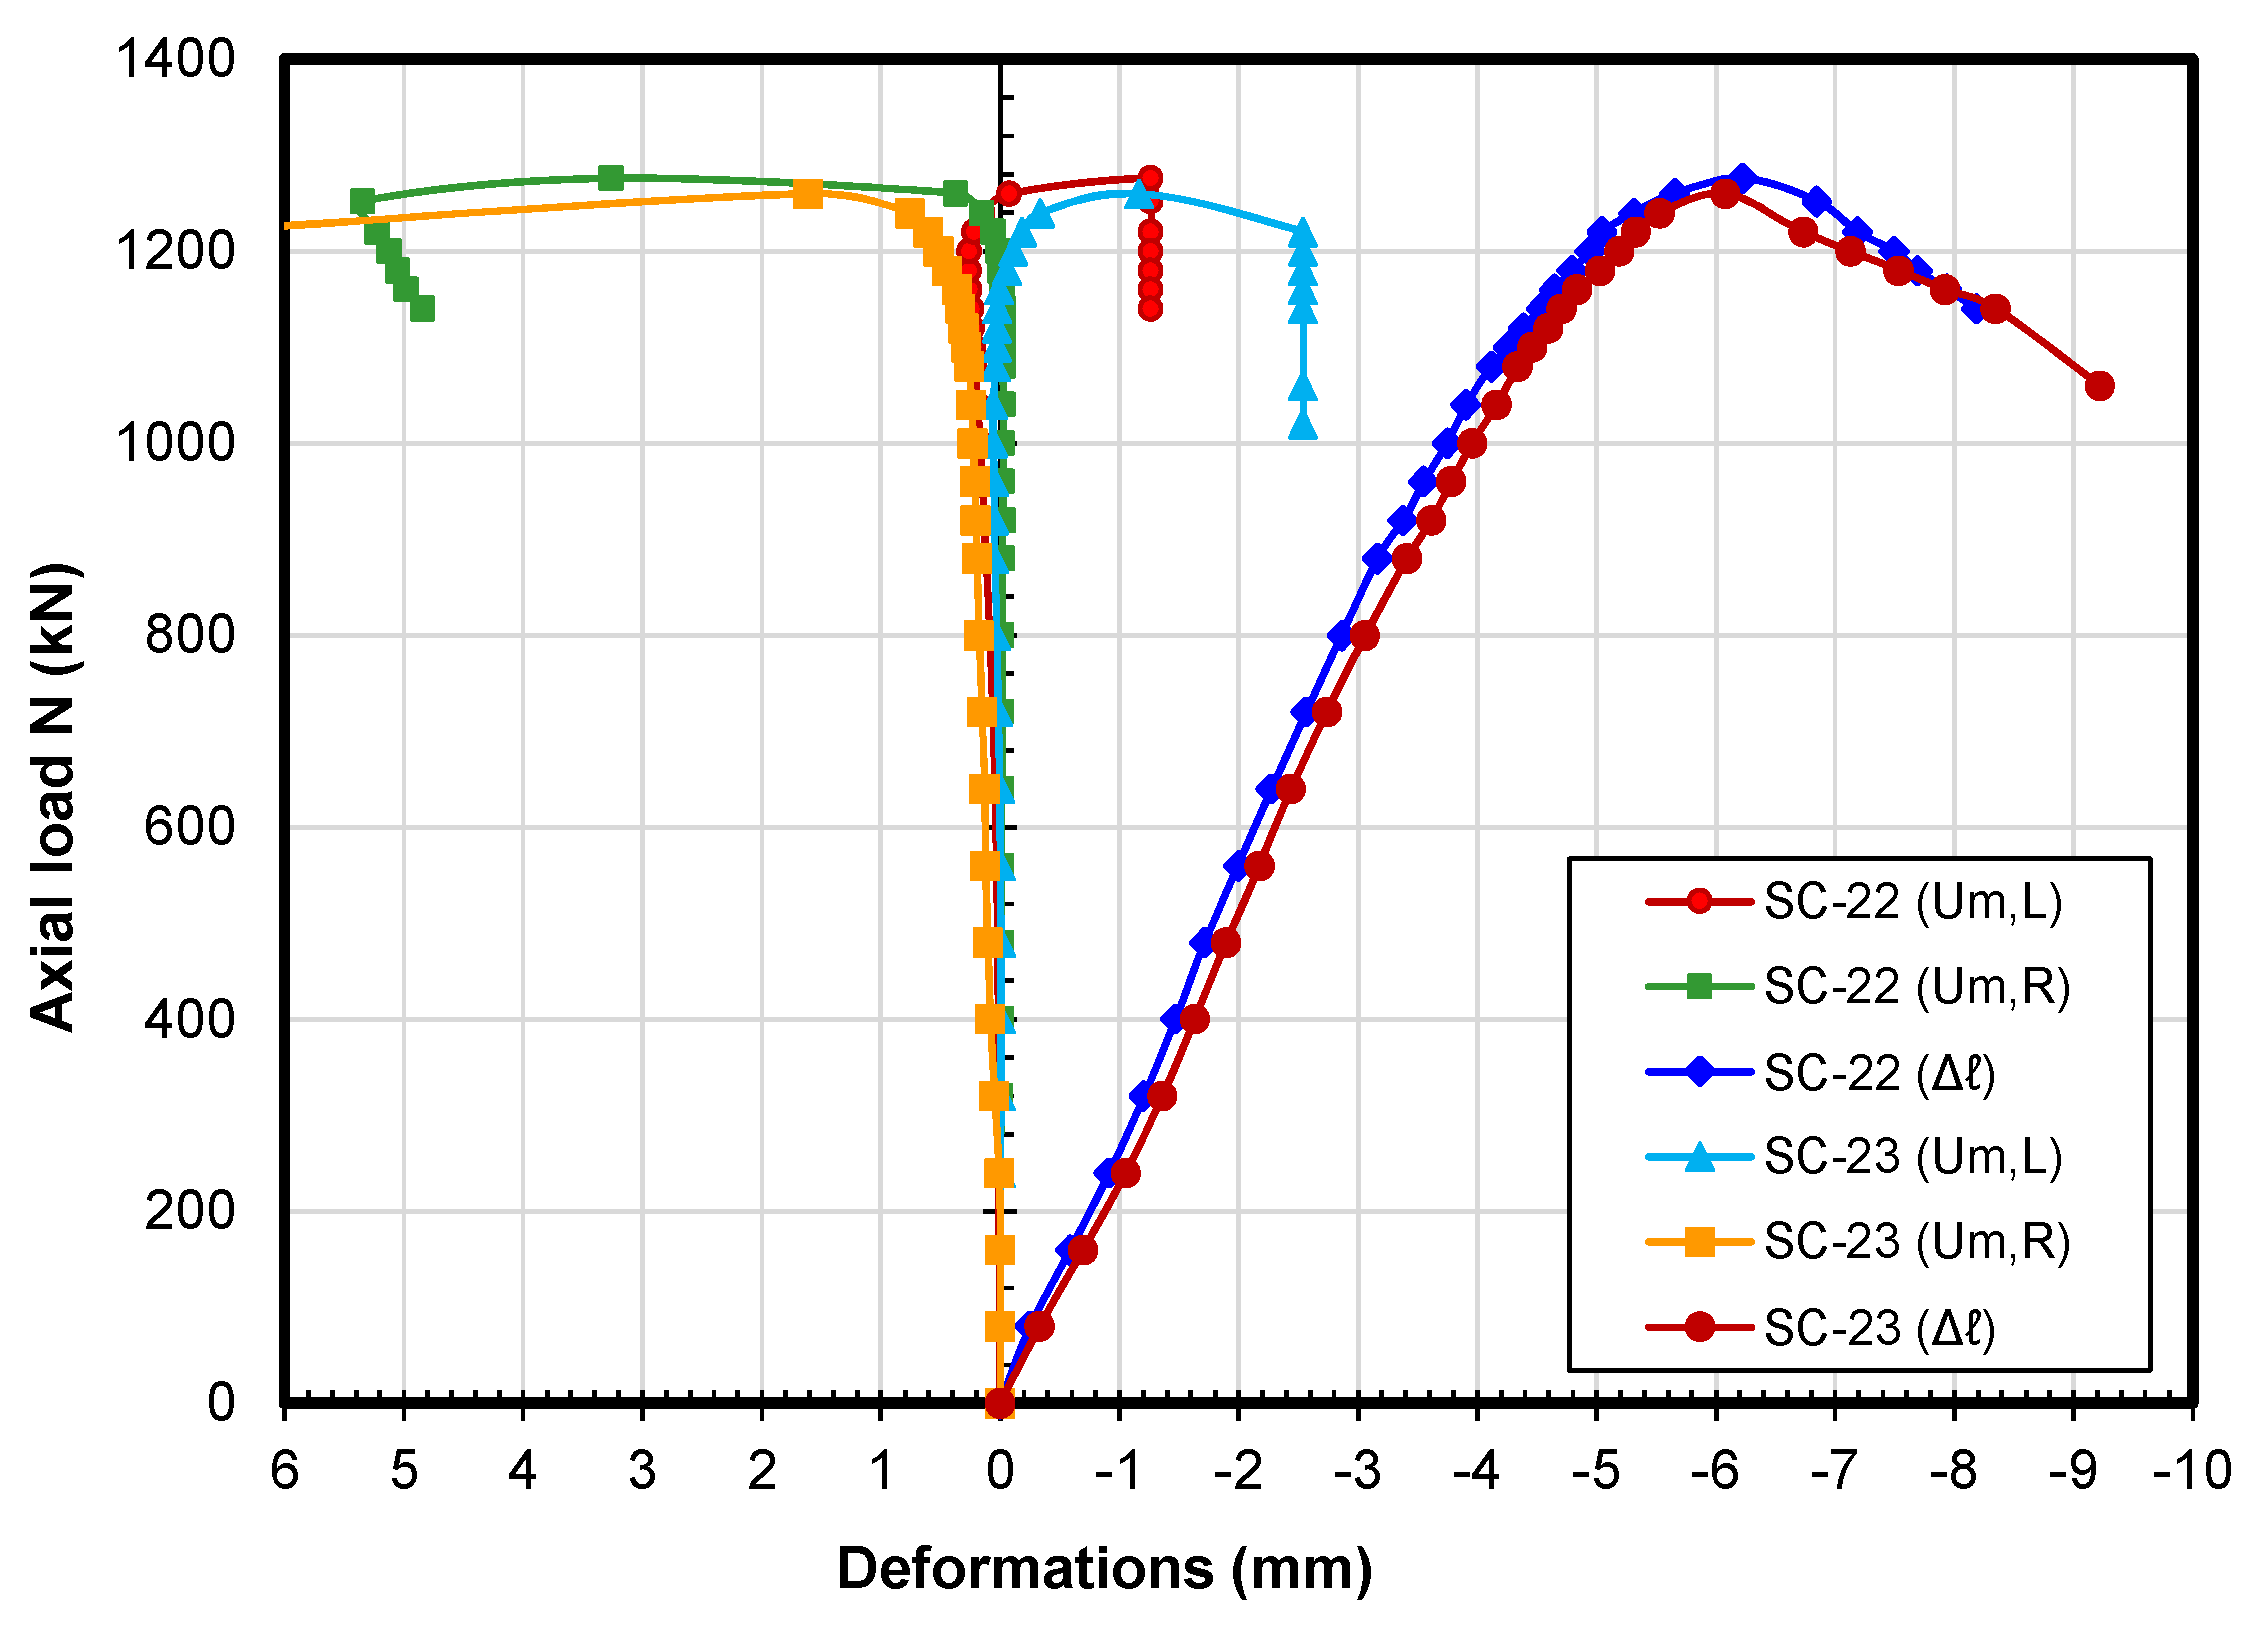
Figure 9.
Top of the column model SC-22 after the experiment front view (a) and side view (b).

Figure 10.
TCCFST column models after the experiment: SC-21 (a); SC-22 (b); and SC-23 (c).
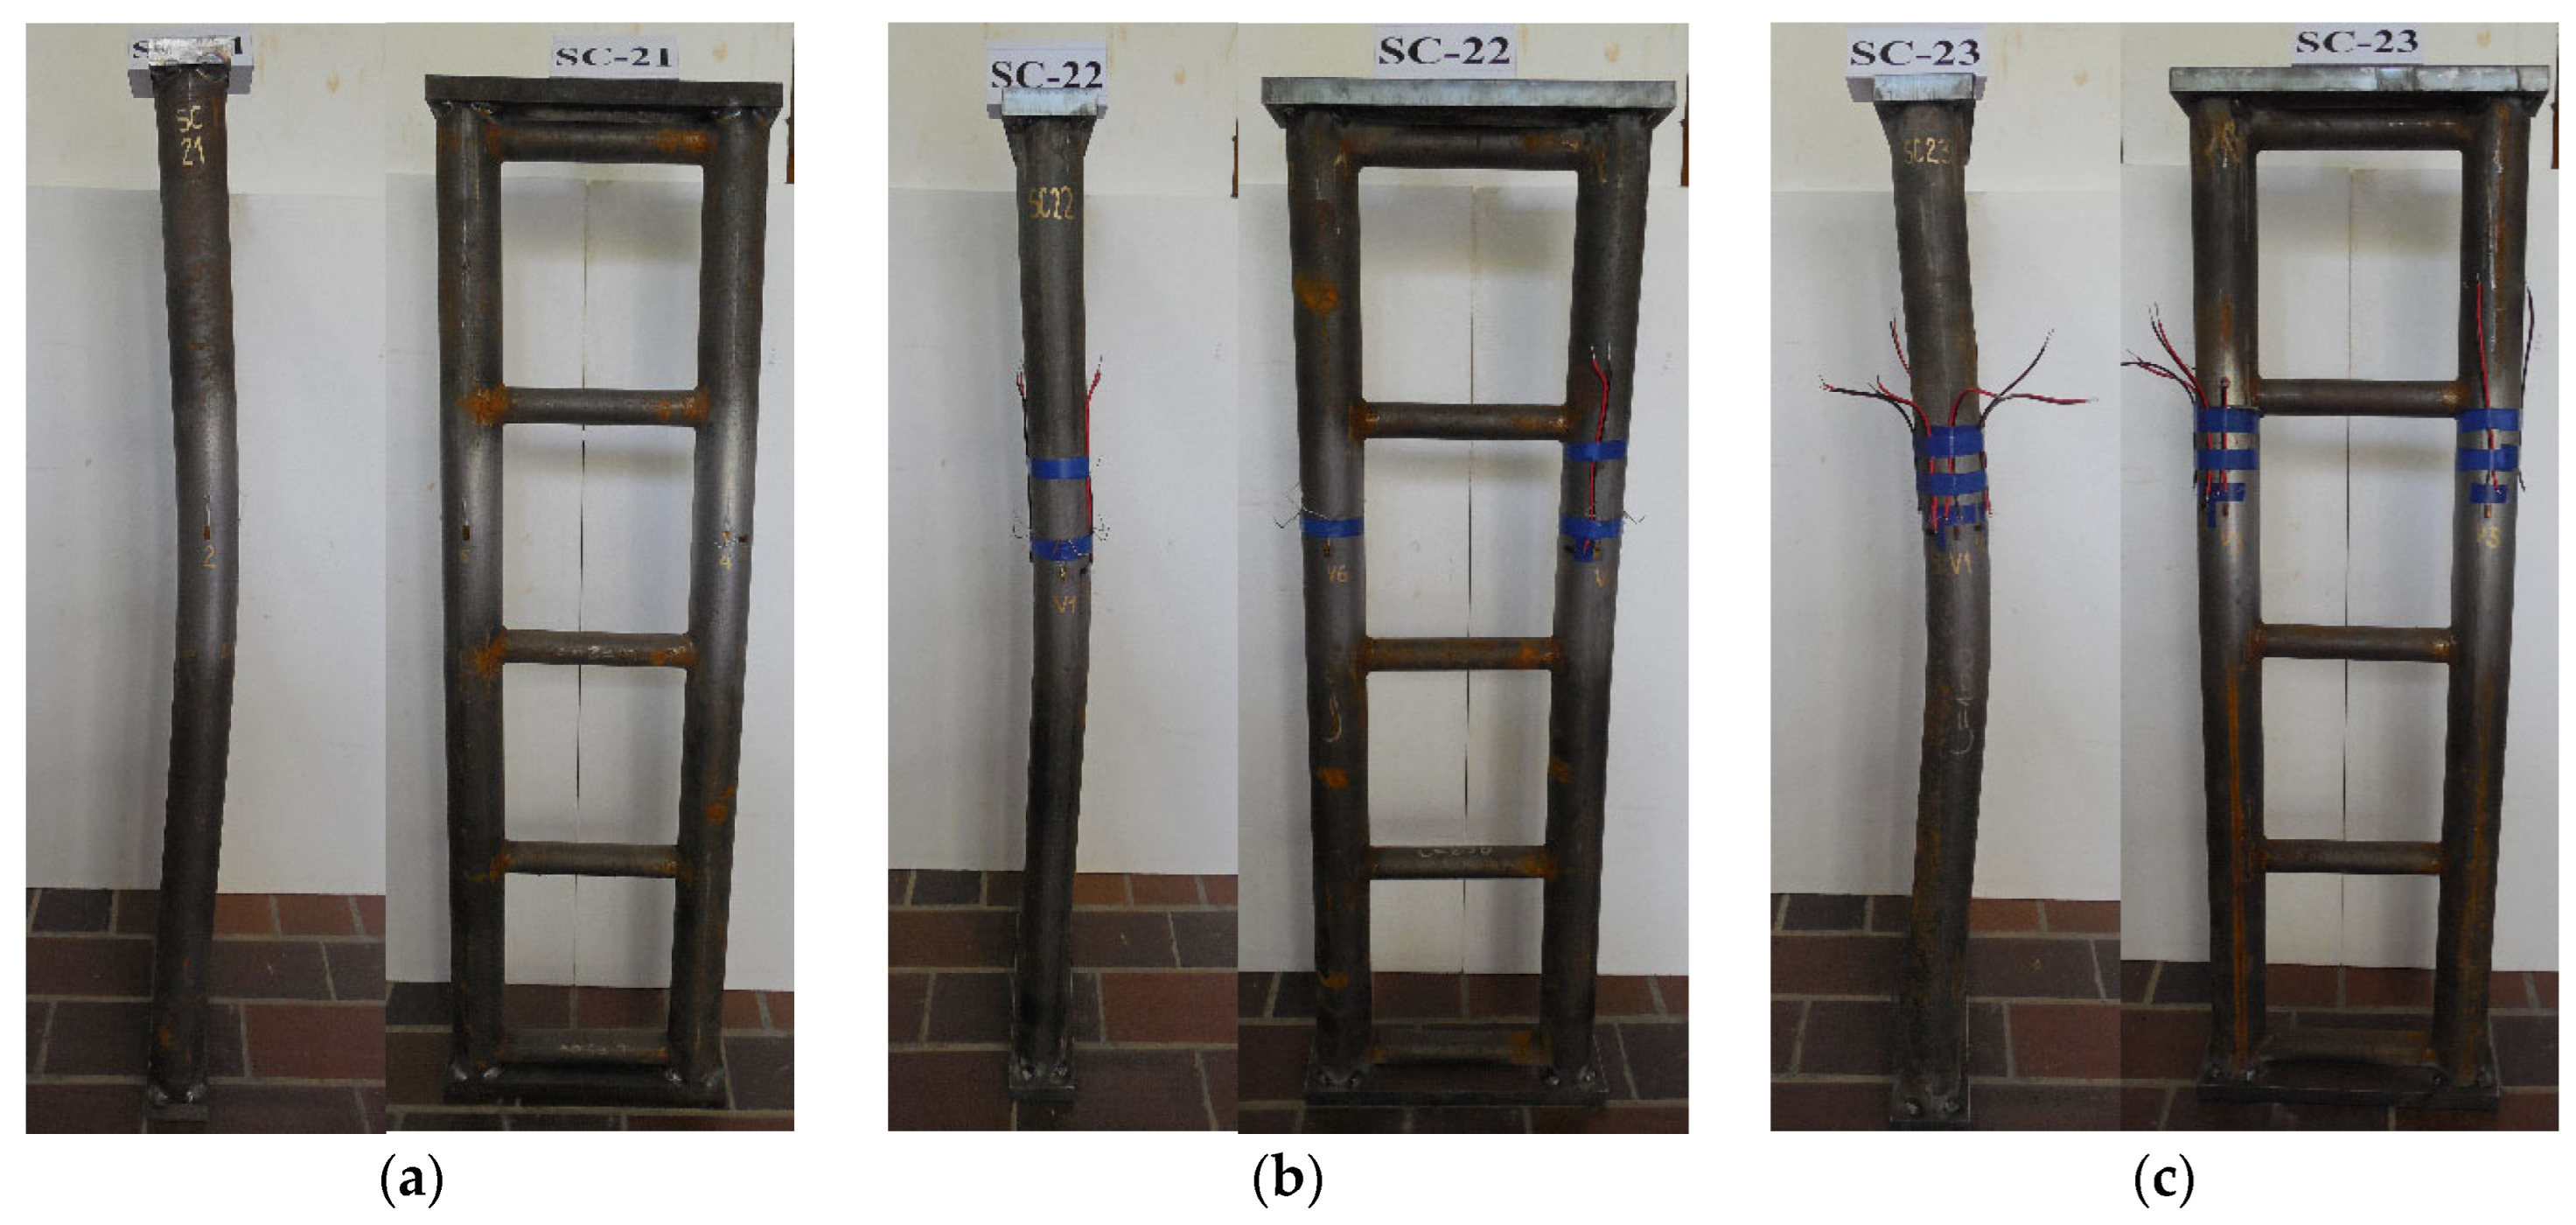
Figure 11.
Comparative relations of load vs. strains of all specimens.

Figure 12.
Deformation vs. axial load—comparative relationships.
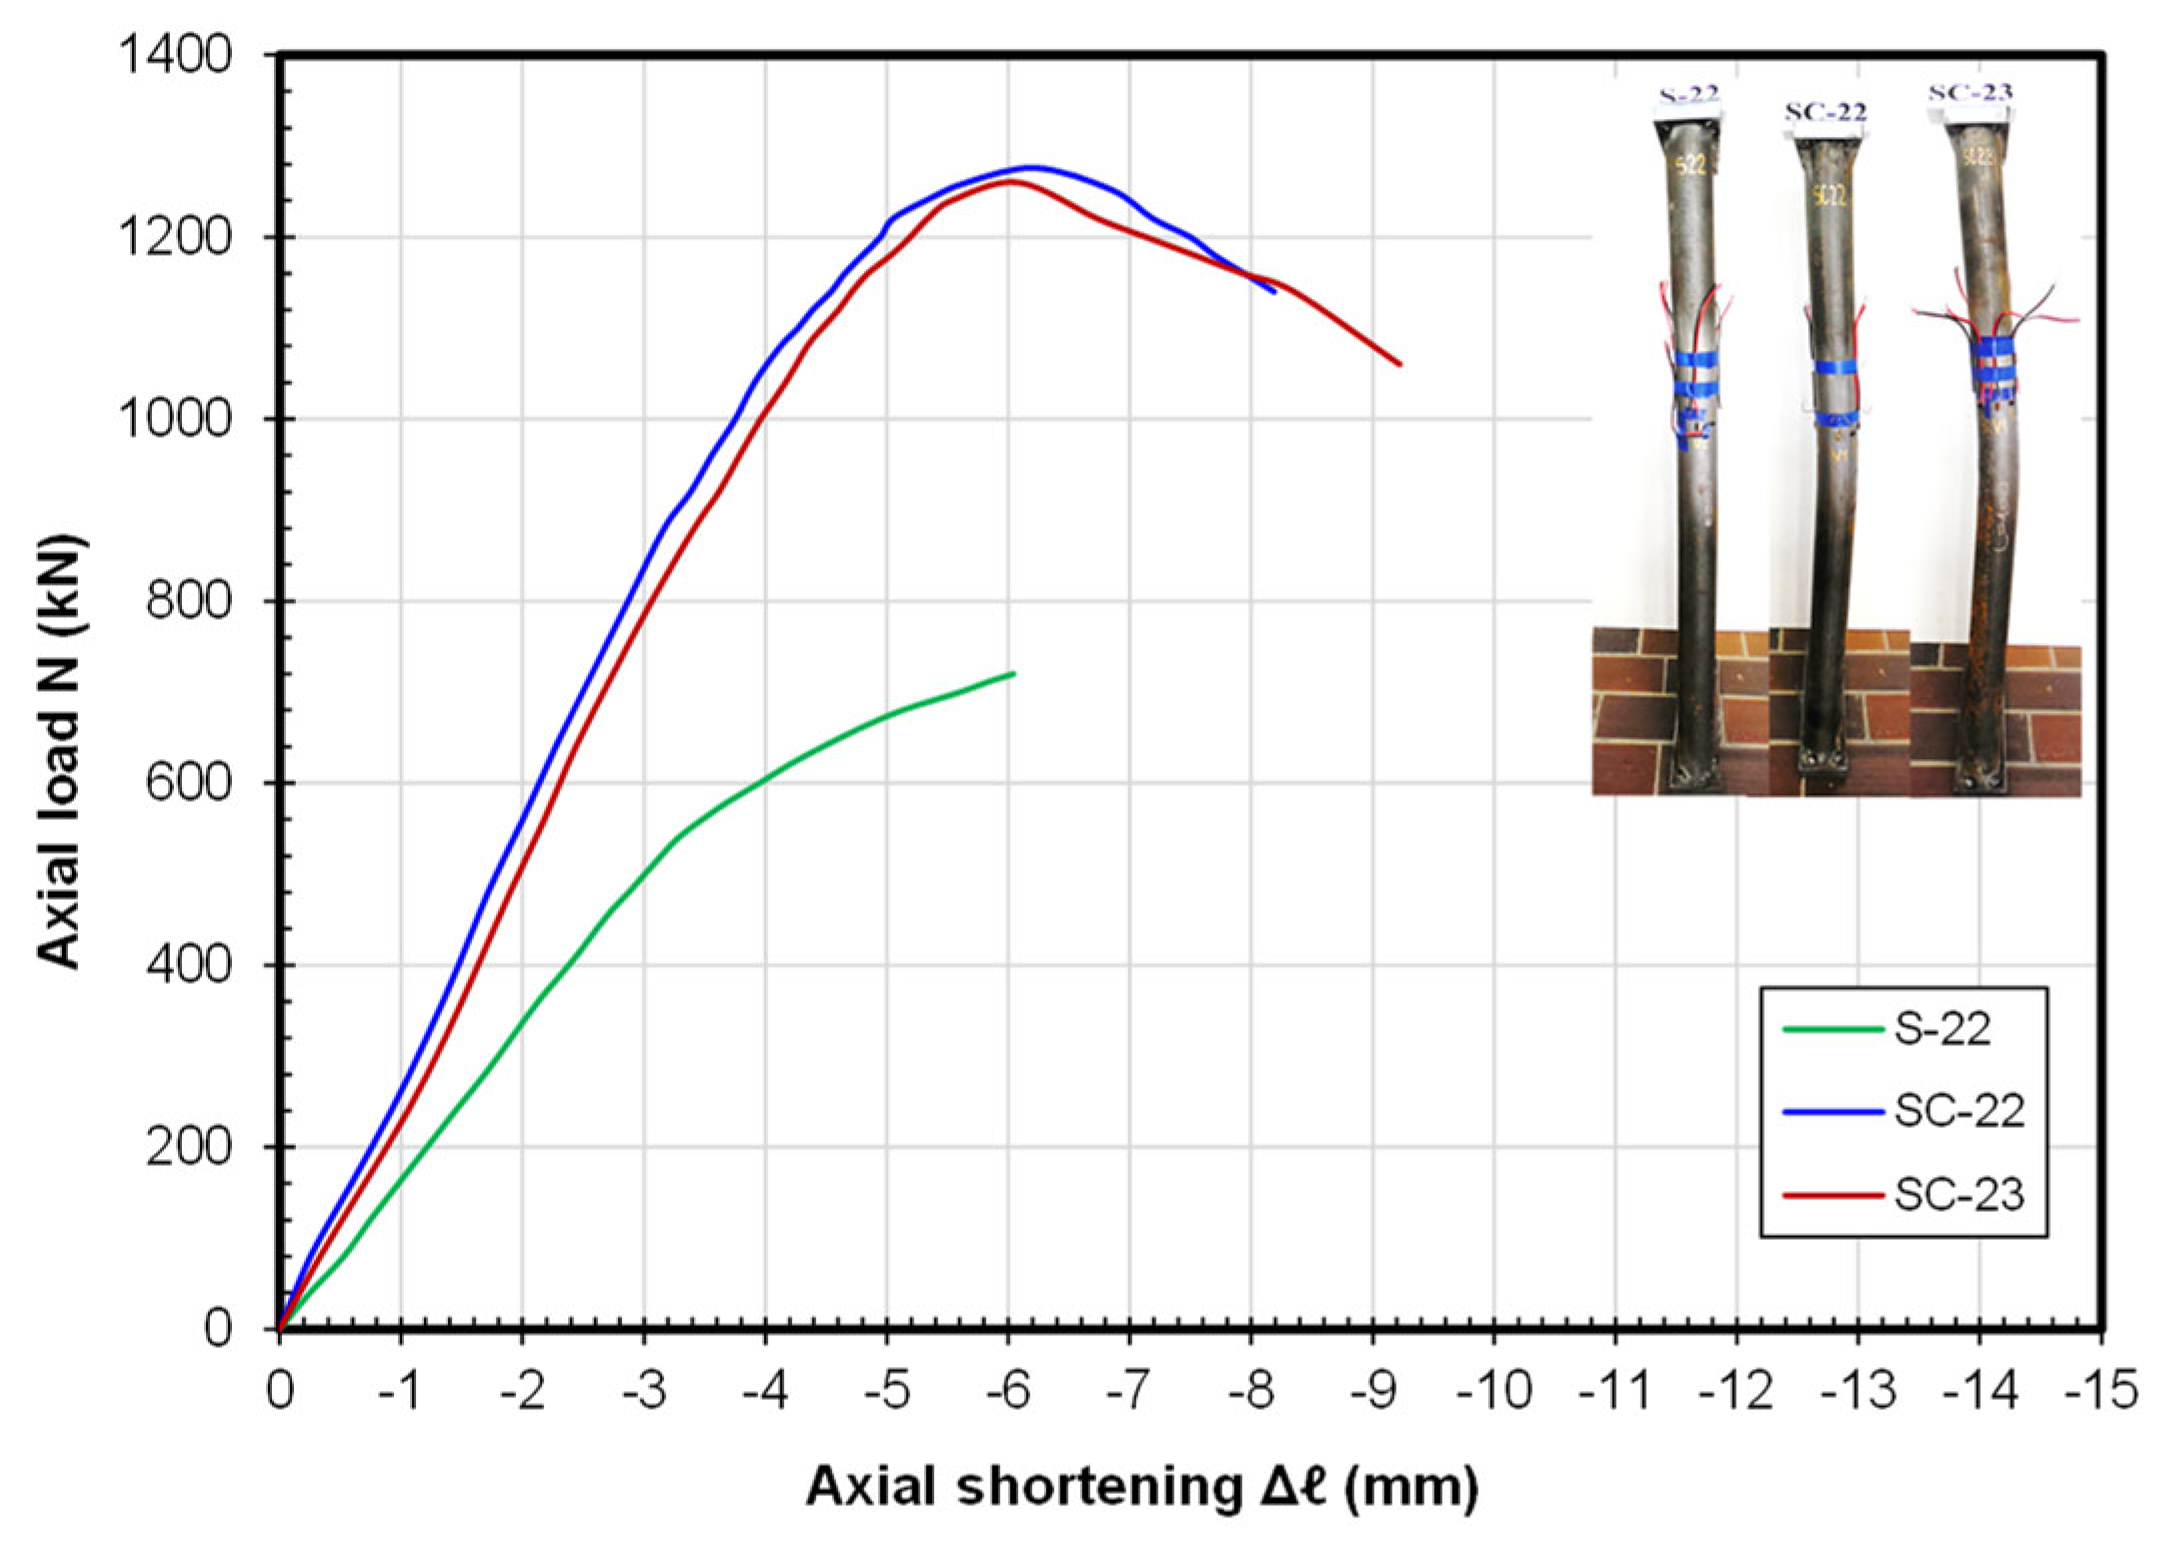
Figure 13.
Comparative relationships for theoretical and measured load distributions.
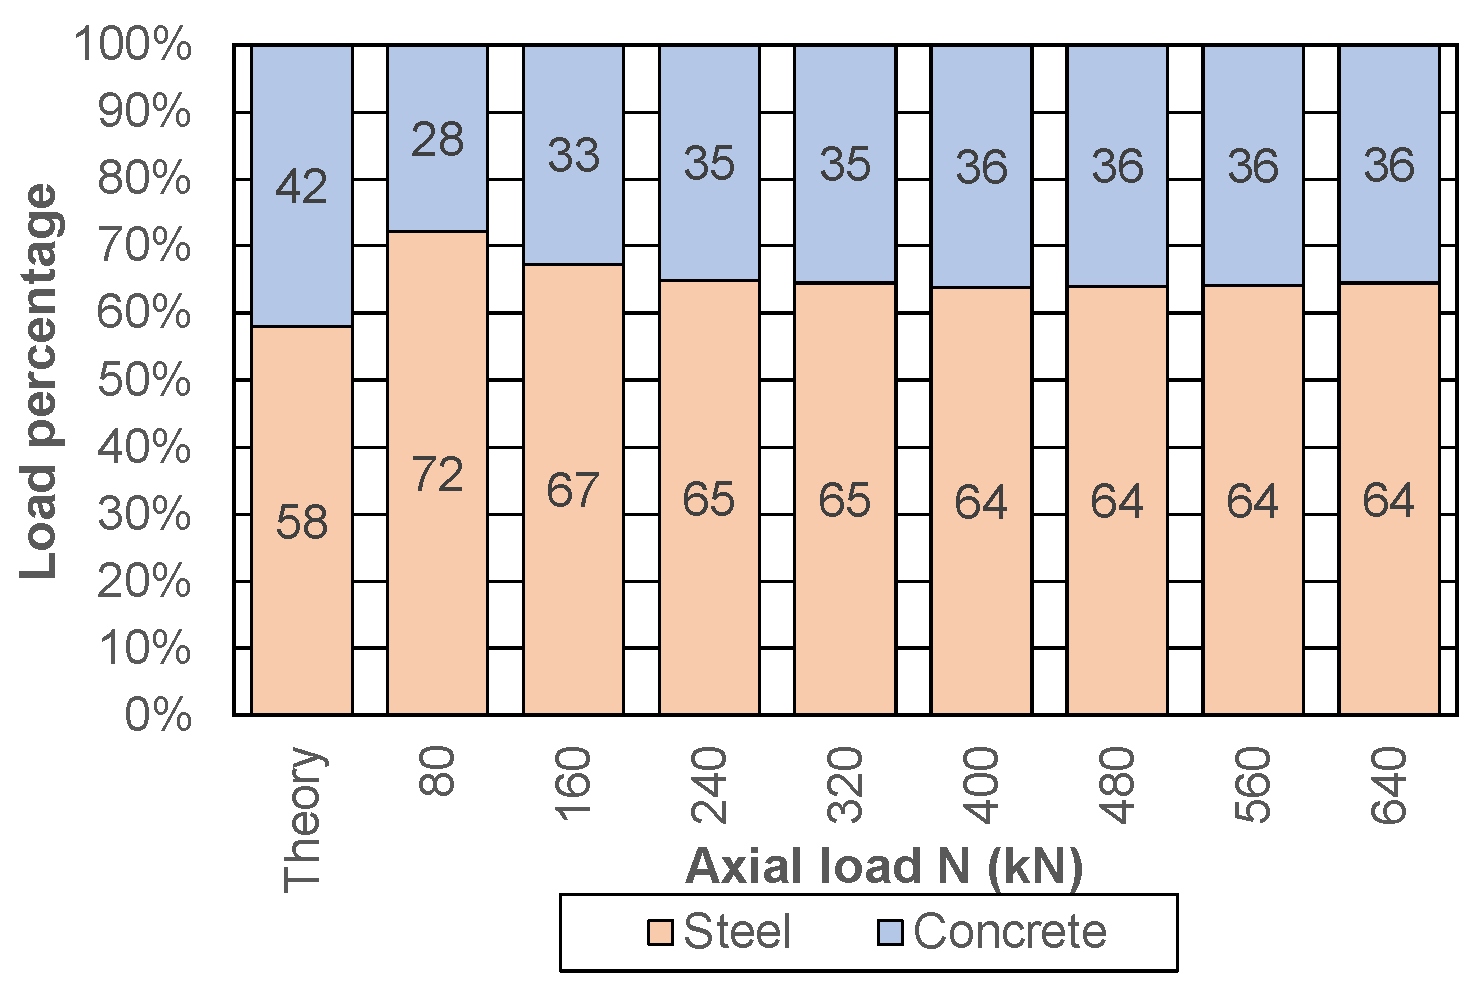
Figure 14.
Confinement factor vs. cube compressive strength relationship.

Figure 15.
Column model SC-21 after steel tube cutting (a) and cracks in concrete (b).
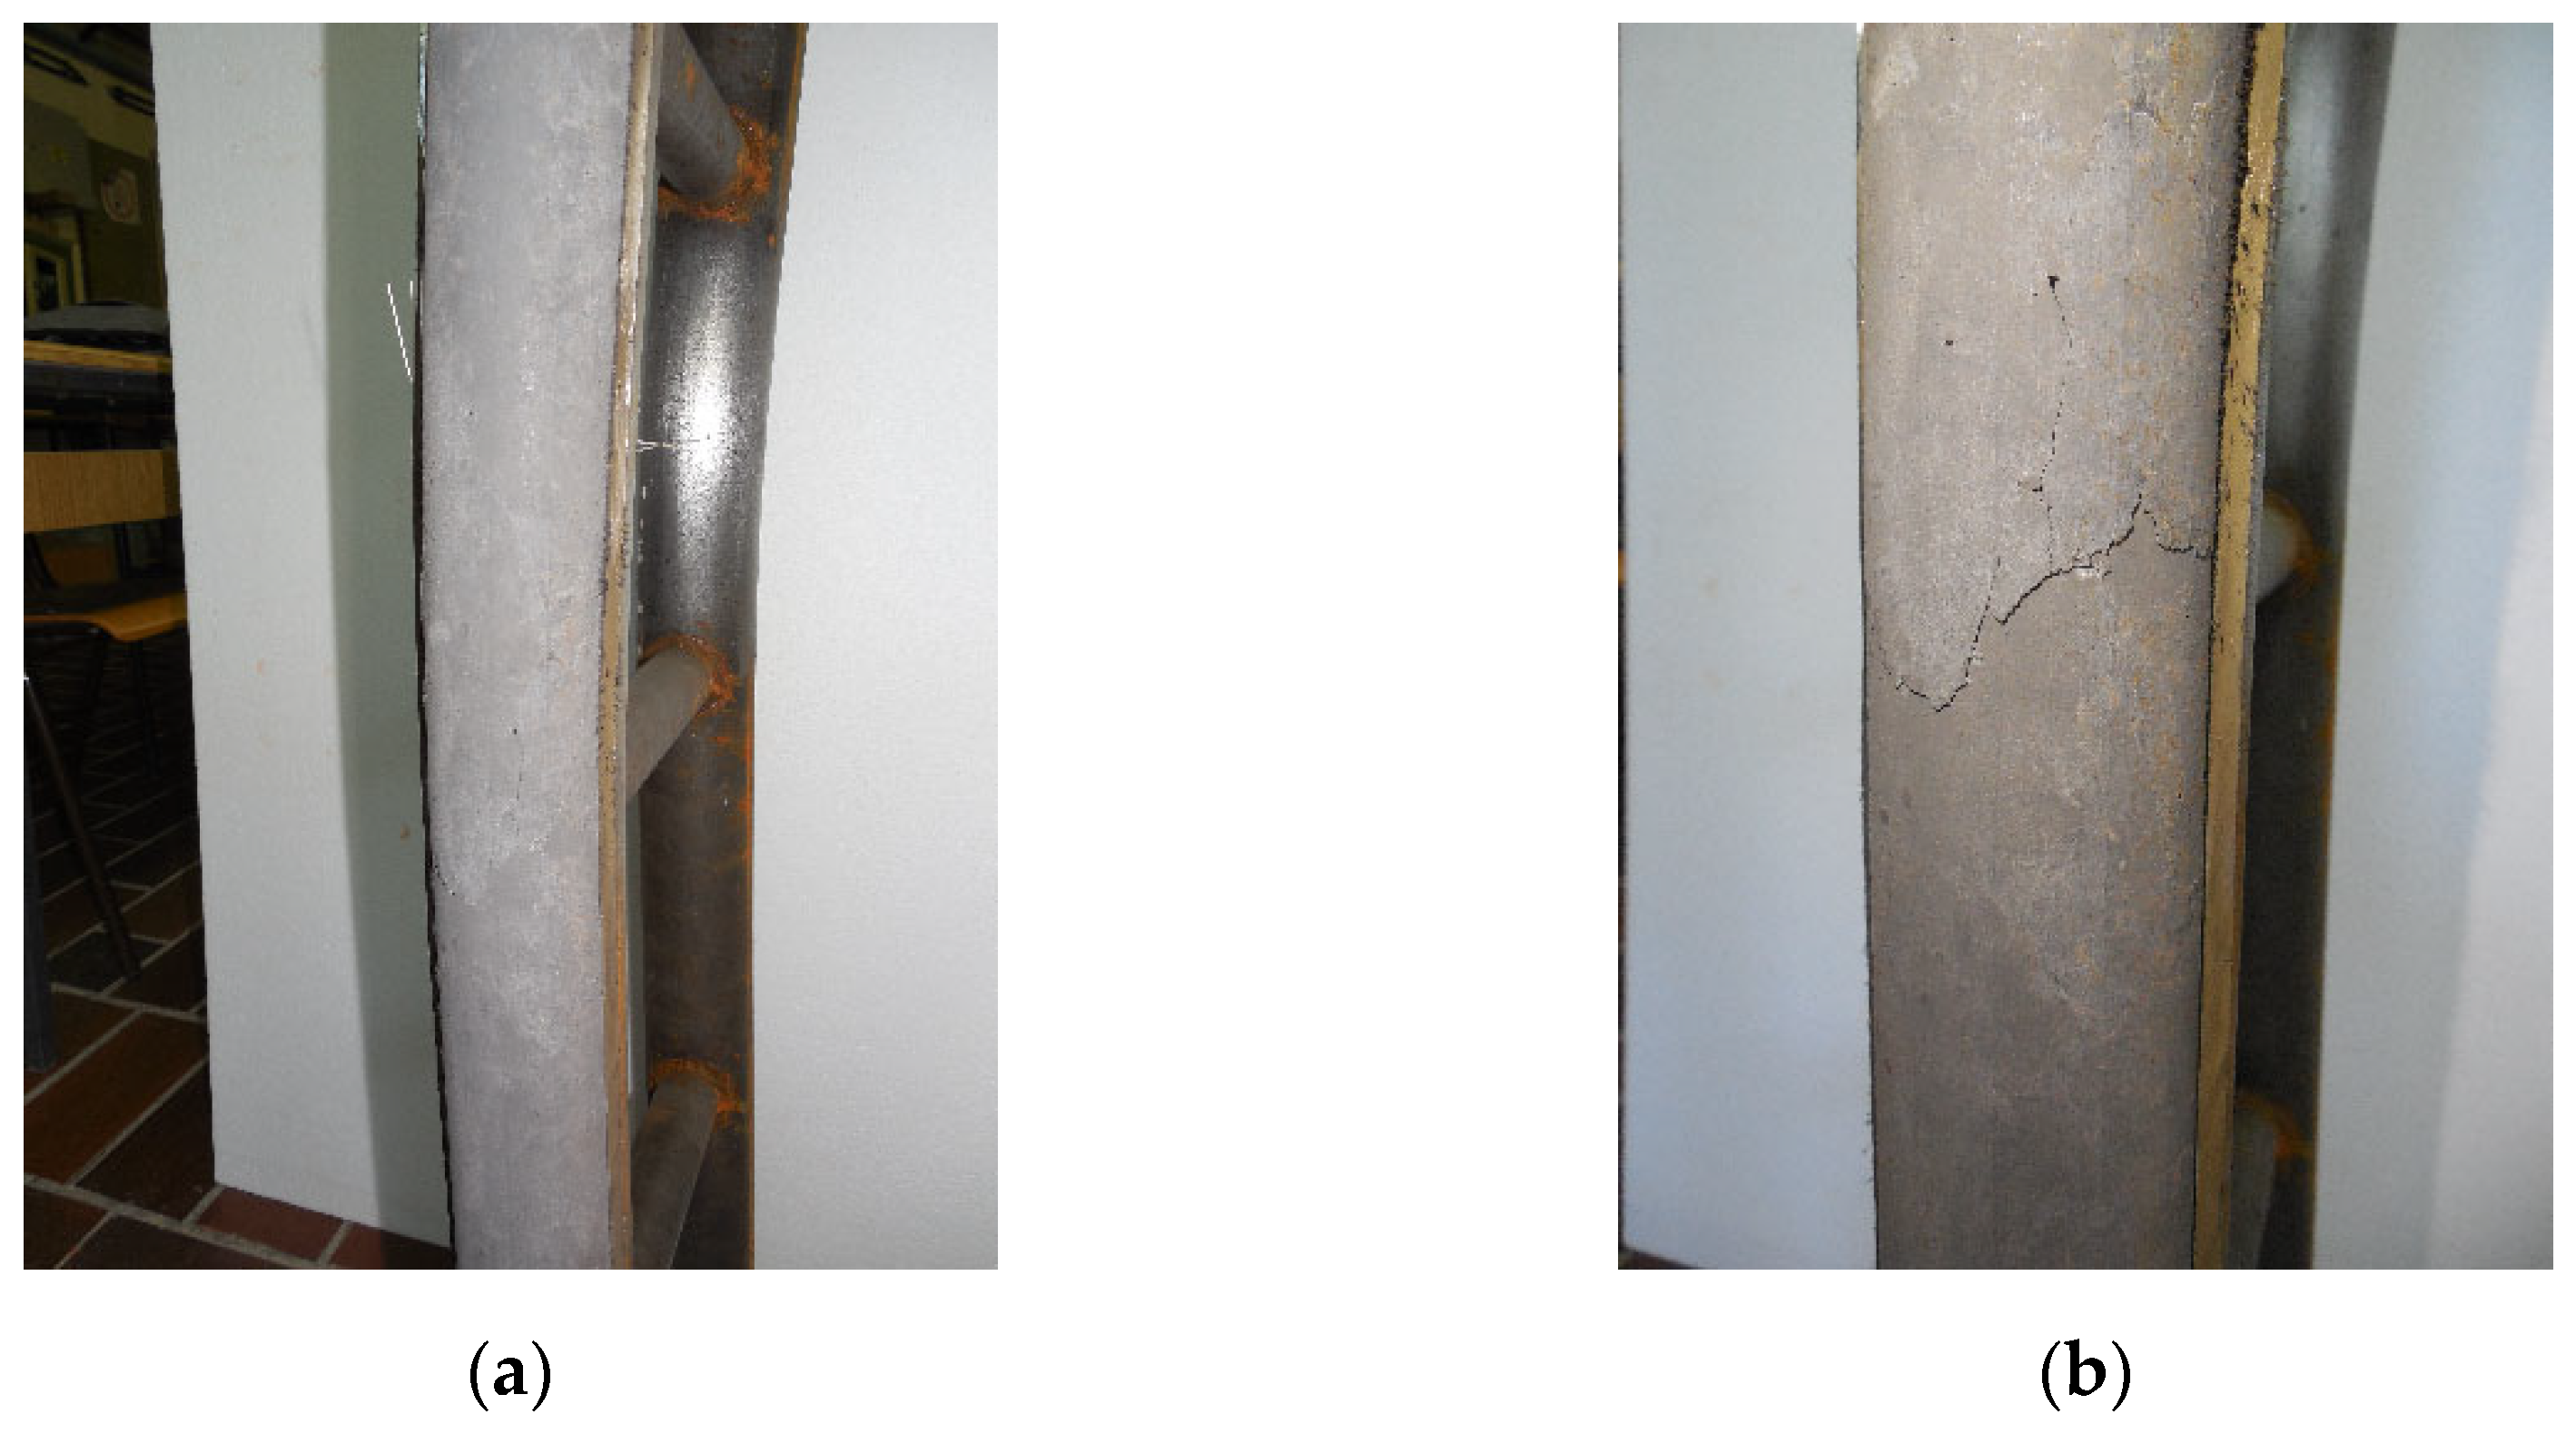
Figure 16.
Codes’ predicted sectional capacity vs. experimental sectional capacity.

Figure 17.
Finite element model (a) and mesh detail (b).
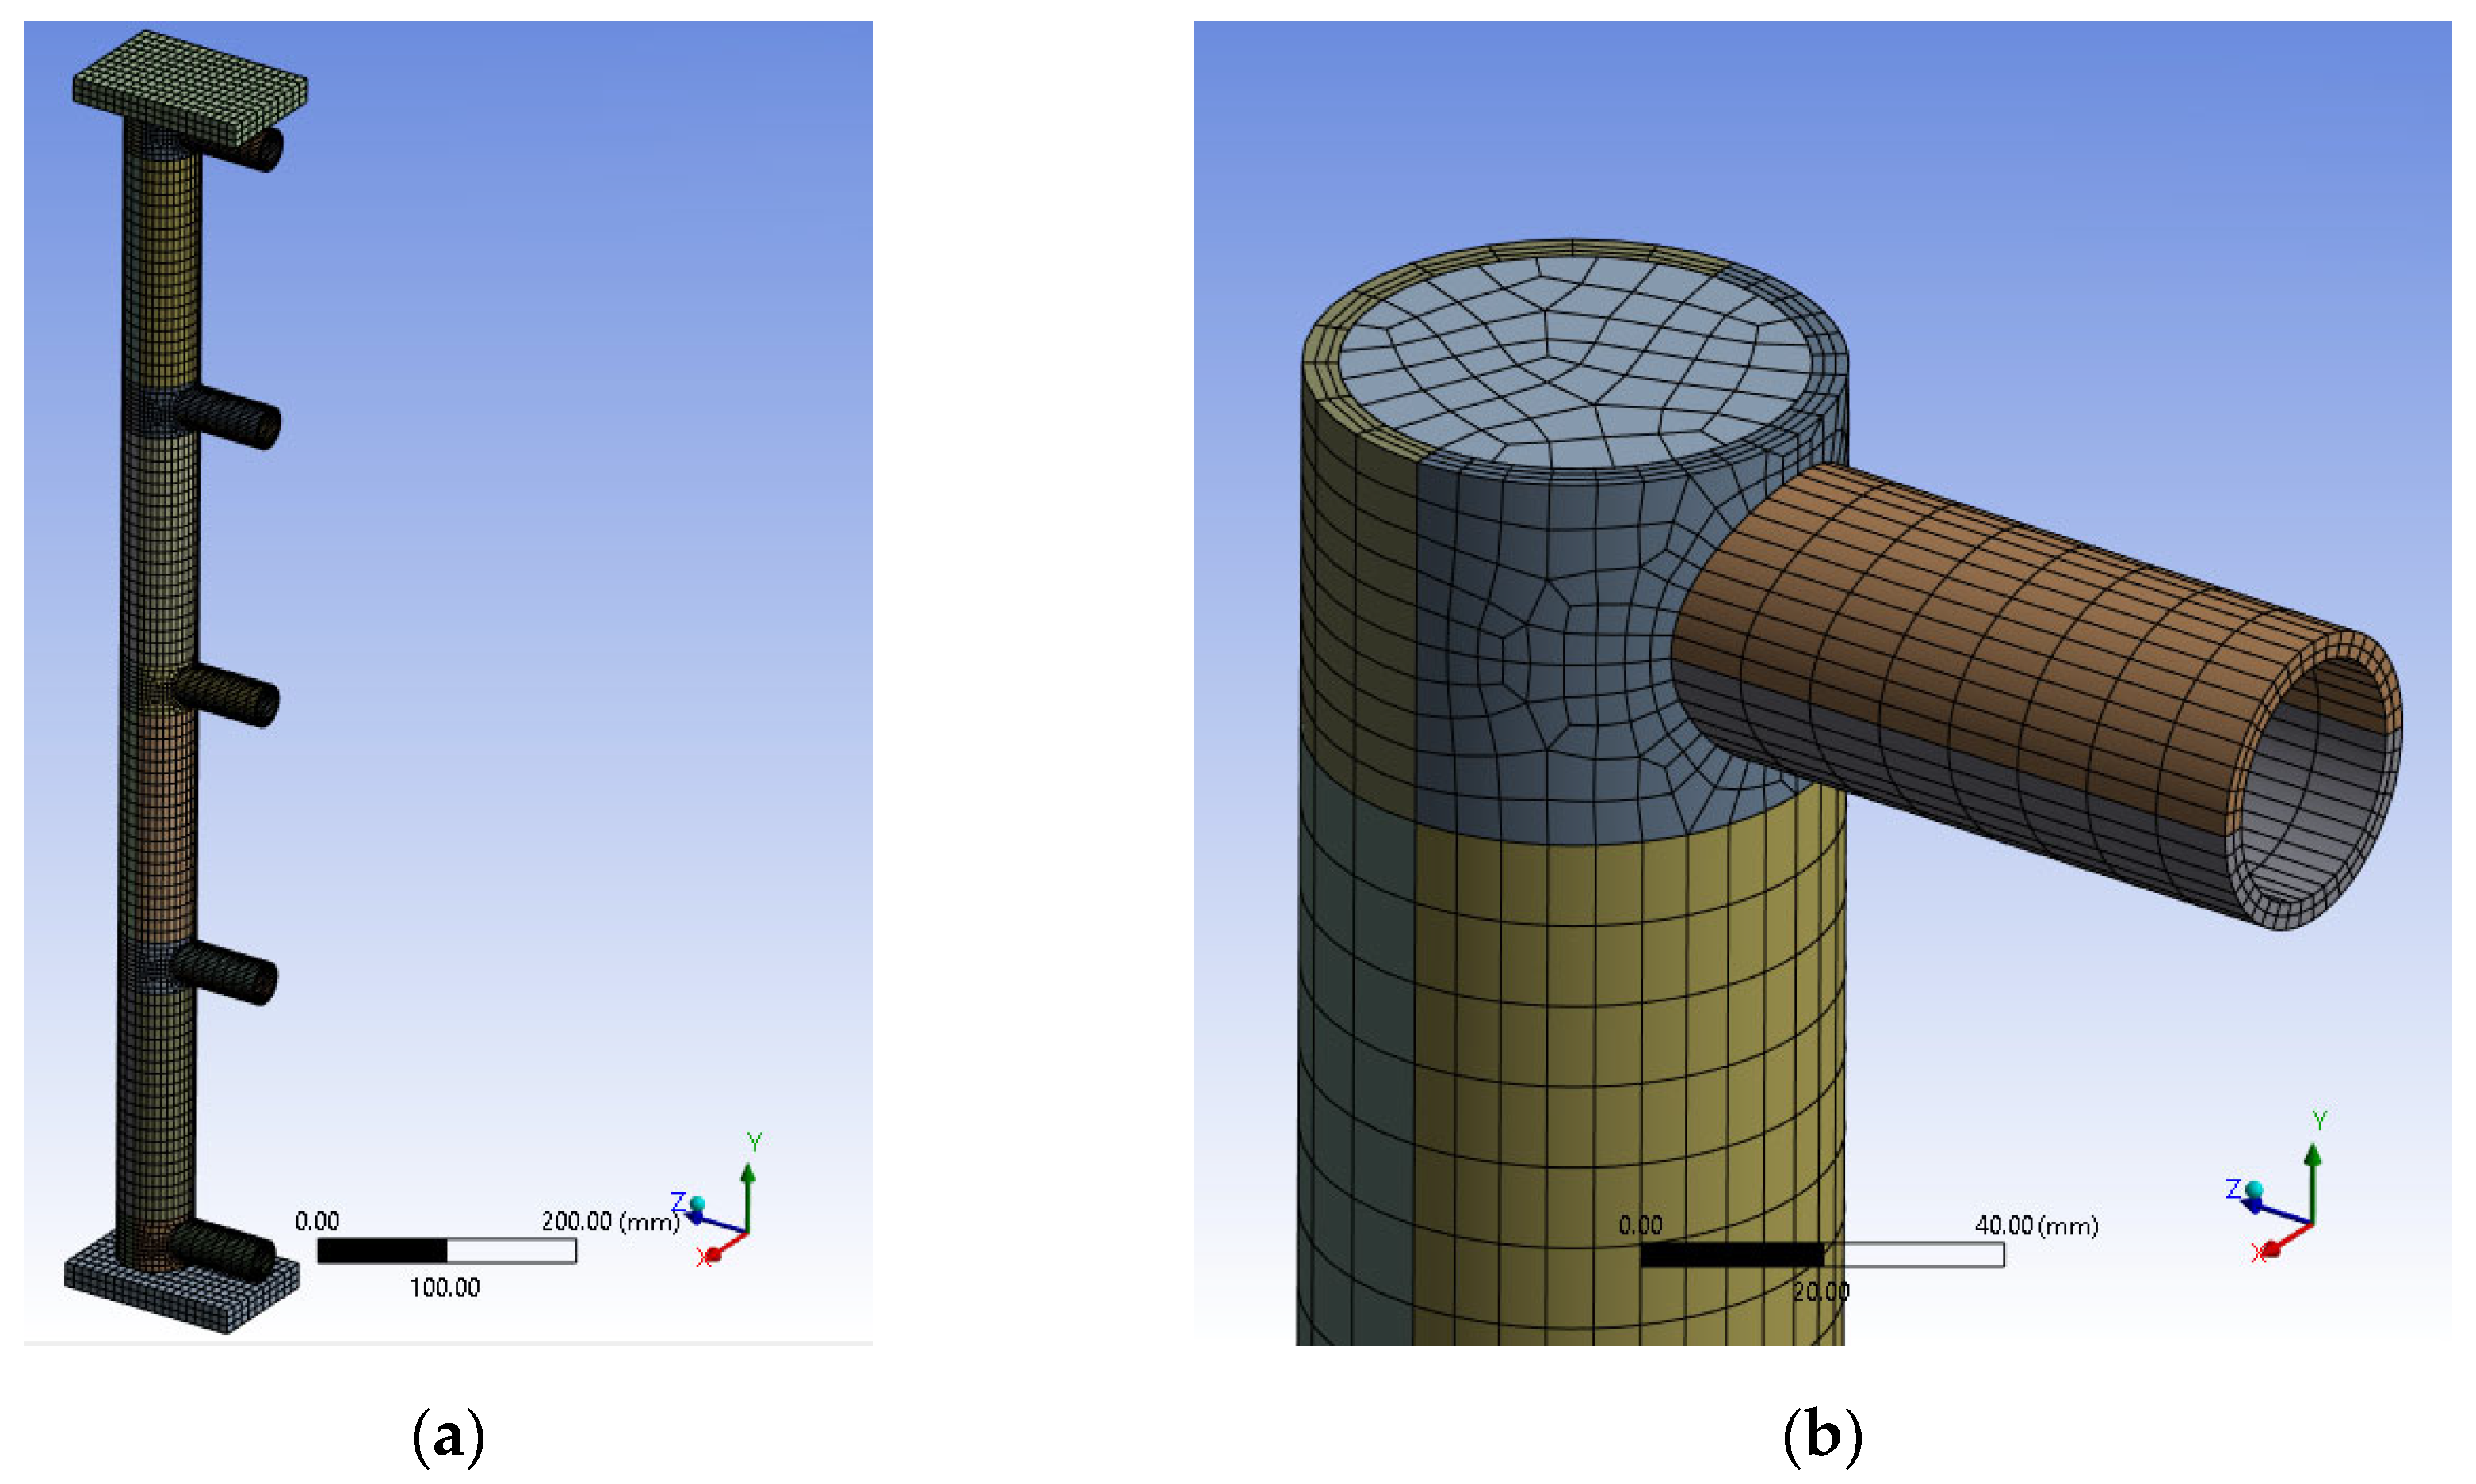
Figure 18.
Stress−strain curve for steel tube (a) and infill concrete (b).

Figure 19.
Comparison of deformations vs. load curves (a) and comparison between predicted and experimental failure modes (b).
Figure 19.
Comparison of deformations vs. load curves (a) and comparison between predicted and experimental failure modes (b).

Figure 20.
von Mises equivalent stresses in steel (a) and normal stresses in concrete (b).

Table 1.
Summary of test results.
| No. | Label | A (mm2) | I (mm4) | λn (−) | ξ | Nu (kN) |
|---|---|---|---|---|---|---|
| 1 | S-21 | 1415 | 563,458 | 25 | - | 732 |
| 2 | S-22 | 1415 | 563,458 | 25 | - | 720 |
| 3 | SC-21 | 2451 | 740,538 | 29 | 2.76 | 1252 |
| 4 | SC-22 | 2451 | 740,538 | 29 | 2.76 | 1276 |
| 5 | SC-23 | 2451 | 740,538 | 29 | 2.76 | 1260 |
Table 2.
Properties of concrete.
| fcu (N/mm2) | fc (N/mm2) | fck (N/mm2) | fct (N/mm2) | ρ (kg/m3) | μc (−) | Ec (GPa) |
|---|---|---|---|---|---|---|
| 128.0 | 95.2 | 71.6 | 13.2 | 2485 | 0.22 | 44.6 |
Note: “fcu”, cube compressive strength; “fc”, cylinder compressive strength; “fck”, characteristic compressive strength determined using Equation (7); “fct”, flexural tensile strength; “ρ”, density; “μc”, Poisson’s ratio; “Ec”, modulus of elasticity.
Table 3.
Properties of steel.
| Class | D (mm) | t (mm) | fy (N/mm2) | fu (N/mm2) | fu/fy | Es (GPa) | μs (−) | δ (%) |
|---|---|---|---|---|---|---|---|---|
| S600 | 60.3 | 4.0 | 600 | 640 | 1.07 | 190 | 0.30 | 11.1 |
Table 4.
Column models’ ultimate load forces.
| Hollow Group S21 and S22 | Filled Group SC21, SC22, and SC23 | |
|---|---|---|
| Nu,exp (kN) | 726 | 1263 |
| Sn (kN) | 8.49 | 12.22 |
| COV (%) | 1.17 | 0.97 |
| ks (-) | - | 1.74 |
Table 5.
Comparison between experimental, code, and finite element analysis results.
| Nu,e | Nu,EC4 | Nu,EC4/Nu,ex. | Nu,AISC | Nu,AISC/Nu,ex. | Nu,DBJ | Nu,DBJ/Nu,ex. | Nu,FEM | Nu,FEM/Nu,ex. |
|---|---|---|---|---|---|---|---|---|
| 1263 | 1004 | 0.80 | 766 | 0.61 | 1342 | 1.06 | 1273 | 1.01 |
Disclaimer/Publisher’s Note: The statements, opinions and data contained in all publications are solely those of the individual author(s) and contributor(s) and not of MDPI and/or the editor(s). MDPI and/or the editor(s) disclaim responsibility for any injury to people or property resulting from any ideas, methods, instructions or products referred to in the content. |
© 2023 by the authors. Licensee MDPI, Basel, Switzerland. This article is an open access article distributed under the terms and conditions of the Creative Commons Attribution (CC BY) license (https://creativecommons.org/licenses/by/4.0/).
Share and Cite
MDPI and ACS Style
Kovač-Striko, J.; Landović, A.; Čeh, A.; Bešević, M. Behavior of Two-Chord Steel–Concrete Composite Columns under Axial Compression. Appl. Sci. 2023, 13, 12634. https://doi.org/10.3390/app132312634
AMA Style
Kovač-Striko J, Landović A, Čeh A, Bešević M. Behavior of Two-Chord Steel–Concrete Composite Columns under Axial Compression. Applied Sciences. 2023; 13(23):12634. https://doi.org/10.3390/app132312634
Chicago/Turabian StyleKovač-Striko, Josip, Aleksandar Landović, Arpad Čeh, and Miroslav Bešević. 2023. "Behavior of Two-Chord Steel–Concrete Composite Columns under Axial Compression" Applied Sciences 13, no. 23: 12634. https://doi.org/10.3390/app132312634
Note that from the first issue of 2016, this journal uses article numbers instead of page numbers. See further details here.