1. Introduction
Modern-day fusion experiments aim to achieve good plasma confinement, but this is a challenge due to the limitations that different magnetohydrodynamic (MHD) activity places on the accessible operating regimes [
1]. Certain MHD instabilities can modify the magnetic geometry of a magnetic confinement device and thus potentially lead to a reduction in plasma confinement and loss of stored energy. In addition, experimental evidence suggests that disruptions are connected to MHD activity. Different MHD modes have been observed to influence plasma in different ways [
2]. In order to achieve good plasma confinement, effort must be made to avoid or control these instabilities. Accordingly, it is vital to research and understand the reasons for their appearance in plasma. For this purpose, an analysis must be undertaken of the spatial structure and time behavior of MHD instabilities, or a comparison of their mode structure with theory.
Significant work has been carried out to study and understand one particular type of MHD instability, the tearing mode (TM) [
3,
4]. Interest in the TM concerns its detrimental consequences for tokamak performance. For one, the TM leads to a non-symmetric plasma equilibrium, which can eventually cause a disruption to occur. The TM can be described as a series of magnetic islands that enhance the radial particle and energy flux from the center in the regions of its formation. This, in turn, degrades plasma confinement and reduces central plasma temperature. Additionally, as the pressure is constant on flux surfaces, the formed island flux surfaces flatten the pressure profile and reduce the central pressure, which is detrimental to tokamak performance. Another issue associated with the TM is the eddy currents it induces, which can potentially cause a loss of global plasma rotation and stability.
Research into the tearing mode has been undertaken on a multitude of magnetic confinement devices, such as tokamaks or stellarators, and a variety of tools have been used to study MHD instability. The diagnostics used allow researchers to measure the temperature, density, current profiles and other plasma parameters, to observe the effect of the TM on plasma performance. These include soft X-ray cameras (SXR), electron cyclotron emission (ECE) and the motional Stark effect (MSE). Some of the methods can reveal information regarding MHD instability. For example, magnetic measurements are made using Mirnov coils or magnetic probes. Additionally, microwave techniques, such as conventional reflectometry or the Doppler backscattering (DBS) method, allow researchers to quantitatively describe density fluctuations that include coherent MHD modes.
This type of MHD activity was observed and investigated on the previous Globus-M tokamak [
5,
6]. Tearing modes with mode numbers of
m/n = 2/1 were found to develop during the plateau phase of the plasma current of the discharges. Similar MHD activity has been detected on the upgraded spherical Globus-M2 tokamak, which is characterized by a two-fold increase in the toroidal magnetic field up to 1 T (compared to Globus-M). Several types of tearing modes with unique characteristics have been detected under different discharge conditions. In this paper, we present the results of an investigation of those TMs using the DBS method, which has previously been employed to study a variety of oscillatory processes on the Globus-M2 tokamak [
7,
8,
9,
10,
11].
The paper is structured as follows. First, the tearing modes that did not lead to degradation of plasma confinement are discussed. The conditions for their development are presented, together with observations made using magnetic coils. This is followed by a brief description of the DBS method, along with confirmation that DBS measurements can provide information regarding TMs. Then, DBS data are presented, which include the localization of the TM and an estimate of its island width. After that, we outline the results of our investigation into TMs with a notable impact on the plasma performance. Next, the discussion section offers a comparative analysis of the TMs observed, along with proposals for future TM investigations to extend the results obtained. Finally, a summary of all the results is presented in the conclusion.
2. Narrow Tearing Modes
The Globus-M2 is a spherical tokamak with a major radius R = 0.36 m and minor radius a = 0.24 m [
12]. Most experiments on the Globus-M2 are carried out with a toroidal magnetic field B
T up to 0.8 T and a plasma current I
p up to 0.4 MA. In certain discharges, under different conditions, MHD activity can be observed in the form of tearing modes.
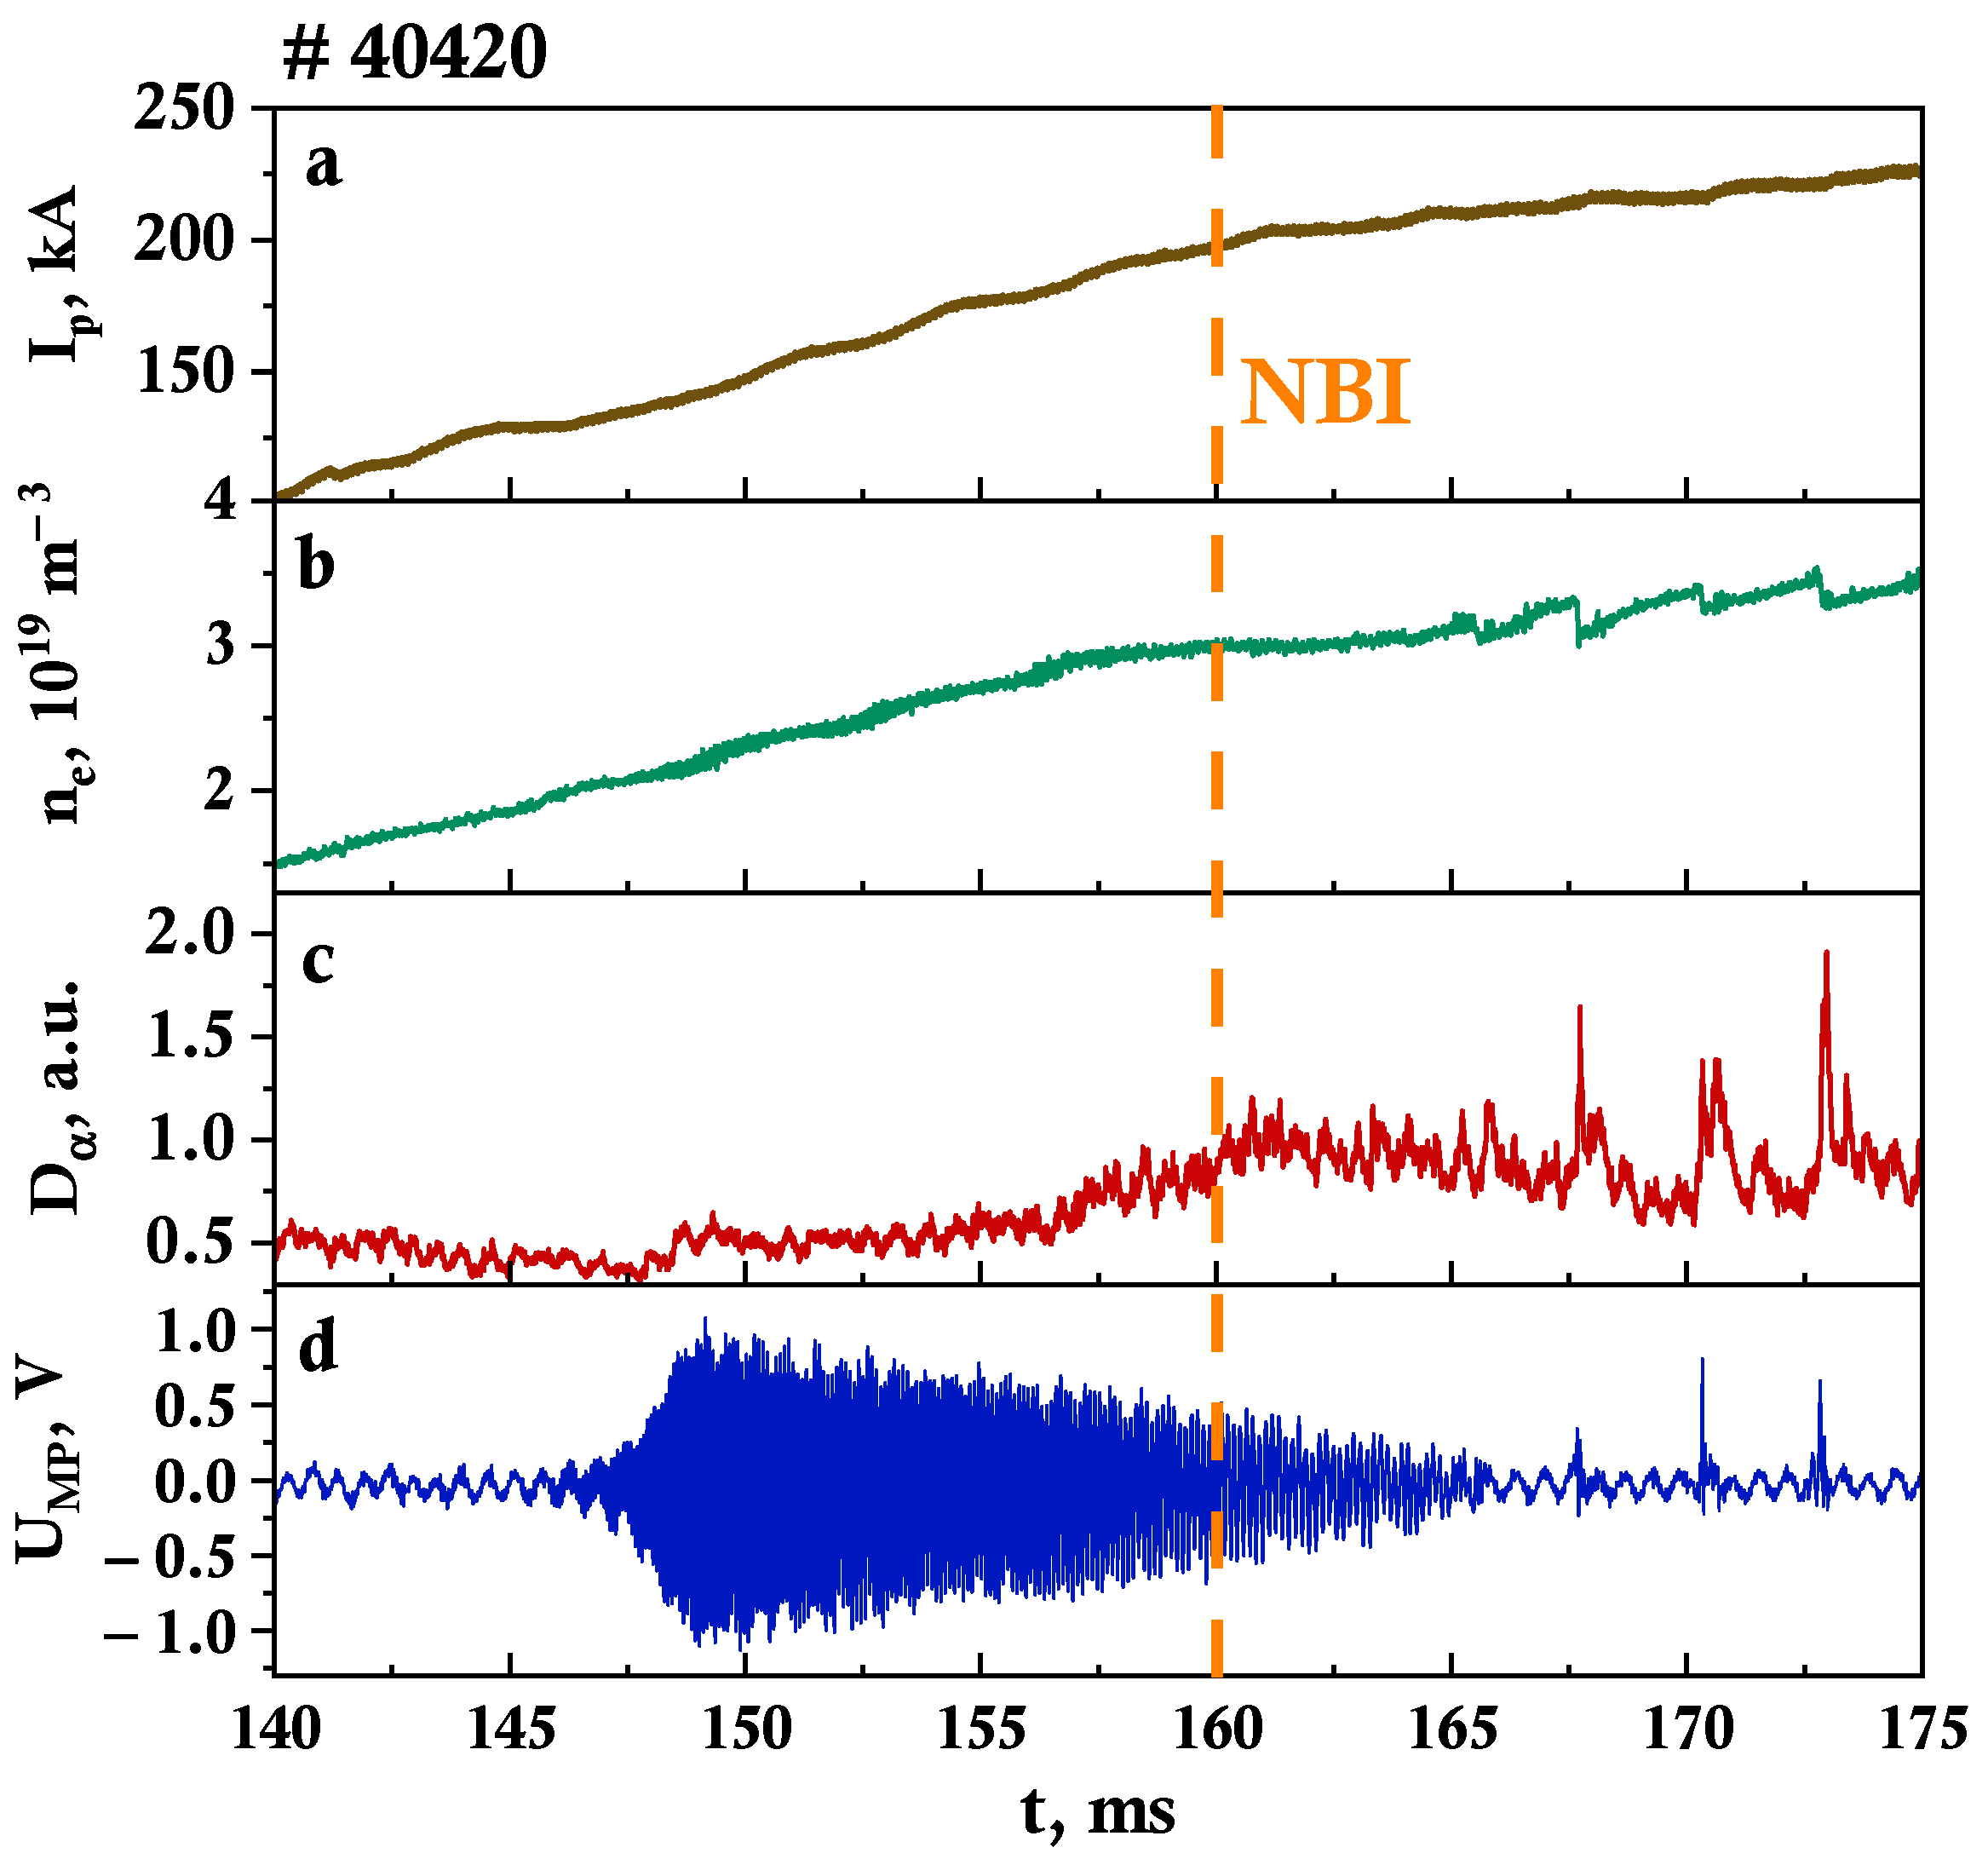
An example of a scenario where one type of tearing mode can be observed is presented in
Figure 1. The presented discharge #40420 was achieved with the main parameters of the deuterium plasma including a toroidal magnetic field B
T up to 0.7 T and a plasma current I
p up to 0.23 MA. In this case, the TM was detected using a magnetic probe. It is a multi-turn coil (
SW = 60 cm
2, where
S is the probe area and
W is the number of turns) located on the low-field side (LFS) on the wall of the tokamak inside the vacuum chamber 6 cm above the equatorial plane. The TM is found in the magnetic probe signal in the form of fluctuations with decreasing amplitude, starting at 148 ms (
Figure 1d). This indicates that it develops at the start of the discharge and before the plateau phase of the plasma current is reached, as can be seen from
Figure 1a. Additionally, the average electron density n
e increases from 2.1 × 10
19 m
−3 to 3.1 × 10
19 m
−3 during this time (
Figure 1b). It is worthy of note that in discharge #40420, neutral beam injection (NBI) was initiated at 160 ms, meaning the tearing mode started to develop in the Ohmic phase of the discharge, disappearing 6 ms after the NBI was introduced. A change in plasma confinement can be seen when this occurs, as indicated by the behavior of the D
α signal in
Figure 1c.
2.1. DBS Measurements
Apart from magnetic probes, the DBS diagnostic was employed to research the characteristics of the tearing mode on the Globus-M2.
Doppler backscattering (DBS, also referred to as Doppler reflectometry) involves the probing of plasma at oblique incidence by means of microwave beams [
13,
14,
15,
16,
17,
18]. It is used to measure the Bragg backscattered process at the cut-off layer. This technique allows for local measurement of the density turbulence and its perpendicular rotation velocity at different turbulence scales. Besides that, coherent MHD modes can be detected in the DBS signals [
19]. This diagnostic is installed on many tokamaks and has been used to research different plasma processes on the Globus-M/M2 [
7,
8,
9,
10,
11,
20]. Various oscillatory phenomena were thoroughly investigated, such as geodesic acoustic modes (GAMs), limit-cycle oscillations (LCOs), Alfven eigenmodes (AEs) and filaments.
On the Globus-M2 tokamak two DBS systems were used to detect tearing modes [
21,
22]. One of them has four channels with probing frequencies 20, 29, 39, 48 GHz and two steerable antennas which probe the plasma with O-mode microwaves. The detection region of the system covered the interval of normalized minor radii ρ = 0.7–1.1 for typical discharges presented in the following segments. The 20 GHz channel area of detection corresponds to outside the separatrix region, while channels with higher probing frequencies correspond to the tokamak area inside the separatrix. The second system has four channels that probe the plasma at discrete frequencies 50, 55, 60, 65 GHz, allowing to investigate the inner plasma region of the tokamak with normalized minor radii up to ρ = 0.5–0.7. Its steerable antenna was installed to probe the plasma with O-mode microwaves in experiments.
The DBS method involves the recording of two signals, the in-phase (I) and quadrature (Q) signals, which are then formed into a complex IQ signal. The derivative of the phase of the complex signal (or time dependence of the frequency shift of the scattered signal) can be calculated. Examination of the DBS phase derivative signal leads to the conclusion that it could be used to detect the instability which is similar in behavior to the TM seen on the magnetic probe signal in
Figure 1d. To prove this, spectra of the magnetic probe signal and DBS phase derivative at different moments in time were calculated. The obtained results are presented in
Figure 2. Three different moments in time were chosen:
t1 = 148 ms at the beginning of the tearing mode development,
t2 = 156 ms in the middle and
t3 = 162 ms at the end. One may note that the main frequency component is the same for both DBS and magnetic probe measurements. Over time the TM frequency decreases from 11.7 to 6.8 kHz. The spectral power behaves similarly for both diagnostics, with it decreasing significantly, especially in the case of DBS measurements.
Not all DBS channels could detect the tearing mode. In discharge #40420 the TM was observed on only one DBS channel with the 48 GHz probing frequency, as the TM intensity was high enough to be detected above the background. This is demonstrated in
Figure 3 where the spectrograms of the DBS phase derivative signals for three neighboring channels with probing frequencies 39, 48, 60 GHz are presented. This highlights that the TM is only observable on the 48 GHz channel and cannot be observed on the other 20, 29, 39, 48, 60 GHz channels. It is found in the spectrogram at 148–165 ms during the same time as the fluctuations on the magnetic probe signal in
Figure 1d. The frequency of the TM decreases from 12 to 7 kHz, as demonstrated in
Figure 2.
2.2. Island Width Estimate
Local measurements using the DBS diagnostic allowed for the tearing mode localization to be estimated. For this purpose, ray tracing was performed using a 3D ray tracing code written in the Wentzel–Kramers–Brillouin (WKB) approximation and for the Globus-M2 geometry [
23]. The microwave beam trajectory was calculated and positions of the cut-offs were obtained. The results of calculations for discharge #40420 are presented in
Figure 4. It depicts the poloidal cross-section of the Globus-M2 tokamak with DBS antennas (brown triangles) and magnetic probe (blue circle) schematically shown. The series of lines in
Figure 4 indicate the trajectories of the probing beams which correspond to the available 20, 29, 39, 48, 60 GHz probing frequencies. The magnetic field configuration was calculated using EFIT data [
24] and a series of flux surfaces were also introduced to the figure.
The TM was observed on only the 48 GHz channel among the available 20, 29, 39, 48, 60 GHz channels. The trajectory of the probing beam with the 48 GHz frequency is shown in blue in
Figure 4. The cut-off position for the 48 GHz channel corresponds to the magnetic surface with
q = 2 which was calculated by EFIT and is introduced to
Figure 4 in bright red. The toroidal number of the mode
n = 1 was established by means of a toroidal array of magnetic probes. This leads us to the conclusion that the TM seems to have a mode structure of
m/n = 2/1.
Using DBS data, we may also estimate the island width for the #40420 discharge. The TM was detected on one channel, so it was dubbed the narrow tearing mode. As the TM was not found on the 39 or 60 GHz channels, the island width is limited by their cut-off positions. This is why in
Figure 4 the areas in yellow indicate the area where the TM could potentially have developed, however there was no DBS data available to confirm this. Using the radii values of the cut-offs we can estimate the island width to be less than 3 cm.
3. Wide Tearing Modes
Other tearing modes were seen in the Globus-M2 experiments and the discussed discharge scenario is presented in
Figure 5. The main parameters of the deuterium plasma for discharge #40515 were toroidal magnetic field B
T up to 0.7 T and a plasma current I
p up to 0.2 MA. Under these conditions a different temporal evolution of the tearing mode was observed on the magnetic probe signal in
Figure 5d. The fluctuations took place for 57 ms starting at 138 ms. The amplitude of these fluctuations stays roughly the same throughout the time of existence of the TM. In discharge #40515 the TM developed at the start of the plateau phase of the plasma current, as demonstrated in
Figure 5a. The average electron density n
e first increases from 2.2 × 10
19 m
−3 to 3 × 10
19 m
−3 until 153 ms; after which the density decreases steadily until the end of the discharge (
Figure 5c). The behavior of the electron density n
e, as well as the growth of the D
α signal indicate that the plasma was not able to reach good confinement in this case. In discharge #40515 there was no NBI, so the TM developed during the Ohmic phase. In addition, a disruption occurs at 196 ms, and the tearing mode could be the trigger for this. The mode numbers also appear to be
m/n = 2/1.
3.1. DBS Measurements
In discharge #40515 several DBS channels out of the available 39, 50, 55, 60, 65 GHz channels detected the tearing mode. The TM was observed at the same time as the fluctuations on the magnetic probe signals in
Figure 5d. The calculated spectrograms of the DBS phase derivative are presented in
Figure 6. The TM was clearly observed on the 39, 50 and 55 GHz channels with its intensity being significantly above the background. It is also visible for a short time on the 60 GHz channel; however, the TM cannot be clearly seen on the 65 GHz channel. Due to the decrease in electron density (see
Figure 5b), the TM could not be detected for the whole time period of its existence using the 50 and 55 GHz probing frequencies. This is explained by the fact that the cut-off for these channels moves out of the area of TM existence. The frequency of the tearing mode decreases from 11 to 3 kHz at 144–157 ms; after which it increases to 7 kHz and remains at this value for the remaining time of the TM existence.
3.2. Island Width Estimate
The DBS data from
Figure 6 were used to establish the area of tearing mode development and estimate the magnetic island width. The probing beam trajectories and magnetic flux surfaces for discharge #40515 are presented in
Figure 7. The TM was detected using channels with probing frequencies of 39, 50, 55 and 60 GHz. The area between the cut-offs of the channels where the TM was observed is colored blue in
Figure 7. Additionally, the area between the 60 and 65 GHz frequency cut-offs, as well as outside the 39 GHz frequency is colored yellow to indicate the area where the TM could potentially have developed; however, no DBS data were available to confirm this for discharge #40515. The magnetic surface
q = 2 is introduced to
Figure 7 in bright red; it is located in the center of the blue area where the TM was detected using DBS.
As the TM was found on several DBS channels, it has been dubbed the wide tearing mode. We may assume that the island width is limited by the cut-off positions of the 65 and 39 GHz frequencies. Using the cut-off radii values we can estimate the island width to be 8–10 cm.
3.3. Tearing Mode in H-Mode Discharge
In previous sections, the tearing modes observed in Ohmic heating regimes were discussed; however, TMs also developed in discharges with auxiliary heating. They were found in experiments with a transition to high confinement or the H-mode which was initiated using NBI. This scenario in discharge #42142 is presented in
Figure 8. The main parameters of the deuterium plasma were toroidal magnetic field B
T up to 0.8 T and a plasma current I
p up to 0.35 MA. Transition to the H-mode takes place at 161 ms and is characterized by an increase in electron density n
e, a drop in D
α signal and edge-localized mode (ELM) development [
20,
25]. The TM was detected using the magnetic probe at a later stage of the discharge at 204 ms. The fluctuations lasted for 7 ms and ultimately ended in a disruption. Starting from 208 ms, the oscillation amplitude on the magnetic probe signal decreases (
Figure 8f) with a simultaneous decrease in the TM frequency which is a characteristic sign of mode locking. The rotation of the mode slows down to a complete stop with a simultaneous increase in the locked mode amplitude, which leads to a disruption. The increase in the amplitude of the locked mode from 208 ms was recorded by a special magnetic sensor (
Figure 8e). The sensor is a combination of two magnetic coils located outside the vacuum chamber in the equatorial plane. The integrated difference signal of the two coils describes the inhomogeneity of the radial magnetic flux caused by the appearance of the locked mode. During the existence of the TM in discharge #42142 a degradation of plasma confinement leading to a transition back to the L-mode is observed. This is indicated by a decrease in the average electron density n
e from 7.4 × 10
19 m
−3 to 6.2 × 10
19 m
−3 and growth of the D
α signal. The soft X-ray (SXR) signal (
Figure 8d) decreases steadily during this time which means that the temperature is reduced after the development of the tearing mode takes place. The poloidal rotation velocity of the plasma is affected by MHD activity [
26], as during the TM there was an observable decrease in rotation velocity. This is demonstrated in
Figure 8g in the form of the measured Doppler frequency shift of the 39 GHz channel. In discharge #42142 a disruption occurs at 211 ms. The scenario of a disruption after MHD activity is a studied phenomenon [
27,
28]. The mode numbers of the TM in this case also appear to be
m/n = 2/1.
The tearing mode was detected using DBS. It was observed on several channels at the same time as it was seen on the magnetic probe signals in
Figure 8e. The TM was found on channels with probing frequencies 29, 39, 48, 50, 55 and 60 GHz; however, it was not found on the 65 or 20 GHz channels. The calculated spectrograms of the DBS phase derivative for two of the channels are presented in
Figure 9. The frequency of the TM decreases from 20 to 9 kHz over time. The fact that the area of detection spans a large range of radii indicates that this another example of a tearing mode with a large width of the magnetic island.
4. Discussion
Two types of tearing modes were detected on the Globus-M2: the narrow TM and the wide TM. While both scenarios can take place, the wide TM is more typical for Globus-M2 discharges. This is due to the conditions of its formation being more favorable. As the narrow TM develops at the stage of the plasma current growth, it means that the magnetic field geometry of the plasma is changing rapidly at this point, meaning the conditions necessary for this type of TM to develop do not last long enough for the mode to always become unstable. This is not the case for the wide TM which occurs when the plasma current has reached the plateau phase.
The different tearing modes found on the Globus-M2 raise a series of questions when it comes to explaining the differences in their behavior. One of those is the nature of the TMs observed. Additional analysis is necessary to understand whether it is the classical [
29] or neoclassical tearing mode (NTM) [
30]. On the Globus-M it was noted that the high value of the poloidal plasma pressure β
p of around 0.3 seemed to determine the development of the NTM. This is why discharges with the MHD mode supposedly to be the NTM need to be modelled to determine the β
p.
Additionally, the difference in island width is an important topic for investigation. For instance, the tearing modes in discharges #40420 and #40515 are both characterized by a magnetic field amplitude of around 2.5 mT meaning that this parameter cannot explain the difference in island width between them. However, the TM in discharge #42142 (which developed under different conditions compared to the other cases) has a magnetic field amplitude of 5 mT which might be enough to justify the large island width. This why modelling of the magnetic island width will be performed using magnetic probe signals and compared to the modified Rutherford theory. The results will also be compared with values from experiments.
Apart from that, it is important to explain the employment of the DBS diagnostics for tearing mode study. A similar analysis has previously been performed for a different type of MHD activity, the Alfven eigenmode (AE) [
10], and it led to the conclusion that the magnetic field amplitude could be calculated from the DBS measurements without having to deal with the spatial damping of the instability. Thus, depending on the explanation for why the TM is found in DBS phase derivative signals, DBS might be a useful tool for obtaining direct measurements of the magnetic field in the presence of TMs as well. Large-scale MHD instabilities of a 10 cm scale cannot lead to the backscattering of super-high-frequency (SHF) radiation due to the fact that Bragg’s law would not be satisfied. Based on DBS measurements the scale of plasma fluctuations
is around 1 cm and is much smaller than the TM observed. However, they might have been observed due to possible significant magnetic field perturbations near the position of the cut-offs. This, for example, can lead to changes in the angle of incidence of the incident beam and can be potentially responsible for the detection of the TM in the DBS phase derivative signals. Additionally, full-wave modelling of the processes of backscattering in the case of the presence of NTMs will be undertaken.
5. Conclusions
The spherical tokamak Globus-M2 MHD activity was observed to lead to a deterioration in plasma confinement. This was seen in the form of transitions from high confinement (H-mode) to the L-mode and the discharges would ultimately end in disruptions. These MHD modes were found to be tearing modes (TMs). They are a result of the formation of magnetic islands in the tokamak plasma. The width and velocity of the TM are key parameters that determine the impact of the mode on plasma confinement.
Different diagnostics were used to investigate the TMs on the Globus-M2. They were observed as fluctuations in the magnetic probe signals. The array of magnetic probes was used to determine the mode structure m/n = 2/1 of the TMs. The Doppler backscattering method was demonstrated as an effective tool to study this MHD activity. Two DBS systems were used to detect TMs on the Globus-M2. The eight available channels with probing frequencies 20, 29, 39, 48, 50, 55, 60, 65 GHz correspond to the area of detection with normalized minor radii ρ = 0.5−1.1. The steerable antenna systems probed the plasma with O-mode microwaves in experiments. The TM was found in the DBS phase derivative signals at the same time as the fluctuations in magnetic probe signals.
Different types of TMs were observed on the Globus-M2. One was a TM with a narrow magnetic island width of less than 3 cm. It developed at the early stage of the discharge during the plasma current growth and did not lead to detrimental consequences to plasma performance. It developed around the magnetic surface q = 2. The other TMs had wide magnetic islands with a width estimated from 8 to 10 cm. They developed during the plateau stage of the plasma current. Such TMs caused significant degradation of plasma confinement, such as transition from the H-mode to the L-mode, and their development was followed by a disruption of the discharge.
Author Contributions
Conceptualization, A.P. (Anna Ponomarenko) and A.Y.; methodology, A.P. (Alexander Petrov) and G.K.; software, A.P. (Anna Ponomarenko) and N.Z.; validation, V.M., Y.P. and N.S.; formal analysis, A.Y.; investigation, A.P. (Anna Ponomarenko), I.B. and N.Z.; resources, E.K., V.M., Y.P. and N.S.; data curation, A.Y.; writing—original draft preparation, A.Y. and A.P. (Anna Ponomarenko); writing—review and editing, A.Y., G.K., Y.P. and N.S.; visualization, A.P. (Anna Ponomarenko); supervision, A.Y.; project administration, A.Y.; funding acquisition, A.Y. All authors have read and agreed to the published version of the manuscript.
Funding
The work is supported by the Russian Science Foundation (Project No. 18-72-10028).
Institutional Review Board Statement
Not applicable.
Informed Consent Statement
Not applicable.
Data Availability Statement
The data presented in this study are available on request from the corresponding author.
Acknowledgments
This work was performed using the Federal Joint Research Center “Material science and characterization in advanced technology”, including the unique scientific facility “Spherical tokamak Globus-M”.
Conflicts of Interest
The authors declare no conflict of interest. The funders had no role in the design of the study; in the collection, analyses, or interpretation of data; in the writing of the manuscript; or in the decision to publish the results.
References
- Kim, J.S.; Edgell, D.H.; Greene, J.M.; Strait, E.J.; Chance, M.S. MHD mode identification of tokamak plasmas from Mirnov signals. Plasma Phys. Control. Fusion 1999, 41, 1399. [Google Scholar] [CrossRef]
- Zohm, H. Magnetohydrodynamic Stability of Tokamaks, 1st ed.; WILEY-VCH Verlag GmbH & Co. KGaA: Weinheim, Germany, 2015. [Google Scholar]
- Nishimura, Y.; Callen, J.D.; Hegna, C.C. Tearing mode analysis in tokamaks, revisited. Phys. Plasmas 1998, 5, 4292. [Google Scholar] [CrossRef] [Green Version]
- Wilson, H.R. Neoclassical tearing modes. Fusion Sci. Technol. 2006, 49, 155–163. [Google Scholar] [CrossRef]
- Dudkovskaya, A.V.; Patrov, M.I.; Gusev, V.K.; Kurskiev, G.S.; Petrov, Y.V. Tearing Mode Behavior in the Globus-M Spherical Tokamak Plasma. Phys. Atom. Nuclei 2018, 81, 1033–1036. [Google Scholar] [CrossRef]
- Kurskiev, G.S.; Gusev, V.K.; Tolstyakov, S.Y.; Berezutskii, A.A.; Bulanin, V.V.; Varfolomeev, V.I.; Kochergin, M.M.; Minaev, V.B.; Mukhin, E.E.; Patrov, M.I.; et al. Formation of internal transport barriers in Globus-M tokamak in regime with early neutral heating beam switch-on. Tech. Phys. Lett. 2011, 37, 1127–1131. [Google Scholar] [CrossRef]
- Yashin, A.; Bulanin, V.; Petrov, A.; Ponomarenko, A. Review of Advanced Implementation of Doppler Backscattering Method in Globus-M. Appl. Sci. 2021, 11, 8975. [Google Scholar] [CrossRef]
- Yashin, A.Y.; Bulanin, V.V.; Gusev, V.K.; Khromov, N.A.; Kurskiev, G.S.; Minaev, V.B.; Patrov, M.I.; Petrov, A.V.; Petrov, Y.V.; Prisyazhnyuk, D.V.; et al. Geodesic acoustic mode observations in the Globus-M spherical tokamak. Nucl. Fusion 2014, 54, 114015. [Google Scholar] [CrossRef]
- Yashin, A.Y.; Bulanin, V.V.; Gusev, V.K.; Kurskiev, G.S.; Patrov, M.I.; Petrov, A.V.; Petrov, Y.V.; Tolstyakov, S.Y. Phenomena of limit-cycle oscillations in the Globus-M spherical tokamak. Nucl. Fusion 2018, 58, 112009. [Google Scholar] [CrossRef]
- Bulanin, V.V.; Gusev, V.K.; Kurskiev, G.S.; Minaev, V.B.; Patrov, M.I.; Petrov, A.V.; Petrov, Y.V.; Yashin, A.Y. Application of the Multifrequency Doppler Backscattering Method for Studying Alfvén Modes at a Tokamak. Tech. Phys. Lett. 2019, 45, 1107–1110. [Google Scholar] [CrossRef]
- Bulanin, V.V.; Gusev, V.K.; Khromov, N.A.; Kurskiev, G.S.; Minaev, V.B.; Patrov, M.I.; Petrov, A.V.; Petrov, M.A.; Petrov, Y.V.; Prisiazhniuk, D.; et al. The study of filaments by the Doppler backscattering method in the ‘Globus-M’ tokamak. Nucl. Fusion 2019, 59, 096026. [Google Scholar] [CrossRef]
- Petrov, Y.V.; Gusev, V.K.; Sakharov, N.V.; Minaev, V.B.; Varfolomeev, V.I.; Dyachenko, V.V.; Balachenkov, I.M.; Bakharev, N.N.; Bondarchuk, E.N.; Bulanin, V.V.; et al. Overview of GLOBUS-M2 spherical tokamak results at the enhanced values of magnetic field and plasma current. Nucl. Fusion 2022, 62, 042009. [Google Scholar] [CrossRef]
- Conway, G.D.; Schirmer, J.; Klenge, S.; Suttrop, W.; Holzhauer, E. Plasma rotation profile measurements using Doppler reflectometry. Plasma Phys. Control. Fusion 2004, 46, 951–970. [Google Scholar] [CrossRef]
- Hirsch, M.; Holzhauer, E.; Baldzuhn, J.; Kurzan, B.; Scott, B. Doppler reflectometry for the investigation of propagating density perturbations. Plasma Phys. Control. Fusion 2001, 43, 1641. [Google Scholar] [CrossRef]
- Hennequin, P.; Honoré, C.; Truc, A.; Quéméneur, A.; Lemoine, N.; Chareau, J.M.; Sabot, R. Doppler backscattering system for measuring fluctuations and their perpendicular velocity on Tore Supra. Rev. Sci. Instrum. 2004, 75, 3881–3883. [Google Scholar] [CrossRef]
- Oyama, N.; Takenaga, H.; Suzuki, T.; Sakamoto, Y.; Isayama, A. Density Fluctuation Measurements Using a Frequency Hopping Reflectometer in JT-60U. Plasma Fusion Res. 2011, 6, 1402014. [Google Scholar] [CrossRef]
- Hillesheim, J.; Crocker, N.; Peebles, W.; Meyer, H.; Meakins, A.; Field, A.; Dunai, D.; Carr, M.; Hawkes, N. Doppler backscattering for spherical tokamaks and measurement of high-k density fluctuation wavenumber spectrum in MAST. Nucl. Fusion 2015, 55, 73024. [Google Scholar] [CrossRef] [Green Version]
- Bulanin, V.V.; Lebedev, S.V.; Levin, L.S.; Roytershteyn, V.S. Study of plasma fluctuations in the Tuman-3m tokamak using microwave reflectometry with an obliquely incident probing beam. Plasma Phys. Rep. 2000, 26, 813–819. [Google Scholar] [CrossRef]
- Estrada, T.; Happel, T.; Blanco, E. A new approach to detect coherent modes using microwave reflectometry. Nucl. Fusion 2012, 52, 082002. [Google Scholar] [CrossRef] [Green Version]
- Ponomarenko, A.; Yashin, A.; Kurskiev, G.; Minaev, V.; Petrov, A.; Petrov, Y.; Sakharov, N.; Zhiltsov, N. First Results of the Implementation of the Doppler Backscattering Diagnostic for the Investigation of the Transition to H-Mode in the Spherical Tokamak Globus-M2. Sensors 2023, 23, 830. [Google Scholar] [CrossRef] [PubMed]
- Bulanin, V.V.; Yashin, A.Y.; Petrov, A.V.; Gusev, V.K.; Minaev, V.B.; Patrov, M.I.; Prisiazhniuk, D.V.; Varfolomeev, V.I. Doppler backscattering diagnostic with dual homodyne detection on the Globus-M compact spherical tokamak. Rev. Sci. Instrum. 2021, 92, 033539. [Google Scholar] [CrossRef]
- Yashin, A.Y.; Bulanin, V.V.; Gusev, V.K.; Minaev, V.B.; Petrov, A.V.; Petrov, Y.V.; Ponomarenko, A.M.; Varfolomeev, V.I. Doppler backscattering systems on the Globus-M2 tokamak. J. Instrum. 2022, 17, C01023. [Google Scholar] [CrossRef]
- Yashin, A.; Bulanin, V.; Petrov, A.; Petrov, M.; Gusev, V.; Khromov, N.; Kurskiev, G.; Patrov, M.; Tolstyakov, S.; Prisyazhnyuk, D.; et al. Multi-diagnostic approach to geodesic acoustic mode study. J. Instrum. 2015, 10, P10023. [Google Scholar] [CrossRef]
- Sakharov, N.V.; Voronin, A.V.; Gusev, V.K.; Kavin, A.A.; Kamenshchikov, S.N.; Lobanov, K.M.; Minaev, V.B.; Novokhatsky, A.N.; Patrov, M.I.; Petrov, Y.V.; et al. Reconstruction of equilibrium magnetic configurations in the Globus-M spherical tokamak. Plasma Phys. Rep. 2015, 41, 997–1001. [Google Scholar] [CrossRef]
- Kurskiev, G.S.; Gusev, V.K.; Sakharov, N.V.; Petrov, Y.V.; Bakharev, N.N.; Balachenkov, I.M.; Bazhenov, A.N.; Chernyshev, F.V.; Khromov, N.A.; Kiselev, E.O.; et al. Energy confinement in the spherical tokamak Globus-M2 with a toroidal magnetic field reaching 0.8 T. Nucl. Fusion 2022, 62, 016011. [Google Scholar] [CrossRef]
- Yashin, A.; Belokurov, A.; Askinazi, L.; Petrov, A.; Ponomarenko, A.; the TUMAN-3M Team. The Influence of Fast Particles on Plasma Rotation in the TUMAN-3M Tokamak. Atoms 2022, 10, 106. [Google Scholar] [CrossRef]
- Schuller, F.C. Disruptions in tokamaks. Plasma Phys. Control. Fusion 1995, 37, A135. [Google Scholar] [CrossRef]
- Boozer, A.H. Theory of tokamak disruptions. Phys. Plasmas 2012, 19, 058101. [Google Scholar] [CrossRef]
- Chu, M.S.; La Haye, R.J. Study of a low β classical tearing mode in DIII-D. Phys. Plasmas 2002, 9, 4584. [Google Scholar] [CrossRef]
- Buttery, R.J.; Günter, S.; Giruzzi, G.; Hender, T.C.; Howell, D.; Huysmans, G.; La Haye, R.J.; Maraschek, M.; Reimerdes, H.; Sauter, O.; et al. Neoclassical tearing modes. Plasma Phys. Control. Fusion 2000, 42, B61. [Google Scholar] [CrossRef]
| Disclaimer/Publisher’s Note: The statements, opinions and data contained in all publications are solely those of the individual author(s) and contributor(s) and not of MDPI and/or the editor(s). MDPI and/or the editor(s) disclaim responsibility for any injury to people or property resulting from any ideas, methods, instructions or products referred to in the content. |
© 2023 by the authors. Licensee MDPI, Basel, Switzerland. This article is an open access article distributed under the terms and conditions of the Creative Commons Attribution (CC BY) license (https://creativecommons.org/licenses/by/4.0/).


 ,
, 


