
Recycled Carbon Fibers with Improved Physical Properties Recovered from CFRP by Nitric Acid

1
School of Materials and Chemical Technology, Tokyo Institute of Technology, 2-12-1 Ookayama, Meguro-ku, Tokyo 152-8552, Japan
2
Nissan Motor Co., Ltd., 560-2 Okatsukoku, Atsugi 243-0192, Kanagawa, Japan
*
Authors to whom correspondence should be addressed.
Appl. Sci. 2023, 13(6), 3957; https://doi.org/10.3390/app13063957
Submission received: 27 February 2023
/
Revised: 10 March 2023
/
Accepted: 13 March 2023
/
Published: 20 March 2023
(This article belongs to the Special Issue Materials and Technologies for Waste Recovery and Treatment)
Abstract
:To effectively reuse a large amount of Carbon Fiber Reinforced Plastics (CFRP) waste, the carbon fibers should be able to be recovered without degrading their quality. In this report, we developed a new approach to recover carbon fibers from CFRPs with improved physical properties compared to virgin carbon fibers with an environmentally friendly recycling method using nitric acid. Following the decomposition of the CFRP waste in nitric acid at 80 °C, both recycled carbon fibers and decomposed resin were recovered. The obtained recycled carbon fibers showed 1.4 times higher tensile strength and 2.2 times higher interfacial shear strength to resin compared to virgin carbon fibers. TEM-EDX analysis showed a decrease in the abundance of voids existing in the carbon fiber surface layer and new polar functional groups caused by nitric acid existing inside the voids, leading to increased tensile strength. Furthermore, XPS analysis showed that the interfacial shear strength improved due to the formation of new polar functional groups due to nitric acid. The possibility of applying recycled carbon fibers to CFRP products was shown by elucidating the mechanism that expressed its physical properties during the recycling process, leading to a novel approach to realizing closed-loop recycling.
1. Introduction
Various global efforts to achieve carbon-neutral societies are now accelerating. In automobile industries, vehicle electrification is urgently needed; however, to proceed with the electrification of the vehicles, reducing the weight of vehicle bodies is essential due to the weight of the batteries and motors.
Carbon-fiber-reinforced plastics (CFRPs) are receiving much significant attention as lightweight and high-strength materials. Recent years have seen the new use of CFRPs in vehicle frames, and global demand for automotive CFRPs is forecast to double between 2020 and 2030 [1]. In a wide range of other industries, CFRP applications and its global market size are expected to continue growing in the future.
However, the expanding use and growing global market for CFRPs means the generation of large volumes of used CFRPs waste in the future [2]. No suitable method of processing scrapped CFRP has currently been established [3], and the majority of solutions require disposal in a landfill. Therefore, it is important to establish recycling methods and plan for the effective use of resources, prior to the generation of large volumes of scrapped CFRPs. This is particularly important because of the large amount of energy necessary for manufacturing virgin carbon fibers.
Much research into CFRP recycling has been carried out in recent years, such as recycling methods that use thermal decomposition and chemical decomposition. The thermal decomposition method decomposes the resin at 400–800 °C, negatively resulting in the loss of the interfacial shear strength between the carbon fibers and the resin [4], and decreased fiber strength [5]. In addition, the resin cannot be recycled because it will be completely decomposed and exhausted in the form of CO2. The supercritical and subcritical fluid methods, which are chemical decomposition methods, decompose the resin at 100 °C–300 °C and 10–20 MPa [6,7]. According to this method, since functional groups are formed on the carbon fiber surface during the recycling process, it is possible to reduce the deterioration in the fiber quality compared to thermal decomposition methods [8]. However, similarly to thermal decomposition methods, the resin cannot be recycled, since the majority of the resin will be removed in the form of gas components, and a small amount of charred substance will be produced as a residue.
For these reasons, we have focused on a chemical decomposition method that uses nitric acid [9,10,11,12,13,14,15]. The nitric acid recycling method could decompose epoxy resin while immersing the CFRP sample into nitric acid under relatively mild conditions. This method not only decomposes epoxy resin but also allows the decomposed epoxy resin to be chemically recycled [12,13]. This method was used on a CFRP prepreg material (sheet-shaped intermediate material impregnated with semi-cured epoxy resin), and successfully recovered the carbon fibers [14]. Furthermore, based on our previous report [15], this method was also successful in recovering both the carbon fibers and the decomposed resin component from CFRP automobile parts, which are expected to be generated in large volumes in the future.
To apply these recycled carbon fibers to CFRP products and achieve closed-loop recycling, it is highly important to understand the physical properties of the recycled carbon fibers, for recycled CFRP products to perform in a stable manner. This study attempted to identify the mechanisms behind the expression of the physical properties of recycled carbon fibers and also conducted a study concerning the future expansion of this nitric acid recycling method.
2. Materials and Methods
2.1. Materials
2.1.1. CFRP Samples
We used CFRP automotive prototype wastes manufactured using virgin carbon fibers (vCFs) in a fabric form and fully cured epoxy resin (bisphenol A epoxy resin and polyamine as hardener) (Figure 1a). To conduct laboratory-scale tests, CFRP samples were crushed using a single-shaft crusher (EH-6090 (55 kW), Horai Co., Ltd., Osaka, Japan) and then separated and collected using a φ30 mm sifter. Samples with a dimension of approximately 20 mm × 30 mm × 2 mm were used as the CFRP specimens (Figure 1b).
2.1.2. Epoxy Resin Decomposition and Recovery of Recycled Carbon Fibers and Resins
The CFRP specimen was fixed using a PTFE tube (inner diameter = 6 mm; outer diameter = 8 mm) and immersed in a test tube containing an aqueous solution of nitric acid (Kanto Chemical Co., Inc., Tokyo, Japan, special grade). The nitric acid aqueous solution was adjusted to 8 M because a sufficient concentration of nitric acid was necessary to proceed with the resin decomposition reaction, as shown in the previous report [15]. The volume of the nitric acid aqueous solution was adjusted to 16 mL per 1 g of CFRP specimen. The test tube was placed in a bath with a constant temperature of 80 °C. After immersion for 2 h–120 h, the solid residue containing the carbon fibers was collected from the test tube. The recycled carbon fibers (rCFs) were fully rinsed with deionized water, and the residual moisture in the carbon fibers was removed using a dryer (at 80 °C for 48 h) (Figure 1c).
The resin dissolved in the nitric acid aqueous solution was recovered through a liquid-liquid extraction performed at room temperature using ethyl acetate (Kanto Chemical Co., Inc., Tokyo, Japan >99.3%) [15]. In this study, we report the results focused only on the rCFs, and an evaluation of the recovered decomposed resin component will be described in further research. However, it was confirmed that this method could recover both the carbon fibers and the decomposed resin component from CFRP molded products.
2.1.3. Immersion of Virgin Carbon Fibers in Nitric Acid
To conduct a comparative evaluation with the rCF, we prepared a sample of vCF immersed in nitric acid. We used the same vCF that was used in the CFRP sample described in Section 2.1.1. The fiber diameter of the vCF was 7.25 ± 0.19 μm, which an epoxy resin sizing agent applied to the vCF surface and then processed into a fabric form with a mass per unit area of 145 g/m2 by weaving the fibers. This vCF was fixed using a PTFE tube and immersed in a test tube containing 8 M of an aqueous solution of nitric acid (the volume of the nitric acid aqueous solution was adjusted to 16 mL per 1 g of vCF), and placed in a bath with a constant temperature of 80 °C. After immersion for 8 h–24 h, the vCF was collected, and fully rinsed with deionized water, and the residual moisture to the carbon fibers was dried at 80 °C for 48 h.
2.2. Methods
2.2.1. Time Change of Epoxy Resin Decomposition Ratio
The rResin decomposition rate Rd (mass%) of the CFRP specimen was calculated using Formula (1), where m0 is the sample mass before immersion in the nitric acid aqueous solution, mt is the sample mass after immersion in the nitric acid aqueous solution for 2 h–48 h, fully rinsed with deionized water and completely dried according to the procedure explained in Section 2.1.2, and Fm is the mass fraction of resin in the CFRP specimen.
Rd = (m0 − mt)/(m0 × Fm) × 100
The mass fraction of the resin in the CFRP specimen (Fm) was experimentally evaluated by heat treating the CFRP specimen and measuring the mass change of the sample before and after thermal decomposition (Figure A1). It was confirmed that Fm showed a value of 40.0%.
2.2.2. Interfacial Shear Strength between Carbon Fiber and Resin
A microdroplet test was performed on the vCF and the rCF to evaluate the adhesion between the carbon fibers and the resin. The measurement method for the microdroplet test is shown in Figure A2. The type of epoxy resin and the curing conditions in this test were the same as that used for the CFRP samples. Evaluation equipment for the interfacial properties of the composite materials (model HM410, Tohei Sangyo Co., Ltd., Tokyo, Japan) was used for the measurement. The maximum load F (mN) when pulling a single fiber out from the resin ball at a speed of 0.12 mm/min was measured, and the interfacial shear strength of τ (MPa) was calculated using Formula (2), where F is the maximum measured load (mN), d is the carbon fiber diameter (measured value, 6.6 to 7.6 μm shown in Figure A3), and L is the diameter of the resin ball (measured value, 50 to 80 μm). Measurements were performed at least n = 20 times.
τ = F/πdL × 103
It has been reported that there is a positive correlation between interfacial shear strength τ and resin ball diameter L [16]. To perform a comparative evaluation of the interfacial shear strength with the same size of resin ball, the measured value τ was plotted to the resin ball diameter L, and the interfacial shear strength τ at a resin ball diameter of L = 70 μm was calculated using approximation formula.
2.2.3. Tensile Strength Test of Single Carbon Fiber
The tensile strength test was performed on a single fiber of the vCF and rCF. The test pieces were created based on JIS R 7606 by attaching a single fiber to a paper mount [14,15]. The paper mount was fixed to a micro-strength tensile tester (AcroEdge Corporation, Osaka, Japan) and both ends of the sample were pulled at a speed of 1 mm/min. The maximum load F’ (mN) and the displacement Δλ when a single fiber fractured was recorded. Fracture strain ε (=Δλ/λ) was calculated using λ = 25 (mm) which is the fiber length of the carbon fiber. The tensile strength σ (GPa) and tensile modulus of elasticity E (GPa) were evaluated using Formulas (3) and (4).
σ = 4F’/πd2
E = σ/ε
Tensile strength measurements were performed at least n = 20 times. The variation in the measurement data was evaluated using the Weibull function shown in Formula (5).
lnln(1/(1 − Pf)) = m × ln(σ/σ0)
Pf = (i − 0.3)/(q + 0.4)
The cumulative probability of fracture Pf in Formula (5) was calculated using the median rank method shown in Formula (6), where m is the shape factor in the Weibull function, σ0 is the scale factor, i is the element number, and q is the number of elements.
2.2.4. Analysis of Carbon Fiber Surface and Cross Section
The surfaces of the vCF, the vCF immersed in nitric acid for 8 h (vCF 8 h), and the rCF collected from CFRP immersed in nitric acid for 12 h–120 h (rCF 12 h–rCF 120 h) were observed using a scanning electron microscope (SEM) (JSM-6510LA, JEOL Ltd., Tokyo, Japan). The shape image and phase image of the carbon fiber surfaces were obtained using an atomic force microscope (AFM) (Bruker AXS, Bruker Corporation, Massachusetts, United States of America). An AFM measurement was performed in the tapping mode under an Ar atmosphere, using a cantilever made of Si. The elemental analysis of the carbon fiber surface was performed using X-ray photoelectron spectroscopy (XPS) analysis (Quantum-2000, ULVAC-PHI Inc., Kanagawa, Japan). The X-ray source was monochromated-Al-Κ α rays (1486.6 eV) with a photoelectron take-off angle of 45°. Cross-sections of the carbon fiber samples with a thickness of 100 nm were prepared by focused ion beam (FIB) cutting using a dual beam FIB/SEM system (Nova200 NanoLab, FEI, United States of America), with a Pt protective membrane, applied to the carbon fiber surface in advance. The carbon fiber cross-section was then examined using a transmission electron microscope (TEM) (JEM-F200, JEOL Ltd., Tokyo, Japan). The element distribution of the carbon fiber cross-section was examined using an energy-dispersive X-ray spectroscopy (EDX) analysis system. The carbon fiber graphite structure was evaluated using a laser Raman spectroscope (SENTERRA, Bruker Optics Corporation, Billerica, MA, USA). The excitation wavelength of the laser was 532 nm, and the laser intensity was 0.2 mW.
3. Results
3.1. Time Change of Resin Decomposition in CFRP Specimen
The resin decomposition rate Rd in the CFRP specimen that was immersed in an 8 M, 80 °C nitric acid aqueous solution was calculated and is shown in Figure 2. The results showed an Rd = 90 mass% at 12 h, Rd = 95 mass% at 24 h, and Rd = 95 mass% at 48 h. Since almost no changes were observed after 24 h, it was considered that nearly all of the resin was decomposed within 24 h.
3.2. Interfacial Shear Strength between Carbon Fiber and Resin
A microdroplet test was performed for the vCF and rCF, the results of which are shown in Figure 4. First, the interfacial shear strength of the vCF from 8 h to 24 h increased slightly compared to vCF. For the rCF, the maximum interfacial shear strength values occurred in rCF 12 h and rCF 24 h, and rCF 24 h was τ = 71 ± 7.4 MPa, which was 2.2 times higher than that of the vCF. In rCF 120 h, the interfacial shear strength showed τ = 40 ± 1.2 MPa, demonstrating that even an rCF recovered after excessive immersion in nitric acid can maintain approximately the same level of interfacial shear strength as a vCF to which sizing agent was applied.
3.3. Tensile Strength of Carbon Fiber
A single fiber tensile test was performed for vCF and rCF. The results of the tensile strength σ and tensile modulus E are shown in Figure 5. A Weibull plot of the tensile strength only for the representative data is shown in Figure A4. Since Figure A4 shows linear plots, tensile strength could be approximated using a Weibull distribution. The Weibull modulus of m was calculated from the slope of the Weibull plot and the scale factor σ0 was calculated from the intercept, as shown in Table A1. The value of the Weibull modulus m indicates the magnitude of the variation in the data, in which a larger value of m indicates a smaller variation. It shows approximately m = 3 to 7 for the PAN carbon fibers in a previous report [17]. Therefore, the shape factor of m calculated in this research as shown in Table A1 is considered to be a reasonable value. This indicates that the tensile strength values acquired by measurement are highly reliable results.
According to the tensile strength results shown in Figure 5, vCF 8 h exhibited a 1.3 times higher value than that of vCF. However, we can see that the value subsequently declines in vCF 12 h and vCF 24 h to or below that of vCF. On the contrary, in rCF 12 h, the tensile strength increased 1.4 times than vCF, and a high value was maintained up to rCF 72 h. However, excessive immersion in nitric acid (rCF 120 h) resulted in decreased tensile strength to or below that of vCF. The tensile modulus shown in Figure 5, demonstrates that there were no significant differences for the samples of vCF 0 h to 24 h and rCF 8 h to 48 h. This suggested that there was no large structural change in the materials [18]. However, rCF 72 h and rCF 120 h showed 0.8 to 0.9 times lower values than vCF. Since it is known that a highly crystalline graphite structure demonstrates a high modulus [18], this result suggested that the crystallinity of the graphite structure might decrease after excessive immersion in nitric acid.
3.4. Shape Observation of Carbon Fiber Surface
To examine the mechanism of why the vCF treated with nitric acid and rCF not only demonstrated a higher interfacial shear strength between the carbon fibers and resin than vCF, but also demonstrated higher single-fiber tensile strength, the following measurement was implemented.
Using an AFM, shape imaging was performed to observe the carbon fiber surface shape and to evaluate the differences in the physical properties. Figure 6 shows the results of the surface roughness calculated by the shape image, shown in Figure A5. The surface roughness was Rq = 69.6 nm for vCF and it showed a slight decrease in vCF 8 h, rCF 12 h, and 24 h. The data variability was large in rCF 12 h compared to the other samples. This was considered to be due to the resin residue partially remaining on the rCF 12 h surface, which was also suggested in Section 3.1. It further declined to Rq = 41.9 nm in rCF 120 h. It has been reported that treatment with nitric acid smooths large grooves on the carbon fiber surface [19,20]. This was presumed to be the result of the nitric acid removing the weak and fragile parts of the graphite structure bonds formed on the CF surface during the manufacturing process [19,21]. Since the same phenomenon was confirmed in this research, it was suggested that the fragile layer of the graphite structure that existed on the surface was removed by nitric acid.
3.5. Elemental Distribution on Carbon Fiber Surface
Elemental distribution analysis of the carbon fiber surfaces was performed using XPS. The results showed peaks produced by the elements of C, O, and N in all samples. We also performed a peak separation of the C, O, and N peaks, and the functional group composition ratios are shown in Table 1. The total of hydroxy groups and ether groups in vCF was 27.8%, in which the ether groups were considered to originate from the epoxy-type sizing agent applied to the vCF surface. This amount decreased to 23.3% in vCF 8 h, which suggested that the sizing agent was removed by the nitric acid. However, for the rCF, the presence ratio of the hydroxy groups and ether groups was nearly the same in rCF 24 h and vCF 8 h. This was considered to be due to the fact that the sizing agents were removed from the surface of rCF 24 h. The reason that the total amount of hydroxy groups and ether groups was largest in rCF 12 h was considered to be due to the fact that a slight resin residue was present on the surface. The presence ratio of hydroxy groups and ether groups in rCF 120 h decreased, and it was presumed that this is due to the oxidation of the functional groups that produced carboxy groups [22]. It was also confirmed that rCF contained approximately 8 to 9% of nitro groups and amino groups. Because the content of these functional groups in vCF was approximately only 1%, this suggested that these nitro groups and amino groups were formed by nitric acid. Finally, when we look at the O content, vCF 8 h and rCF 12 h to 120 h contain a larger abundance compared to vCF. This result also suggested that, despite the fact that the sizing agent was removed, new functional groups were formed on the surface.
3.6. Structure and Elemental Distribution of Carbon Fiber Cross-Section
The results taken from the TEM observation of the carbon fiber cross-sections are shown in Figure 7. First, the vCF TEM observation results showed that voids were present in an area of 400 nm inward from the carbon fiber surface. The size of the voids ranged from 1 nm to approximately 30 nm. Wu et al. confirmed the presence of voids, approximately 10 to 30 nm in size, inside the carbon fibers [20]. They showed that the voids are formed by gas generated during the manufacturing process, and the size and shape vary depending on the amount and type of gas generated [23]. The TEM observation results for vCF 8 h and rCF 12 h to 120 h confirmed the presence of voids; however, the voids located 50 nm inside from the outermost layer, were located much closer to the surface than in the vCF. The results of the void content in the observed carbon fiber cross-sections are summarized in Table 2, which were quantified using image analysis software Image J (ver. 1.52a). The results showed that the abundances of voids in vCF 8 h and rCF 12 h to 120 h are 1/3 or less than the abundance of those in vCF. Based on the results above, and as also indicated in the AFM observation results, the reduced abundances of voids and the movement of voids to the top surface layer was considered to be due to the removal of the voids together with the surface layer graphite structure caused by nitric acid [19,20,21].
The results from the EDX mapping of target elements C, N, and O for the observed voids are shown in Figure 8. Neither C, N, nor O was found inside the voids of the vCF. On the other hand, inside the voids of vCF 8 h and rCF 12 h to 120 h, C was not found, while N and O were detected, in which a high concentration of O was confirmed.
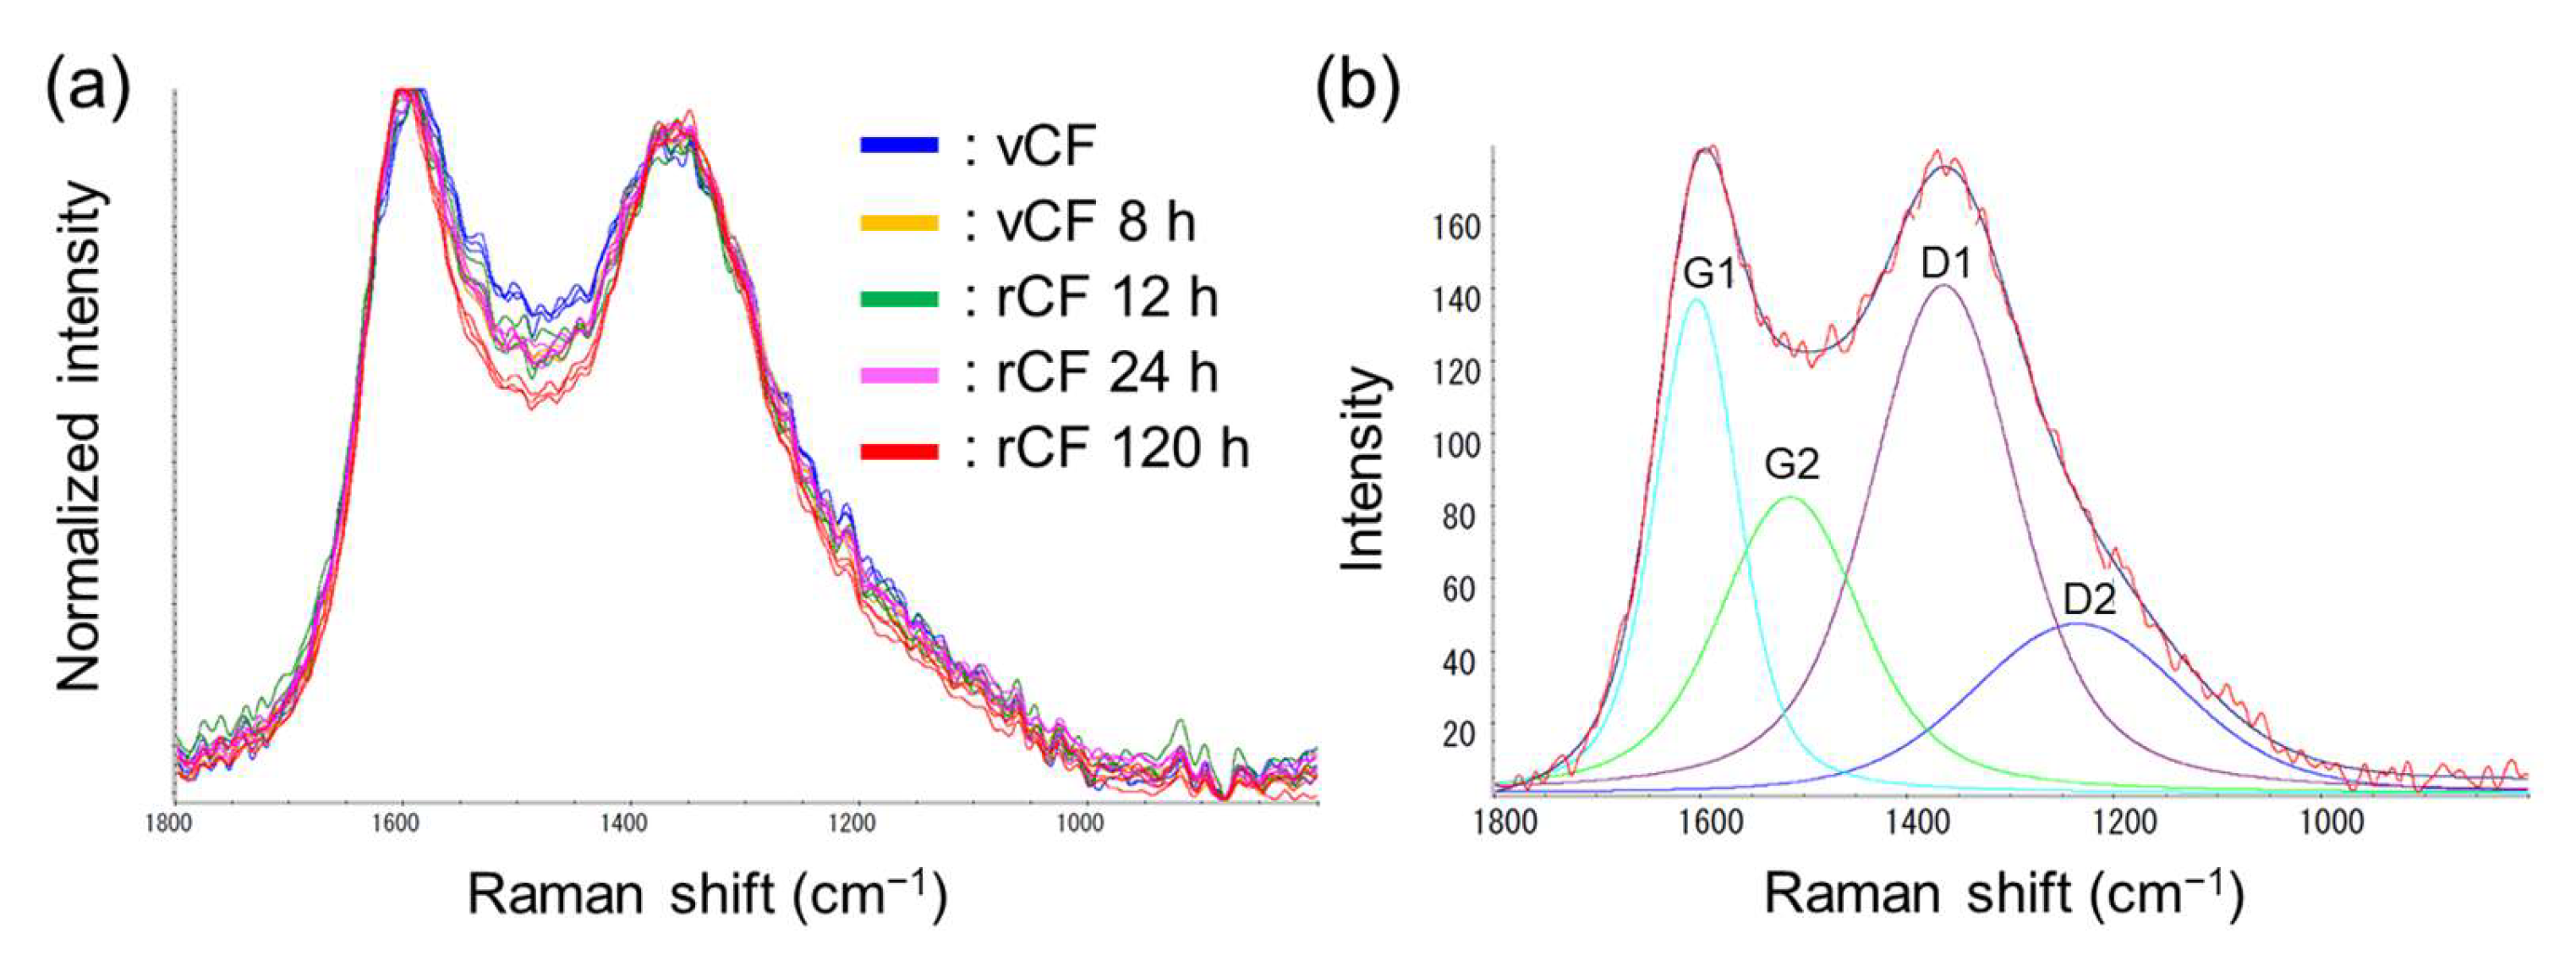
3.7. Observation of Graphite Structure by Laser Raman Spectrum Measurement
The results of a Raman spectrum acquired through the Raman spectroscopic measurements are shown in Figure A6a. A fitting to four peaks (D1, D2, G1, and G2 peaks) was performed using the Voigt function (Figure A6b). It is known that the G1 band (1600 cm−1) indicates C=C bonds, the G2 band (1500 cm−1) indicates amorphous carbon, the D1 band (1360 cm−1) indicates surface defects and the disruption of the graphite structure, and the D2 band (1230 cm−1) indicates C-H bonds [19]. The areas of the D1, D2, G1, and G2 peaks were calculated, and the results from calculating the ratios relative to the G1 band peak area are shown in Figure 9. ID1/IG1 ratios were taken to compare the surface defects and structure disruptions in each specimen, and there was no large difference between rCF 12 h or 24 h compared with vCF. However, in vCF 8 h the ratio was 1.3 times higher than vCF, and in rCF 120 h the ratio rose to 1.7 times higher than the vCF. When the IG2/IG1 ratios, which indicate the abundance of amorphous carbon, were compared, rCF 120 h showed a significantly higher value than the vCF, indicating an increase in the abundance of amorphous carbon. Based on the results above, this suggests that disruption occurred in the surface graphite structure in rCF 120 h, and its crystallinity was reduced.
4. Discussion
4.1. Mechanism of the Improvement of Interfacial Shear Strength between Carbon Fiber and Resin
The mechanism of why the interfacial shear strength between the carbon fibers and resin was increased in the rCF was considered. Usually, a carbon fiber surface is inactive, and it cannot directly create bonds with the matrix resin. Therefore, a surface treatment is applied to form polar functional groups on the virgin carbon fiber surface to bond it to the resin [24]. It is known that since functional groups that contain oxygen atoms, nitro groups, and amino groups can form hydrogen bonds with hydroxy groups in the principal chain of the epoxy resin, a larger abundance of these functional groups will increase the interfacial shear strength between the carbon fibers and resin [25,26]. Therefore, the reason why the interfacial shear strength of the rCF was higher than that of the virgin carbon fibers is presumed to be due to the new polar functional groups formed by the nitric acid on the carbon fiber surface, and the abundance of these polar functional groups increased as confirmed by the XPS, resulting in higher-strength bonds with the resin. However, the peak of the interfacial shear strength between the carbon fibers and resin was around rCF 24 h and declined slightly with longer immersion. This was considered to be due to the fact that at longer immersion times, the oxidation of the functional groups progressed, increasing the abundance of carboxy groups that have weak bonds with the resin [27]. The interfacial shear strength of vCF with the treatment in nitric acid for 8 h slightly increased, however, showed lower interfacial shear strength compared to rCF. To consider the reason, the total amount of polar functional groups in vCF 8 h was calculated at 58.6% while rCF 24 h was 62.7%, which was calculated from the XPS results shown in Table 1. The amount of polar function groups was less in vCF 8 h compared to rCF 24 h so the interfacial shear strength in vCF 8 h showed lower interfacial shear strength than that of rCF. This result also suggested that not only new polar functional groups were immobilized on the carbon fiber surface along with immersing into nitric acid, but also a slight resin residue was remaining on rCF 24 h surface, and both of them contributed to increasing the interfacial shear strength to resin.
The surface roughness calculated from the AFM shape image shown in Figure 6 decreased more in rCF than in vCF and further declined in rCF 120 h. When surface roughness increases, the anchor effect affects the bonds with the resin, contributing to increasing the bond strength with the resin [28]. However, the interfacial shear strength between the carbon fibers and resin in rCF 120 h was approximately the same value as that in vCF. Therefore, although surface roughness can assist in the bonding with the resin, it was considered that a larger contribution was made by the chemical bonds via the polar functional groups.
4.2. The Mechanism of the Improvement of Tensile Strength of Carbon Fiber
The mechanism that increased the tensile strength in the rCF compared to the virgin carbon fibers was considered. Two possible factors that led to an increase in tensile strength were confirmed.
The first is that the voids were observed near the surface inside the carbon fibers and that the abundance of the voids decreased in vCF 8 h and rCF 12 h to 120 h, compared to vCF. Since carbon fibers are brittle materials, their strength is largely affected by defects on the surface and inside the fibers [21]. As indicated in a previous report, it has been confirmed that smaller diameters of voids inside the fiber resulted in higher fiber strength [29]. As a result, in fibers with higher tensile strength, it was considered that the abundance of voids was smaller, and there was a smaller number of points where stress concentrates when a tensile load is applied, leading to higher tensile strength. The second possible factor is that the voids were found to contain functional groups with O and N. This was considered that the contained functional groups formed a compression layer to the carbon fiber surface that may have produced higher tensile strength. Here, a decrease in tensile strength was observed in rCF 120 h. Since this material showed a large ID1/IG1 ratio, it was considered that prolonged immersion of carbon fibers in nitric acid resulted in damage such as disruption and defects of the graphite structure [19]. However, vCF 24 h which was the maximum immersion time to nitric acid in this research, showed a decline in tensile strength compared to vCF 8 h, which was the minimum immersion time to nitric acid in this research, however, did not show a significant decline to the tensile strength when compared to the decline in rCF 120 h. We considered that the immersion time of vCF to nitric acid was not sufficient in 24 h to induce damage to the graphite structure and longer immersion might have induced damage to the graphite structure of vCF and led to a decrease in tensile strength. We would like to confirm this point in further research.
5. Conclusions
In this study, the mechanism behind the expression of the physical properties of the rCF recovered from CFRP molded products using the nitric acid recycling method was identified. The conclusions of this study are as follows.
- (1)
- The interfacial shear strength between the rCF and the resin was higher than that of vCF due to the formation of new polar functional groups on the carbon fiber surface due to nitric acid. This study found that, upon controlling the length of recycling time to 12–24 h, the interfacial shear strength was maximized to 2.2 times that of the vCF. Furthermore, longer immersion will oxidize the functional groups and increase the abundance of carboxy groups that have weak bonds with the resin. However, it could retain approximately the same interfacial shear strength as the vCF to which a sizing agent was applied.
- (2)
- The fiber strength of the rCF expressed a higher value than that of the vCF, with a maximum of 1.4 times than that of the vCF at rCF 12 h, due to the combined effect of the following two factors: (1) a reduction in the abundance of voids and (2) the reinforcement of the fiber strength due to the formation of new polar functional groups inside the voids by nitric acid. Furthermore, it was shown that because prolonged immersion results in defects and structural disruption of the graphite structure, the optimal recycling time for recovering the rCF with improved strength was 12 h to 72 h.
- (3)
- Elucidating the mechanism that expressed its physical properties during the recycling process made it possible to control the quality of rCF through the recycling process. Therefore, it was shown that rCF could likely be applied to CFRP products, which is a novel approach to realizing closed-loop recycling.
Author Contributions
Conceptualization, A.S.; methodology, A.S.; validation, W.K.; formal analysis, A.S.; investigation, A.S.; resources, A.S. and M.K.; data curation, W.K.; writing—original draft preparation, A.S.; writing—review and editing, W.K. and M.K.; visualization, A.S.; supervision, M.K.; project administration, M.K. All authors have read and agreed to the published version of the manuscript.
Funding
This research received no external funding.
Institutional Review Board Statement
Not applicable.
Informed Consent Statement
Not applicable.
Data Availability Statement
Not applicable.
Acknowledgments
Authors are grateful to Mitsuhiro INUI, Atsushi MIZUTANI, and Taro KURODA. This study received cooperation from Nissan ARC, Ltd. in analysis. Cooperation was received from JFE Techno-Research Corporation in the tensile strength test and microdroplet test. We would like to thank everyone involved for their guidance and advice.
Conflicts of Interest
The authors declare no conflict of interest.
Appendix A
Figure A1.
(a) Tubular furnace for the heat treatment of CFRP under 800 °C for 5 h supplied with 1 L/min of N2 gas, and the picture of CFRP specimen (b) before heat treatment and (c) after heat treatment.
Figure A1.
(a) Tubular furnace for the heat treatment of CFRP under 800 °C for 5 h supplied with 1 L/min of N2 gas, and the picture of CFRP specimen (b) before heat treatment and (c) after heat treatment.

Figure A2.
(a) Schematic image of microdroplet test, (b) interfacial shear strength versus embedded lengths of the resin droplet for representative plots such as vCF and rCF 24 h.
Figure A2.
(a) Schematic image of microdroplet test, (b) interfacial shear strength versus embedded lengths of the resin droplet for representative plots such as vCF and rCF 24 h.

Figure A3.
Fiber diameter of carbon fiber measured by SEM.
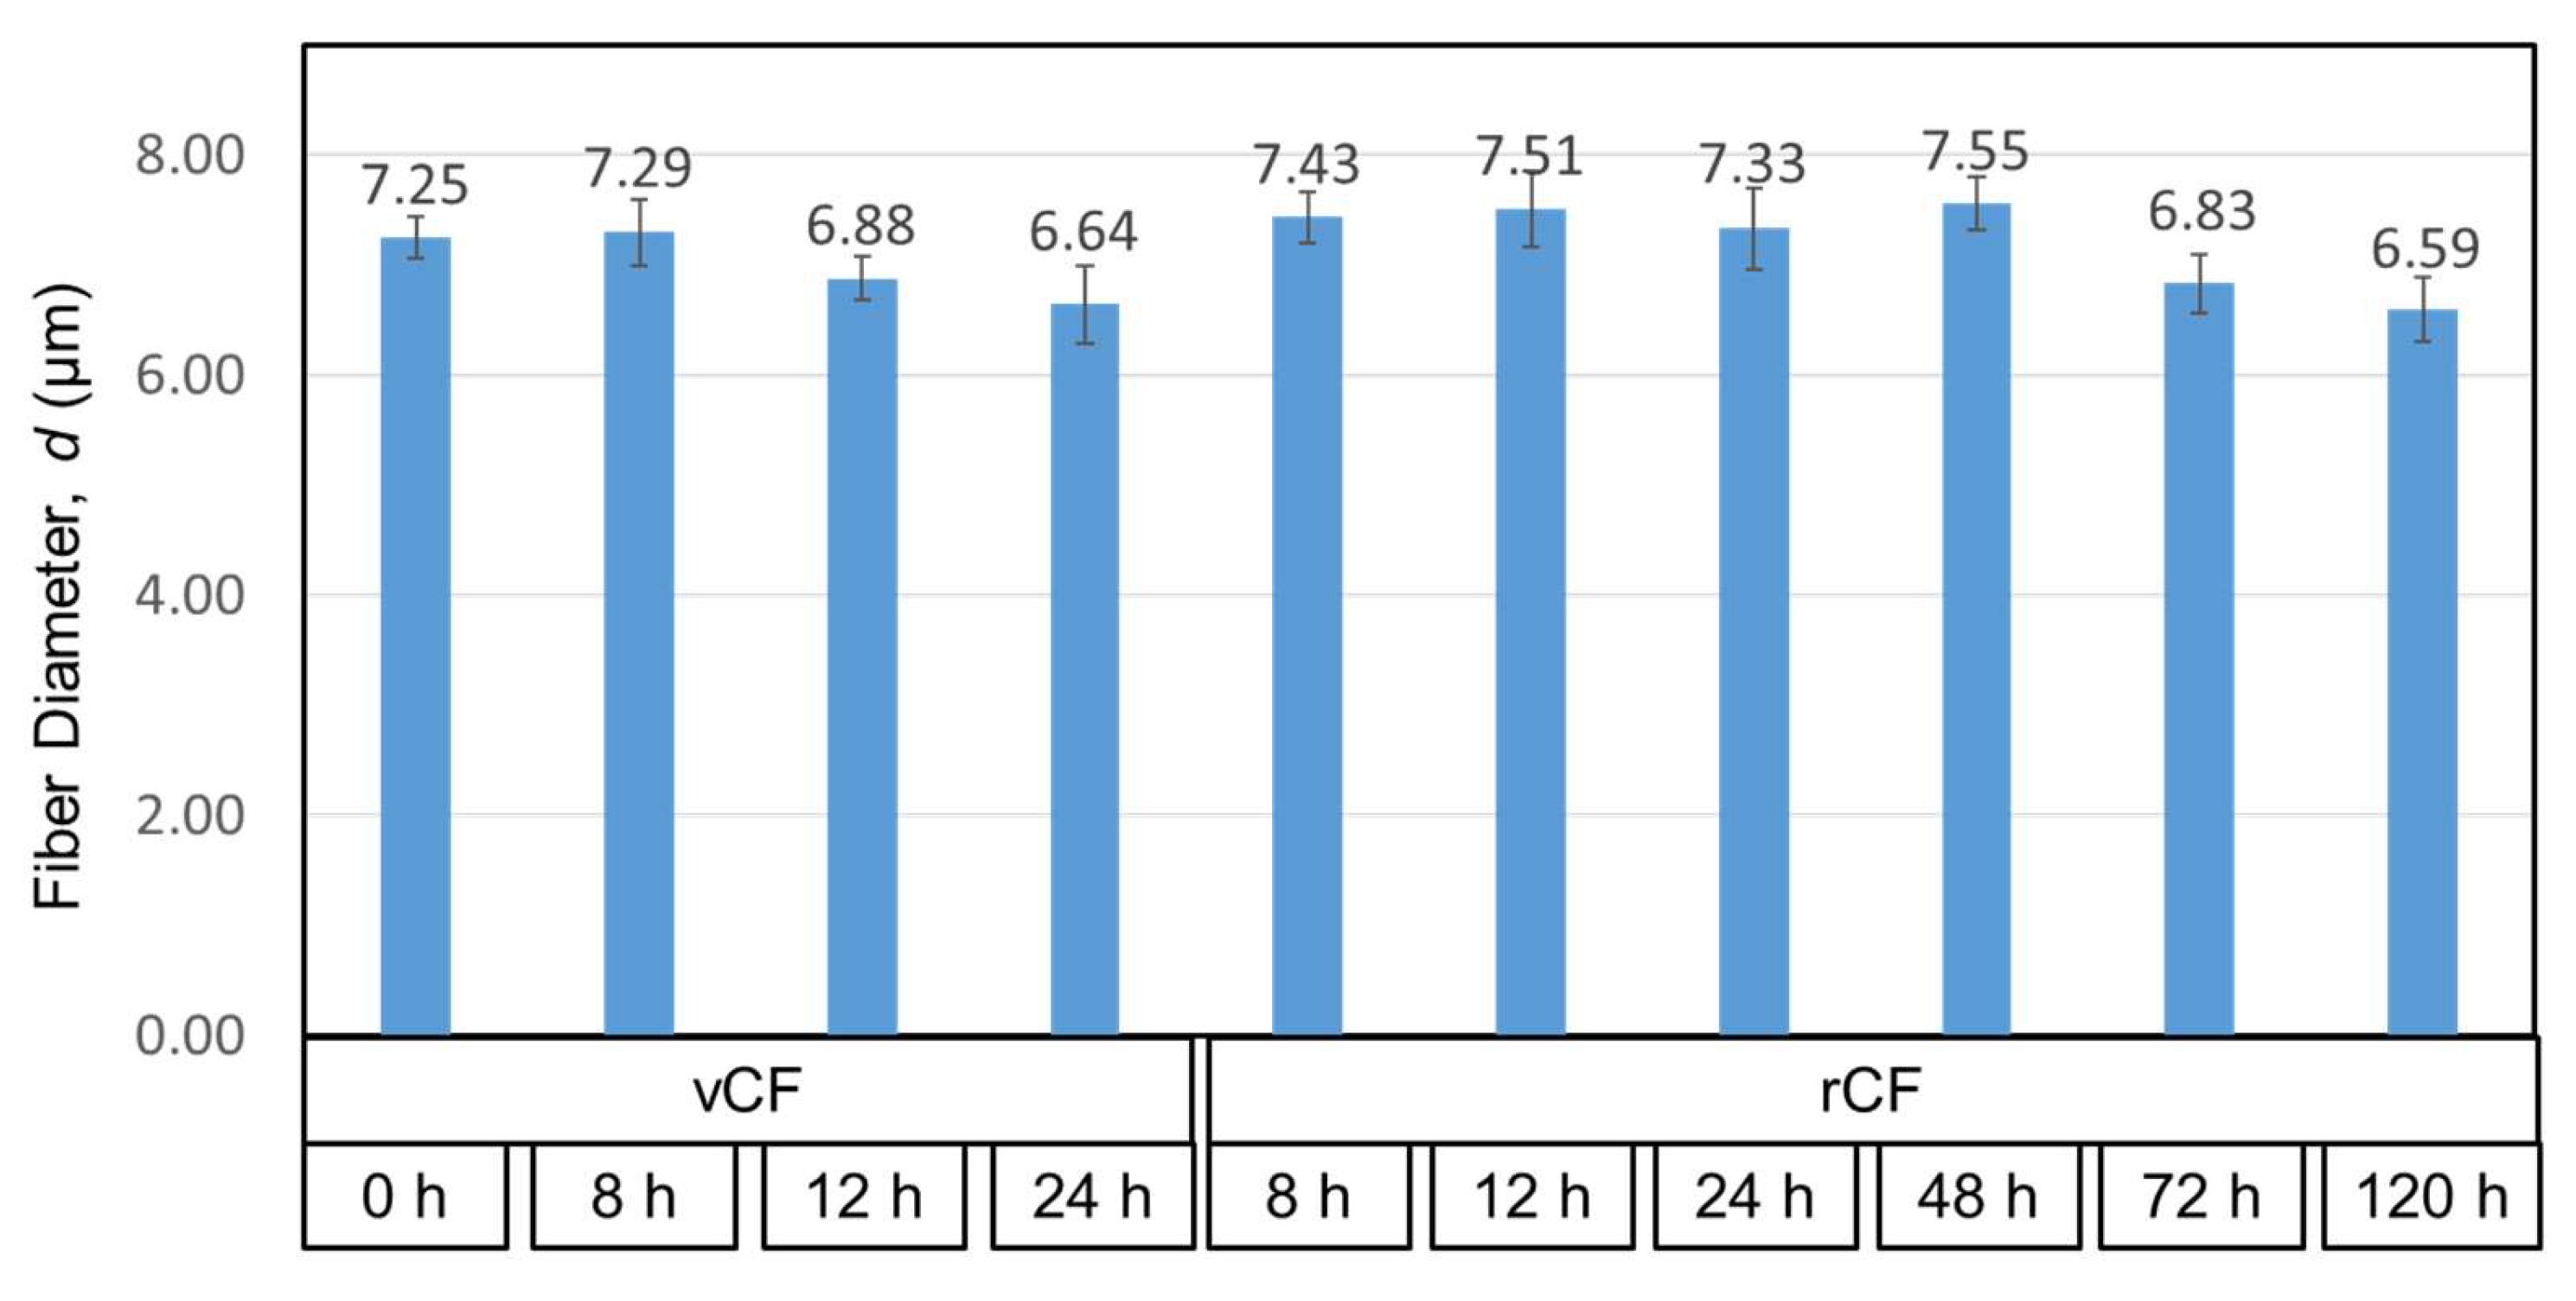
Figure A4.
Weibull distribution plots for vCF and rCF of representative data.
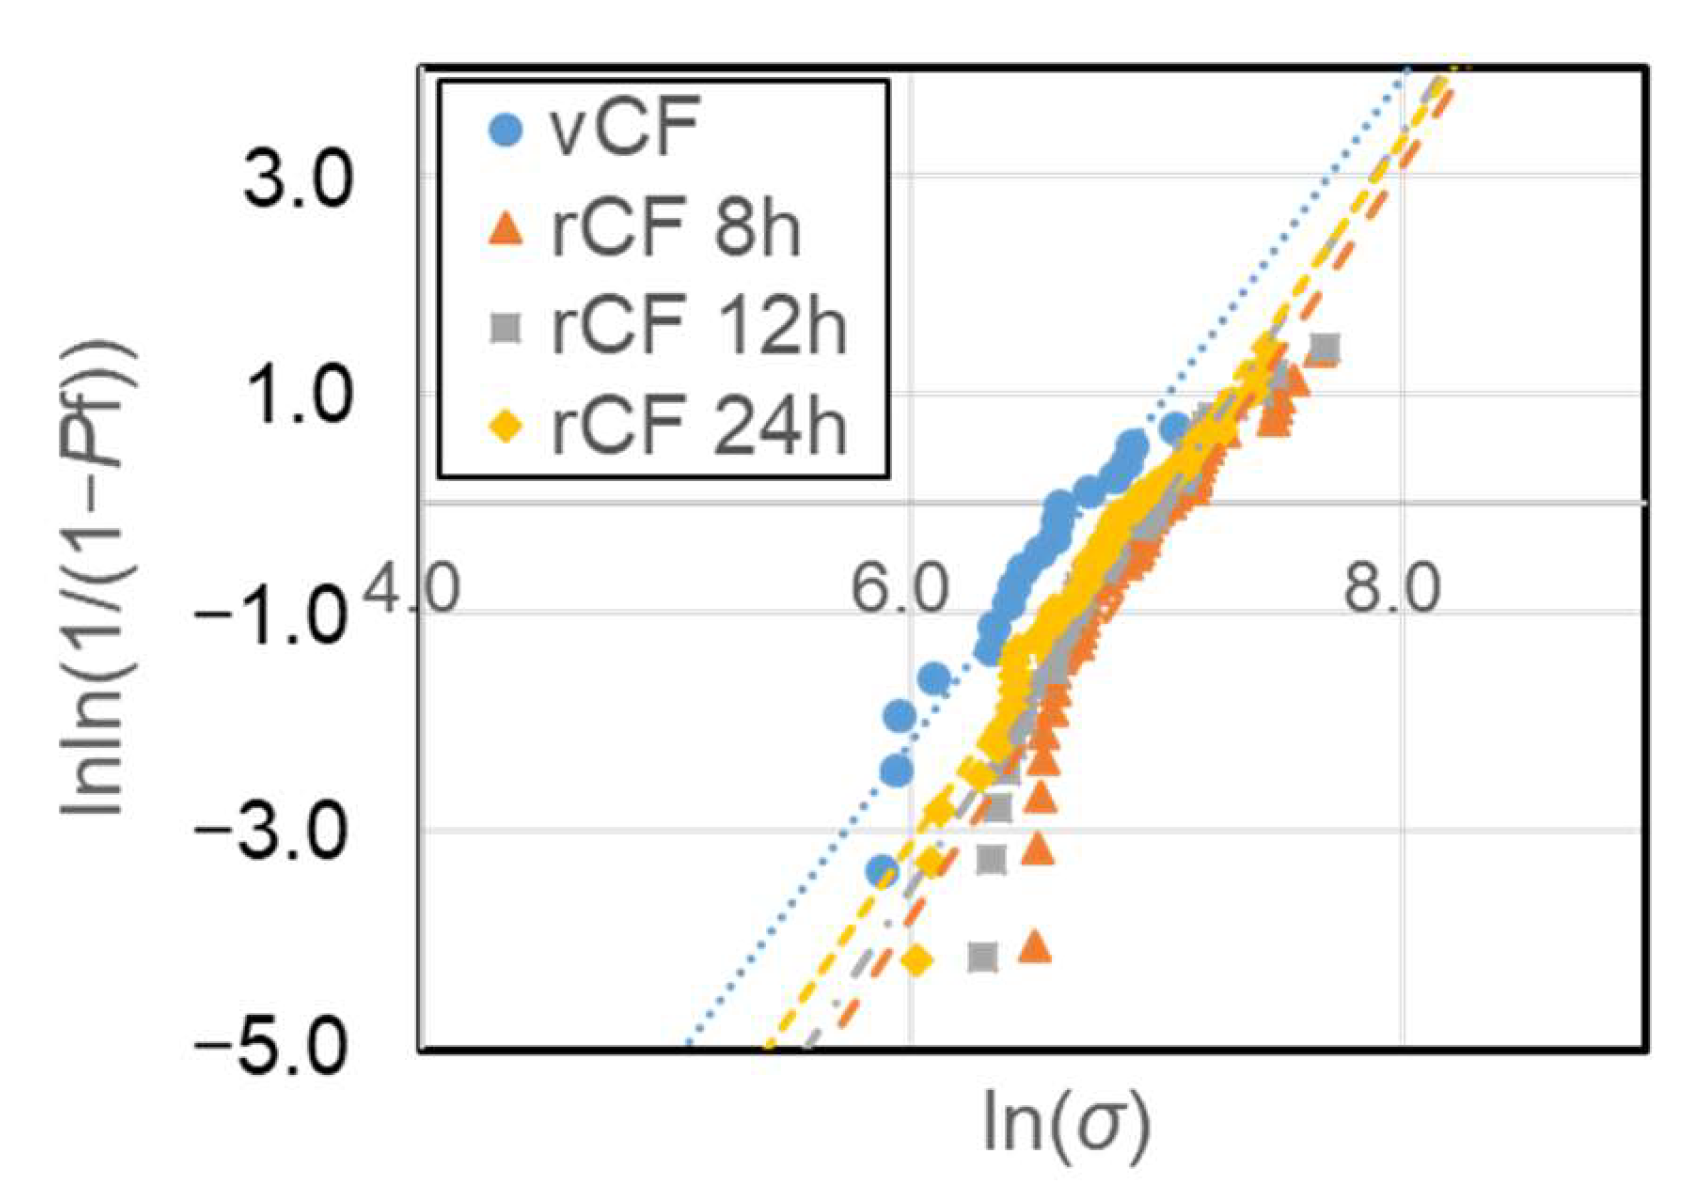
Figure A5.
AFM shape images and phase images of vCF and rCF surface taken from the observation area 2 μm × 2 μm.
Figure A5.
AFM shape images and phase images of vCF and rCF surface taken from the observation area 2 μm × 2 μm.
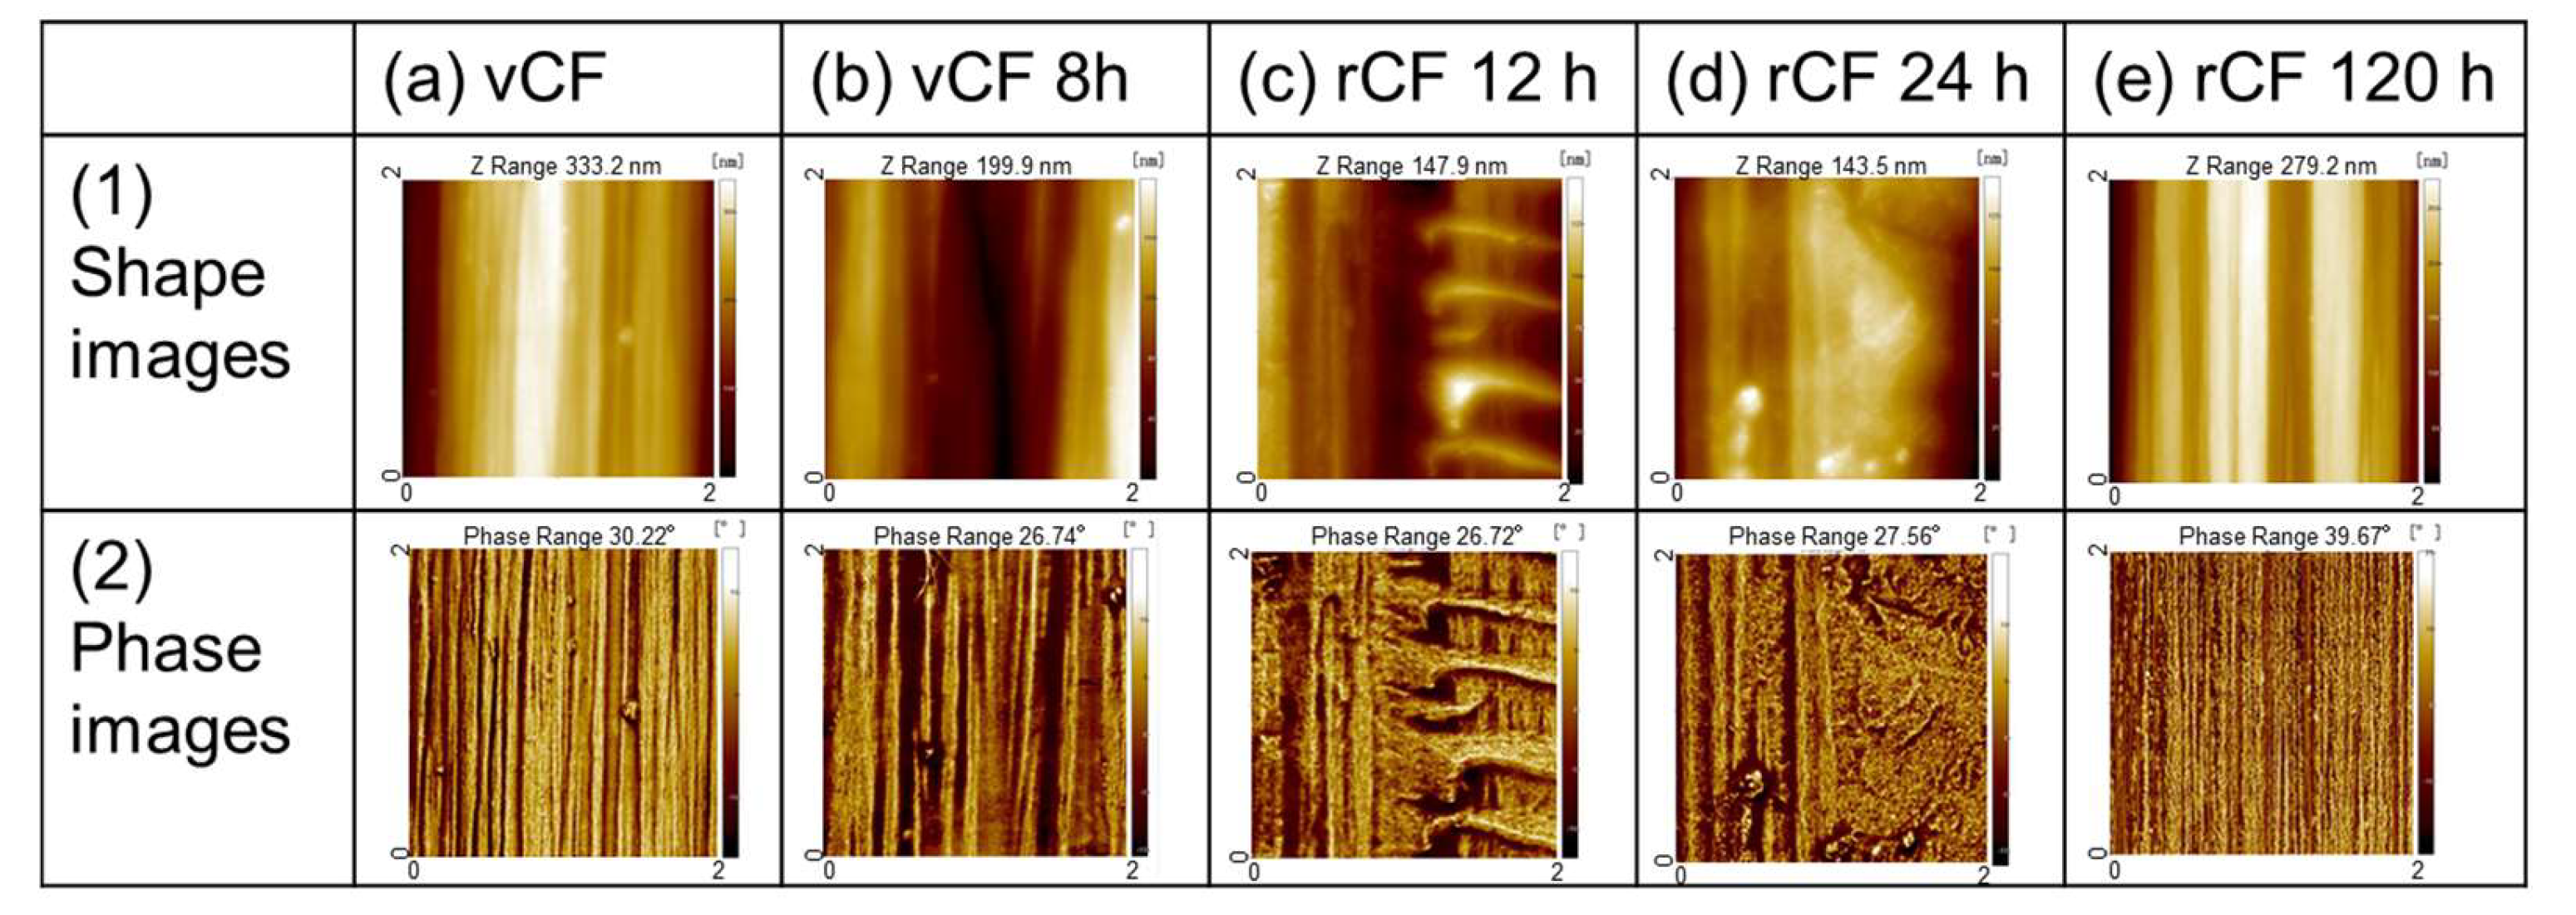
Figure A6.
(a) Raman normalized spectra of the vCF and rCF surfaces using a 532 nm laser measured under 0.2 mW; (b) curve fitting results of Raman normalized spectra for vCF.
Figure A6.
(a) Raman normalized spectra of the vCF and rCF surfaces using a 532 nm laser measured under 0.2 mW; (b) curve fitting results of Raman normalized spectra for vCF.
Appendix B

Table A1.
Shape factor in the Weibull function and scale factors taken for vCF and rCF.
| Shape Factor, m | Scale Factor, σ0 (GPa) | |
|---|---|---|
| vCF | 3.27 | 0.77 |
| vCF 8 h | 3.34 | 0.99 |
| vCF 12 h | 3.18 | 0.81 |
| vCF 24 h | 3.02 | 0.70 |
| rCF 8 h | 3.43 | 0.96 |
| rCF 12 h | 3.45 | 1.05 |
| rCF 24 h | 3.21 | 1.02 |
| rCF 48 h | 3.44 | 1.02 |
| rCF 72 h | 3.04 | 1.03 |
| rCF 120 h | 3.45 | 0.60 |
References
- Yano Research Institute Ltd. Global Automotive CFRP (Carbon-Fiber-Reinforced Plastics) Market Forecast 2021; Yano Research Institute Ltd.: Tokyo, Japan, 2021; pp. 27–38. [Google Scholar]
- Lefeuvre, A.; Garnier, S.; Jacquemin, L.; Pillain, B.; Sonnemann, G. Anticipating In-Use Stocks of Carbon Fiber Reinforced Polymers and Related Waste Flows Generated by the Commercial Aeronautical Sector Until 2050. Resour. Conserv. Recycl. 2017, 125, 264–272. [Google Scholar] [CrossRef]
- FY 2015 Annual Report: New Energy and Industrial Technology Development Organization; Study of Recycling Technologies for Carbon Fiber Composite Materials Used in Automobiles: Innovative New Structural Materials R&D Project; Industrial Technology Development Organization: Tokyo, Japan, 2016; pp. 10–21.
- Ma, C.; Sánchez-Rodríguez, D.; Kamo, T. Influence of Thermal Treatment on the Properties of Carbon Fiber Reinforced Plastics Under Various Conditions. Polym. Degrad. Stab. 2020, 178, 109199. [Google Scholar] [CrossRef]
- Jiang, G.; Pickering, S.J. Structure-Property Relationship of Recycled Carbon Fibres Revealed by Pyrolysis Recycling Process. J. Mater. Sci. 2016, 51, 949–1958. [Google Scholar] [CrossRef]
- Ibarra, R.M.; Sasaki, M.; Goto, M.; Quitain, A.T.; Montes, S.M.G.; Aguilar-Garib, J.A. Carbon Fiber Recovery Using Water and Benzyl Alcohol in Subcritical and Supercritical Conditions for Chemical Recycling of Thermoset Composite Materials. J. Mater. Cycles Waste Manag. 2015, 17, 369–379. [Google Scholar] [CrossRef]
- Kim, Y.; Kim, Y.; Kim, S.; Park, M.; Yang, B.; Kim, J.; Jung, Y.C. Application of Supercritical Water for Green Recycling of Epoxy-Based Carbon Fiber Reinforced Plastic. Compos. Sci. Technol. 2019, 173, 66–72. [Google Scholar] [CrossRef]
- Okajima, I.; Watanabe, K.; Haramiishi, S.; Nakamura, M.; Shimamura, Y.; Sako, T. Recycling of Carbon Fiber Reinforced Plastic Containing Amine-Cured Epoxy Resin Using Supercritical and Subcritical Fluids. J. Supercrit. Fluids 2017, 119, 44–51. [Google Scholar] [CrossRef]
- Liu, Y.; Meng, L.; Huang, Y.; Du, J. Recycling of Carbon/Epoxy Composites. J. Appl. Polym. Sci. 2004, 94, 1912–1916. [Google Scholar] [CrossRef]
- Ma, J.H.; Wang, X.B.; Li, B.; Huang, L.N. Investigation on Recycling Technology of Carbon Fiber Reinforced Epoxy Resin Cured with Amine. Adv. Mater. Res. 2009, 79–82, 409–412. [Google Scholar] [CrossRef]
- Lee, S.-H.; Choi, H.-O.; Kim, J.-S.; Lee, C.-K.; Kim, Y.-K.; Ju, C.-S. Circulation Flow Reactor for Recycling of Carbon Fiber from Carbon Fiber Reinforced Epoxy Composites. Korean J. Chem. Eng. 2011, 28, 449–454. [Google Scholar] [CrossRef]
- Dang, W.; Kubouchi, M.; Yamamoto, S.; Sembokuya, H.; Tsuda, K. An Approach to Chemical Recycling of Epoxy Resin Cured with Amine Using Nitric Acid. Polymer 2002, 43, 2953–2958. [Google Scholar] [CrossRef]
- Hanaoka, T.; Arao, Y.; Kayaki, Y.; Kuwata, S.; Kubouchi, M. Analysis of Nitric Acid Decomposition of Epoxy Resin Network Structures for Chemical Recycling. Polym. Degrad. Stab. 2021, 186, 109537. [Google Scholar] [CrossRef]
- Hanaoka, T.; Ikematsu, H.; Takahashi, S.; Ito, N.; Ijuin, N.; Kawada, H.; Arao, Y.; Kubouchi, M. Recovery of Carbon Fiber from Prepreg Using Nitric Acid and Evaluation of Recycled CFRP. Compos. Part B 2022, 231, 109560. [Google Scholar] [CrossRef]
- Sakai, A.; Kurniawan, W.; Kubouchi, M.; Inui, M.; Mizutani, A.; Kuroda, T. Study on Kinetics of Epoxy Resin Decomposition and Evaluation of Recovered Carbon Fibers from CFRP by Nitric Acid Treatment Aiming for the Recycling of both Resin and Carbon Fibers. J. Netw. Polym. 2022, 43, 198–208. [Google Scholar]
- Kang, S.K.; Lee, D.B.; Choi, N.S. Fiber/Epoxy Interfacial Shear Strength Measured by the Microdroplet Test. Compos. Sci. Technol. 2009, 69, 245–251. [Google Scholar] [CrossRef]
- Guo, H.; Huang, Y.; Liu, L.; Shi, X. Effect of Epoxy Coatings on Carbon Fibers During Manufacture of Carbon Fiber Reinforced Resin Matrix Composites. Mater. Des. 2010, 31, 1186–1190. [Google Scholar] [CrossRef]
- Ko, T.H. Raman Spectrum of Modified PAN-Based Carbon Fibers During Graphitization. J. Appl. Polym. Sci. 1996, 59, 577–580. [Google Scholar] [CrossRef]
- Vautard, F.; Dentzer, J.; Nardin, M.; Schultz, J.; Defoort, B. Influence of Surface Defects on the Tensile Strength of Carbon Fibers. Appl. Surf. Sci. 2014, 322, 185–193. [Google Scholar] [CrossRef]
- Wu, S.; Liu, Y.; Ge, Y.; Ran, L.; Peng, K.; Yi, M. Surface Structures of PAN-Based Carbon Fibers and Their Influences on the Interface Formation and Mechanical Properties of Carbon-Carbon Composites. Compos. Part A 2016, 90, 480–488. [Google Scholar] [CrossRef]
- Sharma, M.; Gao, S.; Mader, E.; Sharma, H.; Wei, L.Y.; Bijwe, J. Carbon Fiber Surfaces and Composite Interphase. Compos. Sci. Technol. 2014, 102, 35–50. [Google Scholar] [CrossRef]
- Pittman, C.U.; He, G.R.; Wu, B.; Gardner, S.D. Chemical Modification of Carbon Fiber Surfaces by Nitric Acid Oxidation Followed by Reaction with Tetraethylenpentamine. Carbon 1997, 35, 317–331. [Google Scholar] [CrossRef]
- Rahaman, M.S.A.; Ismail, A.F.; Mustafa, A. A Review of Heat Treatment on Polyacrylonitrile Fiber. Polym. Degrad. Stab. 2007, 92, 1421–1432. [Google Scholar] [CrossRef] [Green Version]
- Yamauchi, S.; Kurimoto, Y. Raman Spectroscopic Study on Pyrolyzed Wood and Bark of Japanese Cedar: Temperature Dependence of Raman Parameters. J. Wood Sci. 2003, 49, 235–240. [Google Scholar] [CrossRef]
- Li, J.; Sun, F.F. The Effect of Surface Modification with Nitric Acid on the Mechanical and Tribological Properties of Carbon Fiber-Reinforced Thermoplastic Polyimide Composite. Surf. Interface Anal. 2009, 41, 255–258. [Google Scholar] [CrossRef]
- Zielke, U.; Huttinger, K.J.; Hoffman, W.P. Surface-Oxidized Carbon Fibers: I. Surface Structure and Chemistry. Carbon 1996, 34, 983–998. [Google Scholar] [CrossRef]
- Zhang, X.; Huang, Y.; Wang, T. Surface Analysis of Plasma Grafted Carbon Fiber. Appl. Surf. Sci. 2006, 253, 2885–2892. [Google Scholar] [CrossRef]
- Park, S.J.; Kim, B.J. Roles of Acidic Functional Groups of Carbon Fiber Surfaces in Enhancing Interfacial Adhesion Behavior. Mater. Sci. Eng. A 2005, 408, 269–273. [Google Scholar] [CrossRef]
- Noguchi, K.; Hiramatsu, T.; Higuchi, T.; Murayama, K. Fracture surface of carbon fibers. In Proceedings of the International Carbon Conference, Bordeaux, France, 2–6 July 1984; pp. 178–179. [Google Scholar]
Figure 1.
(a) CFRP automotive prototype waste manufactured from virgin carbon fibers and fully cured epoxy resin; (b) CFRP specimen used in this research, (c) decomposition and recovery process of carbon fiber and resin from CFRP immersed in HNO3.
Figure 1.
(a) CFRP automotive prototype waste manufactured from virgin carbon fibers and fully cured epoxy resin; (b) CFRP specimen used in this research, (c) decomposition and recovery process of carbon fiber and resin from CFRP immersed in HNO3.
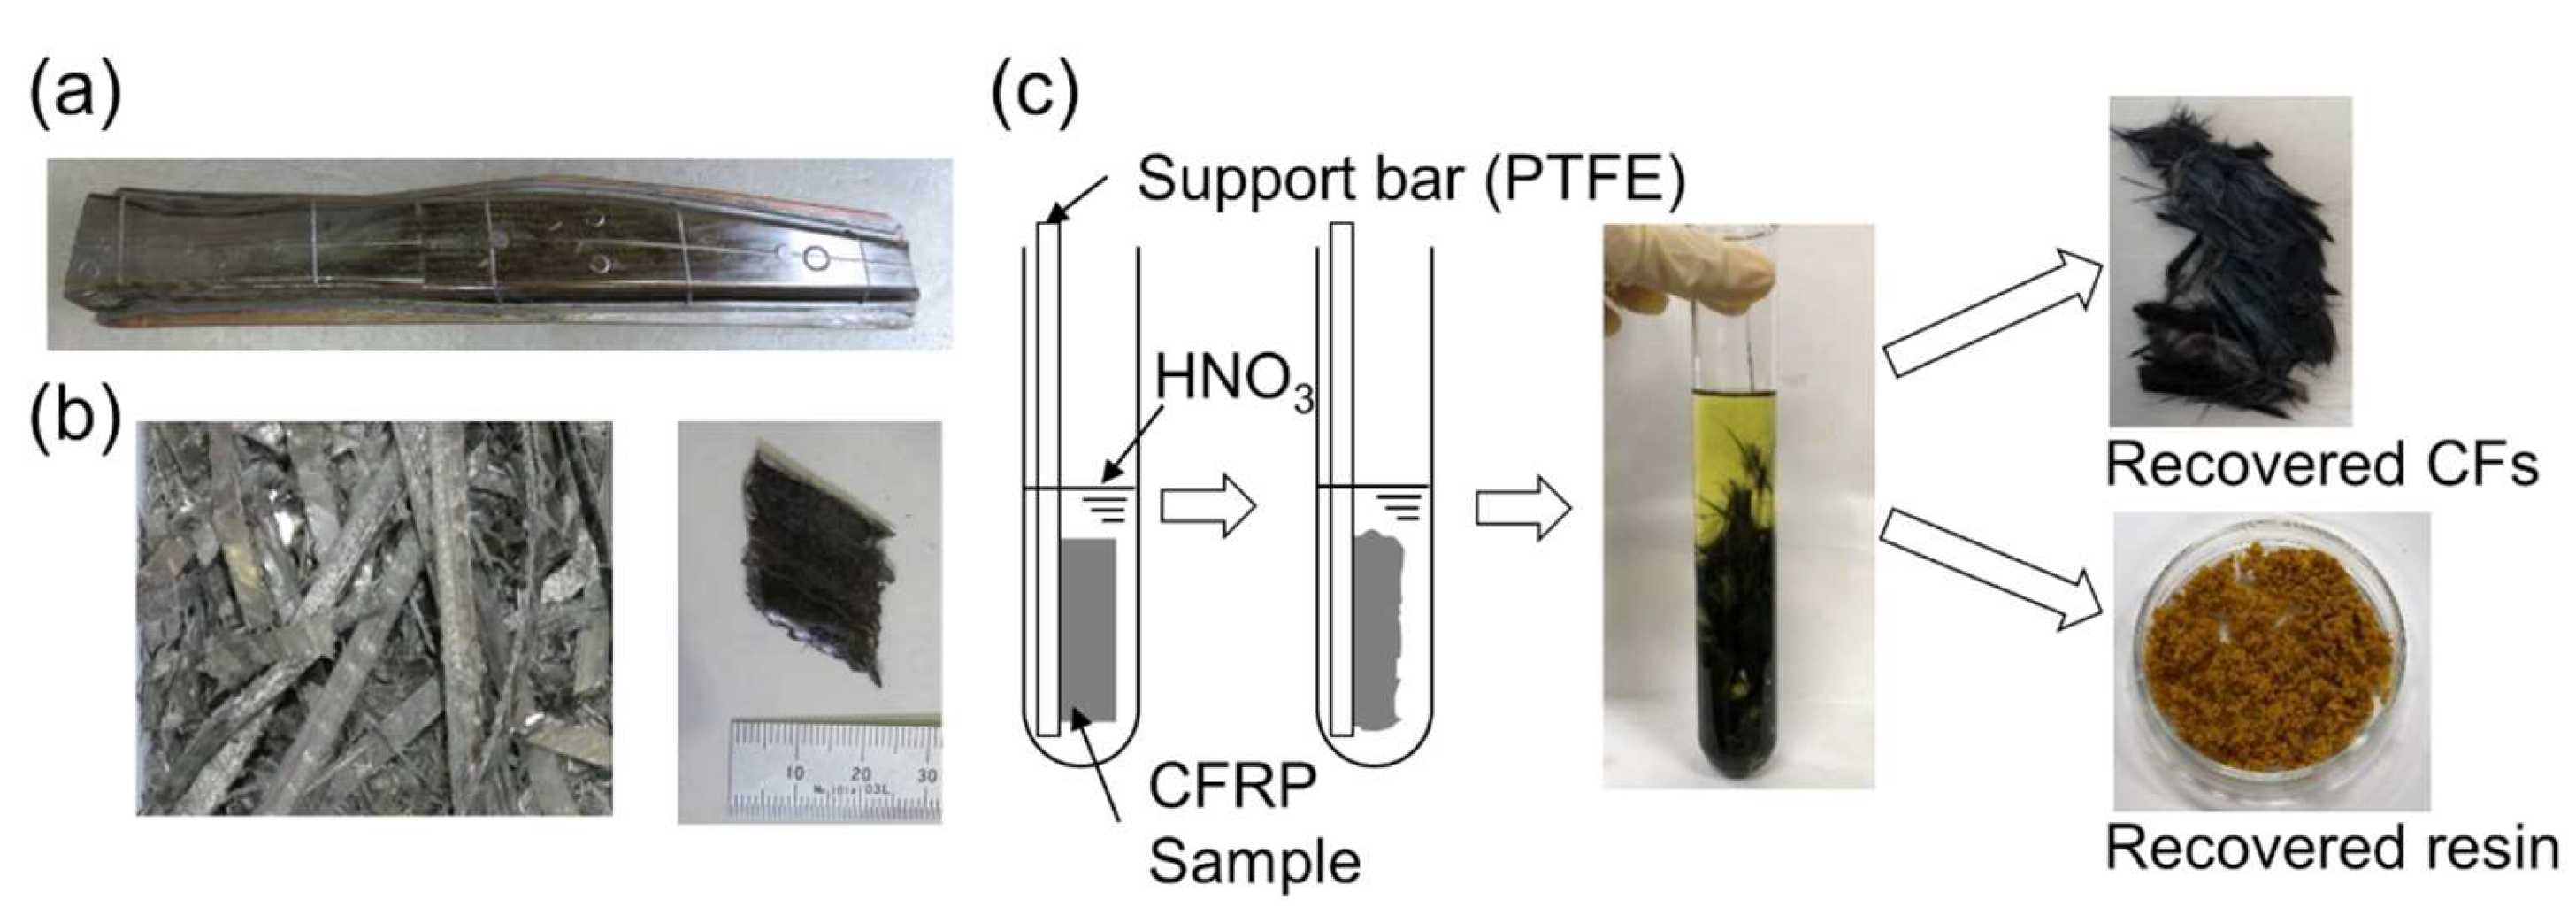
Figure 2.
Decomposition ratio of resin in CFRP specimen immersed in 8 M of HNO3 at 80 °C.
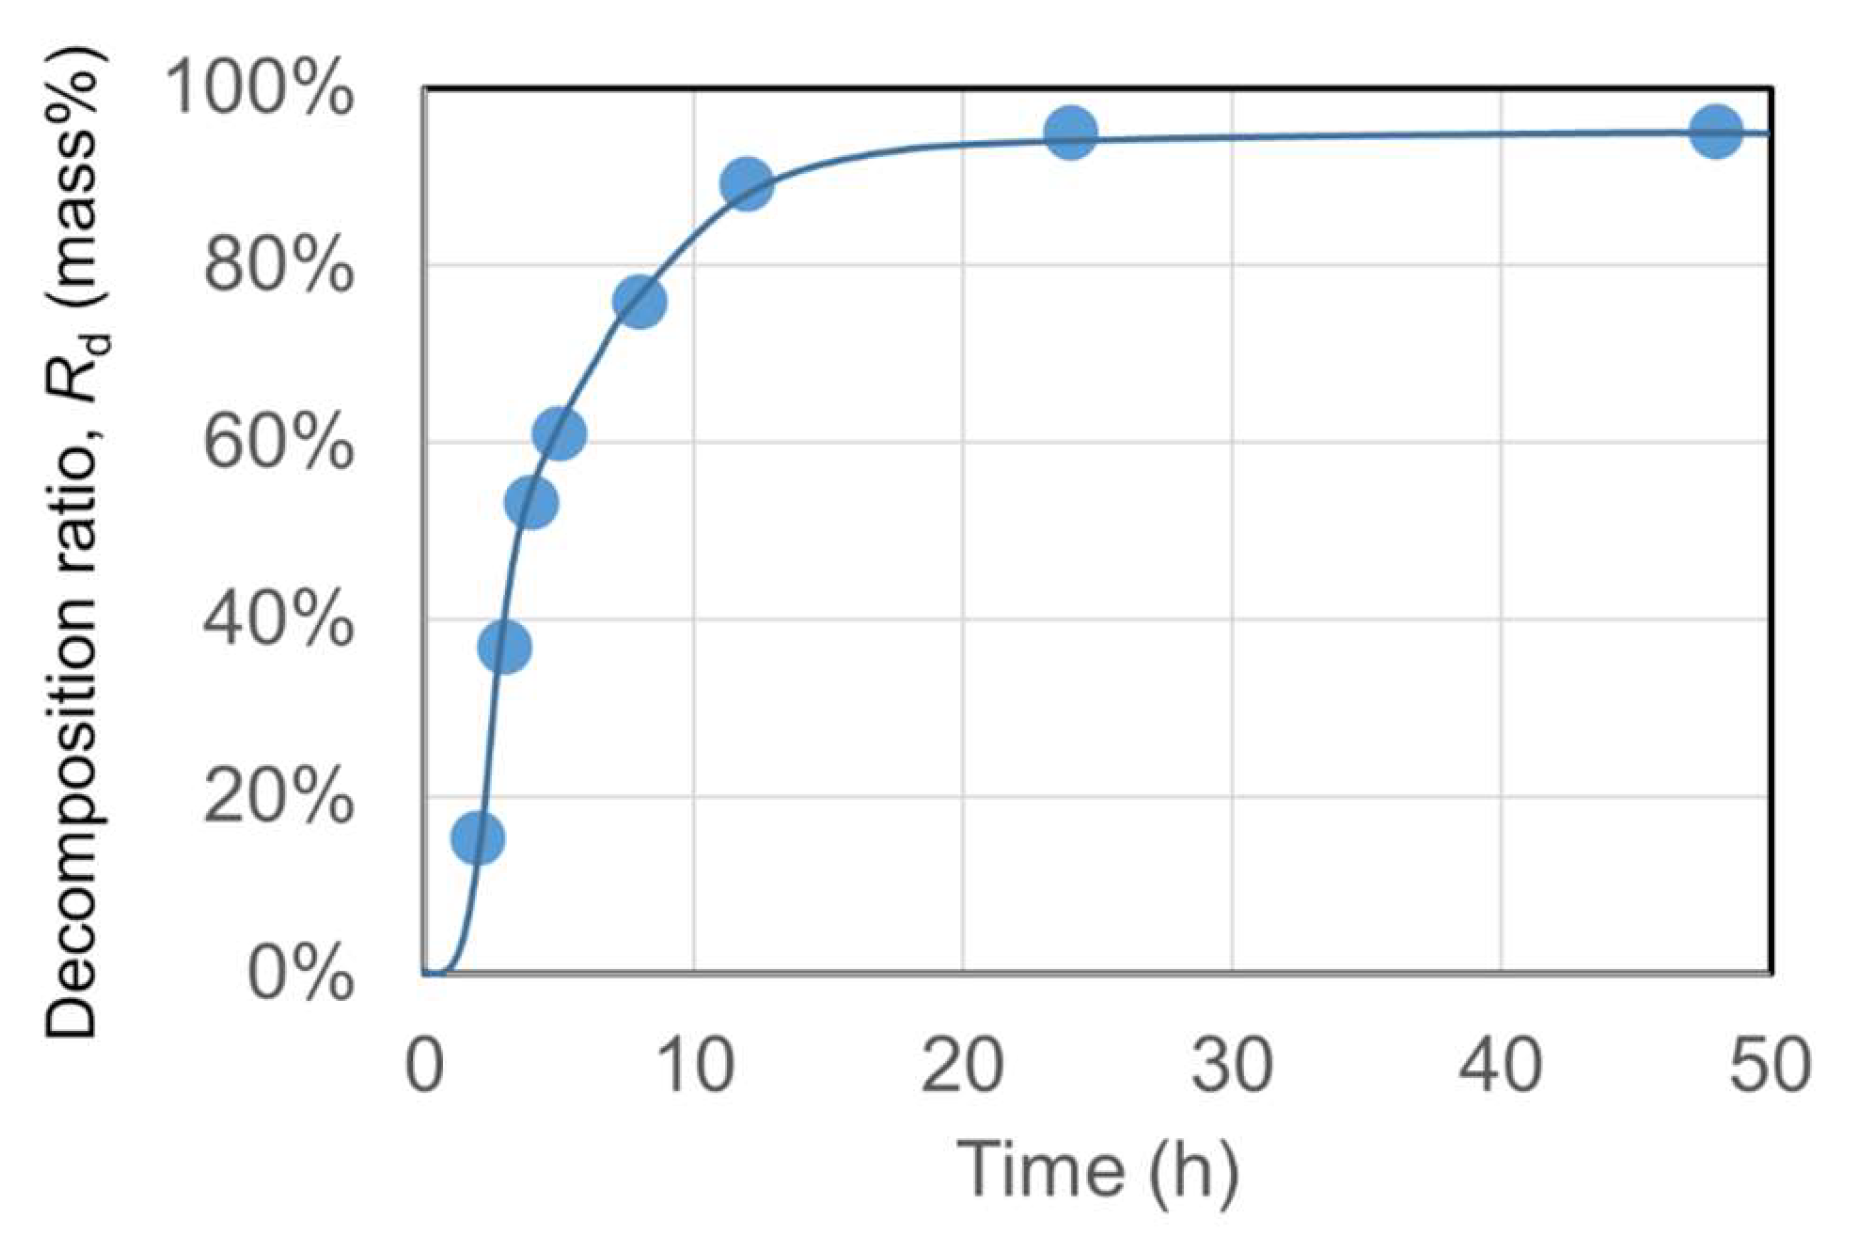
Figure 3.
SEM images of the carbon fiber surface of (a) vCF, (b) vCF 8 h, and rCF (c) 12 h, (d) 24 h, and (e) 120 h.
Figure 3.
SEM images of the carbon fiber surface of (a) vCF, (b) vCF 8 h, and rCF (c) 12 h, (d) 24 h, and (e) 120 h.

Figure 4.
Interfacial shear strength between carbon fiber and resin at resin droplet size L = 70 μm for vCF, vCF 8 h–24 h, and rCF 8 h–120 h.
Figure 4.
Interfacial shear strength between carbon fiber and resin at resin droplet size L = 70 μm for vCF, vCF 8 h–24 h, and rCF 8 h–120 h.
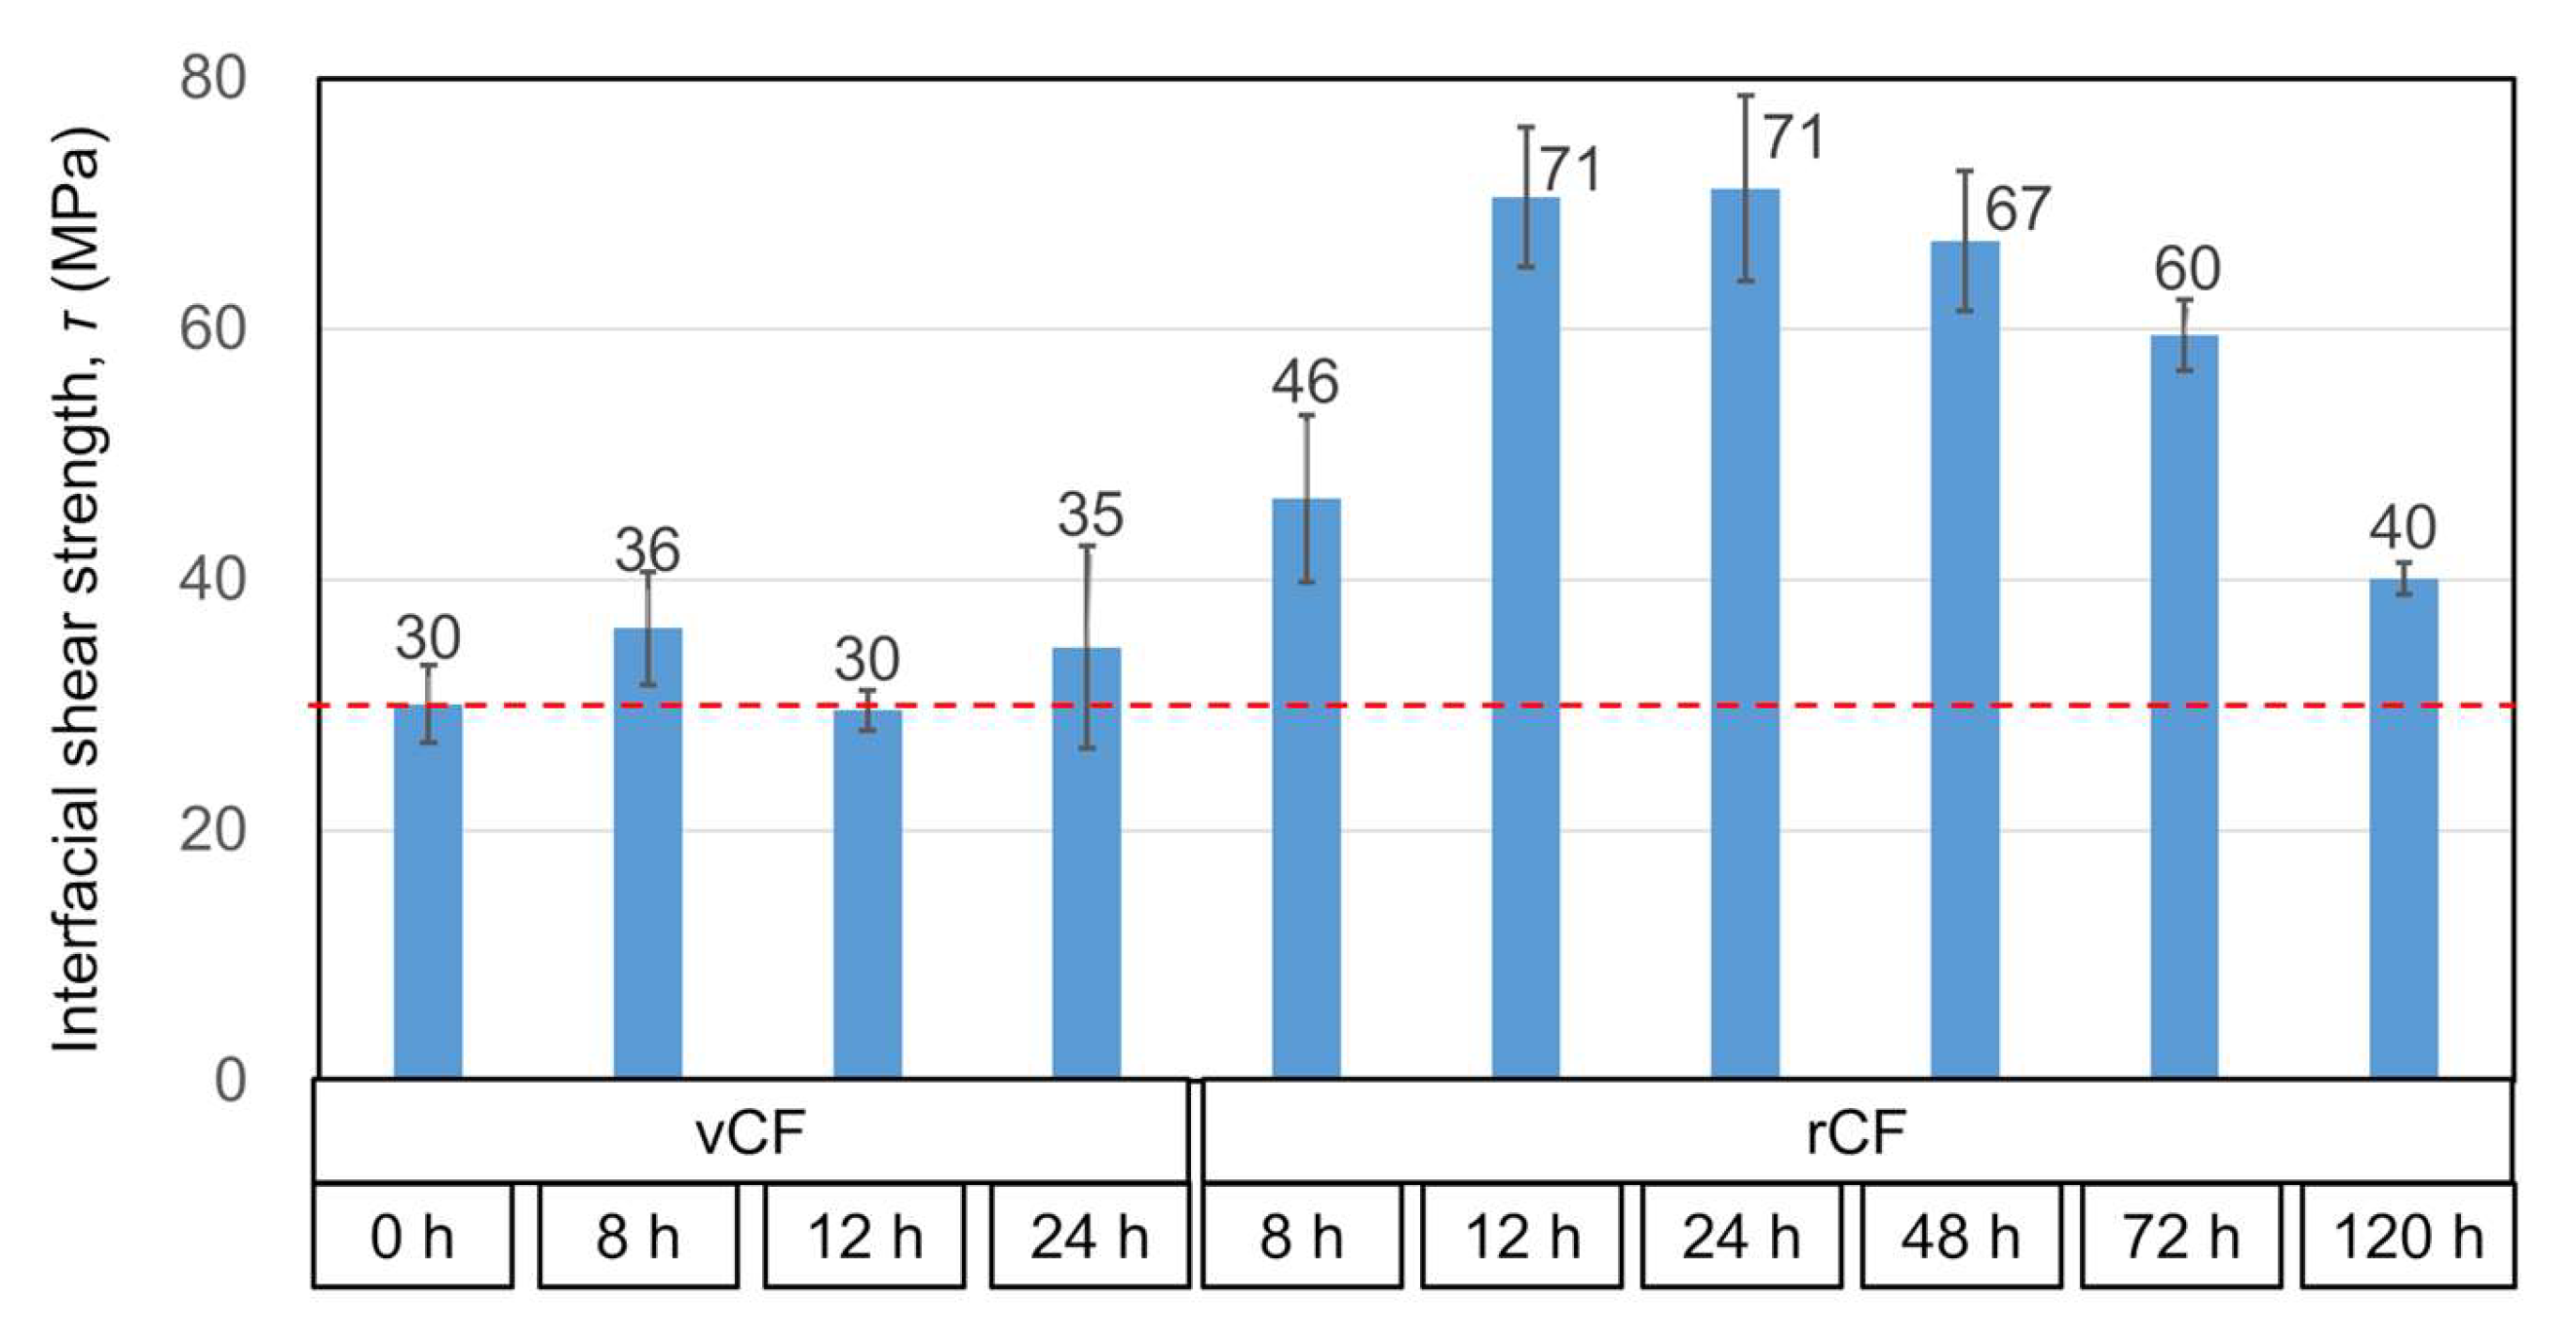
Figure 5.
Tensile strength and elastic modulus obtained by tensile test for vCF, vCF 8 h–24 h, and rCF 8 h–120 h.
Figure 5.
Tensile strength and elastic modulus obtained by tensile test for vCF, vCF 8 h–24 h, and rCF 8 h–120 h.
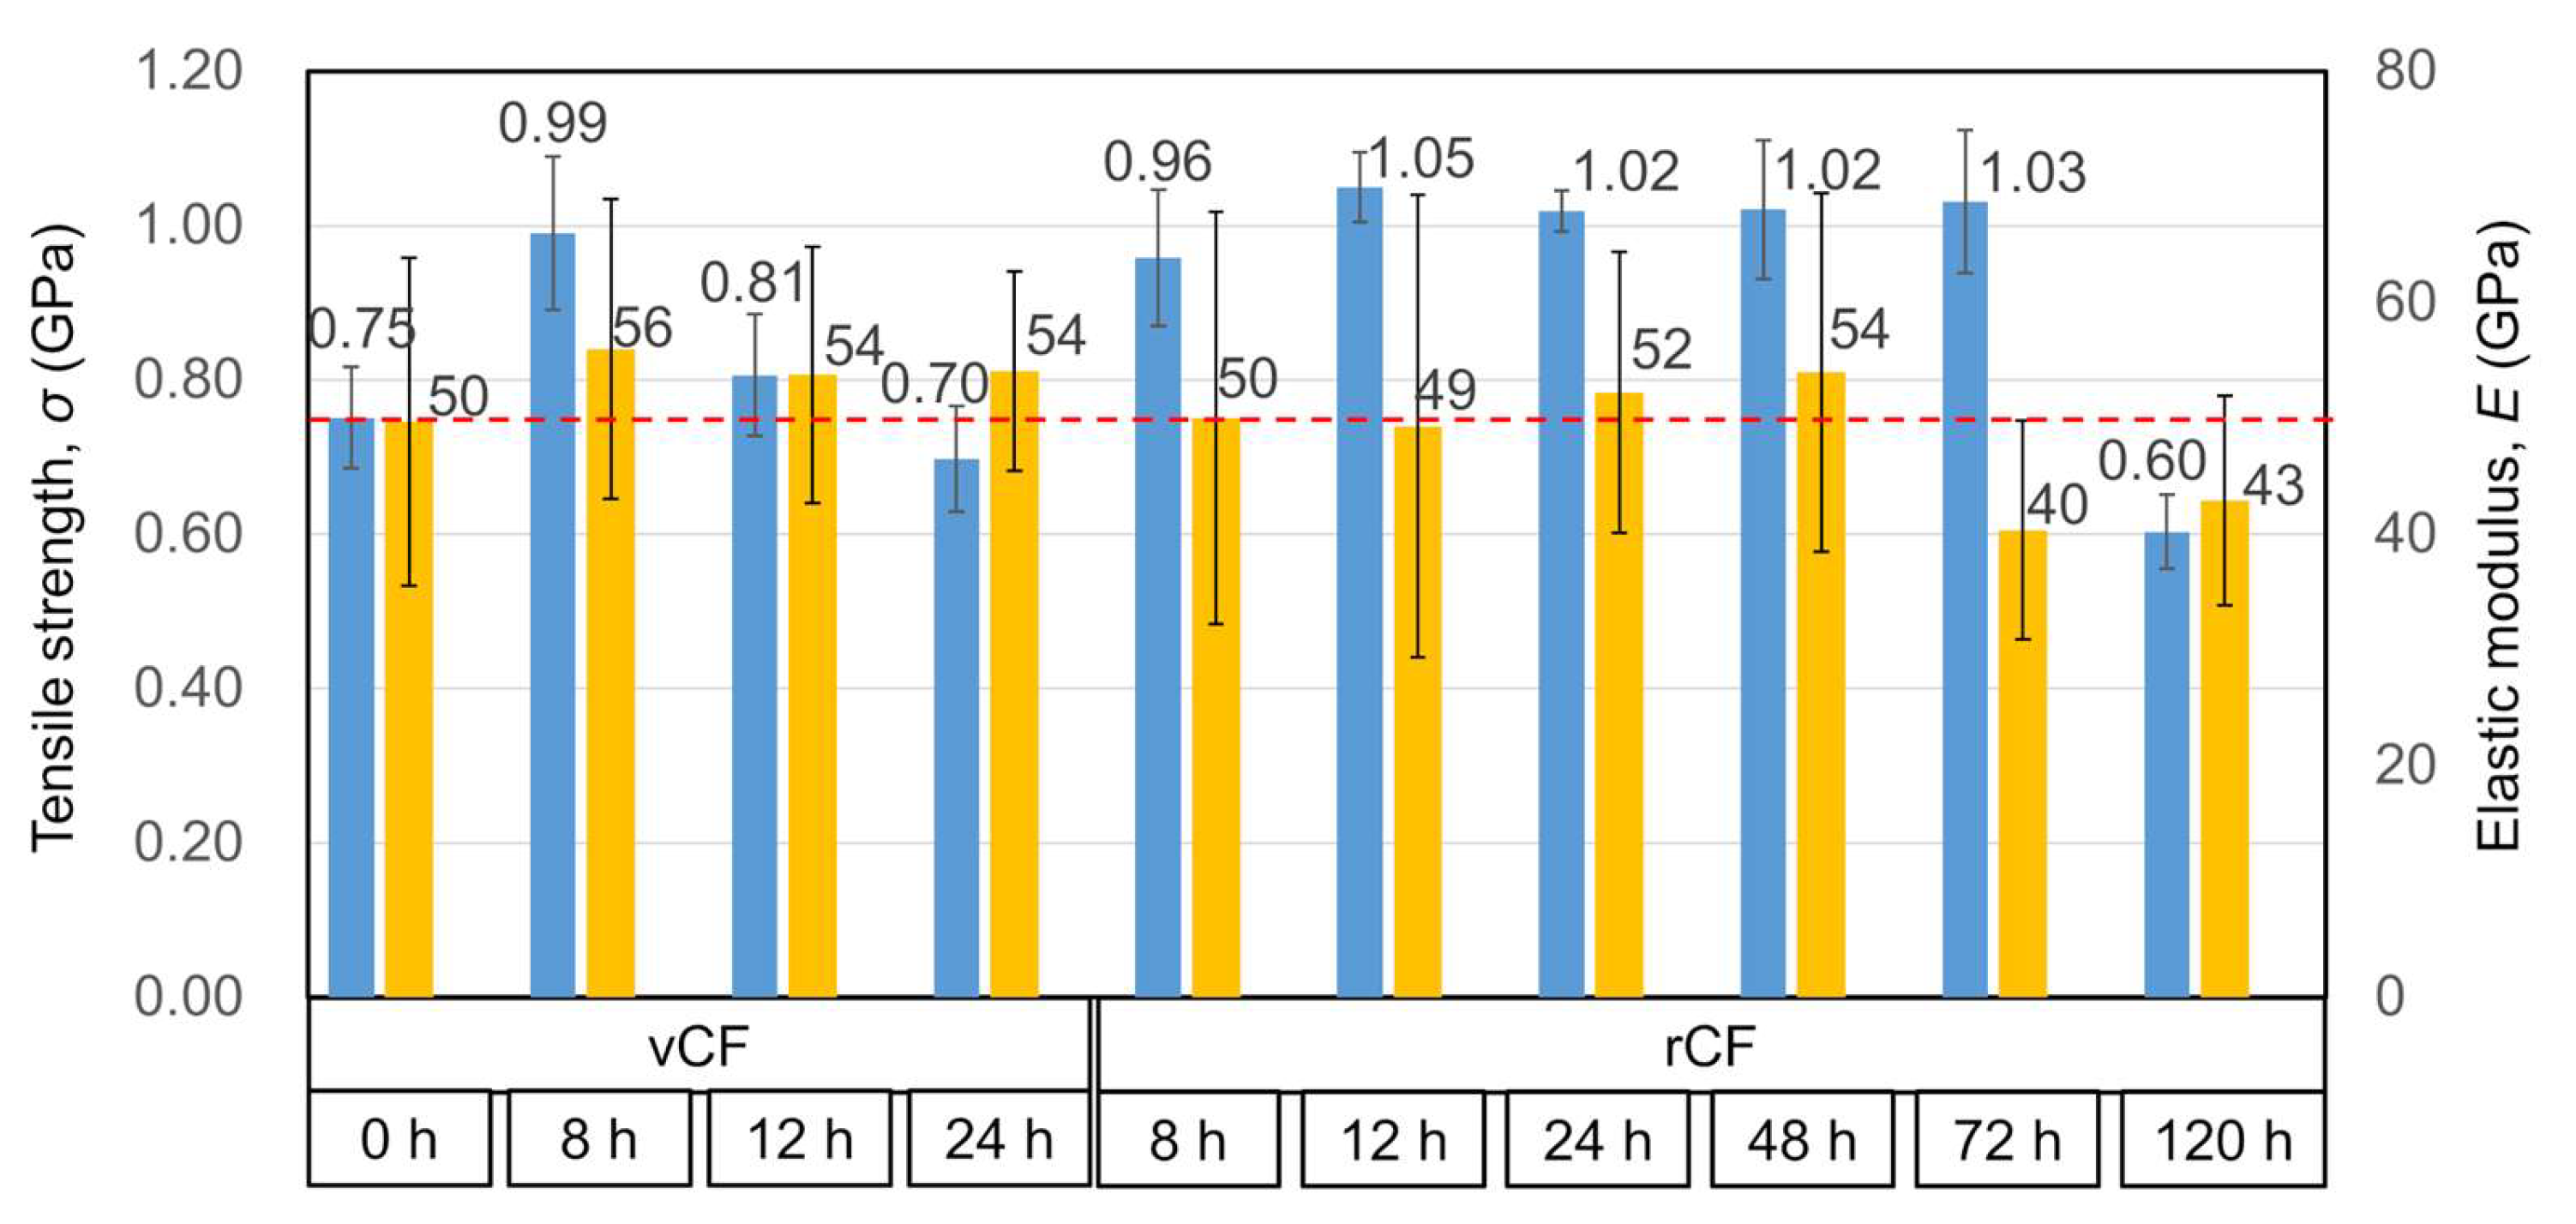
Figure 6.
Surface roughness calculated in root mean square of vCF and rCF surface from the observation area 2 μm × 2 μm.
Figure 6.
Surface roughness calculated in root mean square of vCF and rCF surface from the observation area 2 μm × 2 μm.
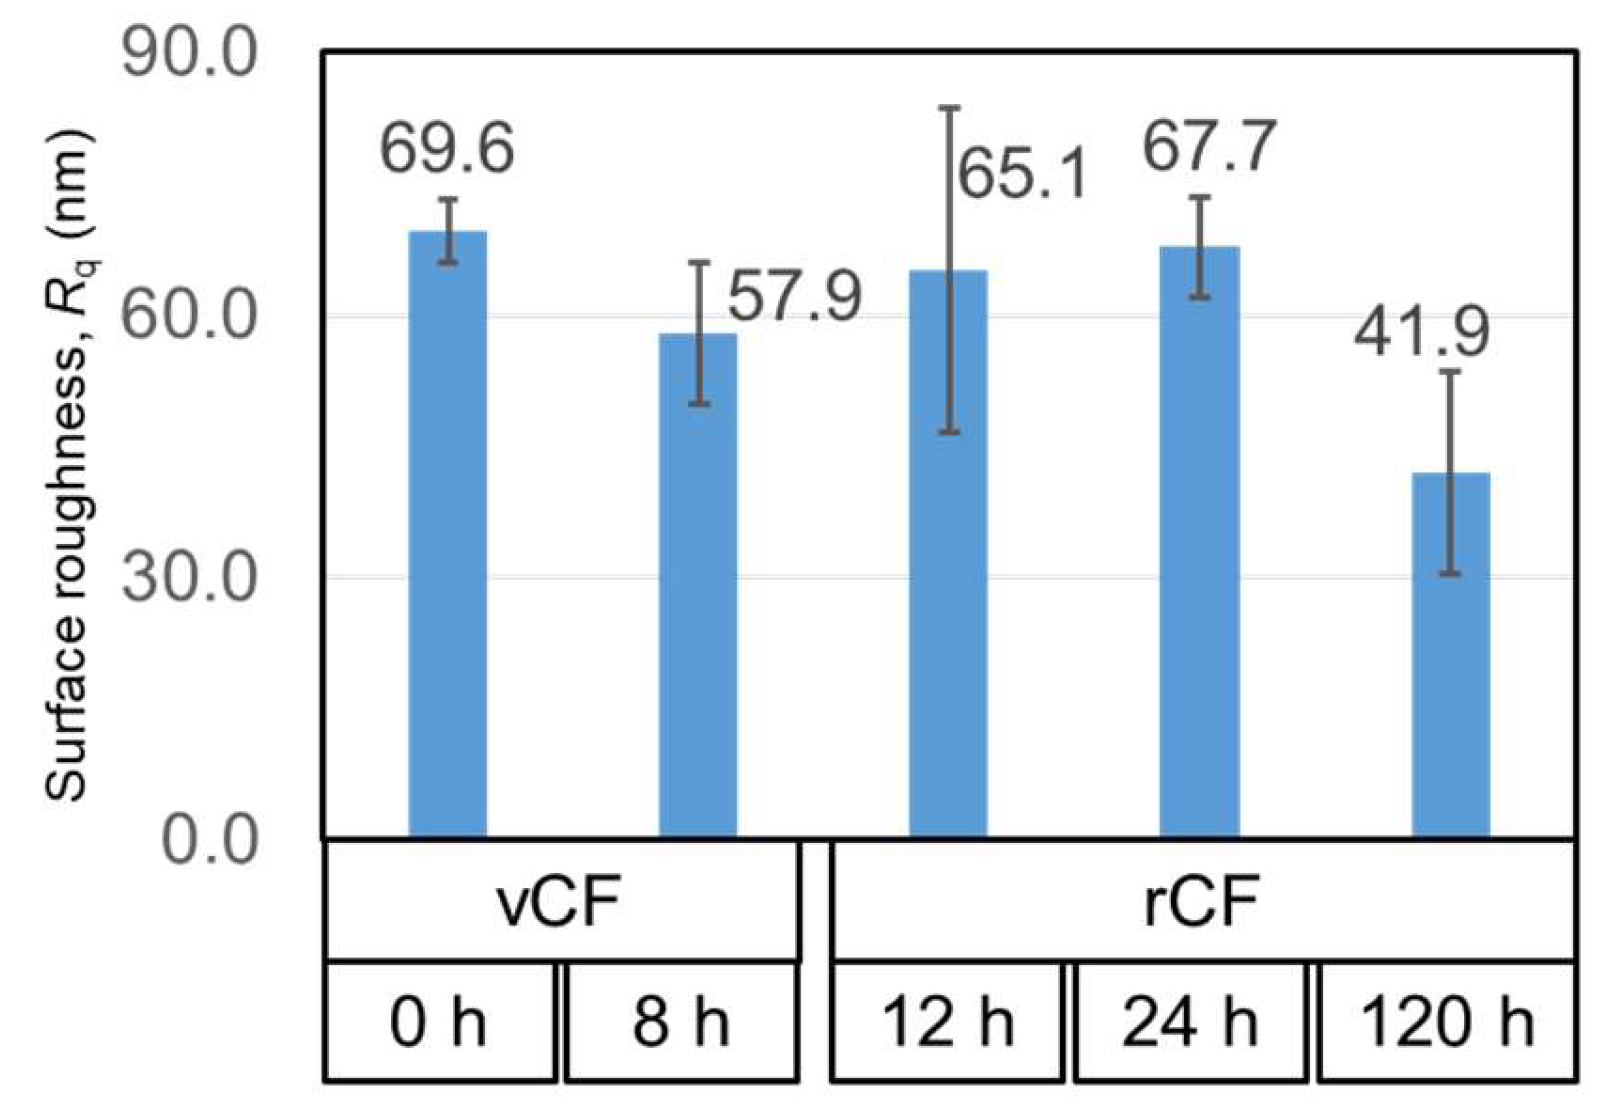
Figure 7.
Results of TEM image of the cross-section for (a) vCF, (b) vCF 8 h, and rCF (c) 12 h, (d) 24 h, and (e) 120 h.
Figure 7.
Results of TEM image of the cross-section for (a) vCF, (b) vCF 8 h, and rCF (c) 12 h, (d) 24 h, and (e) 120 h.
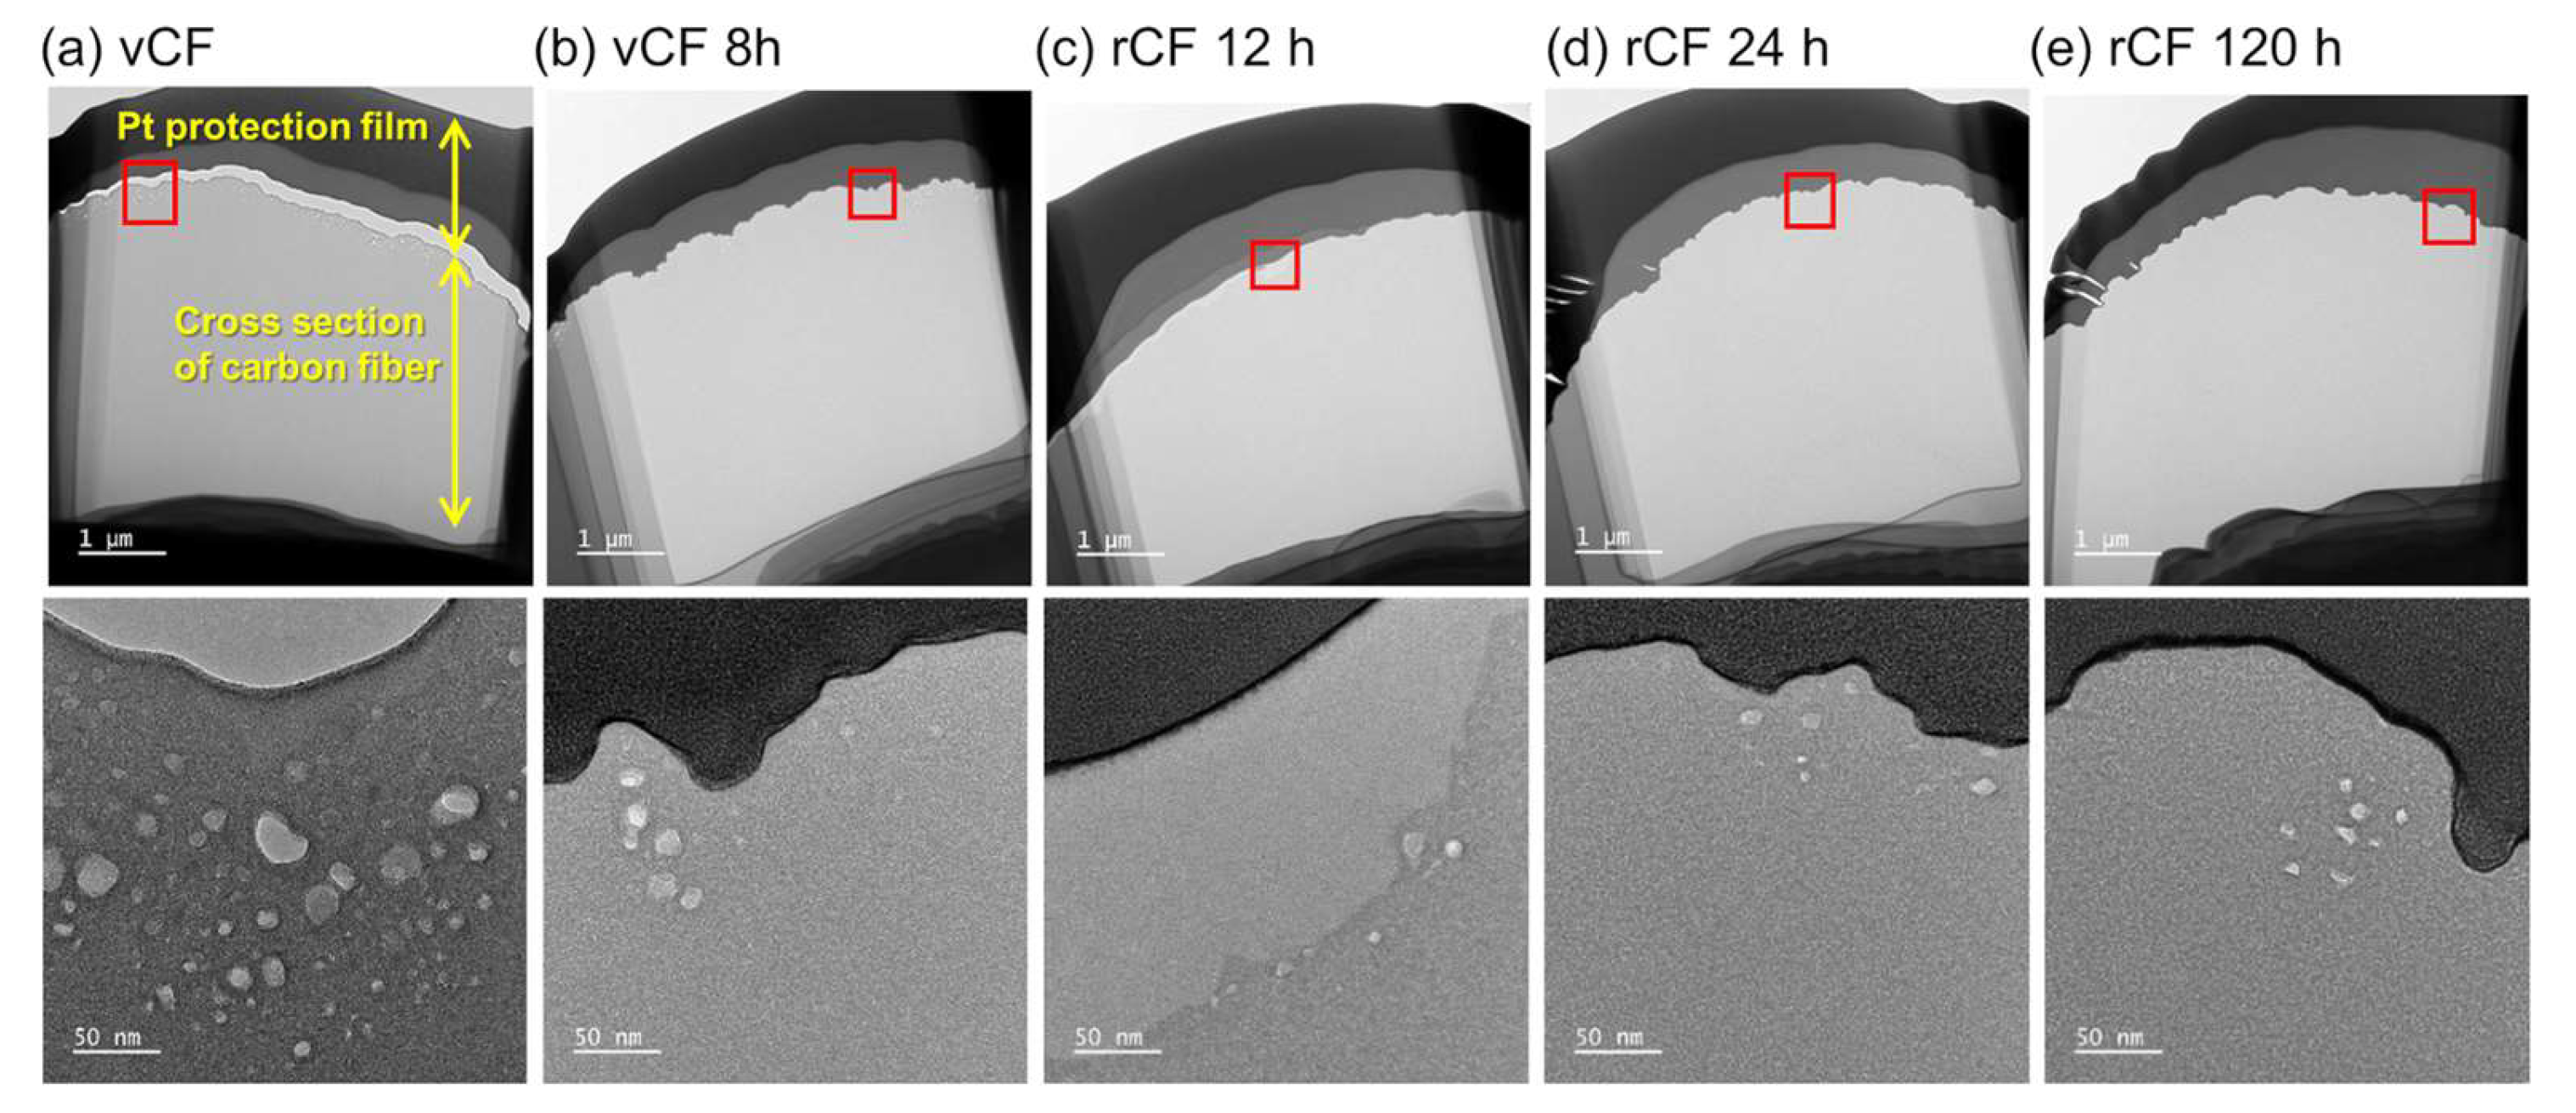
Figure 8.
Results of EDX mapping to cross-section for (a) vCF, (b) vCF 8 h, and rCF (c) 12 h, (d) 24 h, and (e) 120 h, where the white circle represents the presence of the voids and orange circle represents the N or O atoms existing inside the voids.
Figure 8.
Results of EDX mapping to cross-section for (a) vCF, (b) vCF 8 h, and rCF (c) 12 h, (d) 24 h, and (e) 120 h, where the white circle represents the presence of the voids and orange circle represents the N or O atoms existing inside the voids.

Figure 9.
ID1/IG1 ratio, ID2/IG1 ratio, and IG2/IG1 ratio of vCF and rCF obtained from Raman spectroscopy analysis.
Figure 9.
ID1/IG1 ratio, ID2/IG1 ratio, and IG2/IG1 ratio of vCF and rCF obtained from Raman spectroscopy analysis.

Table 1.
Atomic concentrations of vCF and rCF measured by XPS, and polar functional groups are shown in red words.
Table 1.
Atomic concentrations of vCF and rCF measured by XPS, and polar functional groups are shown in red words.
| vCF | vCF 8 h | rCF 12 h | rCF 24 h | rCF 120 h | ||
|---|---|---|---|---|---|---|
| C (%) | CHn | 45.1 | 38.1 | 30.7 | 35.8 | 42.3 |
| C-OH, C-O-C | 27.8 | 23.3 | 25.6 | 23.8 | 21.1 | |
| >C=O | 2.8 | 3.4 | 4.2 | 3.8 | 3.3 | |
| -CO-O- | 0.8 | 3.0 | 2.6 | 2.7 | 4.0 | |
| -C=C- | 0.7 | 1.9 | 1.4 | 1.5 | 2.0 | |
| Total | 77.2 | 69.7 | 64.5 | 67.5 | 72.7 | |
| N (%) | -NH2 | 0.0 | 1.4 | 1.5 | 1.1 | 1.5 |
| -NO/NH4 | 1.2 | 0.7 | 1.3 | 1.3 | 1.3 | |
| -NO2 | 0.0 | 4.2 | 6.1 | 5.5 | 3.9 | |
| Total | 1.2 | 6.2 | 8.9 | 7.9 | 6.6 | |
| O (%) | 19.5 | 22.6 | 26.8 | 24.5 | 20.5 | |
| Others (%) | 1.9 | 1.6 | 0.1 | 0.0 | 0.2 | |
Table 2.
Presence ratio of voids existing inside vCF and rCF.
| Presence Ratio of Voids | |
|---|---|
| vCF | 3.21% |
| vCF 8 h | 0.95% |
| rCF 12 h | 1.05% |
| rCF 24 h | 1.17% |
| rCF 120 h | 0.23% |
Disclaimer/Publisher’s Note: The statements, opinions and data contained in all publications are solely those of the individual author(s) and contributor(s) and not of MDPI and/or the editor(s). MDPI and/or the editor(s) disclaim responsibility for any injury to people or property resulting from any ideas, methods, instructions or products referred to in the content. |
© 2023 by the authors. Licensee MDPI, Basel, Switzerland. This article is an open access article distributed under the terms and conditions of the Creative Commons Attribution (CC BY) license (https://creativecommons.org/licenses/by/4.0/).
Share and Cite
MDPI and ACS Style
Sakai, A.; Kurniawan, W.; Kubouchi, M. Recycled Carbon Fibers with Improved Physical Properties Recovered from CFRP by Nitric Acid. Appl. Sci. 2023, 13, 3957. https://doi.org/10.3390/app13063957
AMA Style
Sakai A, Kurniawan W, Kubouchi M. Recycled Carbon Fibers with Improved Physical Properties Recovered from CFRP by Nitric Acid. Applied Sciences. 2023; 13(6):3957. https://doi.org/10.3390/app13063957
Chicago/Turabian StyleSakai, Asuka, Winarto Kurniawan, and Masatoshi Kubouchi. 2023. "Recycled Carbon Fibers with Improved Physical Properties Recovered from CFRP by Nitric Acid" Applied Sciences 13, no. 6: 3957. https://doi.org/10.3390/app13063957
Note that from the first issue of 2016, this journal uses article numbers instead of page numbers. See further details here.