
Matching the Liquid Atomization Model to Experimental Data Obtained from Selected Nozzles


1
Institute of Agricultural Engineering, Wrocław University of Environmental and Life Sciences, 37a Józefa Chełmońskiego Street, 51-630 Wrocław, Poland
2
Department of Machinery Exploitation and Management of Production Processes, University of Life Sciences in Lublin, 20-612 Lublin, Poland
3
Department of Applied Mathematics and Computer Science, University of Life Sciences in Lublin, 20-612 Lublin, Poland
*
Author to whom correspondence should be addressed.
Appl. Sci. 2023, 13(7), 4433; https://doi.org/10.3390/app13074433
Submission received: 9 January 2023
/
Revised: 28 March 2023
/
Accepted: 29 March 2023
/
Published: 31 March 2023
(This article belongs to the Special Issue New Development in Smart Farming for Sustainable Agriculture)
Abstract
:The spraying procedure is one of the most difficult operations in agricultural production. Achieving the desired effectiveness of the procedure is dependent on obtaining an appropriate level and uniformity of liquid distribution. The aim of this paper was to present a liquid decomposition model generated on the basis of experimental data. The tests were carried out on a test stand, which consisted of a container with nozzles and a grooved table. The experiments were carried out with the use of selected standard, anti-drift, and air-induction single-stream nozzles at constant liquid pressure. The optimization process was carried out in Microsoft Excel Solver. Furthermore, in order to compare the data generated by the model with the data from the virtual boom, we applied an analysis of correlation and linear regression in the Statistica 13.1 software. Based on the results obtained, it can be concluded that the model is a good fit to the experimental data (R2 > 0.95). The model, which was generated on the basis of experimental data, will facilitate control of the operation and degree of wear of nozzles, which will contribute to ensuring uniform spraying.
1. Introduction
Liquid spraying is a process implemented in a number of sectors of the economy, e.g., environmental engineering, chemical engineering, power engineering, food technology, forestry, and agriculture. Quality and efficiency are the basic issues related to the liquid atomization process [1,2]. The quality of liquid atomization is characterized by the degree and homogeneity of atomization, which is influenced by controlled and uncontrolled factors [3,4]. Among the controlled factors are the geometry and dimensions of the atomizer, as well as the type of liquid, while the uncontrolled factors include disturbances, vibrations, and liquid turbulence.
In the case of spraying processes, effectiveness is determined by the level and uniformity of liquid distribution on the sprayed surface. The uniformity of liquid distribution over the entire width of the spray is affected by, among other factors, liquid pressure and type of nozzle, the angle of the liquid stream and its symmetry, and the height of the boom over the protected plants [5,6,7]. Many authors also pay attention to the deflection of the field boom during spraying and its impact on the evenness of spraying [8,9].
For field crops, flat fan nozzles are used, and the stream is in the form of a fan. On the other hand, in orchard crops, swirl nozzles are used, and the stream of liquid is cone-shaped. The listed types of nozzles belong to the group of slotted nozzles, which are subject to wear during operation. The wear of the nozzles leads to a change in the flow rate. The stream of sprayed liquid can also change shape due to mechanical damage to the sprayer or as a result of limescale deposits inside it.
In case of field sprayers, the uniformity of the distribution of the liquid fall sprayed is checked on the grooved table [10,11,12]. The uniformity of the liquid distribution can be unequivocally determined on the basis of the coefficient of variation, which is calculated as the ratio of the standard deviation to the average value. The lower the coefficient, the more uniform the spraying is; however, when the coefficient is above 10%, it is unacceptable for use with plant protection products [13,14].
Mathematical modeling is often used in agriculture, among other methods, to present complex and non-linear relationships, predict, classify, evaluate, and optimize processes, and increase environmental performance. In a study of uniformity of spray liquid distribution, mathematic modelling was used, among other methods, by Nowakowski and Ośko [15]. The scientists carried out tests on the uniformity of liquid distribution on an automatic grooved table, over which the liquid from a stationary field sprayer was sprayed, using various technical and technological factors. The mathematical model was developed on the basis of non-linear regression. Liao et al. [16] conducted research in a wind tunnel, and their aim was to develop predictive models for air-induction nozzles. Wawrzosek and Parafiniuk [17,18] presented optimization methods that can be applied during the production of nozzles. Moa’ath et al. [19] proposed a mathematical model to predict the movement of droplets on a virtual leaf surface. Cieniawska and Pentoś [20] presented the results of optimizing the spraying process, the aim of which was to maximize the average coverage degree while minimizing the coverage unevenness coefficient. Musiu et al. [21] presented a model based on computational liquid dynamics (CFD) for evaluating spray liquid distribution in a greenhouse crop. Based on the analysis of the test results, they showed that both the distance from the protected plants and the flow rate had an impact on the distribution of droplet sizes. Models based on computational liquid dynamics are also often used to predict and assess spray drift [22,23]. Renaudo et al. [24] conducted research based on the Maximum Entropy Principle (MEP), the Linearized Instability Sheet Atomization (LISA) model, and Computational Liquid Dynamics (CLD) simulations. Almost all scientists pointed out the need to carry out further work in the field of mathematical modeling in order to extend the fit of models to actual values. Therefore, the aim of this work was to develop a new model of the distribution of the amount of sprayed liquid.
2. Materials and Methods
2.1. Experiment Description
The tests were carried out in laboratory conditions in the Laboratory of Agrochemical Application Techniques in the Department of Machinery Operation and Production Process Management at the University of Life Sciences in Lublin. The basic elements of the measuring station were a hopper with nozzles, a groove table with a groove width of 50 mm, 50 measuring cylinders, a hydraulic system, and electronic control. The width of the groove table was 2500 mm. The spray hopper was positioned in the center of the groove table. The height of the nozzle hopper above the groove table was adjustable within the range of 300–800 mm. The construction of the hopper made it possible to set the nozzle slots in two positions: in the longitudinal plane, perpendicular to the ground, and with inclination of the nozzles by an angle of 7°, which reflects the arrangement of the nozzles on the sprayer’s field beam. The liquid emitted by a single nozzle fell onto a grooved table, from which it flowed into measuring cups equipped with sensors for measuring the volume of the collected liquid. The measurement time was 60 s.
Tap water was used during the tests. Single-stream standard (XR TeeJeet, RSMM MMAT Agro Technology), anti-drift (AZMM MMAT Agro Technology), and air-induction (IDK Lechler, EŻK MMAT Agro Technology) nozzles were used in the tests. The nozzles used during the experiments were characterized by different values of liquid flow rate at constant pressure. The nozzle characteristics are presented in Table 1.
For each measurement series, 25 new nozzles were used, randomly selected from a set of 35. Parameters and working conditions of nozzles during the study were:
- the height of the nozzles above the groove table, 500 mm;
- liquid pressure, 0.3 MPa.
2.2. Development of A New Model of Liquid Amount Distribution
In their work, scientists devoted significant attention to adjusting the distribution of droplets produced by nozzles to real spraying [17,25,26]. In order to develop a new model, the primary function of the liquid distribution for a single nozzle was defined according to the formula:
where: —is the real variable with values from the spray range (0.5; 2) [m], —are shape parameter dependent of specific properties of histograms, and - are shape parameters.
More exactly, the coordinates on the real plane characterize the empiric distribution of the accumulation of liquid amounts during the spraying process. The method for construction of the density function presented above ensures semi-symmetry of distribution.
The aim of the optimization process was to obtain the appropriate value of the liquid distribution coefficient on the basis of the selection of p and q parameters. The optimization process was performed in Microsoft Excel 2013 Solver Online. Microsoft Excel 2013 Solver has been used to optimize the use of fertilizers [27], crop structure to increase yields [28], and estimation of evapotranspiration [29,30].
Then, the model described above was transformed into one that describes spraying from the entire sprayer boom. Of course, this was done on a test stand that reflects real working conditions.
Hence, the formula of the function describing the spraying from the nozzle is as follows:
The arguments of the function g(x) runs over are numbers, each of which represents a single container from the measuring table. Subsequently, to reflect the real conditions, data from 25 identical tables are superimposed in such a way that they are 0.5 m apart, linearly.
The amount of liquid that will be collected in the measuring containers is the same as the volume of liquid coming from the entire sprayer boom. Bearing in mind the ISO 16122-2:2015(E) guidelines, when calculating the coefficient of variation, it is necessary to take into account the measurements from the middle of the second nozzle to the second from the end [31]. Therefore, the sum range in Equations (2) and (3) corresponds to containers 36 to 256.
Using the parameters introduced to define the model, i.e., a, p, b, and q, the formula for the coefficient of variation takes the following form:
where the formulas for the mean and variance, corresponding to the derived model, are as follows:
and and are the mean and standard deviation, respectively, of the values of function .
The main purpose of developing the model was to ensure that the appropriate selection of coefficients would result in the lowest possible value of the coefficient of variation. A model obtained in this way will reflect the form of a new (unused) nozzle. This guarantees the most even possible coverage of the spray surface, which obviously implies optimal development of the treated area. As a consequence, we are able to estimate acceptable levels of nozzle wear. These are usually assumed to be between 5% and 10% for the coefficient of variation. The maximum permissible value of the variation coefficient is 10%, according to ISO 5682-1:2017 [32]. The coefficient of variation can be determined for the individual nozzle, for the section, or the entire width of boom field sprayer. Research on individual nozzles may be used to compare nozzles, whereas an assessment of quality spraying may be relevant to a section or the entire width of boom.
Due to the fact that any number of measuring tables can be added, and consequently any number of nozzles, we are able to simulate a beam of any length. If we consider the case that spacing of the grooves on the measurement table is 5 cm, then in the model we have the minimal value of the coefficient of variation, which is . Then, the parameters of the function f(x) are as follows:
a = 0.127, b = 0.100, p = 2.000, q = 1.800
2.3. Statistical Analysis
In order to compare the data generated by the model with data from the virtual boom, correlation, and linear regression analysis, Statistica 13.1 Tibco, USA software was used.
The obtained results, generated by the model, were normalized by multiplying each of them by such a constant that the sum of the amount of liquid from the model data was the same as the experimental data.
The data generated by the model was compared with the data from the virtual boom sprayer by the correlation coefficient, which was used to measure the relationship between the amount of liquid according to the model and the experimental data.
3. Results
This model is very well fitted to the data, as shown by the correlation and determination coefficients of all types of tested nozzles, listed in Table 2.
Analyzing this table, it can be concluded that the model best fits the data from the AZ MM 110 03 anti-drift nozzles, while the worst fit is to the EŻK 110 025 air-induction nozzles. Generally, the correlation coefficients are greater than 0.950, and the coefficients of determination are greater than 0.900, which indicates a very good fit to the experimental data.
The test results are shown in Figure 1, Figure 2, Figure 3, Figure 4 and Figure 5, which show the fit for each spray nozzle type. The y-axis shows the amount of liquid in the cylinders, while the x-axis shows the number of cylinders corresponding to the 14.5 m width of the sprayer’s field boom. Results of spray fallout are the same as the real work of a boom field sprayer. Nozzle axes were spaced every 500 mm so that streams of liquid to overlap. The graphs present the results of the spray fall distribution for both experimental data and data generated using the model. The amount of liquid increased with increasing nozzle size.
Based on these coefficients, we could model the coefficient of variation at the level of 10%, which is the acceptable limit when testing the wear of spray nozzles. Table 3 compares the parameter values of the optimal model and the simulated limit model.
The permissible limits of deviation in the amount of liquid accumulated in the containers from a single nozzle of the new nozzle (CV = 1.49%) in relation to the possible level of wear (CV = 10.000%) are presented in Figure 6.
4. Discussion
The above paper presents mathematical modeling and predicts the uniformity of spray liquid distribution with the use of different types of nozzles. The experimental results of Forney et al. [4] showed that slight differences in both the setting of the sprayer’s field boom and the unit flow rate of the spray liquid caused changes in the uniformity of the spray liquid distribution. Nowakowski and Ośko [15] developed a mathematical model that allows low coefficients of spraying unevenness. The scientists conducted research using dual-stream nozzles and variable parameters, such as spraying height, liquid pressure, and the angle of the field boom. Based on analysis of the test results, the researchers concluded that, in order to obtain low values of the unevenness coefficient, the boom should be set at a height of 0.4–0.5 m, the liquid pressure should be in the range of 0.350–0.400 MPa, and the boom tilt angle should not be higher than 5° in the horizontal plane. Post and Hewitt [33] presented a model for predicting changes in droplet size when the pressure or type of liquid changes. The model proposed by the scientists is designed for Newtonian liquids, and they drew attention to the need to develop a model for non-Newtonian liquids. Liao et al. [16] and Ferguson et al. [34] presented the results of tests carried out in a wind tunnel with the use of air-induction nozzles.
Many authors stressed the importance of research using adjuvants. Ferguson et al. [34] noticed that the type of substance used affects the quality of atomization. When adjuvants are added to the liquid, the process of disintegration of the liquid into droplets changes, causing a change in the size and uniformity of the droplets. The Li-700 adjuvant and single-stream standard, dual-stream, air-induction, and hollow cone nozzles were used in the tests. The use of an adjuvant improved the uniformity of the droplets produced using air-induction nozzles. Griesang et al. [35] concluded that further research should be conducted in this area, because the addition of an adjuvant can cause both improvement and deterioration of liquid uniformity. However, Liao et al. [16] developed a model and validated it; the input variables were liquid flow rate and pressure, to predict the output variables Dv0.1, Dv0.5, Dv0.9, % < 150 µm, RS, and CV. Based on the validation results, only Dv0.1, Dv0.5, Dv0.9, and % < 150 μm can be predicted based on the input data.
Lipiński et al. [7] analyzed the impact of different types of nozzles, liquid pressure, wind speed, and obstacles destabilizing the boom operation. The tests were carried out on a designed obstacle course with the use of three types of nozzles at three different liquid pressures and three different driving speeds. Based on the results of the experiments, it was found that the anti-drift nozzles LD were characterized by the greatest uniformity.
Lodwik et al. [13] noticed that a high value of the variation coefficient of a single nozzle does not mean exceeding 10% of the variation coefficient value of the entire boom. During their tests, six nozzles were used at seven levels of wind speed (from 0 to 6 m/s). Values of coefficient variation were lower than 10% only for anti-drift nozzles AZMM. On the other hand, for air-induction nozzles EŻ, the coefficient of variation value decreased with increasing wind speed [13]. Similar studies were conducted by Cetin et al. [36], with the difference that hydraulic nozzles were also used in their experiments.
Pulse width modulation (PWM) systems are used to improve the uniformity of liquid distribution. Butts et al. [36] found that the uniformity of liquid distribution with a pulse width modulation system can be optimized by applying liquid pressures above 0.276 MPa and duty cycles greater than or equal to 40%. The condition is the use of nozzles other than air-induction nozzles. However, Li et al. [37] suggested that duty cycles be lower than 70% to ensure adequate drift-reduction potential. Fabula et al. [38] found that, for treatment with the PWM system, nozzles operating in a wide range of pressures should be selected to ensure uniform distribution of the liquid. The value of the non-uniformity coefficient was about 10%. Based on the analysis of the presented research results, it can be concluded that there is a need to continue and develop methods for optimizing the spraying process in terms of the uniformity of spray liquid distribution.
The uniformity of liquid distribution is related to the homogeneity of the liquid stream of an individual nozzle, as evidenced by many publications in this field. Sayinci et al. [11] conducted research on the impact of nozzle type, and three height levels of flat fan nozzles, on coefficient variation. The observed results indicated that values decreased with lowering spray heights for standard nozzles, while for air-induction nozzles, values decreased with higher spray heights. Griesang et al. [5] used flat fan nozzles at two nominal flow rates and four levels of liquid pressure. The coefficient of variation was higher than 10% when a liquid pressure of 0.1 MPa was used. Increasing uniformity was observed with increased spray pressure up to 0.3 MPa, with a slight decrease after obtaining pressures of 0.4 MPa and up.
5. Summary
One of the overarching goals of modern agriculture is to obtain the right level and uniformity of liquid during the spraying procedure. On the basis of the optimization results, a model was presented, which is a practical basis for presenting the characteristics of the fallout distribution of liquid sprayed with single-stream nozzles. The use of this model will make it easier to control the operation of the nozzles and help to assess the degree of their wear, thanks to which proper uniformity of spraying will be ensured.
Author Contributions
Conceptualization, S.P.; methodology, S.P.; validation, B.C., S.P., P.A.K. and Z.O.; formal analysis, S.P. and B.C.; investigation, S.P. and B.C.; resources, S.P. and B.C.; writing—original draft preparation, B.C.; writing—review and editing, S.P., P.A.K. and Z.O.; visualization, B.C., S.P., P.A.K. and Z.O. All authors have read and agreed to the published version of the manuscript.
Funding
This research received no external funding.
Institutional Review Board Statement
Not applicable.
Informed Consent Statement
Not applicable.
Data Availability Statement
Data are available by contacting the authors.
Conflicts of Interest
The authors declare no conflict of interest.
References
- Jobbágy, J.; Dančanin, P.; Krištof, K.; Maga, J.; Slaný, V. Evaluation of the Quality of Irrigation Machinery by Monitoring Changes in the Coefficients of Uniformity and Non-Uniformity of Irrigation. Agronomy 2021, 11, 1499. [Google Scholar] [CrossRef]
- Krawczuk, A.; Parafiniuk, S.; Przywara, A.; Huyghebaert, B.; Rabier, F.; Limbourg, Q.; Mostade, O.; Kocira, S. Technical Parameters of Biostimulant Spraying a Determinant of Biometric Traits and Yield of Soybean Seeds. Agric. Eng. 2021, 25, 171–179. [Google Scholar] [CrossRef]
- Chen, C.; Li, S.; Wu, X.; Wang, Y.; Kang, F. Analysis of Droplet Size Uniformity and Selection of Spray Parameters Based on the Biological Optimum Particle Size Theory. Environ. Res. 2022, 204, 112076. [Google Scholar] [CrossRef]
- Forney, S.H.; Luck, J.D.; Kocher, M.F.; Pitla, S.K. Laboratory and Full Boom-Based Investigation of Nozzle Setup Error Effects on Flow, Pressure, and Spray Pattern Distribution. Appl. Eng. Agric. 2017, 33, 641–653. [Google Scholar] [CrossRef] [Green Version]
- Griesang, F.; Spadoni, A.B.D.; Urah Ferreira, P.H.; da Costa Ferreira, M. Effect of Working Pressure and Spacing of Nozzles on the Quality of Spraying Distribution. Crop Prot. 2022, 151, 105818. [Google Scholar] [CrossRef]
- Višacki, V.; Sedlar, A.; Bugarin, R.; Turan, J.; Burg, P. Effect of Pressure on the Uniformity of Nozzles Transverse Distribution and Mathematical Model Development. Acta Univ. Agric. Silvic. Mendel. Brun. 2017, 65, 563–568. [Google Scholar] [CrossRef] [Green Version]
- Lipiński, A.J.; Lipiński, S.; Burg, P.; Sobotka, S.M. Influence of the Instability of the Field Crop Sprayer Boom on the Spraying Uniformity. J. Agric. Food Res. 2022, 10, 100432. [Google Scholar] [CrossRef]
- Cui, L.F.; Xue, X.Y.; Ding, S.M.; Le, F.X. Development of a DSP-Based Electronic Control System for the Active Spray Boom Suspension. Comput. Electron. Agric. 2019, 166, 105024. [Google Scholar] [CrossRef]
- Li, S.; Wang, W. Adaptive Backstepping Robust Control of Nonlinear Spray Boom System. J. Adv. Agric. Technol. 2019, 6, 246–252. [Google Scholar] [CrossRef]
- Çetin, N.; Sağlam, C.; Demir, B. Determination of Spray Angle and Flow Uniformity of Spray Nozzles with Image Processing Operations. J. Anim. Plant Sci. 2019, 29, 1603–1615. [Google Scholar]
- Sayinci, B.; Demir, B.; Açik, N. Comparison of Spray Nozzles in Terms of Spray Coverage and Drop Distribution Uniformity at Low Volume. Turk. J. Agric. For. 2020, 44, 262–270. [Google Scholar] [CrossRef]
- Parafiniuk, S. Conversion of Test Results Obtained for Single Spray Nozzles to Identify the Working Parameters of the Sprayer Boom; Libropolis: Lublin, Poland, 2013. [Google Scholar]
- Lodwik, D.; Pietrzyk, J.; Malesa, W. Analysis of Volume Distribution and Evaluation of the Spraying Spectrum in Terms of Spraying Quality. Appl. Sci. 2020, 10, 2395. [Google Scholar] [CrossRef] [Green Version]
- Shirwal, S.; Veerangouda, M.; Palled, V.; Shilendra, S.; Hosamani, A.; Krishnamurthy, D. Studies on Operational Parameters of Different Spray Nozzles. Int. J. Curr. Microbiol. Appl. Sci. 2020, 9, 1267–1281. [Google Scholar] [CrossRef]
- Nowakowski, T.; Ośko, M. Mathematical Model of Cross-Distribution Non-Uniformity for Twin Flat Nozzle. Ann. Warsaw Univ. Life Sci.—SGGW—Agric. 2017, 69, 5–12. [Google Scholar] [CrossRef]
- Liao, J.; Hewitt, A.J.; Wang, P.; Luo, X.; Zang, Y.; Zhou, Z.; Lan, Y.; O’donnell, C. Development of Droplet Characteristics Prediction Models for Air Induction Nozzles Based on Wind Tunnel Tests. Int. J. Agric. Biol. Eng. 2019, 12, 1–6. [Google Scholar] [CrossRef]
- Wawrzosek, J.; Parafiniuk, S. Optimization of the Opening Shape in Slot Spray Nozzles in a Field Boom Sprayer. Sustainability 2021, 13, 3291. [Google Scholar] [CrossRef]
- Wawrzosek, J.; Parafiniuk, S. The Use of the Permutation Algorithm for Suboptimising the Position of Used Nozzles on the Field Sprayer Boom. Appl. Sci. 2022, 12, 4359. [Google Scholar] [CrossRef]
- Oqielat, M.N.; Turner, I.W.; Belward, J.A.; McCue, S.W. Modelling Water Droplet Movement on a Leaf Surface. Math. Comput. Simul. 2011, 81, 1553–1571. [Google Scholar] [CrossRef] [Green Version]
- Cieniawska, B.; Pentos, K. Average Degree of Coverage and Coverage Unevenness Coefficient as Parameters for Spraying Quality Assessment. Agriculture 2021, 11, 151. [Google Scholar] [CrossRef]
- Musiu, E.M.; Qi, L.; Wu, Y. Evaluation of Droplets Size Distribution and Velocity Pattern Using Computational Fluid Dynamics Modelling. Comput. Electron. Agric. 2019, 164, 104886. [Google Scholar] [CrossRef]
- Duga, A.T.; Delele, M.A.; Ruysen, K.; Dekeyser, D.; Nuyttens, D.; Bylemans, D.; Nicolai, B.M.; Verboven, P. Development and Validation of a 3D CFD Model of Drift and Its Application to Air-Assisted Orchard Sprayers. Biosyst. Eng. 2017, 154, 62–75. [Google Scholar] [CrossRef]
- Wang, J.; Liang, Q.; Zeng, T.; Zhang, X.; Fu, W.; Lan, Y. Drift Potential Characteristics of a Flat Fan Nozzle: A Numerical and Experimental Study. Appl. Sci. 2022, 12, 6092. [Google Scholar] [CrossRef]
- Renaudo, C.A.; Yommi, A.; Slaboch, G.; Bucalá, V.; Bertin, D.E. Prediction of droplet size distributions from a pre-orifice nozzle using the Maximum Entropy Principle. Chem. Eng. Res. Des. 2022, 185, 198–209. [Google Scholar] [CrossRef]
- Tomantschger, K.; Petrović, D.V.; Radojević, R.L.; Tadić, V. Mathematical Method for Droplet Size Distribution of Agricultural Nozzles. Teh. Vjesn. 2021, 28, 1749–1754. [Google Scholar] [CrossRef]
- De Cock, N.; Massinon, M.; Salah, S.O.T.; Lebeau, F. Investigation on Optimal Spray Properties for Ground Based Agricultural Applications Using Deposition and Retention Models. Biosyst. Eng. 2017, 162, 99–111. [Google Scholar] [CrossRef] [Green Version]
- Kaizzi, K.C.; Mohammed, M.B.; Nouri, M. Fertilizer Use Optimization: Principles and Approach. In Fertilizer Use Optimization in Sub-Saharan Africa; CABI: Wallingford, UK, 2017. [Google Scholar] [CrossRef]
- Fytilis, K.; Kontogeorgos, A.; Michailidis, A.; Semos, A. Crop structure optimisation for maximising yield within environmental constraints in a rural area. Int. J. Sustain. Agric. Manag. Inform. 2022, 8, 200–217. [Google Scholar] [CrossRef]
- Echiegu, E.A.; Ede, N.C.; Ezenne, G.I. Optimization of Blaney-Morin-Nigeria (BMN) Model for Estimating Evapotranspiration in Enugu, Nigeria. Afr. J. Agric. Res. 2016, 11, 1842–1848. [Google Scholar] [CrossRef] [Green Version]
- Angaleeswari, M.; Ravikumar, V. Estimating Evapotranspiration Parameters by Inverse Modelling and Non-Linear Optimization. Agric. Water Manag. 2019, 223, 105681. [Google Scholar]
- ISO 16122-2; Agricultural and Forestry Machinery—Inspection of Sprayers in Use—Part 2: Horizontal Boom Sprayers. International Organization for Standardization: Geneva, Switzerland, 2015; p. 18.
- ISO 5682-1; Equipment for Crop Protection—Spraying Equipment—Part 1: Test Methods for Sprayer Nozzles. International Organization for Standardization (ISO): Geneva, Switzerland, 2017.
- Post, S.L.; Hewitt, A.J. Flat-Fan Spray Atomization Model. Trans. ASABE 2018, 61, 1249–1256. [Google Scholar] [CrossRef] [Green Version]
- Ferguson, J.C.; O’Donnell, C.C.; Chauhan, B.S.; Adkins, S.W.; Kruger, G.R.; Wang, R.; Urach Ferreira, P.H.; Hewitt, A.J. Determining the Uniformity and Consistency of Droplet Size across Spray Drift Reducing Nozzles in a Wind Tunnel. Crop Prot. 2015, 76, 1–6. [Google Scholar] [CrossRef]
- Griesang, F.; Decaro, R.A.; Santos, R.T.S.; Vechia, J.F.D.; Santos, C.A.M.; Ferreira, M. Droplet size and uniformity influence on the qualitative and quantitative parameters of agricultural spray. Asp. Appl. Biol. 2018, 137, 217–222. [Google Scholar]
- Butts, T.R.; Luck, J.D.; Fritz, B.K.; Hoffmann, W.C.; Kruger, G.R. Evaluation of Spray Pattern Uniformity Using Three Unique Analyses as Impacted by Nozzle, Pressure, and Pulse-Width Modulation Duty Cycle. Pest Manag. Sci. 2019, 75, 1875–1886. [Google Scholar] [CrossRef] [PubMed] [Green Version]
- Li, L.; Chen, L.; Zhang, R.; Tang, Q.; Yi, T.; Liu, B.; Deng, W. Spray Drift Characteristics of Pulse-Width Modulation Sprays in Wind Tunnel. Int. J. Agric. Biol. Eng. 2022, 15, 7–15. [Google Scholar] [CrossRef]
- Fabula, J.; Sharda, A.; Luck, J.D.; Brokesh, E. Nozzle Pressure Uniformity and Expected Droplet Size of a Pulse Width Modulation (PWM) Spray Technology. Comput. Electron. Agric. 2021, 190, 106388. [Google Scholar] [CrossRef]
Figure 1.
Spray fallout distribution for XR 110 02 nozzles.

Figure 2.
Spray fallout distribution for EŻK 110 025 nozzles.
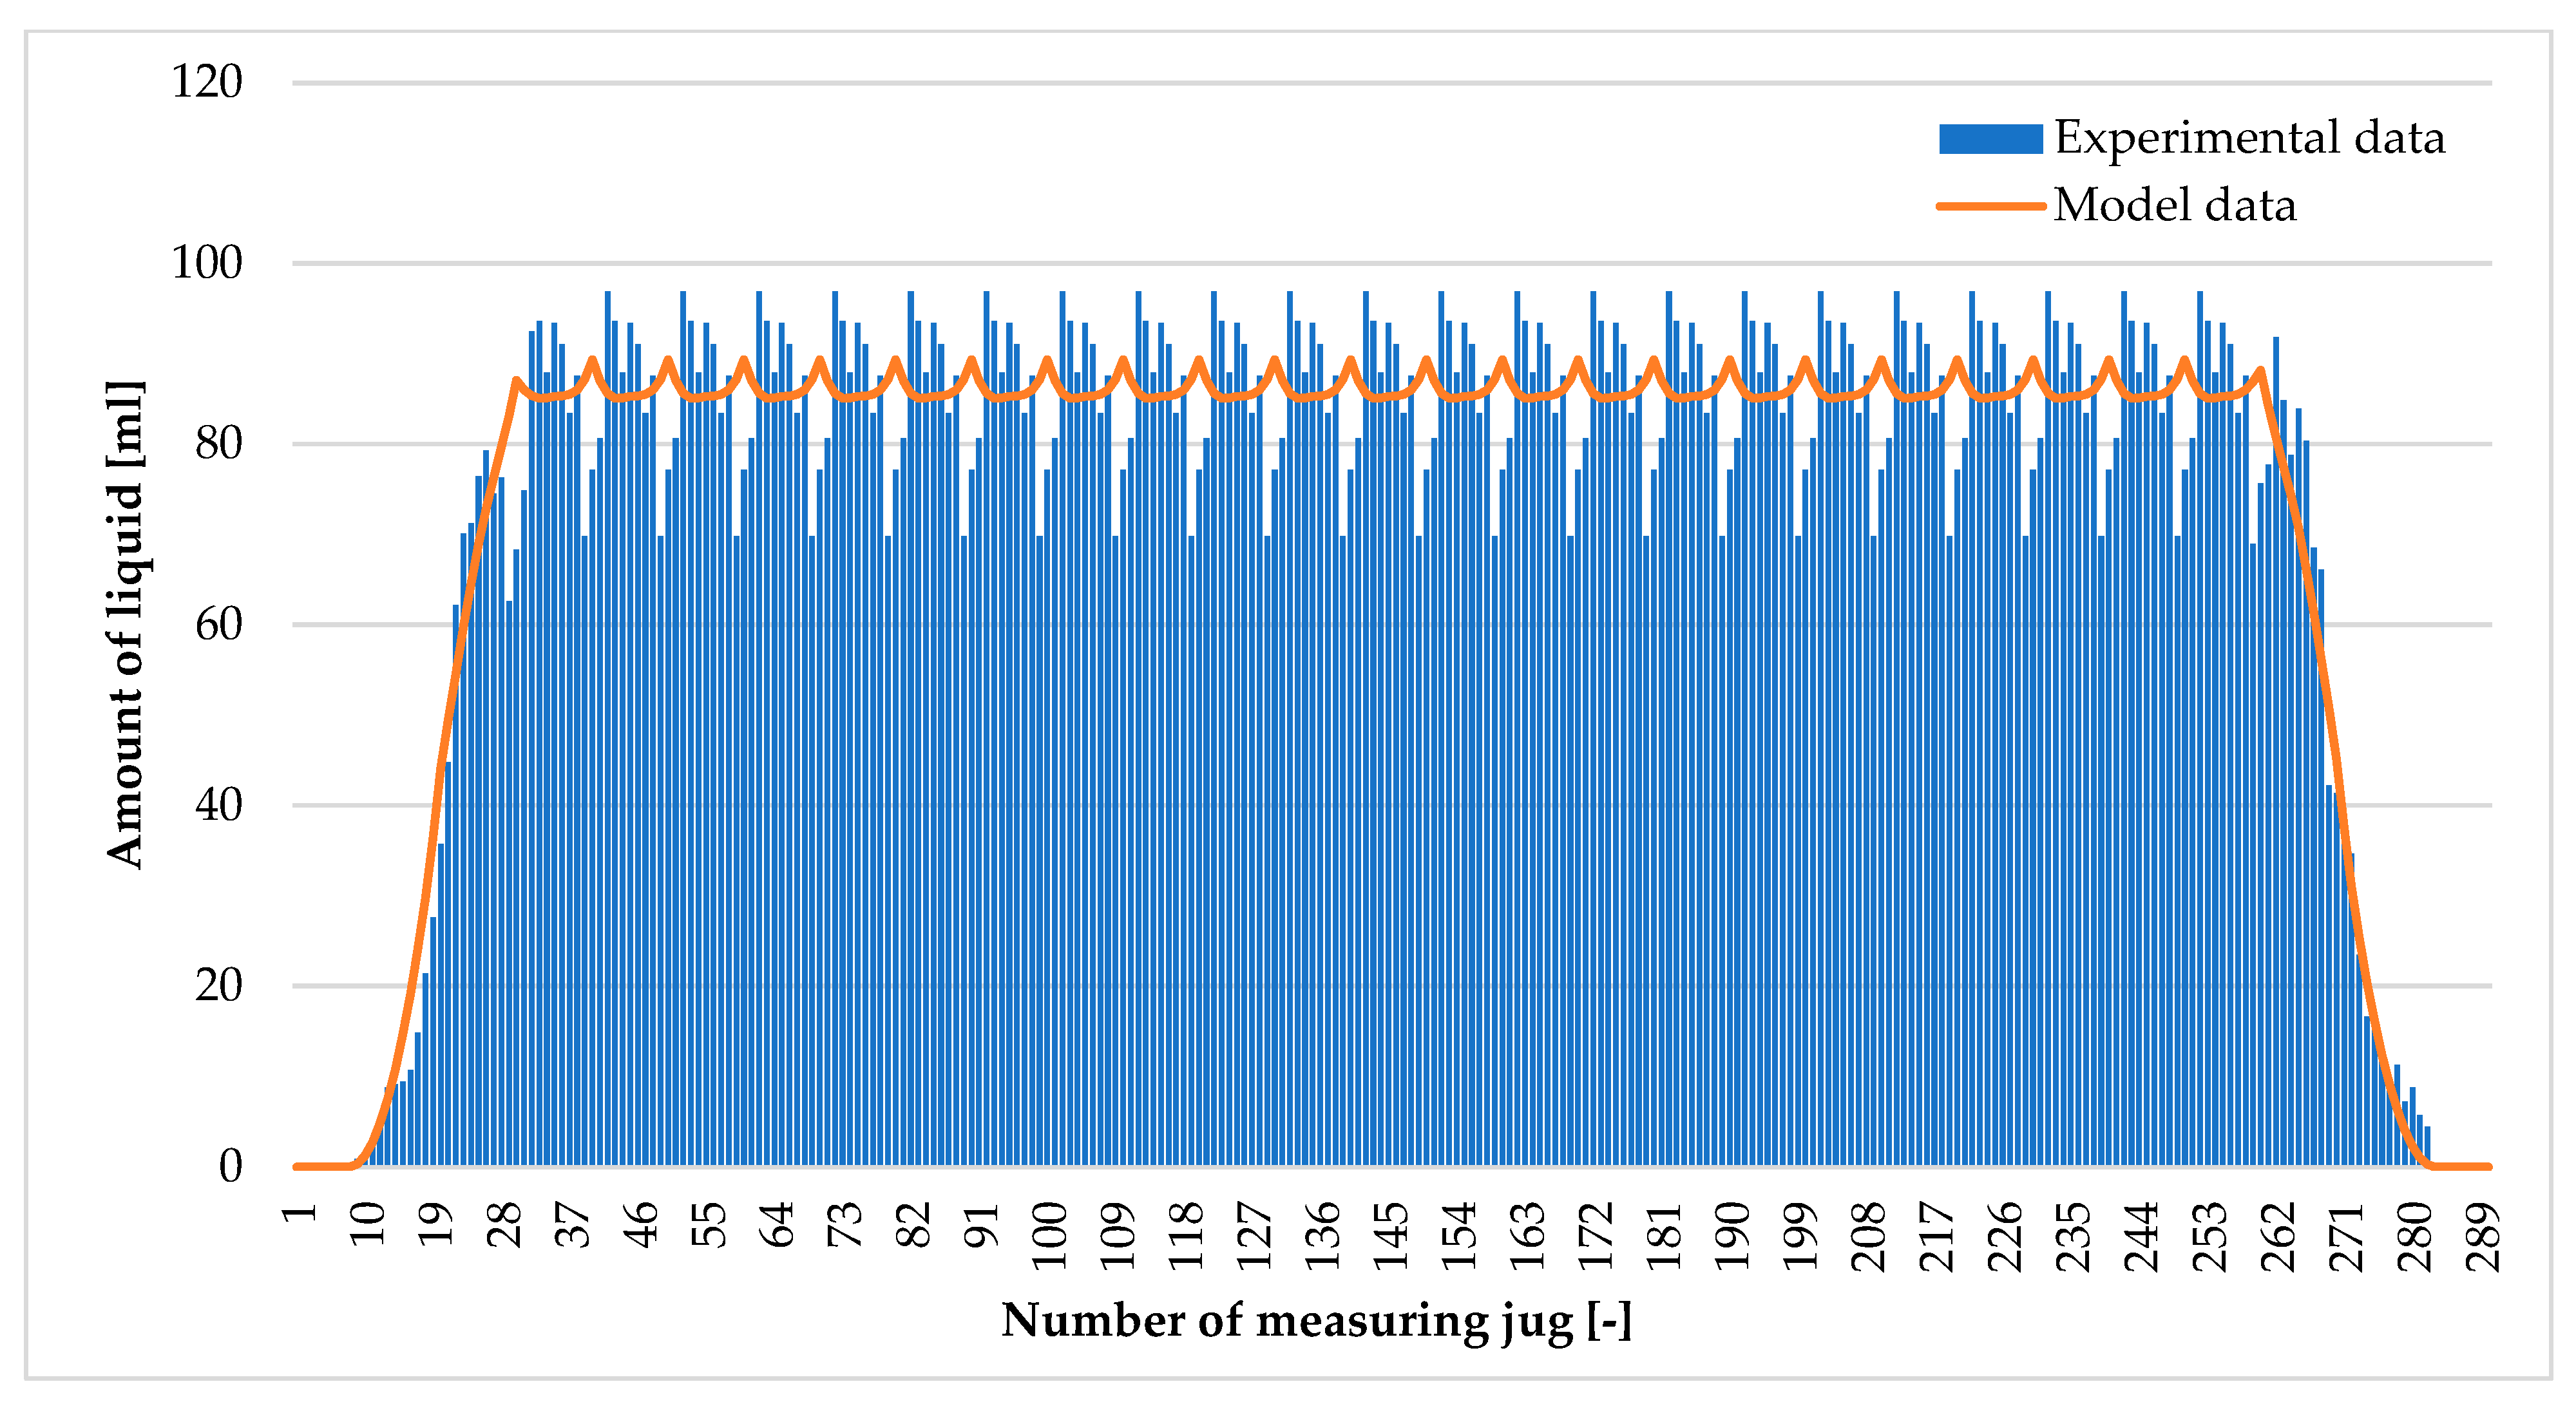
Figure 3.
Spray fallout distribution for AZ MM 110 03 nozzles.

Figure 4.
Spray fallout distribution for RS MM 110 03 nozzles.
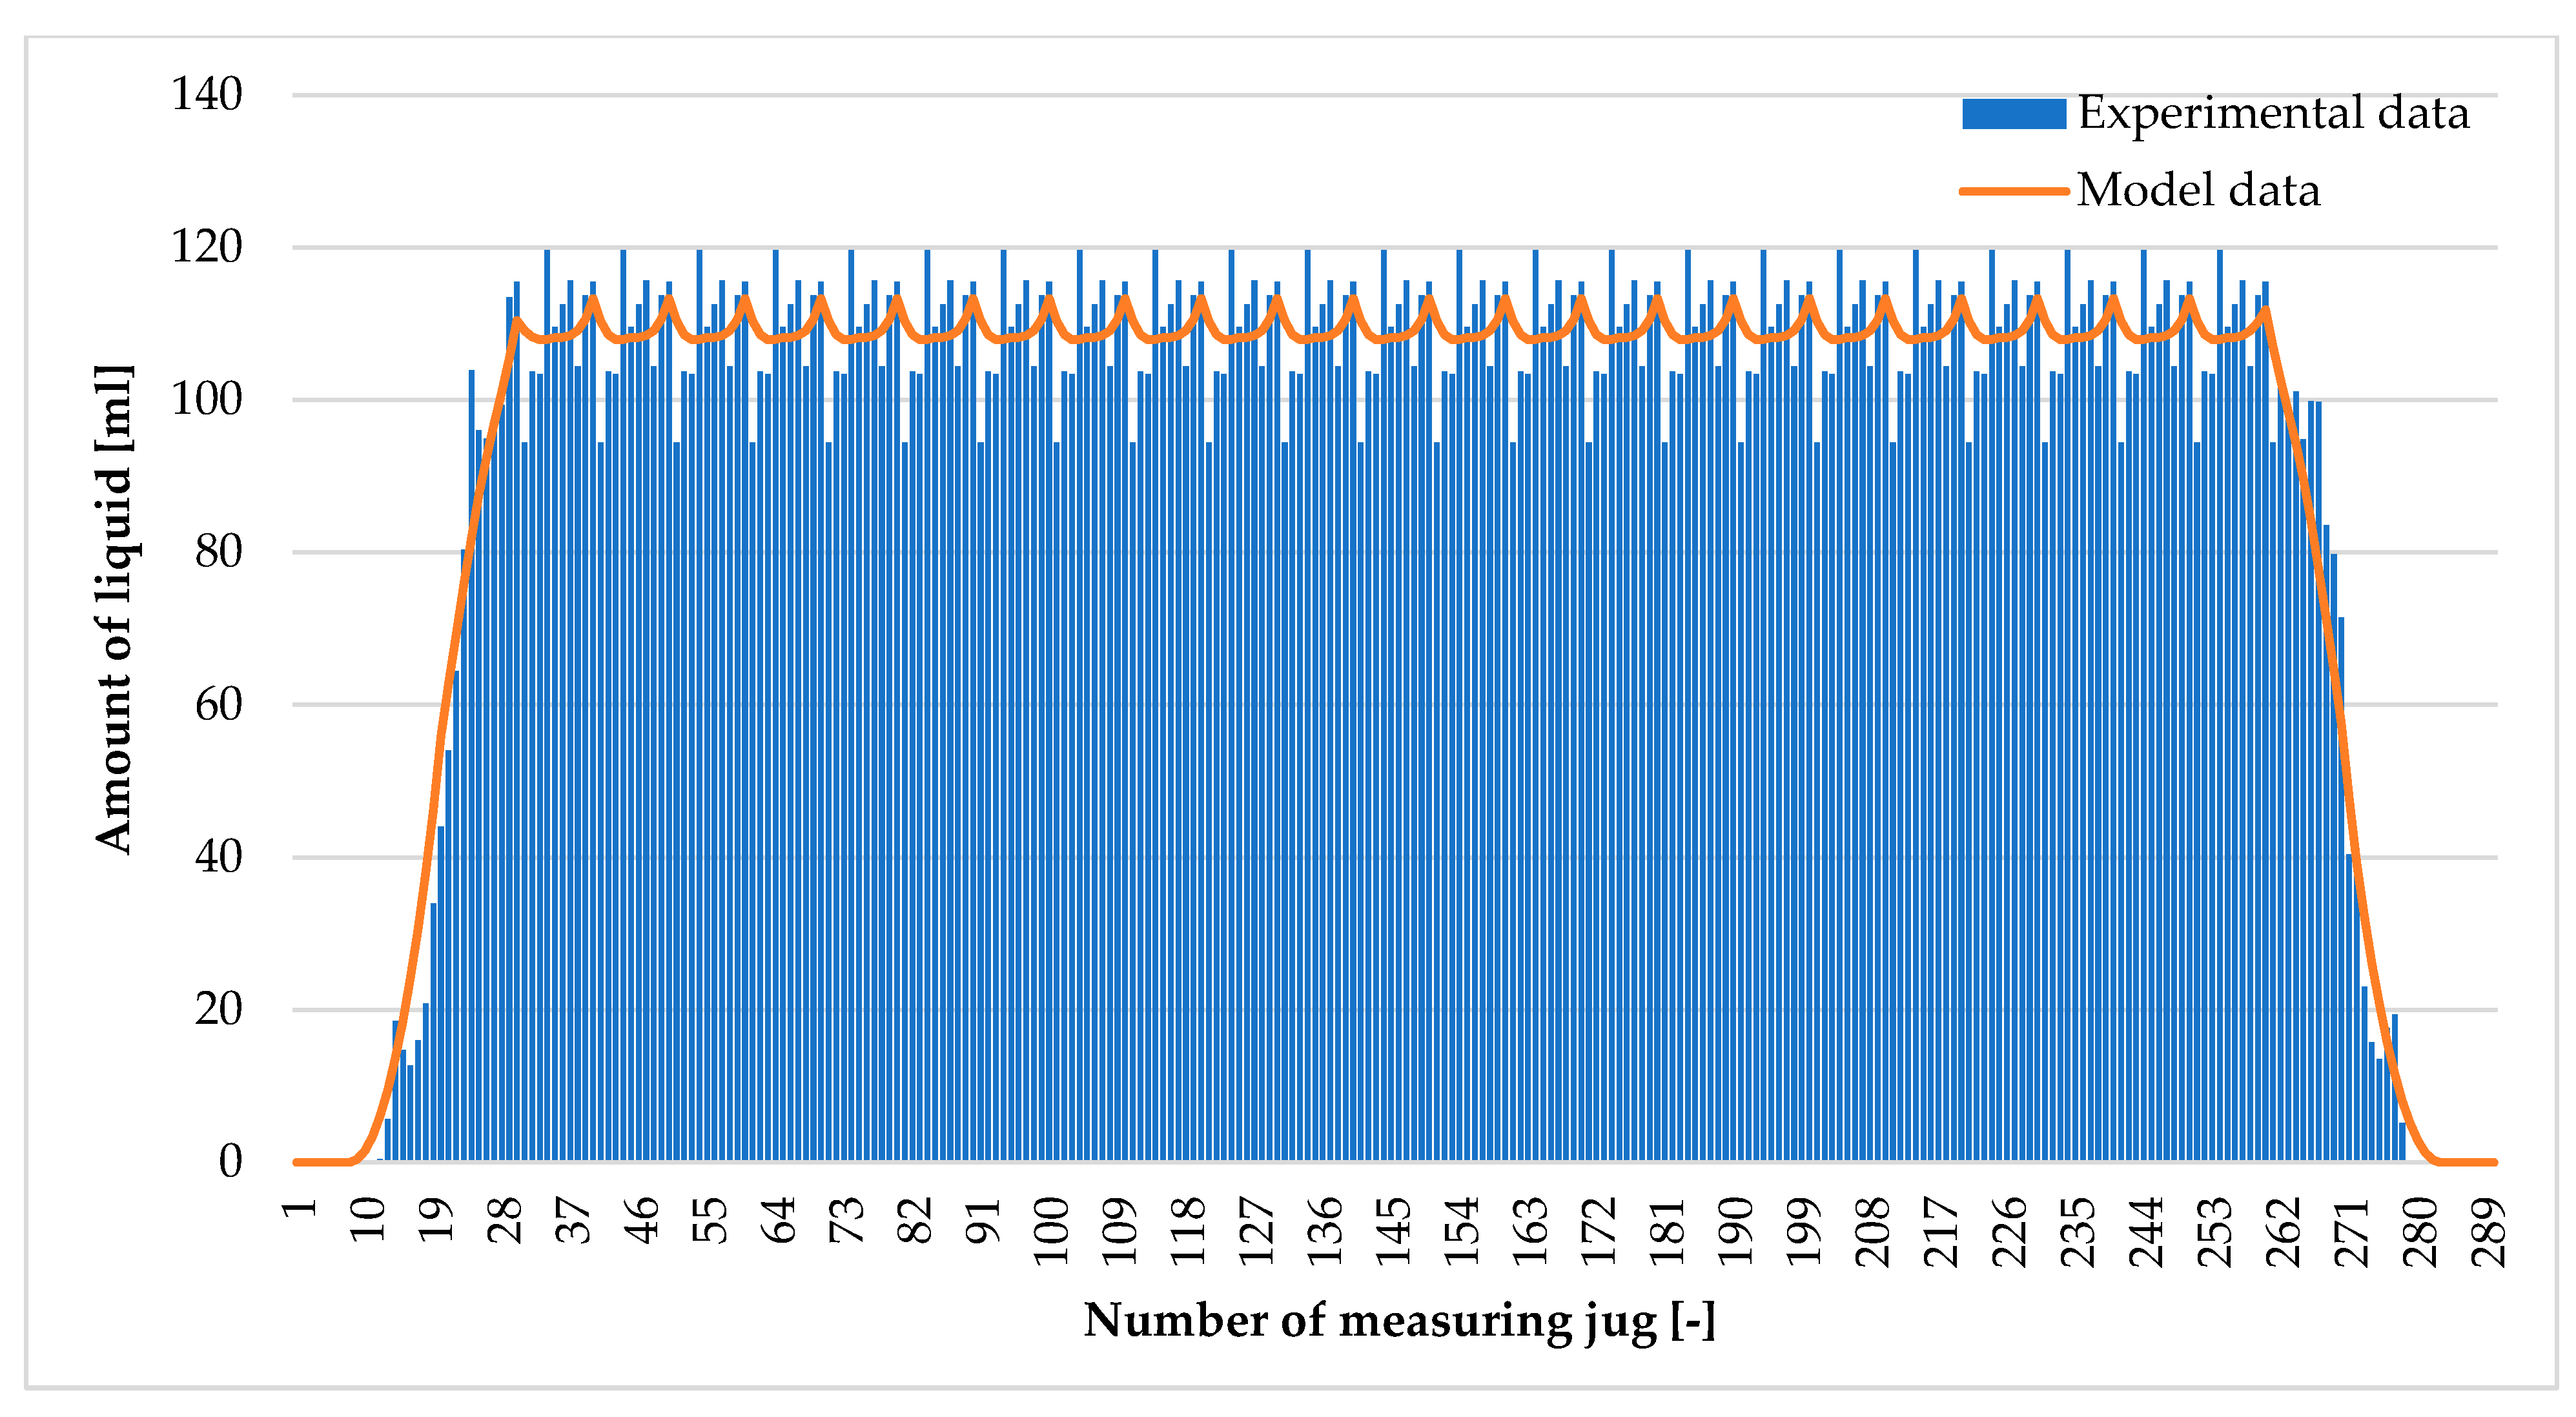
Figure 5.
Spray fallout distribution for IDK 120 04 nozzles.
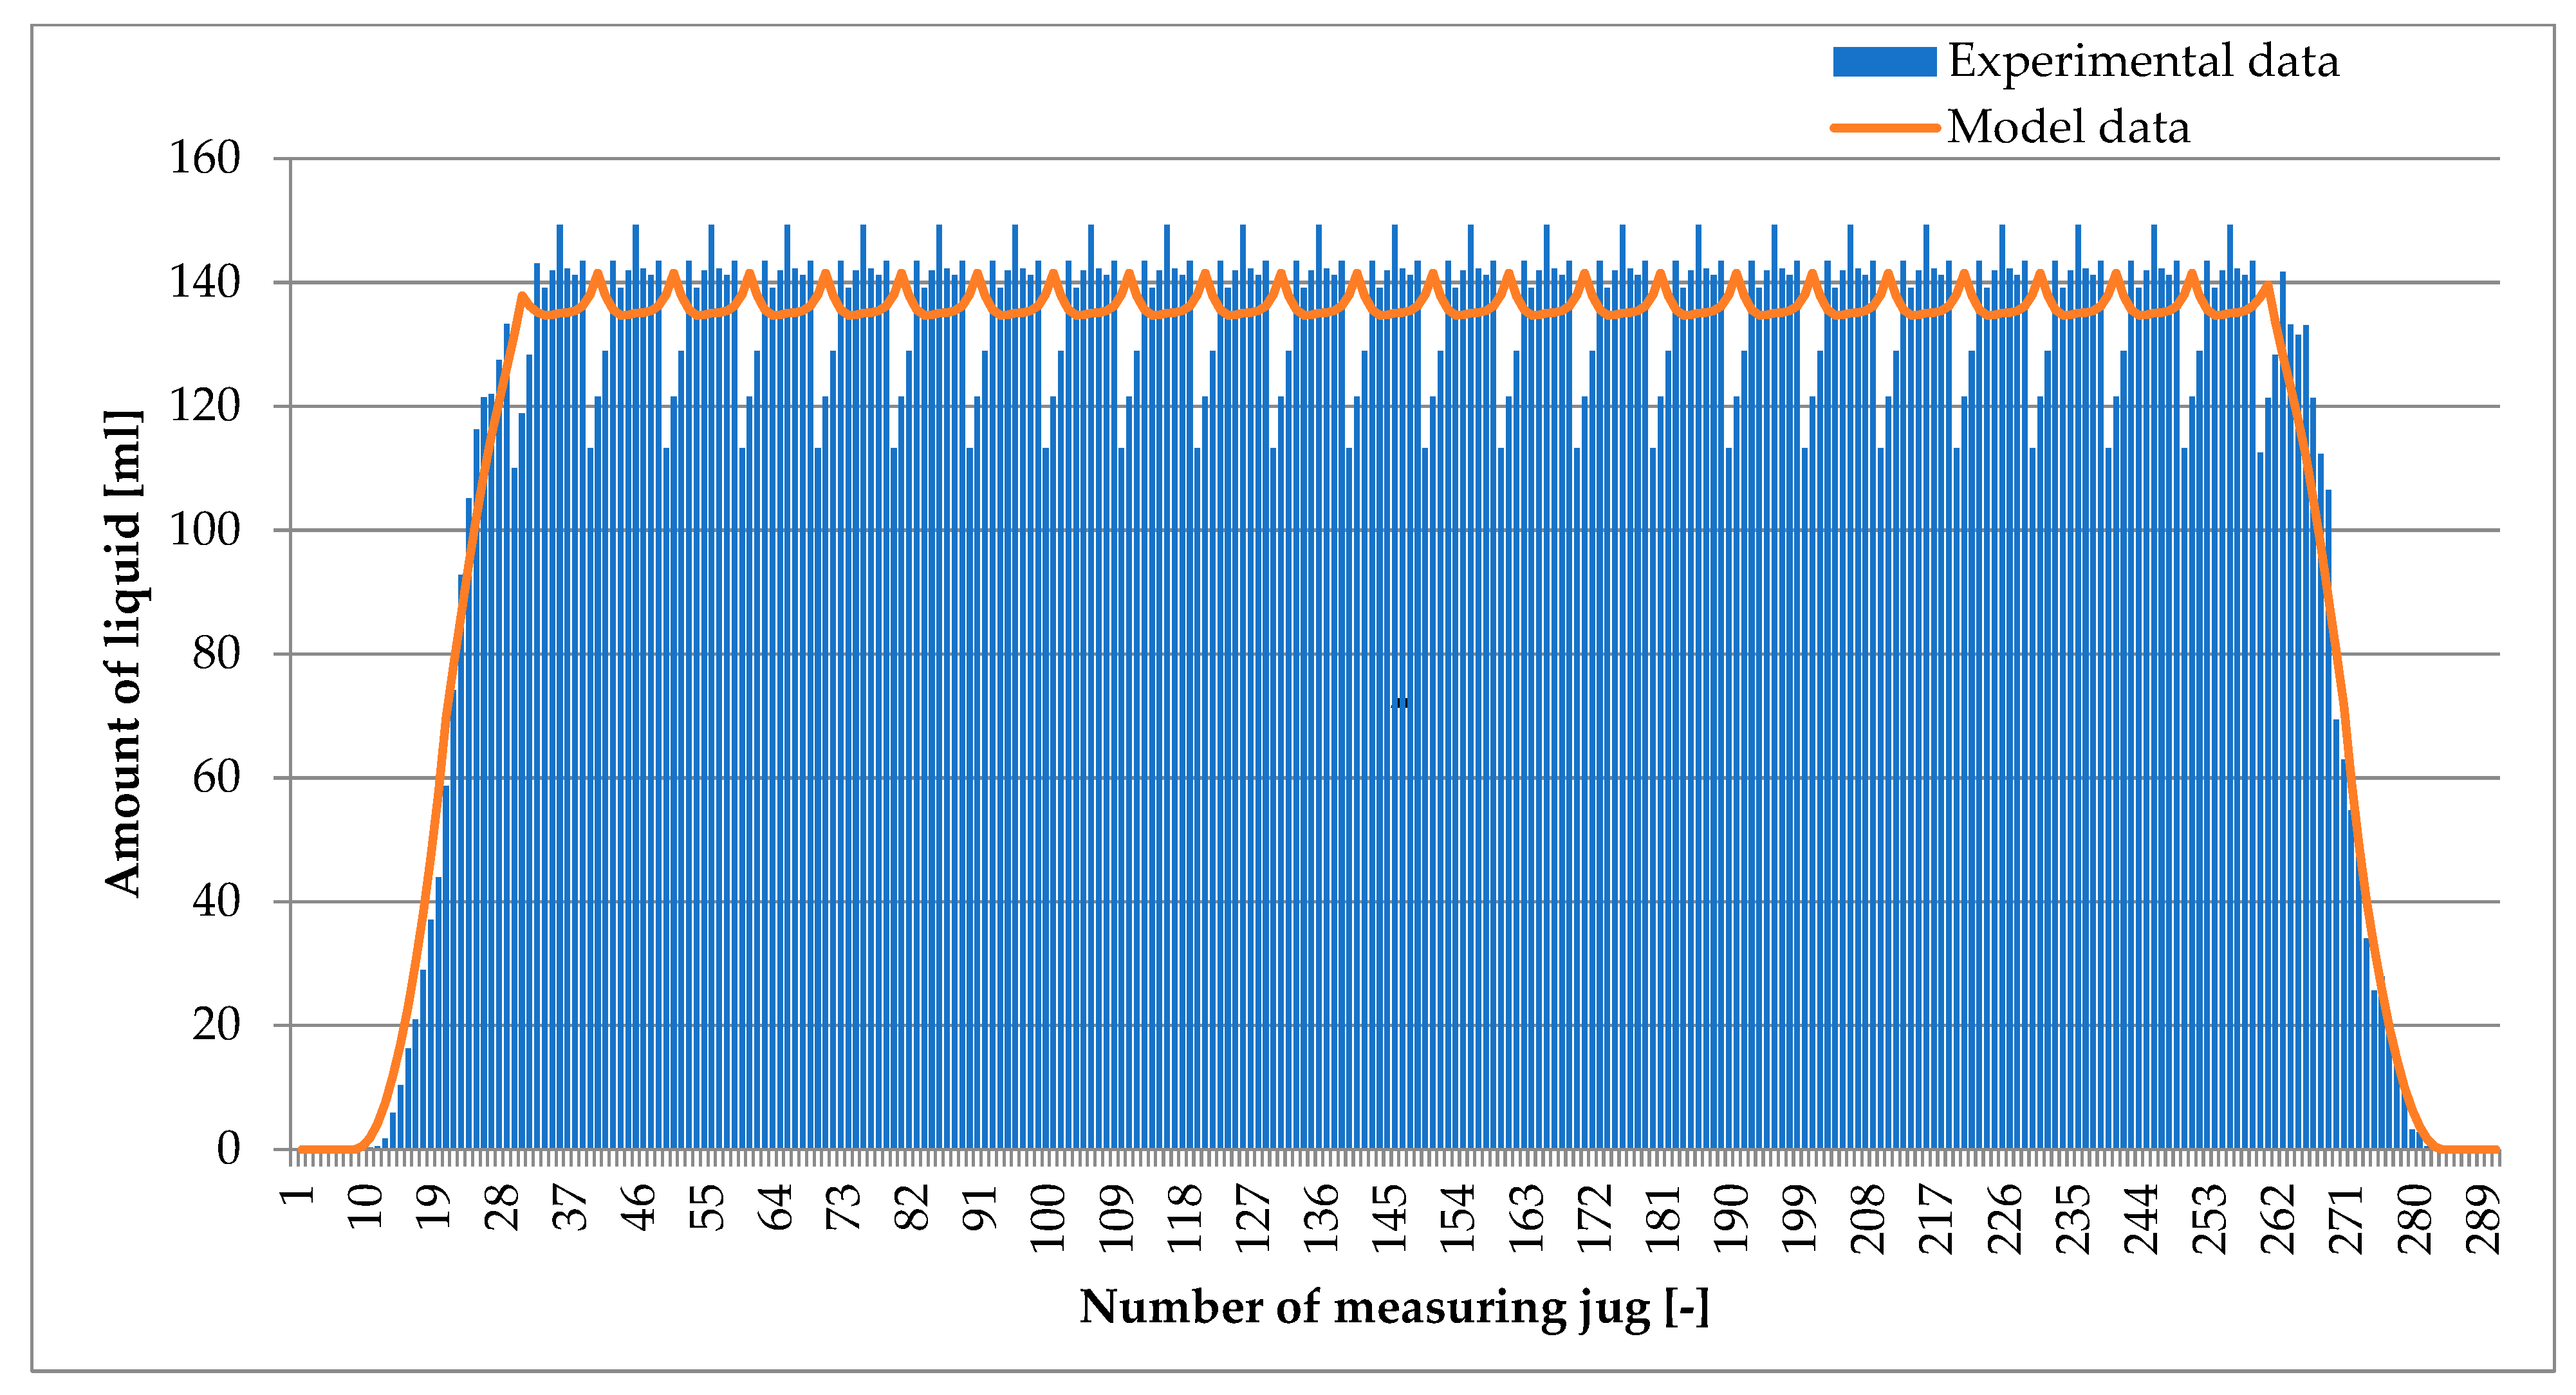
Figure 6.
Spray fallout distribution for the nozzle (CV = 1.490%; CV = 10.000%)—acceptable deviation ranges.
Figure 6.
Spray fallout distribution for the nozzle (CV = 1.490%; CV = 10.000%)—acceptable deviation ranges.


Table 1.
Nozzle characteristics.
| Name of Nozzle | Name of Manufacturer | Type of Nozzle | Flow Rate [L·min−1] | Size of Nozzle | Spray Angle |
|---|---|---|---|---|---|
| XR | TeeJet, Spraying Systems Co. | Standard | 0.8 | 02 | 110° |
| EŻK | MMAT Poland | Air-induction | 0.99 | 025 | 110° |
| RSMM | MMAT Poland | Standard | 1.18 | 03 | 110° |
| AZMM | MMAT Poland | Anti-drift | 1.18 | 03 | 110° |
| IDK | Lechler GMBH | Air-induction | 1.58 | 04 | 120° |
Table 2.
Correlation and determination coefficients of tested nozzles.
| XR | EŻK | RSMM | AZMM | IDK | |
|---|---|---|---|---|---|
| R | 0.957 | 0.953 | 0.978 | 0.983 | 0.964 |
| R2 | 0.915 | 0.908 | 0.956 | 0.966 | 0.930 |
Table 3.
Comparison the parameter values of the optimal model and the simulated limit model.
| a | b | p | q | |
|---|---|---|---|---|
| CV = 1.490% | 0.127 | 0.100 | 2.000 | 1.800 |
| CV = 10.000% | 0.104 | 0.129 | 2.000 | 1.799 |
Disclaimer/Publisher’s Note: The statements, opinions and data contained in all publications are solely those of the individual author(s) and contributor(s) and not of MDPI and/or the editor(s). MDPI and/or the editor(s) disclaim responsibility for any injury to people or property resulting from any ideas, methods, instructions or products referred to in the content. |
© 2023 by the authors. Licensee MDPI, Basel, Switzerland. This article is an open access article distributed under the terms and conditions of the Creative Commons Attribution (CC BY) license (https://creativecommons.org/licenses/by/4.0/).
Share and Cite
MDPI and ACS Style
Cieniawska, B.; Parafiniuk, S.; Kluza, P.A.; Otachel, Z. Matching the Liquid Atomization Model to Experimental Data Obtained from Selected Nozzles. Appl. Sci. 2023, 13, 4433. https://doi.org/10.3390/app13074433
AMA Style
Cieniawska B, Parafiniuk S, Kluza PA, Otachel Z. Matching the Liquid Atomization Model to Experimental Data Obtained from Selected Nozzles. Applied Sciences. 2023; 13(7):4433. https://doi.org/10.3390/app13074433
Chicago/Turabian StyleCieniawska, Beata, Stanisław Parafiniuk, Paweł A. Kluza, and Zdzisław Otachel. 2023. "Matching the Liquid Atomization Model to Experimental Data Obtained from Selected Nozzles" Applied Sciences 13, no. 7: 4433. https://doi.org/10.3390/app13074433
Note that from the first issue of 2016, this journal uses article numbers instead of page numbers. See further details here.