1. Introduction
Regression testing is a critical phase in software development that ensures previously developed and tested software continues to perform as expected after any changes are made to the system. It is performed during the software maintenance phase and consumes a significant amount of time, cost, and effort in an organization’s software development life cycle (SDLC). To minimize these factors, various test case selection, test suite minimization, and test case priority techniques have been developed. One method that has shown promise in minimizing the effort required for regression testing is the use of Unified Modeling Language (UML) models. UML is a standard notation language used for modeling software systems. It offers a graphical representation of software design, making it easier to visualize, document, and communicate software requirements and designs. UML diagrams can be classified into two main categories: structural diagrams and behavioral diagrams. Structural diagrams represent the system’s static structure, while behavioral diagrams represent the system’s dynamic behavior. One of the most commonly used UML behavioral diagrams is the activity diagram, which depicts the system’s activity model. The activity diagram displays the process from one activity to another, providing a high-level view of the system’s behavior. The activity diagram can show a collection of activities carried out by various system elements. The activity diagram is particularly useful in regression testing since it enables testers to verify that the system continues to function as expected after changes have been made.
In regression testing using UML models, the activity diagram is used to identify the critical paths and activities that require testing. By focusing on the most critical paths and activities, testers can minimize the number of test cases required, reducing the overall effort required for regression testing. The activity diagram can also be used to identify the sequence of activities that need to be tested, ensuring that the system’s behavior remains consistent after any changes have been made. Another UML behavioral diagram that can be useful in regression testing is the sequence diagram. The sequence diagram depicts the interactions between the different objects in the system, showing the order in which the objects interact. By using the sequence diagram, testers can verify that the system remains consistent after any changes have been made. They can also ensure that the system’s objects continue to interact as expected, without any unexpected behavior.
One challenge in regression testing using UML models is the need to ensure that the generated code is correct. This requires the UML models to be accurate, complete, and consistent. Any errors or inconsistencies in the UML models can lead to incorrect code generation, resulting in unexpected behavior in the system. To ensure the accuracy, completeness, and consistency of the UML models, various verification and validation techniques can be used, such as consistency checking, model simulation, and model debugging. Regression testing is a crucial phase in software development that ensures previously developed and tested software continues to function as expected after any changes have been made. The use of UML models in regression testing can minimize the effort required by identifying critical paths, activities, and classes that require testing. UML models can also ensure the system’s behavior remains consistent after any changes have been made. However, the accuracy, completeness, and consistency of the UML models must be verified and validated to ensure that the generated code is correct.
We now present here some existing research works on regression testing on various UML models and various case studies.
Pilskalns, Uyan, and Andrews give a detailed description of regression testing on UML designs in [
1]. In this work, they consider that due to the frequent changes in the early stages of the software life-cycle, it is important to have a regression testing approach that can be applied to the UML model. By categorizing design changes and classifying test cases accordingly, a set of guidelines can be established for reusing existing test cases and generating new ones, thus ensuring comprehensive testing of all affected components of the system. Their approach offers a safe and efficient selective retest strategy. Refai et al. in [
2] presented a technique called FLiRTS (Fuzzy Logic-based Regression Testing System) in their work, which is based on UML models. The proposed technique involves the automatic refinement of abstract UML models to create comprehensive models that can identify traceability relationships. The process of refinement involves some degree of uncertainty, which is addressed by using fuzzy logic. The technique classifies test cases as retestable based on the probabilistic correctness associated with the employed refinement. The authors demonstrated the potential of FLiRTS with a simple case study. The technique has the potential to be useful in the development of more efficient and effective regression testing systems.
In the paper [
3], Shin and Lim proposed a new test case prioritization (TCP) method called AVM, which is based on an alternating variable approach, model-based development, and mutation testing. The method involves using various mutation operators as automatic seeding for mutation generation in UML statecharts. The AVM method was compared with conventional TCP approaches such as a greedy algorithm for code coverage or fault exposure potential. The effectiveness of the AVM method was evaluated using the average percentage of fault detection (APFD) as a metric. The authors also performed empirical research to generate model-based TCP results for three real-world challenges in the automobile industry: a power window switch module, a body control module, and a passive entry and start system.
The detection of changes in both syntax and semantics is essential. Arora et al. [
4] have proposed a method that combines UML class diagrams, use cases, and activity diagrams to identify these changes. By comparing the UML models of the original and updated code, the method achieves better change detection and enables more effective test case creation. In addition, the method reduces the average time required for regression testing by employing mobile agents to distribute the testing workload. Yadav and Dutta [
5], presented a design and code-based technique with an evolutionary approach for selecting the most suitable test cases from the test suite. The technique involves using the dependency graph for an intermediate representation of the object-oriented program to identify changes. The selection of test cases is performed at the design level using the UML model. Qu et al. [
6], proposed a method using universal UML to handle various graphical model modifications. To obtain a modified UML graphics module structure, regression testing is required, which is determined by domain of influence analysis on the impact of UML modifications on the generated range of graphical model test cases. In [
7] Gupta et al. examined the creation of test cases for online applications and found a lack of real tools for test case generation. They highlighted the need for an automated regression testing tool to generate test cases directly from user requirements, which would reduce overall effort and cost.
Khalid et al. proposed an automated model for defining a system’s behavior using non-deterministic automata (NFA) and a formal model based on discrete mathematical ideas created using the Vienna Development Method (VDM-SL) to verify the reliability, accuracy, and effectiveness of the E-health system while reducing maintenance and testing costs [
8]. According to Komashine et al. [
9], no common diagrammatic language is used to create improved health service systems based on the academic literature. Ma et al. focused on utilizing UML models, such as use case diagrams, class diagrams, sequence charts, and cooperation diagrams, to meet the daily needs of patient visits and inpatient drug management [
10]. Abdulla et al. [
11], conducted an investigation study on hospital management information systems, including a historical perspective of the system and its stage of evolution, crucial functionalities, stakeholders, components, a three-layer graphics-based model (3LGM), architecture design style, and standard HIS communication. Finally, Rahma et al. emphasized the protection of patient data in the “Hospital Management System” and how it enables quick information processing, reduces bookkeeping, and maintains the accuracy of patient information [
12].
Ma et al. also proposed the use of UML models to develop a Hospital Information System (HIS) that satisfies the requirements of various operations such as patient visits, inpatient care, and drug management. The authors utilized use case diagrams, class diagrams, sequence charts, and collaboration diagrams to create the system. The paper also discusses the challenges encountered while developing the system and provides a future outlook for the HIS system. In another study, Pis¸irgen et al. [
13] proposed a UML-based conceptual model for appointment booking systems that can aid system analysts and developers in improving their system development activities. The authors utilized three UML diagrams to represent the users, their relationships with the system, and the exchange of comments. The proposed model can act as a bridge between developers and coding, thereby simplifying the development of an appointment booking application. Akinode et al. [
14] presented a web-based patient appointment and scheduling system that utilizes Angular JS for the frontend, Ajax framework for handling client-server requests, and Sqlite3 and MYSQL for the backend. The system aims to enhance the delivery of web-based appointment services by increasing efficiency and quality while reducing waiting time. Vasilakis et al. [
15] conducted a survey on the literature on the application of UML tools in healthcare systems. The authors introduced and explained the use of four commonly used UML diagrammatic tools—use case, activity, state, and class diagrams—using a simplified surgical care service as an example. Despite the use of UML tools in modeling various aspects of healthcare systems, the survey revealed a lack of systematic evidence regarding their benefits.
1.1. Motivation and Research Gap
Regression testing is a critical aspect of software development, as it ensures that changes made to software do not impact existing functionality. While there are numerous research articles available on regression testing of UML designs, as discussed in the related works above, the research on regression testing of UML activity flow graphs is relatively limited. Activity flow graphs are an important aspect of UML designs, as they provide a visual representation of the sequence of actions performed by a system. They are particularly useful for documenting the behavior of complex systems, such as those found in enterprise applications. One of the primary motivations for researching regression testing of UML activity flow graphs is the fact that they are more accessible and easier to read and understand than other UML designs. This ease of understanding is particularly important when it comes to software development, as it can help to reduce errors and improve the overall quality of software products. However, without adequate research on regression testing of UML activity flow graphs, it is challenging to ensure that these designs are being tested effectively.
Another motivation for this research is to provide guidance and best practices for software developers and testers. The findings of this research can help to improve the efficiency and effectiveness of regression testing processes, thereby reducing the time and resources required to perform this critical task. The research can also provide insights into the specific challenges and complexities associated with regression testing of UML activity flow graphs, helping to identify areas where additional training and education may be necessary. In addition to providing practical benefits for software development, the research on regression testing of UML activity flow graphs can also have theoretical implications. For example, this research can help to advance our understanding of the underlying principles of regression testing, and how these principles apply to specific types of UML designs. It can also contribute to the development of new theories and frameworks for testing and quality assurance, helping to improve the overall reliability and performance of software systems.
Thus, the motivation behind researching regression testing of UML activity flow graphs is multifaceted, encompassing both practical and theoretical considerations. By filling the gap in knowledge on this important topic, we can help to improve the quality, efficiency, and effectiveness of software development and testing processes, ultimately leading to better software products and better outcomes for businesses and users alike.
It is also important to note that the managerial and economic implications of a UML Activity Flow Graph-based Regression Testing Approach can be significant.
On the managerial side, the approach can help improve software quality by ensuring that changes made to the software during its development cycle do not introduce new errors or problems into the system. This can lead to better customer satisfaction and retention, which can be a key driver of revenue and profitability for software development companies. Additionally, the approach can help reduce the time and effort required to test the software by identifying the specific areas of the system that are affected by changes made to the software. This can lead to more efficient use of resources, which can be a key factor in reducing overall development costs. On the economic side, the approach can help companies reduce the risk of project failure or delays by identifying issues early in the development cycle. This can help avoid costly rework and delays in the software release schedule, which can impact revenue and profitability.
Overall, a UML Activity Flow Graph-based Regression Testing Approach can have important implications for both the managerial and economic aspects of software development projects and can help companies achieve their goals of delivering high-quality software products on time and within budget.
1.2. Contributions and Organization
Although there is a significant amount of research available on the regression testing of UML designs, such as use case diagrams, class diagrams, and collaboration diagrams, there is comparatively less research on the regression testing of UML activity flow graphs. These graphs are critical in the analysis and design of software systems as they provide a pictorial representation of the workflow or logic of a system. As a result, there is a need for further investigation and development of regression testing techniques specific to UML activity flow graphs to ensure the reliability and effectiveness of software systems which we try to attempt to study in this paper. The main contributions of this paper are as follows:
In
Section 2, we describe our regression testing approach to UML diagrams. We first formally define sequence and activity diagrams and show how these definitions show a relationship between them. Then we show how to construct the corresponding activity flow graphs which are then used to construct our regression testing algorithm.
In
Section 3, we show our approach to the technique of classifying the test cases which is the fundamental block of constructing the regression testing algorithm.
In
Section 4, we consider the hospital management system as our test case. Since the UML models of hospital management systems are generally not available publicly, we design a custom hospital management system website and test our algorithm on it.
2. Our Testing Approach
This paper employs UML 2.0 activity and sequence diagrams to design the system. The corresponding activity flow graph is utilized to identify and classify test cases as well as changes in the software. Additionally, the activity flow graph is used to generate new test cases. The activity diagram is first linked with the sequence diagrams, and then the paper demonstrates how the activity diagram can be associated with the corresponding activity flow graph.
2.1. Regression Testing
The selective retest approach for regression testing was provided by Rothermel and Harrold [
16]. They state that their strategy is to find a solution to the following problem:
Let P be a program, and P′ be a modified version of P created by replacing or modifying some components of the program P. Let T be a set of test cases already run on P. Find a way of making use of T, to gain sufficient confidence in the correctness of P′.
With T being the original test suite, the approach to solving this problem outlined by Rothermel and Harrold is as follows:
- 1.
Create a mapping from P′ to P to identify the changes made to P
- 2.
Use the identified changes of Step 1 to construct a set T′ ⊆ T
- 3.
Test P′ using T′
- 4.
Based on the criteria of test adequacy, check if any parts of the new program have not been tested yet and generate a new set of tests T″
- 5.
Test the software using T″
2.2. Associating UML Sequence Diagrams and Activity Diagrams
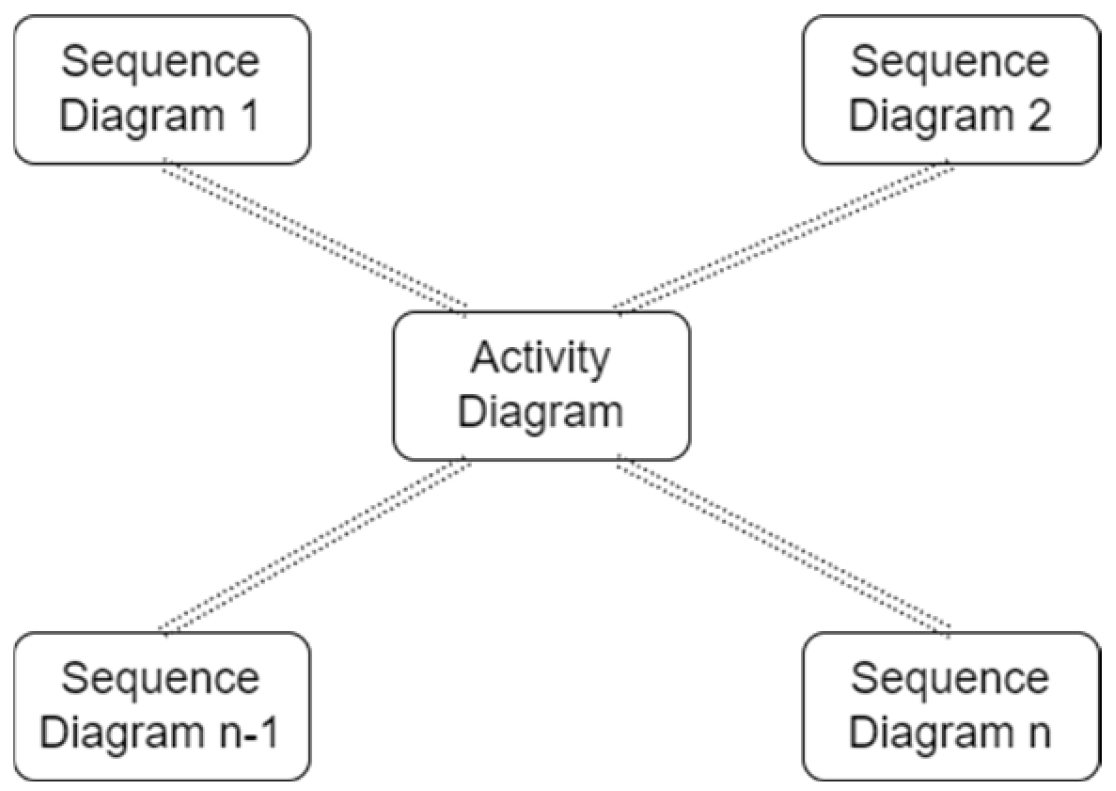
In this section, we present a method to associate activity and sequence diagrams for workflow modeling, which will enhance our ability to generate test cases from activity models. The approach is based on the concept that activity diagrams represent all control and data flows, while sequence diagrams represent method invocations or inter-object communication. Specifically, for each activity in an activity diagram, a sequence diagram can be utilized to provide a detailed explanation. This association between sequence and activity diagrams allows us to easily add more information to the activity diagram.
Figure 1 depicts an example of this association, where multiple sequence diagrams are linked to a single activity diagram. The association between multiple sequence diagrams and a single activity diagram is typically established through the use of activity partitions. An activity partition is a vertical region within an activity diagram that represents a specific element or component of the system. Each sequence diagram is linked to a specific activity partition within the activity diagram, indicating that the interactions depicted in the sequence diagram are related to the activities taking place within that partition. For example, consider a system for processing customer orders. An activity diagram for this system might include partitions for receiving the order, verifying payment, and shipping the order. Multiple sequence diagrams could be created to show the interactions between the customer, the order processing system, and the payment processing system. Each sequence diagram would be associated with the appropriate activity partition within the activity diagram, providing a detailed view of how each interaction fits into the overall process. The association between sequence diagrams and activity diagrams in this way can be very useful for understanding the behavior of a system, particularly in complex systems with many interacting components. It can help developers to identify potential issues or inefficiencies in the system, and can also be used to validate the design of the system and ensure that it meets the requirements of the stakeholders. In this process, each activity node in the activity diagram generates a method declaration and a series of method calls, which define the method.
In this section, we provide a formal definition of activity diagrams and sequence diagrams and clarify their connection. We explain which elements of activity diagrams and sequence diagrams are relevant for workflow modeling and collaboration modeling, respectively. This definition will help us better understand the relationship between activity diagrams and sequence diagrams and their roles in the software development process.
2.2.1. Formal Definition of Sequence Diagram
Sequence diagrams, or
SD, are tuples. It consists of a collection of objects and their interactions. The communication takes place through message passing. According to Li [
17], a message has four main parts: an action, a sender or sender’s obi, a receiver or receiver’s obj, and the order in which the message is delivered. There are five different types of actions that can be taken: synchronous message, asynchronous message, return, create, and destroy.
Definition 1 (Sequence Diagram). A sequence diagram, SD = {o, m}, is a tuple, where:
- 1.
o = {x|x is an object/actor}
- 2.
m = {m|m is a message}.
2.2.2. Formal Definition of Activity Diagram
An activity diagram is a graphical representation of a process, where nodes are connected by edges to show the flow of control and information. This type of diagram is commonly used in software modeling and can be associated with various modeling elements such as Use Cases, Classes, Interfaces, and Collaborations. Tokens, which represent control or information values, move along the edges from the source node to the sink nodes based on actions and conditions. Activity diagrams consist of two types of modeling elements: activity nodes and activity edges.
Activity nodes are classified into three types: action nodes, control nodes, and object nodes. Action nodes take input data and control tokens, create new tokens, and transmit them to output activity edges when they are ready. Control nodes route tokens through the graph and have components for decision-making, splitting or merging the flow for parallel processing, and so on. Object nodes give and take data tokens and can also act as buffers, collecting tokens while waiting to go downstream.
Activity edges are classified into two types: control flow edges and object flow edges. Control flow edges depict the flow of control throughout the activity, while object flow edges depict the movement of items during the activity. This article focuses on the data and control flow of activity diagrams, both of which are critical for test generation.
Definition 2 (Activity Diagram). An activity diagram is defined as a 6-tuple,
- 1.
As = as1, as2,⋯, asm, represents a set of activity states
- 2.
Tc = tc1, tc2,⋯, tcn represents a set of completion transitions
- 3.
Cg = cg1, cg2,⋯, cgn denotes a set of guard conditions
- 4.
Ci corresponds to the transition ti
- 5.
F = (ai, tj, cgk) or (tj, cgk, ai)∣ tj∈ Tc, ai∈ As, cgk∈ Cg represents the flow relationship between transitions and activity states
- 6.
aS∈ As is the starting activity state
- 7.
aE∈ As is the ending activity state
- 8.
(aS, t), (t, aS), (aE, t)∈ F for only one transition t.
In more detail, As is a finite set of activity states, and Tc is a finite set of completion transitions. Cg is a set of guard conditions where Ci corresponds to transition ti in Tc. F is a set of flow relationships between transitions and activity states, where an element in F can be either (ai, tj, cgk) or (tj, cgk, ai) depending on the direction of flow.
2.3. Transforming Activity Diagrams to Activity Flow Graphs
This subsection outlines the process of converting an activity diagram into an activity flow graph (AFG). The following steps are involved in this conversion:
Navigate the activity diagram from start to finish, identifying options, conditions, concurrent executions, and loop statements.
Create an entry in the Control Flow Activity Mapping Table (CFAMT) for each conditional statement encountered during the traversal of the activity diagram.
Create nodes in the AFG based on the entries in the CFAMT.
Convert loop statements into conditional statements in the CFAMT.
Create an entry in the CFAMT for each statement with concurrent execution and represent the different execution paths in the AFG.
2.4. UML Testing Approach
To better understand regression testing for UML designs, it is important to first briefly discuss the UML testing technique. This technique involves creating an integrated model using class diagrams, sequence diagrams, and activity diagrams as the foundation for testing UML designs. An activity diagram provides a visual representation of the system’s activities and the sequence in which they occur. By examining the diagram, testers can identify the different scenarios that the system may encounter during its operation. To generate regression test cases from an activity diagram, testers must first analyze the diagram to identify the possible paths the system may take. Testers should examine the different actions that occur during each step and determine the inputs and outputs that the system produces. They should also consider any conditional statements or loops that may affect the system’s behavior. Once testers have identified the possible paths and actions, they can begin creating test cases. Each test case should target a specific path or action and should include the necessary inputs to trigger that action. Testers should also specify the expected outputs for each test case. To ensure thorough testing, testers should create test cases that cover all possible paths through the activity diagram. They should also consider any error conditions that may arise and create test cases to verify that the system handles these conditions properly. After creating the test cases, testers can execute them to verify that the system behaves as expected. They should record the results of each test case and any defects that are discovered. Any defects should be reported to the development team, who can then fix the issues and rerun the regression test cases to verify that the fixes have been successful.
Creating an activity diagram from a sequence diagram is the first step. The activity diagram is mapped to an activity flow graph (AFG) in the second step. To create the Activity Flow Graph (AFG), the vertices and arcs of a directed acyclic graph are mapped from the object and sequence method calls present in an Activity Diagram. The relationships in the Sequence Diagram and the Activity Diagrams are preserved by the mapping between them. The mapping process entails two steps: (1) linking activity diagram methods to the objects from which they originated, and (2) traversing the diagram to map subsequent method executions to its edges. These edges are also marked with any restrictions that the Activity Diagram might place on how they should be used. Combining each AFG with the various pieces of information is the third step. A modified Activity Flow Graph is the result of this (AFG). The integrated model that unifies Activity Diagrams and Sequence Diagrams I now represented by the AFG.
For every test case, T, in an activity diagram, AD, we can construct a corresponding path, PT as an execution path from the starting activity state to the end activity state consisting of activities and transitions, i.e., ∀T ∈ T[x], PT = as1 → tc1 → as2 → tc2 → ⋯ → tcm → asm, where ai ∈ As, t ∈ T[x], as1 is the initial state and asm is the final state. The collection of test cases is T[x] and with every test case in T[x] there is a corresponding path PT. To navigate the AFG, values from the test cases are used (symbolic execution). We can now formally define the test case which will be used to identify and classify existing test cases and generate new test cases.
Definition 3 (Test Cases). A test case T in a UML diagram is a set of attributes satisfying certain conditions for the vertices of the PT in the AFG.
2.5. UML Regression Testing
In order to address the issues that arise in regression testing of UML designs, we pose three research questions and follow the approach to regression testing as defined by Rothermel and Harrold:
- 1.
Firstly, we try to determine if it is possible to distinguish and categorize modifications made to various iterations of a UML design.
- 2.
Secondly, we explore the feasibility of utilizing these changes for selecting test cases in a secure and efficient manner for regression testing purposes.
- 3.
Lastly, we investigate the feasibility of identifying the areas in a UML design that require new test cases for test generation.
To address the aforementioned research questions, we adopt the regression testing approach proposed by Rothermel and Harrold. To detect modifications made to distinct versions of a UML design, we employ the approach developed by Briand et al. [
18].
In the context of regression testing for UML designs, we formulate the following problem inspired by Rothermel and Harrold’s approach to retesting:
Given software So, a test set T (used to test So), and a modified version of So, Sm. Determine a strategy for utilizing the test set T to obtain a satisfactory level of confidence in the accuracy of Sm.
Following the approach described by Rothermel and Harrold, we outline our approach to solve this problem as follows:
- 1.
Create a mapping from So to Sm to identify the changes. We denote these changes by ρ. Then classify the tests into mutually exclusive sets: Reusable (Ut), Retestable (Rt), or Obselete (Ot)
- 2.
Using the results obtained from Step 1 construct a set of retestable tests R′t⊆ Rt, which may reveal changes in Sm.
- 3.
Test Sm using R′t.
- 4.
Generate a new set of tests T′ if it is identified that certain parts of the software are not tested adequately.
- 5.
Test the software Sm using T′.
Our methodology for regression testing is based on the definition of a UML test case T. In UML test cases, conditions are assigned values to enable traversal of a path PT consisting of vertices v1,…, vn in the AFG. Each vertex vi is associated with a condition, ci(vl1,…, vlm), which is a Boolean function taking (vl1,…, vlm) as arguments. The function guards the edge (vi, vj) in the AFG. The values (vl1,…, vlm) must satisfy the requirements along the path PT in order to traverse the edge. Simple conditional statements are always true for vertices without explicit conditions, such as a vertex with a single edge leaving it. The execution of the test case traverses a path in the AFG.
2.6. Normalizing Original Data
It is important to note that the original data used in a given analysis may exhibit varying scales. For example, in a banking dataset, the input variables “Staff” and “Deposit” may be denoted in different scales, such as “Person” and “Dollars”, respectively. In such cases, it is prudent to consider that results obtained from the proposed approaches may not be deemed acceptable from a managerial and economic standpoint.
In order to mitigate these issues, it is recommended that the users first normalize the original data using an appropriate normalization technique, before using the normalized data in their proposed approaches to obtain results corresponding to the normalized data. Subsequently, these results should be converted back to the original data scale in order to make them meaningful and interpretable to end-users.
Normalization is a process of transforming the original data into a common scale so that it can be analyzed and compared accurately. The normalization process typically involves scaling the data to have zero mean and unit variance, or to be within a specific range (e.g., 0 to 1). Here’s a general overview of how to normalize data for UML-based regression testing, and then convert the results back to the original data:
- 1.
Determine the normalization method: Choose a normalization method that is appropriate for your data and analysis. Some common normalization methods include Min-Max scaling, Z-score scaling, and Robust scaling.
- 2.
Normalize the data: Apply the chosen normalization method to the original data. This can typically be conducted using a library in your programming language of choice. For example, in Python, you can use the MinMaxScaler class from the sklearn. preprocessing module to scale the data to the range [0, 1].
- 3.
Generate test cases based on the normalized data: Use the normalized data to generate test cases for the UML regression testing approach described in the following sections.
- 4.
Execute the test cases on the normalized data: Use the generated test cases to perform UML-based regression testing on the normalized data. This involves running the test cases on the UML model to ensure that it still behaves as expected.
- 5.
Convert the results back to the original data scale: After performing the regression testing on the normalized data, we must convert the results back to the original data scale to make them meaningful to the end-users. To do this, use the inverse of the normalization method applied earlier. For example, if we had used Min-Max scaling, we would multiply the results by the range of the original data and add the minimum.
We provide here a Python pseudocode example of how to normalize the data, generate test cases based on the normalized data, perform regression testing on the normalized data, and convert the results back to the original data:
Note that this is just a pseudocode and may need to be modified to fit the specific requirements of your UML designs.
3. Identifying the Changes in Software Design and Classifying Test Cases
We focus on the UML designs consisting of Sequence Diagrams, Activity diagrams, and Activity flow graphs. Our approach addresses the challenges of accommodating potential changes that may occur within these diagrams by examining the fundamental building blocks of Sequence Diagrams. The Sequence Diagram contains objects, lifelines, conditions, and messages. The Activity diagrams consist of states, transitions, and conditions. The modification, addition, or removal of any of these elements may impact the software’s behavior.
To handle the complexity of software design changes, our method establishes a significant set of rules for categorizing modifications. Due to the undecidable nature of discovering all executed paths and determining their alterations with changing designs, we require a finite number of paths in a directed graph. Changes in design elements in software can be classified as adding, deleting, or modifying. We partition all changes into two groups based on their effect on paths: non-path design changes (NC) and path design changes (PC). NS, MS, and DS include all changes made, modified, and deleted, respectively.
Design changes can be classified as create, modify, or delete operations, along with either a path change (PC or NC). The type of change, such as “create” (ρc), “modify” (ρm), or “delete” (ρd), can usually be identified from its title. However, determining whether a change affects a path is more complex. Depending on how an element is used in the Sequence Diagram, a change to that element may or may not impact a path. For example, a class can be instantiated or used in a condition but not in a sequence diagram. This categorization helps to identify which nodes in the graph influence restability and obsolescence for test cases that contain these nodes in their execution paths.
3.1. Classifying Test Cases
Graph paths are connected to test cases and design changes via the vertices connected to particular design change vertices. The test cases,
T, linked to a path
PT are also impacted by design changes. We introduce the software change difference function
δρ(
T) to describe this relationship. The set of vertices connected to a change,
δρ, in the software is denoted by
ρ. The difference function is then defined as follows:
The difference function,
δρ, takes the test case
T as an argument. If a vertex in the test case-related path
PT is affected by a change
ρ in the software, the function returns a 1; otherwise, it returns a 0. To identify the test cases impacted by
ρ, we use the difference function. By comparing the vertices impacted by the change to the paths connected to a test case, the function then identifies affected test cases. Algorithm 1 describes the difference function.
| Algorithm 1 The Difference Function (δρ(T)) for a change ρ of a test case T |
| Input: The test case T and its path in the graph PT |
| l = len(PT); for i ← 1,…, l do |
 |
| end |
| return 0; |
Consider we have two software, So be the original and Sm be modified. The modifications (or changes ρ) between these two software possibly are either “create” (ρc) or “modify” (ρm) or “delete” (ρd). We have already created sets of vertices named NS, MS, and DS corresponding to the changes that create, modify or delete elements of the UML model. All the changes made between So and Sm due to “create”, i.e., ρc, are added to the set NS, all “modify” changes, i.e., ρm, are added to the set NM, and all the “delete” changes, i.e., ρd, are added to the set ND. It is easy to see that all these vertices represent a change ρ, and it will either affect the test path PT or will not affect the test path. Those changes which will affect the test path will be included in the set PCS and those changes which do not affect the path will be included in the set NCS.
Once this classification of the vertices has been made, we can now classify the test cases into three mutually exclusive sets: Reusable (Ut), Retestable (Rt), or Obsolete (Ot).
3.1.1. Obsolete Test Cases (Ot)
Obsolete test cases are addressed in the first rule. Test cases that are outdated, such as those where the input signature does not match the conditions in the design, are referred to as obsolete test cases. The attribute values and types connected to a test case are what we refer to as the input signature.
A test case (T) is dependent on the path (PT) linked to it, as is clear from the definition of a test case. Therefore, the old test cases are no longer valid if a change ρ causes to alter a path by changing an element because the test case’s signature might no longer correspond to the design’s structure. To be safe, we estimate the number of test cases that have been rendered obsolete by assuming that all modified test case signatures are useless. New test cases must be created in order to accomplish this. The next section talks about creating new cases.
There may be new, modified, or deleted paths in the
graph if
ρc,
ρm, or
ρd is a member of the
PCS. Therefore, it is recommended that we disregard any test cases that incorporate design modifications that are present in both the
MS and the
PCS. These conditions can be summed up as follows:
The other thing to note here is that a similar analogue can be provided for those test case paths whose elements were affected by the change
ρd. This means that the test case has a test case signature that is no longer valid since an element has been removed. These conditions can be summed up as follows:
Combining the above two expressions we have
As a result, it is necessary to create new test cases because it is safe to assume that any test cases that traverse changes (difference function) and are in the
PCS are no longer valid. Therefore, the set of obsolete test cases is defined as follows:
3.1.2. Retestable Test Cases (Rt)
The second rule addresses the retestable test cases. The test cases that can be used to retest the design are called retestable test cases. A test case, T, is retestable if a design change, ρ, is in the path i.e., δρ(T) = 1, but does not change the path. When a method, for instance, adds a new parameter, the path of a test case is unaffected. Thus, it is easy to see that the first condition of these tests satisfies that it belongs to the set of non-path change, i.e., it is an element of the set NCS. Now let us discuss the effects of the changes in the sets NS i.e., ρc, MS i.e., ρm, and the DS i.e., ρd.
If a change belongs to the set
NS and it does not alter the path
PT of the test case
T, then it will belong to the set of retestable tests. The condition of it being an element of
NCS should always satisfy. Thus, we have
If a change belongs to the set
MS and it does not alter the path
PT of the test case
T, then it will belong to the set of retestable tests. The condition of it being an element of
NCS should always satisfy. Thus, we have
Similarly, if a change belongs to the set
DS and it does not alter the path
PT of the test case
T, then it will belong to the set of retestable tests. The condition of it being an element of
NCS should always satisfy. Thus, we have
Therefore, all test cases that traverse changes, which are members of the NCS set, should be classified as retestable.
3.1.3. Reusable Test Cases (Ut)
All test cases that have not been labeled as outdated or retestable should be regarded as reusable. Reusable test cases are saved for potential future use and are not used during the subsequent round of testing. It should however be noted that an obsolete classification takes precedence over the other two classifications if a test case travels through multiple changes. Similarly, a reusable classification is superseded by a retestable. Thus, in the priority list, reusable classification has the least priority.
3.1.4. Algorithm to Classify Test Cases
When all the above techniques for classifying test cases are combined, a classifying algorithm is created. Given a software design
So and a test suite
To for
So and a modified software
Sm, Algorithm 2 describes the procedure for classifying the test cases for testing a UML design of the software. This procedure makes use of “change tables”, “change categories”, and classification rules. In our algorithm, we make use of arrays as bit vectors for implementation in practice. The entry
i in the array is 1 if there exists a change
ρ which affects a vertex
vi. We also have arrays as bit vectors for the sets
NS,
MS,
DS,
PC, and
NC. Any vertex
vi is a member of these arrays if element
i = 1. Implementation using arrays and bit vectors makes it easier to compute the retestable, reusable, and obsolete test cases.
| Algorithm 2 Classifying Test Cases |
Input: An array of test cases T[x], An array of the changes in the software ρ[y]
Output: Classified test cases Ot, Rt, and Ut
Ot ← empty list;
Rt ← empty list;
Ut ← empty list; |
 |
| end |
3.1.5. Generating New Tests
In this section, we use a modified version of Graph
G′ corresponding to the modified software
Sm. The current test cases do not cover every change, necessitating the creation of new test cases. This might be the result of test cases never traveling the new design paths or test cases being deemed obsolete. Because the change changed a path, a test case is no longer valid. A number of new tests must be developed to replace each outdated test. Finding the intersection of the
PC and the
NS (in
G′) and the
PC and the
MS (in
G′) will allow us to create test cases. This can be described as
It is easy to see that those changes that necessitate new path generation are identified by the set
NewT. By definition, every change in the graph
G′ must be situated in a vertex. All of the conditions from the test case, if it is a part of the
MS, leading to the vertex and including the vertex are put in a set to test the change. We conduct a search to find all paths leading to the vertex if the change is a component of the
NS. The search’s conditions
c0,…,
ci are added to a
NewCT set that creates test cases. We employ the depth-first search method similar to that of [
19] for each member of the
NewCT set. The corresponding algorithm is described in Algorithm 3.
| Algorithm 3 Generating new test cases for regression testing of UML models |
Input: NewCT,NS, MS, and G′
Output: A set of test cases test_cases
CondT ← empty set; |
 |
This algorithm assumes that the get_conditions_leading_to_vertex function returns a set of conditions that lead to the given vertex and that the find_paths_leading_to_vertex function returns a list of all paths leading to the vertex. The get_conditions_from_path function would return the conditions along a given path, and the generate_test_cases_from_NewCT function would use the conditions in the CondT set to generate new test cases.
3.1.6. Safety and Complexity
In order to ensure the security of our method, we need to select tests from the initial test set that have the potential to identify bugs in the modified program. Our test case selection procedure is based on categorizing changes in a directed graph. We use the delta function to identify changes in the directed graph, and then connect them to a path. This path outlines how the modifications impact testing, and enables us to confidently choose a regression test suite. Rothermel [
17] has demonstrated that the control flow graph, which is a more complex model that contains cycles, is also reliable.
A test selection method must be efficient in order to be effective, as it should be quicker than repeating the entire set of tests. The performance of Algorithm 2 is dependent on the number of test cases, x, and design changes, y. Therefore, the algorithm has a complexity of (xy). In contrast, repeating all tests would have a runtime of (n log(n)). This method works best when the number of changes is small in comparison to the total number of test cases.


