Article

Application of Response Surface Methodology to Optimize the Extraction Process of Bioactive Compounds Obtained from Coffee Silverskin

by
Rita Brzezińska
*,
Magdalena Wirkowska-Wojdyła
*,
Iga Piasecka
and
Agata Górska
Department of Chemistry, Institute of Food Science, Warsaw University of Life Sciences, Nowoursynowska St. 159c, 02-787 Warsaw, Poland
*
Authors to whom correspondence should be addressed.
Appl. Sci. 2023, 13(9), 5388; https://doi.org/10.3390/app13095388
Submission received: 21 March 2023 / Revised: 12 April 2023 / Accepted: 21 April 2023 / Published: 26 April 2023

Abstract

:

Featured Application

Coffee by-products, especially coffee silverskin can be recognized as an valuable plant source abundant of antioxidant bioactive compounds. Further experimental investigations will need to be carried out to assess the possibility of the implementation of coffee silverskin raw material or ethanolic extracts in liquid or powdered form as an ingredient of functional food products or biodegradable materials applied in the food industry chain, what is in agreement with EU politics of circular economy concept and sustainable development.

Abstract

The present research focused on the extraction optimization of bioactive compounds from coffee silverskin (CS), a by-product generated in large amounts worldwide during the coffee roasting process. The effect of the different extraction conditions has been investigated by the exploitation of the response surface methodology (RSM). The antioxidant activity assays, such as ABTS and FRAP, total phenolics content (TPC), browning index (BI), and chromatographic analysis of caffeine and chlorogenic acids contents have been performed to evaluate the CS extracts characteristics. The most favorable extraction conditions on the maximum recovery of antioxidant bioactive compounds were found to be as follows: 50% aqueous solution of ethanol (v/v) in solvent solid ratio of 45 mL/g CS, during 30 min at 60 °C. The CS extract prepared in this extraction variant reached the values for ABTS, FRAP, TPC, and BI approximately 101.6 µmol Trolox/g d.m. CS, 132.3 µmol Fe (II)/g d.m. CS, 52.3 µmol GAE (gallic acid equivalent) per g d.m. CS, and 0.3, respectively. Additionally, this extract is rich in caffeine (6 mg/g d.m. CS) and chlorogenic acids (0.22 mg/g d.m. CS). In conclusion, this research demonstrates that CS could be considered as a valuable by-product of bioactive compounds with potential applications in the food industry.

1. Introduction

Coffee is one of the most globally consumed agricultural and functional food commodities [1,2]. Coffee beans are produced from the cherries of the plant Coffea L. and only two species—namely, Coffea arabica and Coffea canephora—are commercially applied worldwide. Roasted coffee beans are commonly used for the preparation of beverages [3,4]. According to the latest statistics of the International Coffee Organization (ICO), a gradual increase in global coffee production and consumption has been observed every year [5,6]. Annual global coffee production reaches around 10 million tons [7]. Considering the fact that silverskin represents approximately 4% of coffee beans [8], about 400,000 tons of this waste is generated each year.
Due to the aforementioned facts and also to satisfy the tremendous consumers coffee product demand, coffee industries are forced to process an enormous quantity of coffee fruit raw material, leading to the generation of a notable amount of coffee by-products not completely utilized and hence a potential hazard pollution to the environmental if incorrectly discharged [9,10].
To overcome ever-growing problems associated with plant waste accumulation and environmental degradation, circular economy conception (CEC) was brought to life [11,12]. It seems nowadays that CEC is gaining urgent attention not only in the food industry, but also in the scientific and political community [13,14,15,16]. Contrary to the traditional linear economy model, CEC focuses on several courses of action for the renewable energy sources and systems, extending the agroindustry product life cycle and recycling plant waste materials [17,18]. Therefore, the fulfillment of the requirements of CEC will require food manufacturers and scientific researchers to implement efficient and environmentally friendly technologies and investigations of managing plant by-products [19,20,21,22,23]. Both surroundings should cooperate with each other and confront the significant challenges related to the possibility of reutilization of plant waste materials, especially the most exchanged coffee by-products throughout the globe, such as spent coffee grounds and coffee silverskin [4,18,24,25,26]. The coffee silverskin (CS), known as a thin outer tegument tightly adhering to the green coffee beans, is the only by-product released during the coffee roasting process. Consequently, significant amounts of this coffee waste are generated by roasters in coffee-consuming countries [27]. It is currently suggested that coffee silverskin, being an outer cover of coffee beans, may contain almost identical classes of organic compounds comprising polyphenols (phenolic acids, flavonoids, tannins, lignans), methylxanthines, melanoidins, and other essential chemical components shared with coffee beans [4,28]. These bioactive compounds present in coffee and its by-products, especially polyphenols, have been of particular interest due to their multiple biological effects, including their strong antioxidant properties, which provide enormous benefits related with human health [28,29,30]. In addition, phenolic compounds exhibit the possibility of the improvement of the organoleptic properties of many types of foodstuff of plant origin, and they are increasingly recognized not only as natural preservatives against food spoilage, but also valuable ingredients used in the development of the functional food sector [30,31,32]. Presently, there is a significance trend towards the limited use of synthetic preservatives such as butylated hydroxytoluene (BHT) and butylated hydroxyanisole (BHA), which are suspected of having potentially harmful effects on human health interrelated hepatomegaly, increased activity of liver microsomal enzymes and their transformation during digestion into toxic or carcinogenic derivatives, especially when present in large amounts [33,34]. In this sense, it should be mandatory to build up the efficient and environmentally friendly utilization method of isolating bioactive antioxidant compounds from coffee silverskin.
The great variety of methods can be applied for recovering bioactive antioxidant compounds from plant natural resources and their by-products, which include conventional extraction techniques such as liquid–liquid and solid–liquid extraction methods, as well as non-conventional extraction techniques [35,36]. Among these extraction methods, solid–liquid extraction is still widely employed to recover different groups of bioactive antioxidant compounds. This extraction method is based on mixing fragments of solid plant matrix with various organic solvents, both polar and non-polar or their aqueous solutions, and holding the resulting mixture for a desired time, which is needed to start the process of dissolving particles of a solid plant matrix by the used solvent. However, the effectiveness and efficiency of the solid–liquid extraction method, and in consequence a commercial applicability of the extraction process in this system, may be affected by several operational parameters, including the type of used solvent and its concentration, the solid-to-liquid ratio, extraction time and temperature, pH, agitation speed, particle size of the used plant food matrix, and the number of extraction steps [37,38]. For these reasons, finding the appropriate conditions for the best output for an extracting process of bioactive antioxidant compounds is the main purpose of optimization, which can be achieved by using the traditional approach. This approach involves monitoring the effect of one independent process variable on the response whilst other variables remain at constant level. It does not consider the interactions between variables, which leads to an incomplete understanding of the bioactive antioxidant compounds extracting process. The traditional form of optimizing the extraction process requires conducting of numerous experiments that result in their unprofitable time and financial management [39,40]. Considering these limitations of traditional optimization approach, multivariate statistical optimization techniques such as response surface methodology (RSM) should be employed for modeling and optimizing the extraction process of bioactive antioxidant compounds [41]. The exploitation of RSM, introduced by Box and Wilson [42], as a statistical and mathematical optimization tool needs to be carried out via several stages, which comprise: screening of independent process variables and their adequate ranges, selection of experimental design and performance of real experiments, generation of regression model equations, verification of model adequacy, graphical representation of the obtained model, and determination of optimal process conditions. By a designation of mathematical models based on the quantitative data of the used analysis responses, RSM allows the significance of independent process variables to be evaluated while minimizing the number of assays performed during extraction process optimization. Moreover, this technique can identify the interrelationship between applied variables and determine the optimum conditions for the operational extraction variables [41,43,44,45].
Taking all of the above into consideration, the main goal of the present research was to optimize the extraction method of bioactive compounds obtained from coffee silverskin by the use of response surface methodology. Initially, the influence of different solvents, such as methanol, ethanol and their aqueous solutions, and distilled water, as well as other crucial extraction factors (solvent concentration, solid-to-liquid ratio, extraction duration and equipment), on the extraction technique of antioxidant compounds was estimated to produce extracts rich in phenolic compounds with high antioxidant activity. Subsequently, different experimental design of solid–liquid extraction conditions (concentration of the extraction solvents and the ratio of solvent volume to CS matrix) with the selected extractant were conducted, and the effects of these operational variables with new ranges on the extraction of bioactive compounds and their antioxidant capacity were examined. Ultimately, the most favorable extraction conditions, which result in the opportunity of obtaining a phenolic rich extract with high antioxidant activity, were established.

2. Materials and Methods

2.1. Materials

Coffee silverskin (CS) blend was used as a research material. The tested blend has been prepared by compounding the silverskin samples generated during the roasting process of the two most economically significant species of coffee (Coffea arabica and Coffea canephora) of different geographical origins (Brasil, Columbia, Ethiopia, Indonesia). The collecting sample plan of CS blend was developed in accordance with the procedure of sampling plan for unpacked batches described in PN-ISO 3534-2:2010 standard [46]. Briefly, primary CS samples were collected six times every 3 days from local coffee roasteries to produce general CS blend samples. Then, these general CS blends were mixed to obtain a representative laboratory CS blend sample. The laboratory CS blend was homogenized in a laboratory mill IKA A11 (Staufen, Germany) and put in polyethylene bags with a slider. The CS blend sample was stored in the dark at ambient temperature until use.

2.2. Analytical Methods Used as Reponses in Experimental Design of Extraction Optimization (EO)

2.2.1. Determination of Total Phenolic Compounds (TPC) Content

The TPC content in CS extracts was performed by using the modified version of colorimetric method with the Folin–Ciocalteu reagent [47]. A total of 40 µL of the filtered CS extract sample was mixed with 3.16 mL of distilled water, 200 µL of Folin–Ciocalteu reagent procured from Chempur (Poland), and 600 µL 20% (w/v) sodium carbonate solution. After shaking, the obtained mixture was transferred to a dark place and kept at an ambient temperature for 2 hours’ duration. Subsequently, the measurements of the absorbance of the tested samples were performed at 765 nm by using a Shimadzu UV-1280 spectrophotometer (Kyoto, Japan). The gallic acid standard solutions at range 0.29–5.88 mM were applied to plotting a calibration curve. The TPC results were expressed as µmol of gallic acid equivalent per gram of coffee silverskin dry matter (µmol GAE/g CS d.m.).

2.2.2. Determination of Antioxidant Activity by Using ABTS Assay

The ABTS assay was conducted according to the method described by Re et al. [48] with some modifications. In order to prepare ABTS working solution, 4.9 mM of potassium persulfate solution was mixed with 14.9 mM of ABTS radical solution in ratio 1:1 (v/v) and maintained in the dark at ambient temperature for 12 h. The ABTS working solution was then diluted with a PBS buffer solution of pH 7.4 so as to obtain its absorbance of 0.7 ± 0.02 units at wavelength of 734 nm. CS extracts (40 µL) were allowed to react with 4 mL of the diluted ABTS solution for 6 min in a dark condition. Then, the absorbance of tested mixture was measured at 734 nm. The standard curve was linear between 0.4 and 1.5 mM of Trolox solutions. The ABTS results were expressed as µmol of Trolox per gram of coffee silverskin dry matter (µmol Trolox/g CS d.m.).

2.2.3. Determination of Antioxidant Activity by Using FRAP Assay

The FRAP assay was determined according to the procedure described by Benzie and Strain [49] with some modifications. The working FRAP reagent was prepared by mixing 10 mM TPTZ (2,4,6-tris (1-pyridyl)-5-triazine) solution in 40 mM HCl with a 20 mM FeCl3 solution and 0.3 M acetate buffer (pH 3.6) in a proportion 1:1:10 (v/v/v). A total of 50 μL of the CS extract was mixed with 450 μL of distilled water and 4.5 mL of the FRAP reagent. The obtained mixture was incubated at 37 °C for 30 min. After an incubation, the absorbance of the tested sample was measured at 593 nm. The distilled water was used as a blank control sample. The standard curve was constructed using an aqueous solution of ferrous sulfate (FeSO4·7H2O) at concentrations of 100–1000 μM. The FRAP results were expressed as µmol of ferrous equivalent per gram of coffee silverskin dry matter (µmol Fe(II)/g CS d.m.).

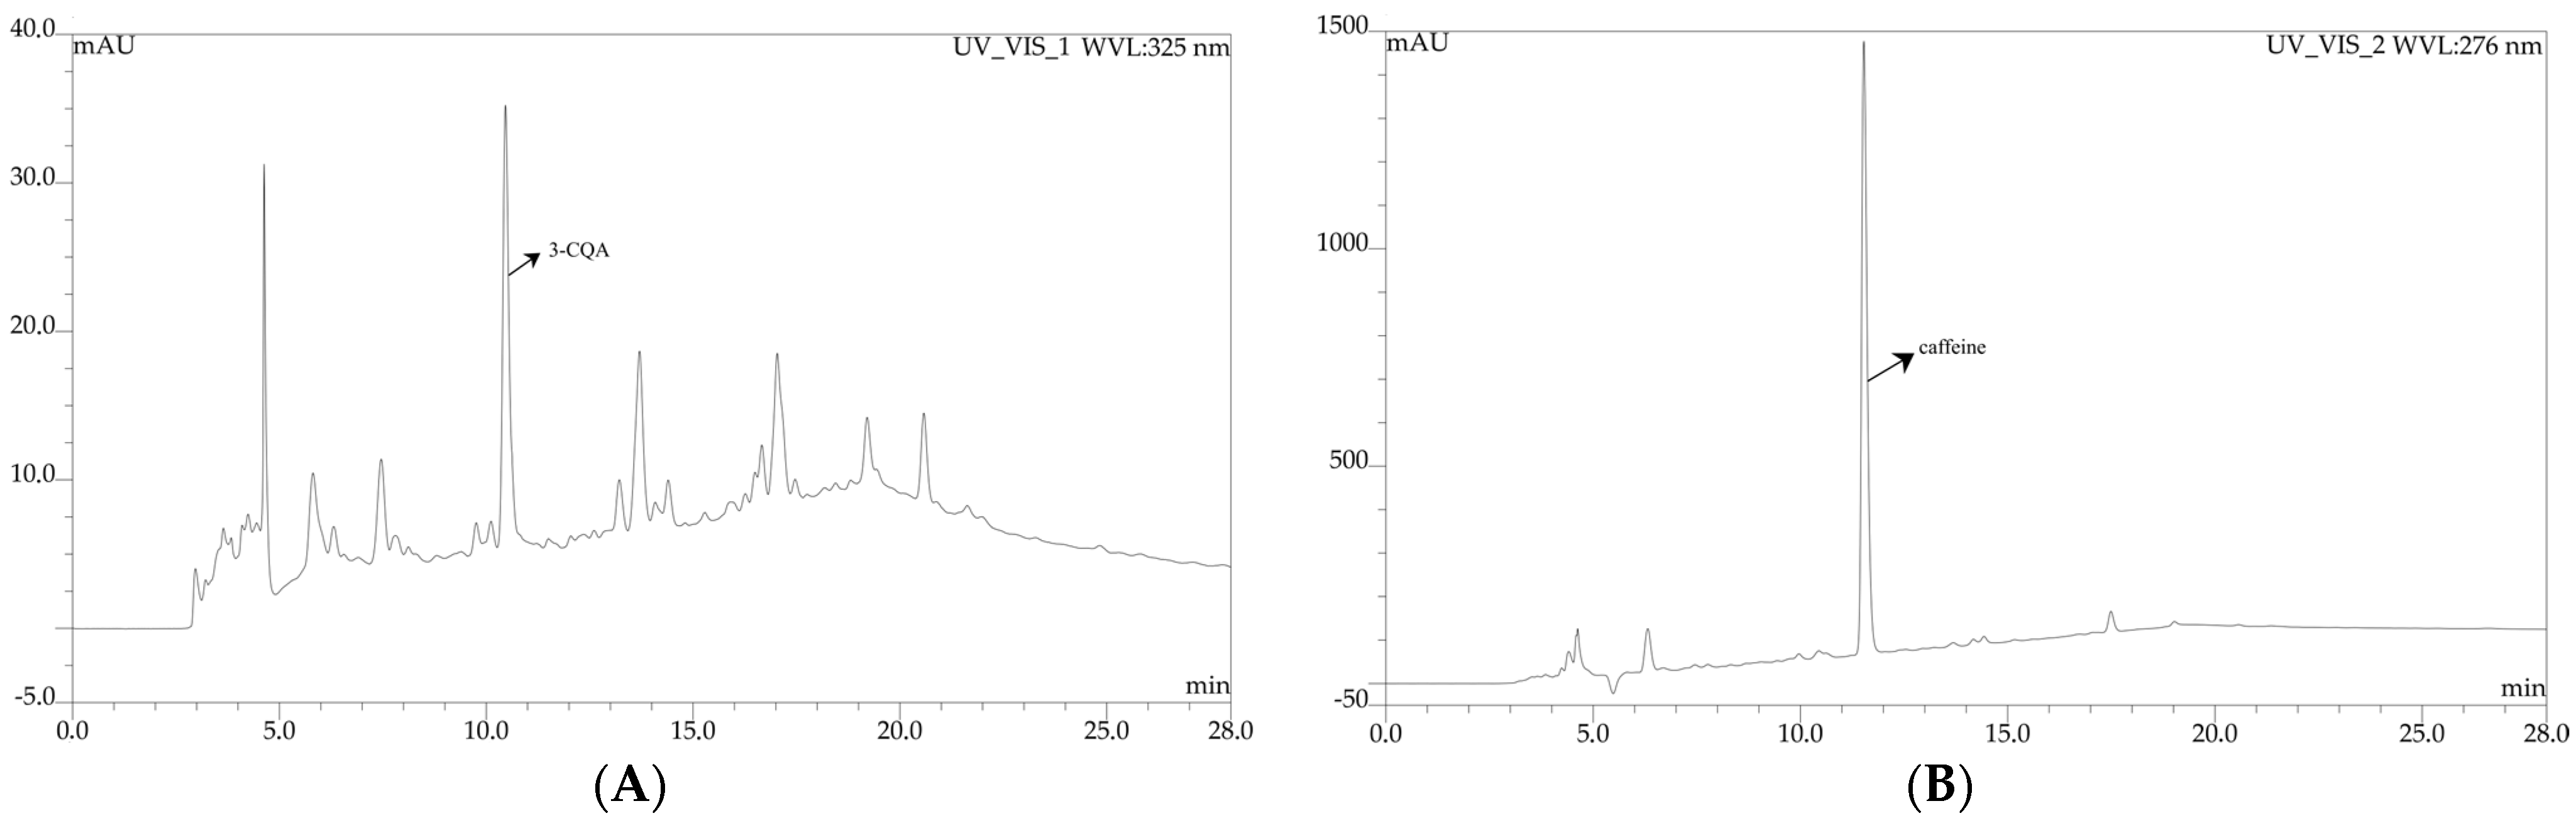
2.2.4. Determination of Caffeine and Chlorogenic Acids Content by Using HPLC

The high-performance liquid chromatographic (HPLC) measurements, based on the method of Głowacka et al. [3], were performed to determine the caffeine and chlorogenic acids content in tested CS extracts. The representative chromatograms of chlorogenic acid (3-CQA) and caffeine obtained from HPLC analysis of ethanolic CS extract are presented in Figure 1.
The HPLC system equipped with a Dionex (Germering, Germany) pump P580, a DG 1210 degasser, an automatic injector ASI-100, spectrophotometric detector UVD 170S and column oven. The analytical Supelco Discovery C18 column (4.6 mm i.d. × 250 mm, 5-µm particle size) was used. The chromatographic separation of the analytes was carried out with gradient elution at a flow rate of 0.8 mL/min at ambient temperature. The mobile phase consisted of eluent A (0.3% (v/v) aqueous acetic acid solution) and eluent B (methanol of HPLC purity grade). The gradient programme was conducted as follows: 0 min, 20% B; 15–24 min, 50% B, 27–29 min, 20% B. The detection analytes wavelengths of 276 nm and 325 nm were used for the analysis of caffeine and chlorogenic acids, respectively. The external standard curves were prepared for caffeine and chlorogenic acid (3-CQA). Chromeleon v.6.11 software (Dionex, Germering, Germany) was applied for data acquisition and processing.

2.2.5. Determination of Browning Index (BI)

The BI measurements were conducted according to the method reported in the paper by Chung et al. [50]. In order to designate BI values, the absorbances of the 10-fold diluted solutions of the tested CS extracts were measured at 420 nm using a Shimadzu UV-1280 spectrophotometer (Kyoto, Japan).

2.3. CS Extracts Prepration Procedure and Statistical Approach of Experimental Design of EO

2.3.1. CS Extracts Preparation Procedure

In all the examined extraction variants, the preparation of CS extracts was performed according to the experimental extraction optimization design scheme procedure. In brief, one gram of dried CS blend was transferred to the Schott bottle and the appropriate measured volume of extractant was also added. Then, the sample was placed in a laboratory shaker Elpin Plus type 357 (Lubawa, Poland) with water bath or laboratory Emmi-D60 ultrasonic heater bath (Salach, Germany). The extraction process was carried out at 60 °C for desired time. After extraction duration was quitted, the entire obtained sample was centrifuged (2500× g, 20 min, 4 °C) and the supernatant was filtered through filter paper. The CS extracts were stored at 2–8 °C in the dark until further analytical determinations. The volume of the CS extract recovered after each extraction variant was measured and applied for calculations.

2.3.2. Statistical Approach of Experimental Design of EO

The experimental optimization design of the extraction technique of bioactive compounds obtained from coffee silverskin was constructed as a two-stage investigation applicating response surface methodology (RSM). In the first stage of the experiment, the variants of CS extracts were prepared by screening multifarious operational extraction process variables: a type of extractant (methanol, ethanol and their aqueous solutions and distilled water), a solvent concentration (60–100%), an extraction duration (30–90 min), a ratio of used solvent volume to CS solid matrix, hereinafter referred to as SMR (10–40 mL/g CS d.m.), and a type of a used extraction apparatus (laboratory shaker with water bath or laboratory ultrasound heater bath). Table 1 provides an overview of the tested extraction factors and their levels. The effect of applied operational extraction process variables was verified by the exploitation of 24 full factorial design assay for methanolic and ethanolic CS extracts or 23 full factorial design for aqueous samples.
Whereas in the second stage of the experiment, solid–liquid extractions were carried out using the solvent selected in previous stage of extraction optimization design. The extraction process was conducted by 30 min with the use of laboratory shaker with a water bath. A new experimental design, as presented in Table 2, was performed using only significant operational extraction process variables: an extractant concentration (7.58–92.42%) and SMR (11.72–68.28 cm3/g CS d.m.). The influential factor analysis was established on the basis of the 22 circumscribed central composite design (CCC).
All the experimental extraction variants and analytical determinations were analyzed in triplicate. Results were reported as mean ± standard deviation. The experimental data obtained in the second stage of extraction optimization of bioactive compounds from coffee silverskin were fitted to second-order polynomial equations. The models were simplified by eliminating statistically insignificant factors. Statistical analyses were performed using Statistica v.13 software. The statistical significance of the operational extraction process variables was determined at the significance level of α = 0.05.

3. Results and Discussion

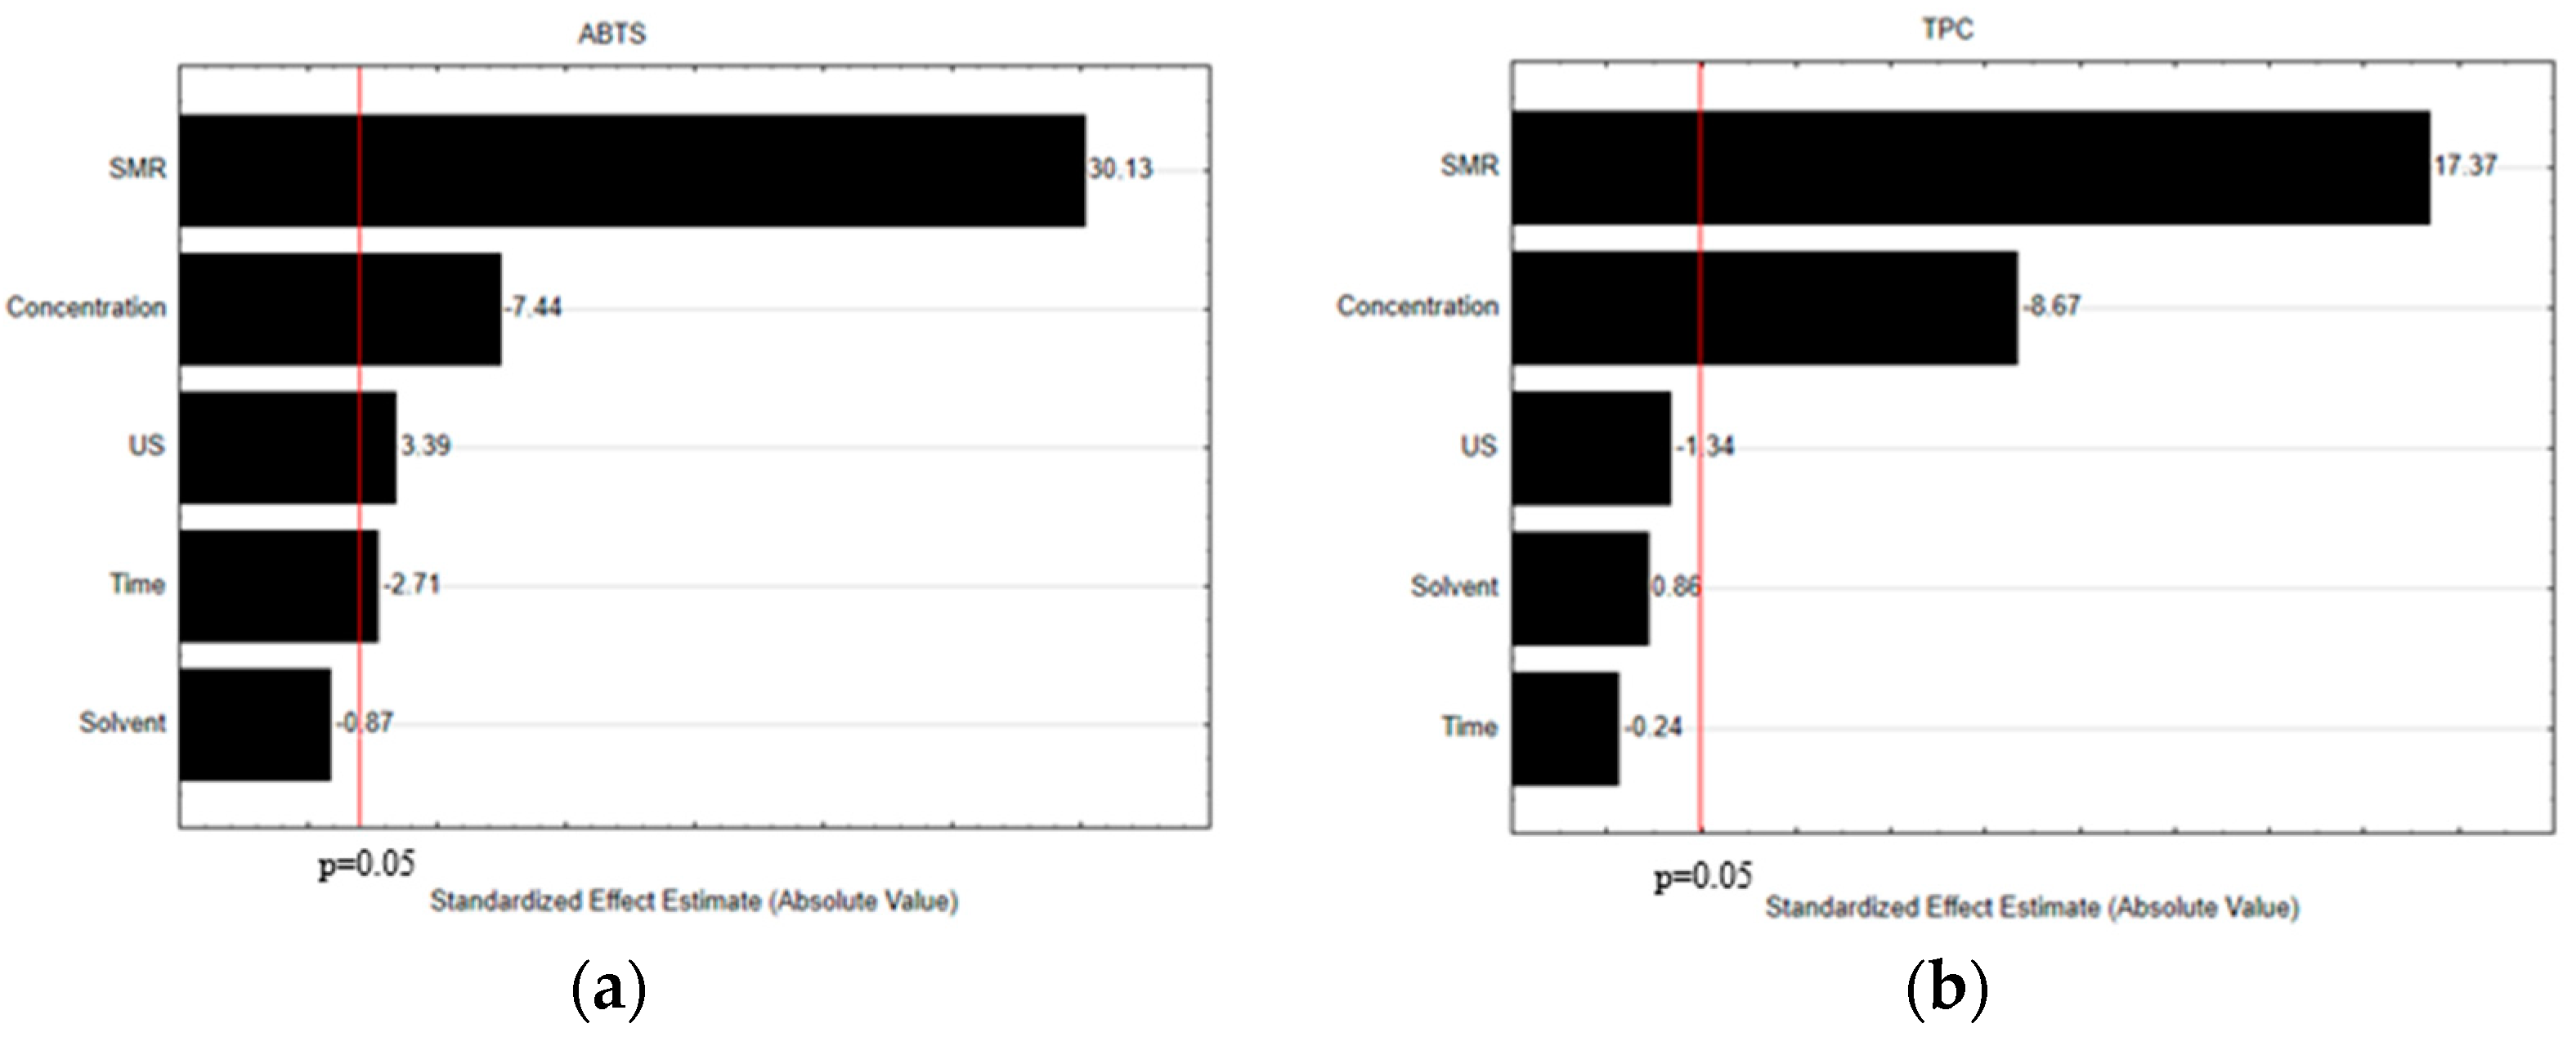
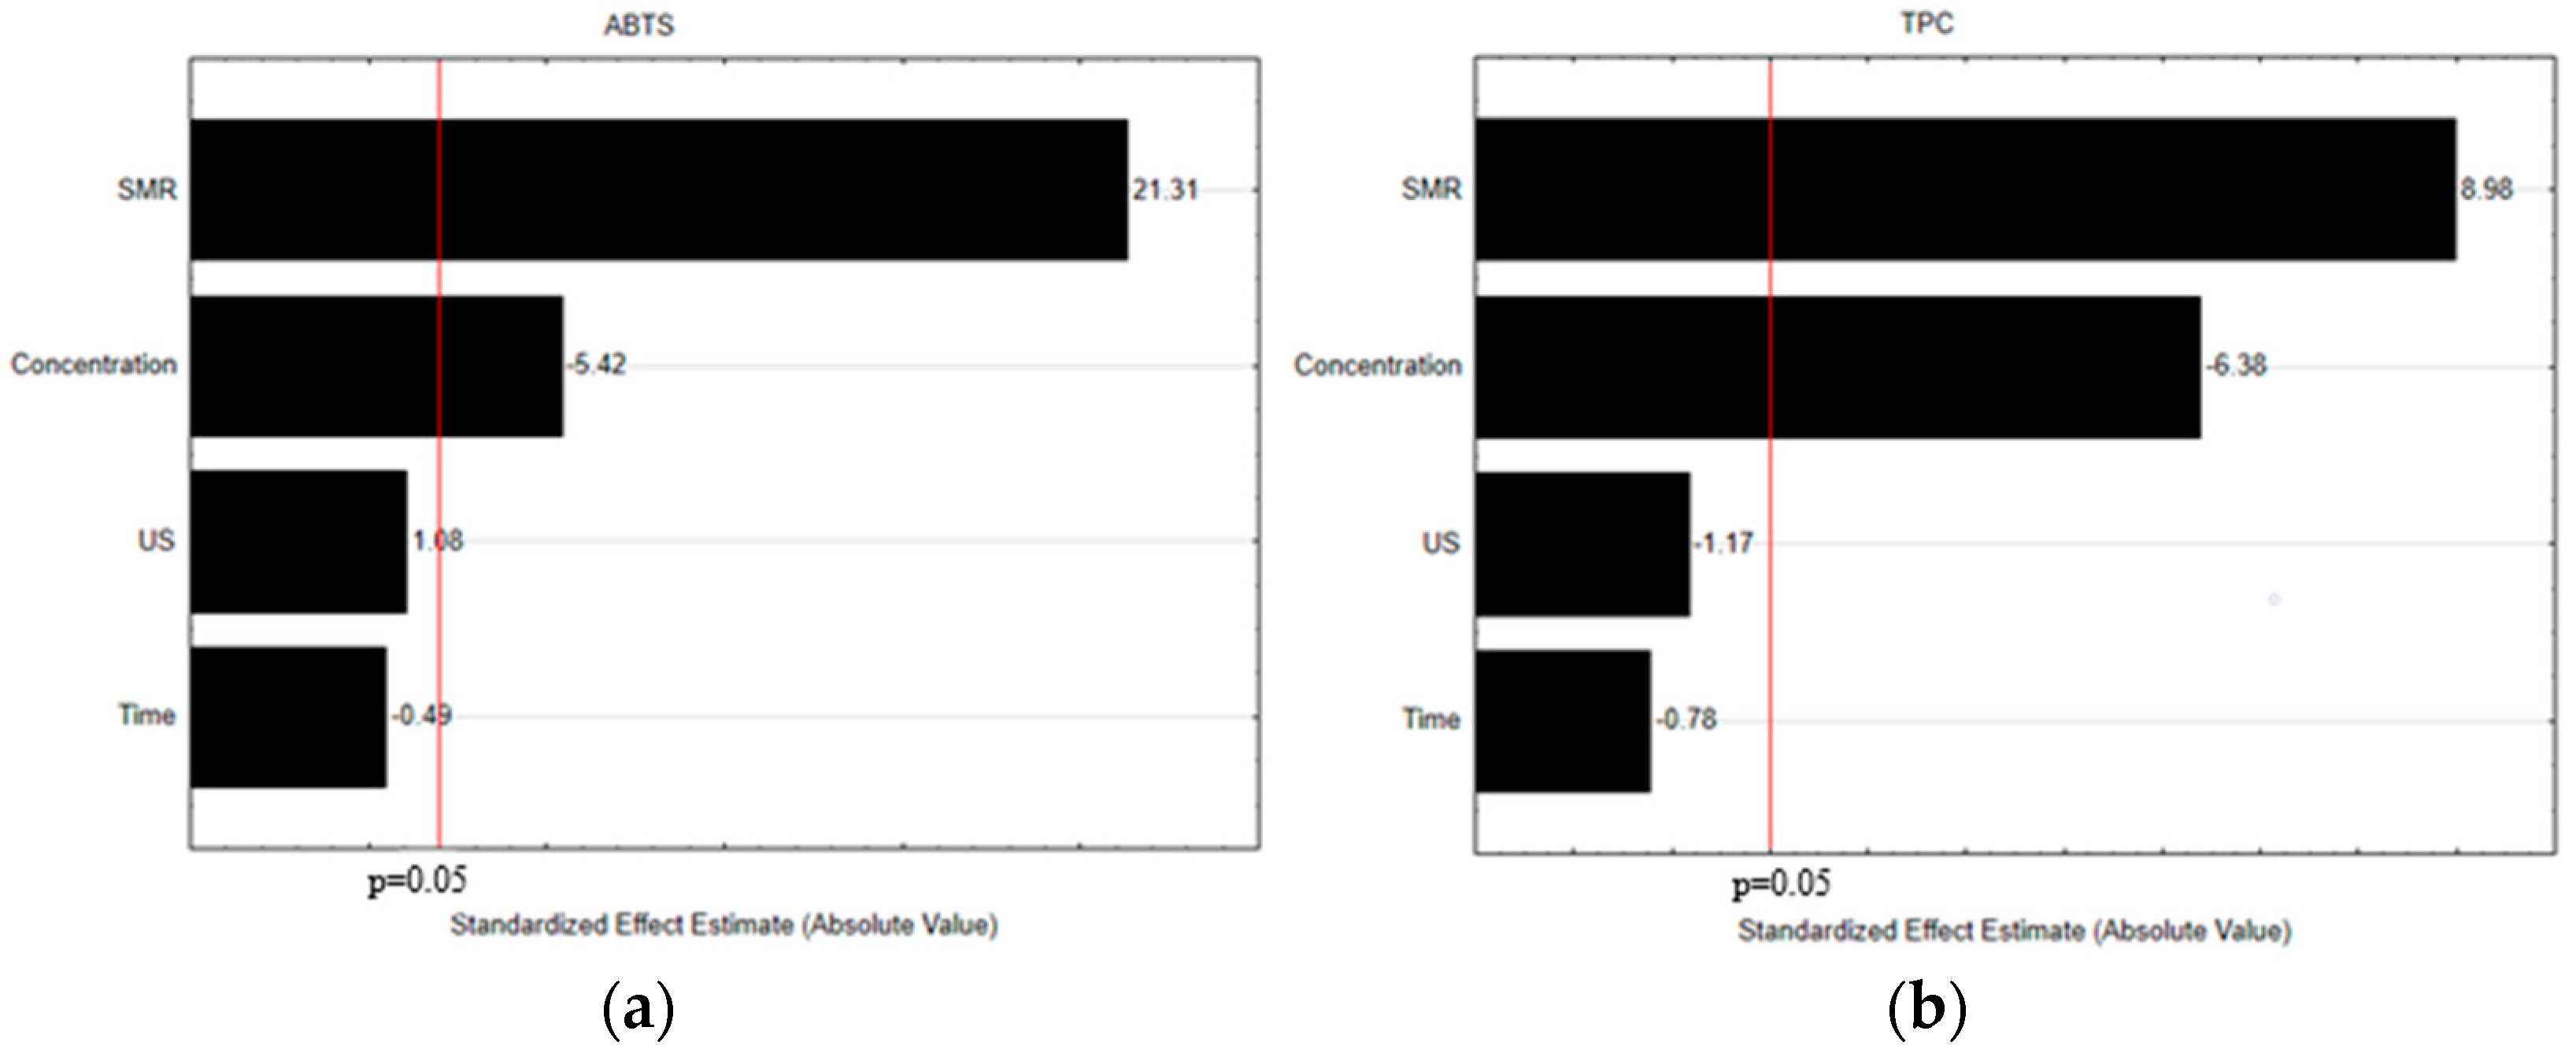
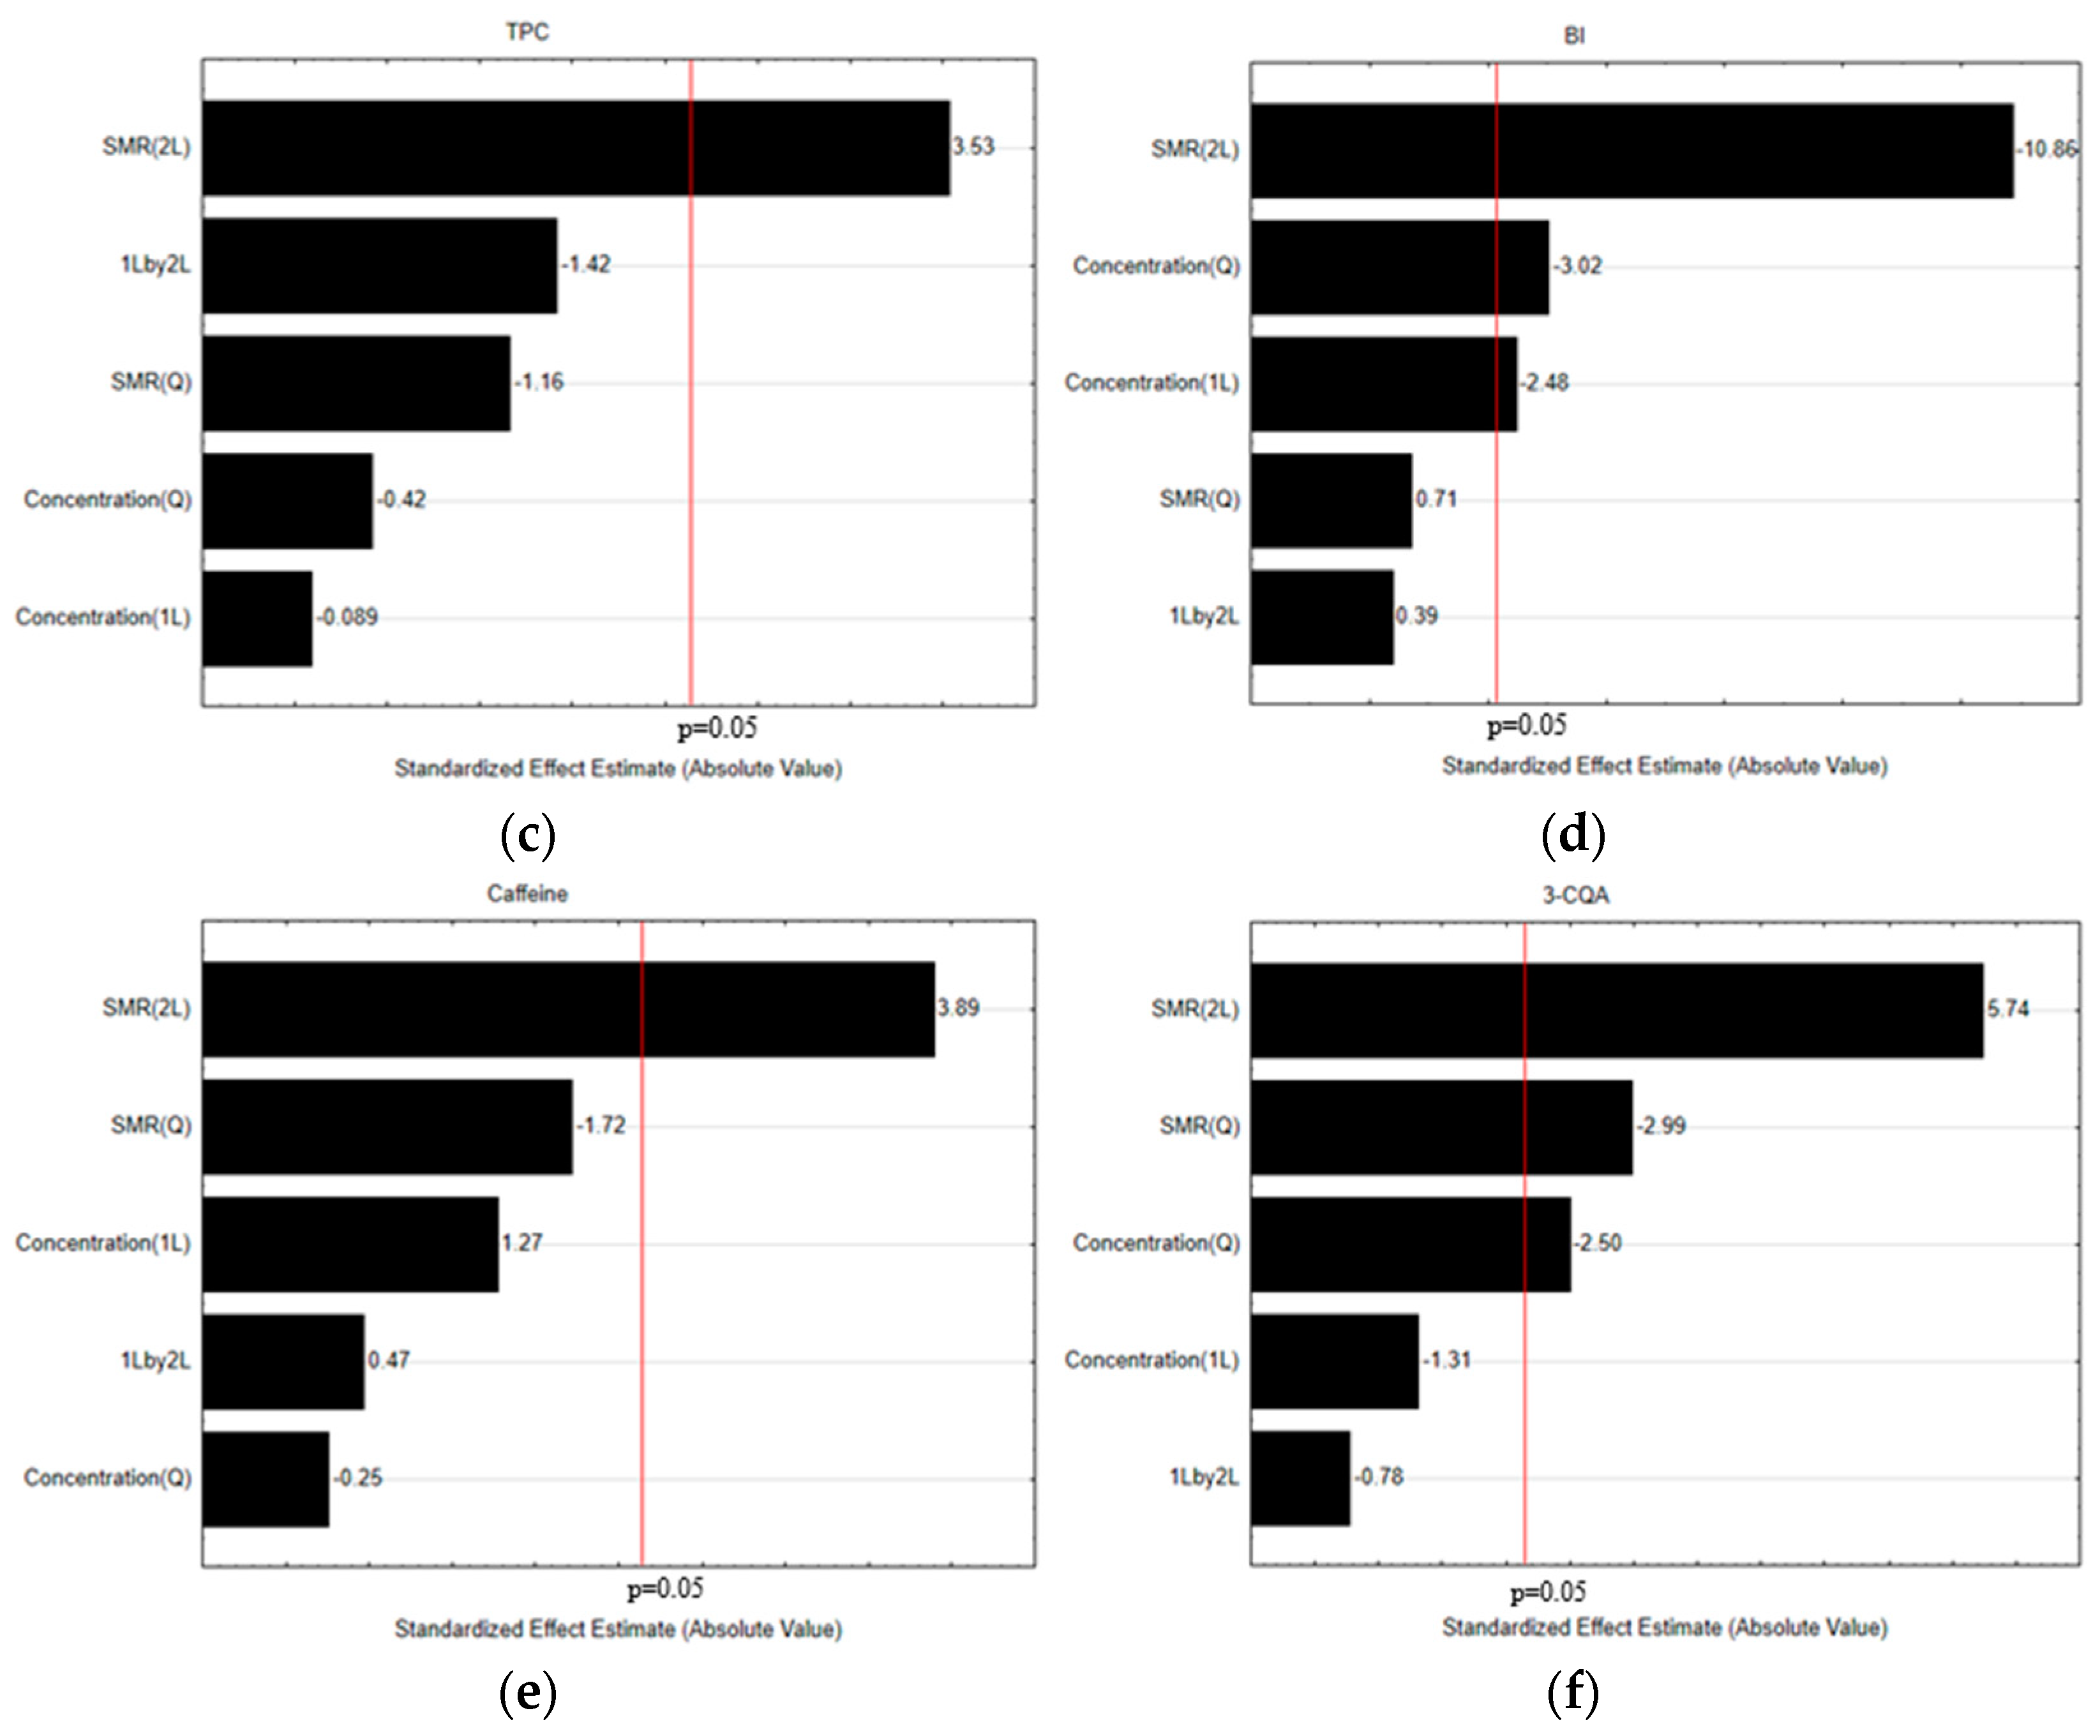
3.1. Selection of the Crucial Operational Extraction Process Variables

In the first stage of extraction optimization of bioactive compounds from coffee silverskin, the influence of the type of used solvent and its concentration, SMR, extraction duration, and the applied extraction equipment was assessed to characterize CS extracts properties. As RSM responses, ABTS assay and TPC determination were performed. The results obtained in the preliminary analysis are summarized in Table 3. Ethanol, methanol, and their aqueous solutions, as well as distilled water, have been used in this stage of extraction process optimization. These chemicals are known as the typical solvents, ensuring high level of recovery of bioactive compounds from raw plant materials and their by-products matrix [36,51]. It is apparent from Table 3 that in all examined extraction conditions CS extracts indicated the antioxidant potential and the CS ethanolic extracts had the highest level of the antioxidant activity (93.0 μmol Trolox/g d.m.). ABTS assay revealed that methanolic and ethanolic CS extracts were characterized by the significantly higher antioxidant activity in comparison to the CS extracts produced with distilled water as an extracting solvent. These findings are in agreement with the results presented by Ballesteros et al. [37]. A possible explanation for these results might be the polarity and viscosity of the used extracting solvent [52]. In addition, the extractability of bioactive antioxidants compounds from the tested coffee by-product could be associated with the phenomenon that these compounds are frequently more soluble in organic chemicals less polar than water [53]. From experimental data collected in Table 3, it can be seen that there is a clear decreasing trend of antioxidant activity, as well as TPC of CS extracts prepared by using the absolute pure organic solvents. Similarly, Gokhan et al. [54] highlighted that methanol was considered to be a less powerful organic solvent of recovering bioactive antioxidant compounds from the most common coffee by-products, such as coffee silverskin and spent coffee grounds, in comparison with its aqueous solutions. Additionally, the authors of the aforementioned article indicated that coffee by-product extracts can be ranked in the following order EtOH:H2O > MeOH:H2O > MeOH > H2O. Our results are in agreement with this described trend in solvent efficiency of antioxidants extracting process.
It is worth emphasizing that methanolic and ethanolic CS extracts are characterized by relatively high antioxidant activity values, which are comparable to the antioxidant activity of fresh fruits such as raspberries, blackberries or grapefruits [55,56].
The TPC was in the range of 15.5–46.4 μmol GAE/g d.m., 17.1–48.4 μmol GAE/g d.m., 13.1–27.4 μmol GAE/g d.m. for methanol, ethanol, and aqueous extracts, respectively. As in the case of antioxidant activity, the TPC in CS extracts can be compared to the content of these compounds in fresh fruit extracts such as western raspberries or Parkia speciose pods [57,58].
Based on the findings obtained in the first stage of CS bioactive compounds extraction optimization, it can be seen that the aqueous CS extracts were characterized by significantly lower antioxidant activity and the TPC compared to methanol and ethanol extracts. A similar trend was demonstrated in the works of Bhatt and Parajuli [59] and Yousuf et al. [60], in which alcoholic extracts showed a greater antioxidant activity and TPC compared to other extracts. For this reason, the possibility of using water as an extractant was excluded from further experimental extraction.
In order to compare the effects of the applied extraction process variables, Pareto charts were plotted (Figure 2). They make it possible to check which variables have a statistically significant impact on the tested experimental plan. In this figure, bars extending beyond the vertical line correspond to the effects statistically significant at 95% confidence level. It can be noticed that in the case of the tested model, both in terms of antioxidant activity and the TPC, the type of solvent proved to be statistically insignificant. In light of the health and safety risks and environmental concerns, there is a need for “green”, safe, and efficient extraction solvents. Despite methanol being a good solvent for phenolic recovery from plant-based materials [61,62], it poses a threat to human health. Ethanol, on the other hand, has a relatively low environmental impact, is categorized as GRAS (generally recognized as safe), and is proved to be a good choice for extracting natural compounds from plant materials [63,64]. Hence, in the case of the tested CS material, ethanol could be a more advantageous extraction solvent compared to methanol.
Analyzing the effects of extraction process variables for ethanol (Figure 3), it can be seen that the most significant for the antioxidant activity and TPC in the CS extracts were the ratio of ethanol to CS matrix and the concentration of ethanol. The SMR was positive, while the solvent concentration had a negative effect on the extraction of antioxidant compounds. Both the extraction time and the use of ultrasounds were not statistically significant variables in the model. These results suggest that extended extraction time has a limited impact on the recovery of phenolic compounds from CS and most of these compounds are extracted at short times. Similar to this study, the extraction time was a less pronounced variable during the extraction of phenolic compounds from spent coffee grounds in the works of Zuorro and Lavecchia [65]. Low impact of ultrasound assisted extraction could be explained by the possibility of the generation of highly reactive hydroxyl radicals, which could cause degradation or oxidation of phenolic compounds [66]. Therefore, in the next stage, it was decided to carry out the extraction for 30 min with the use of the laboratory shaker with water bath.

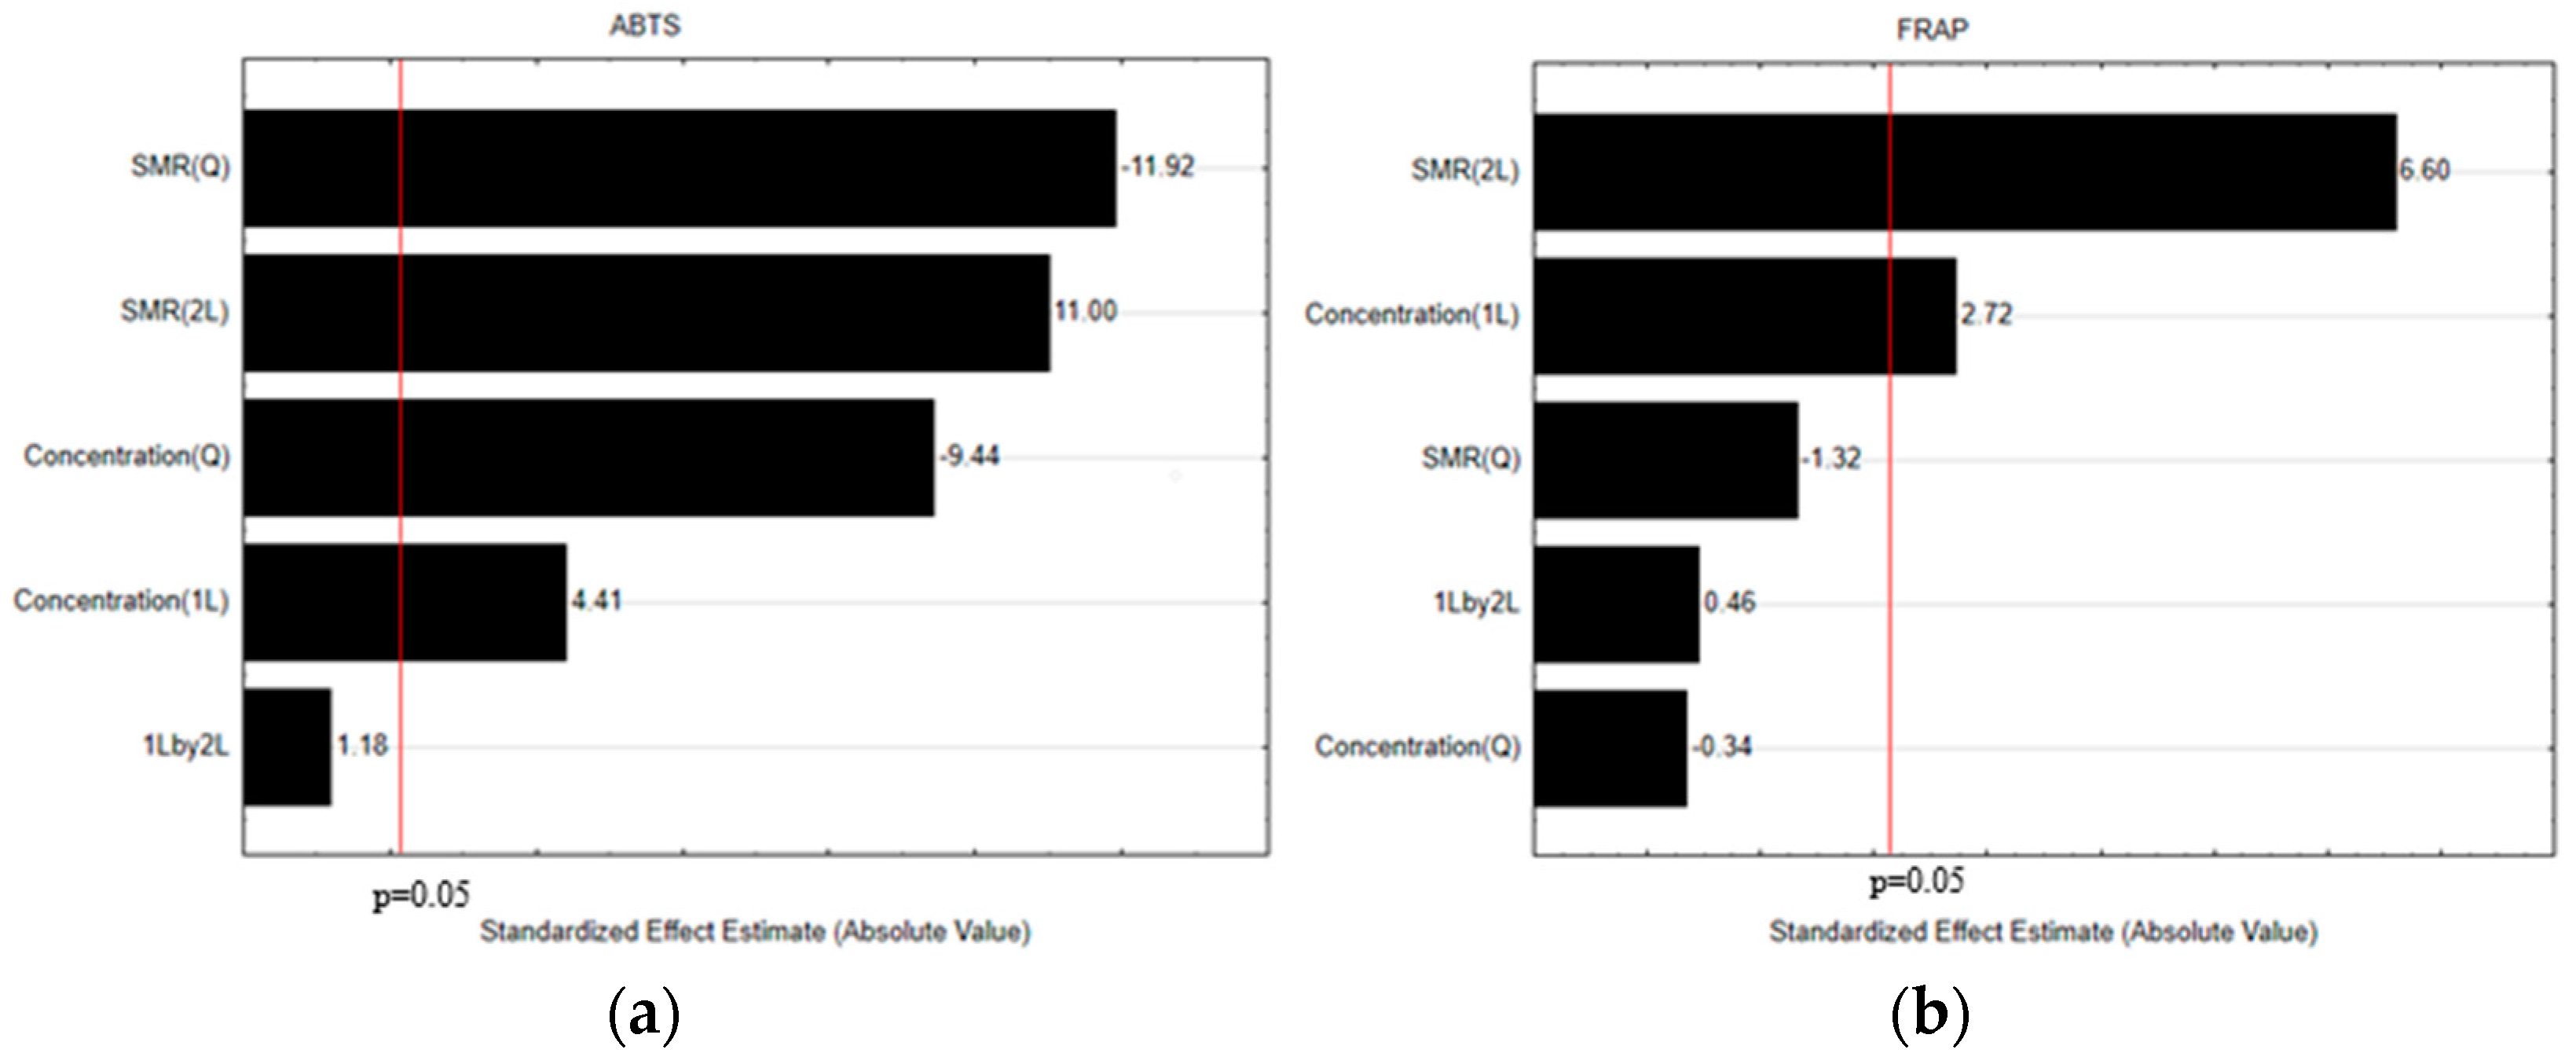
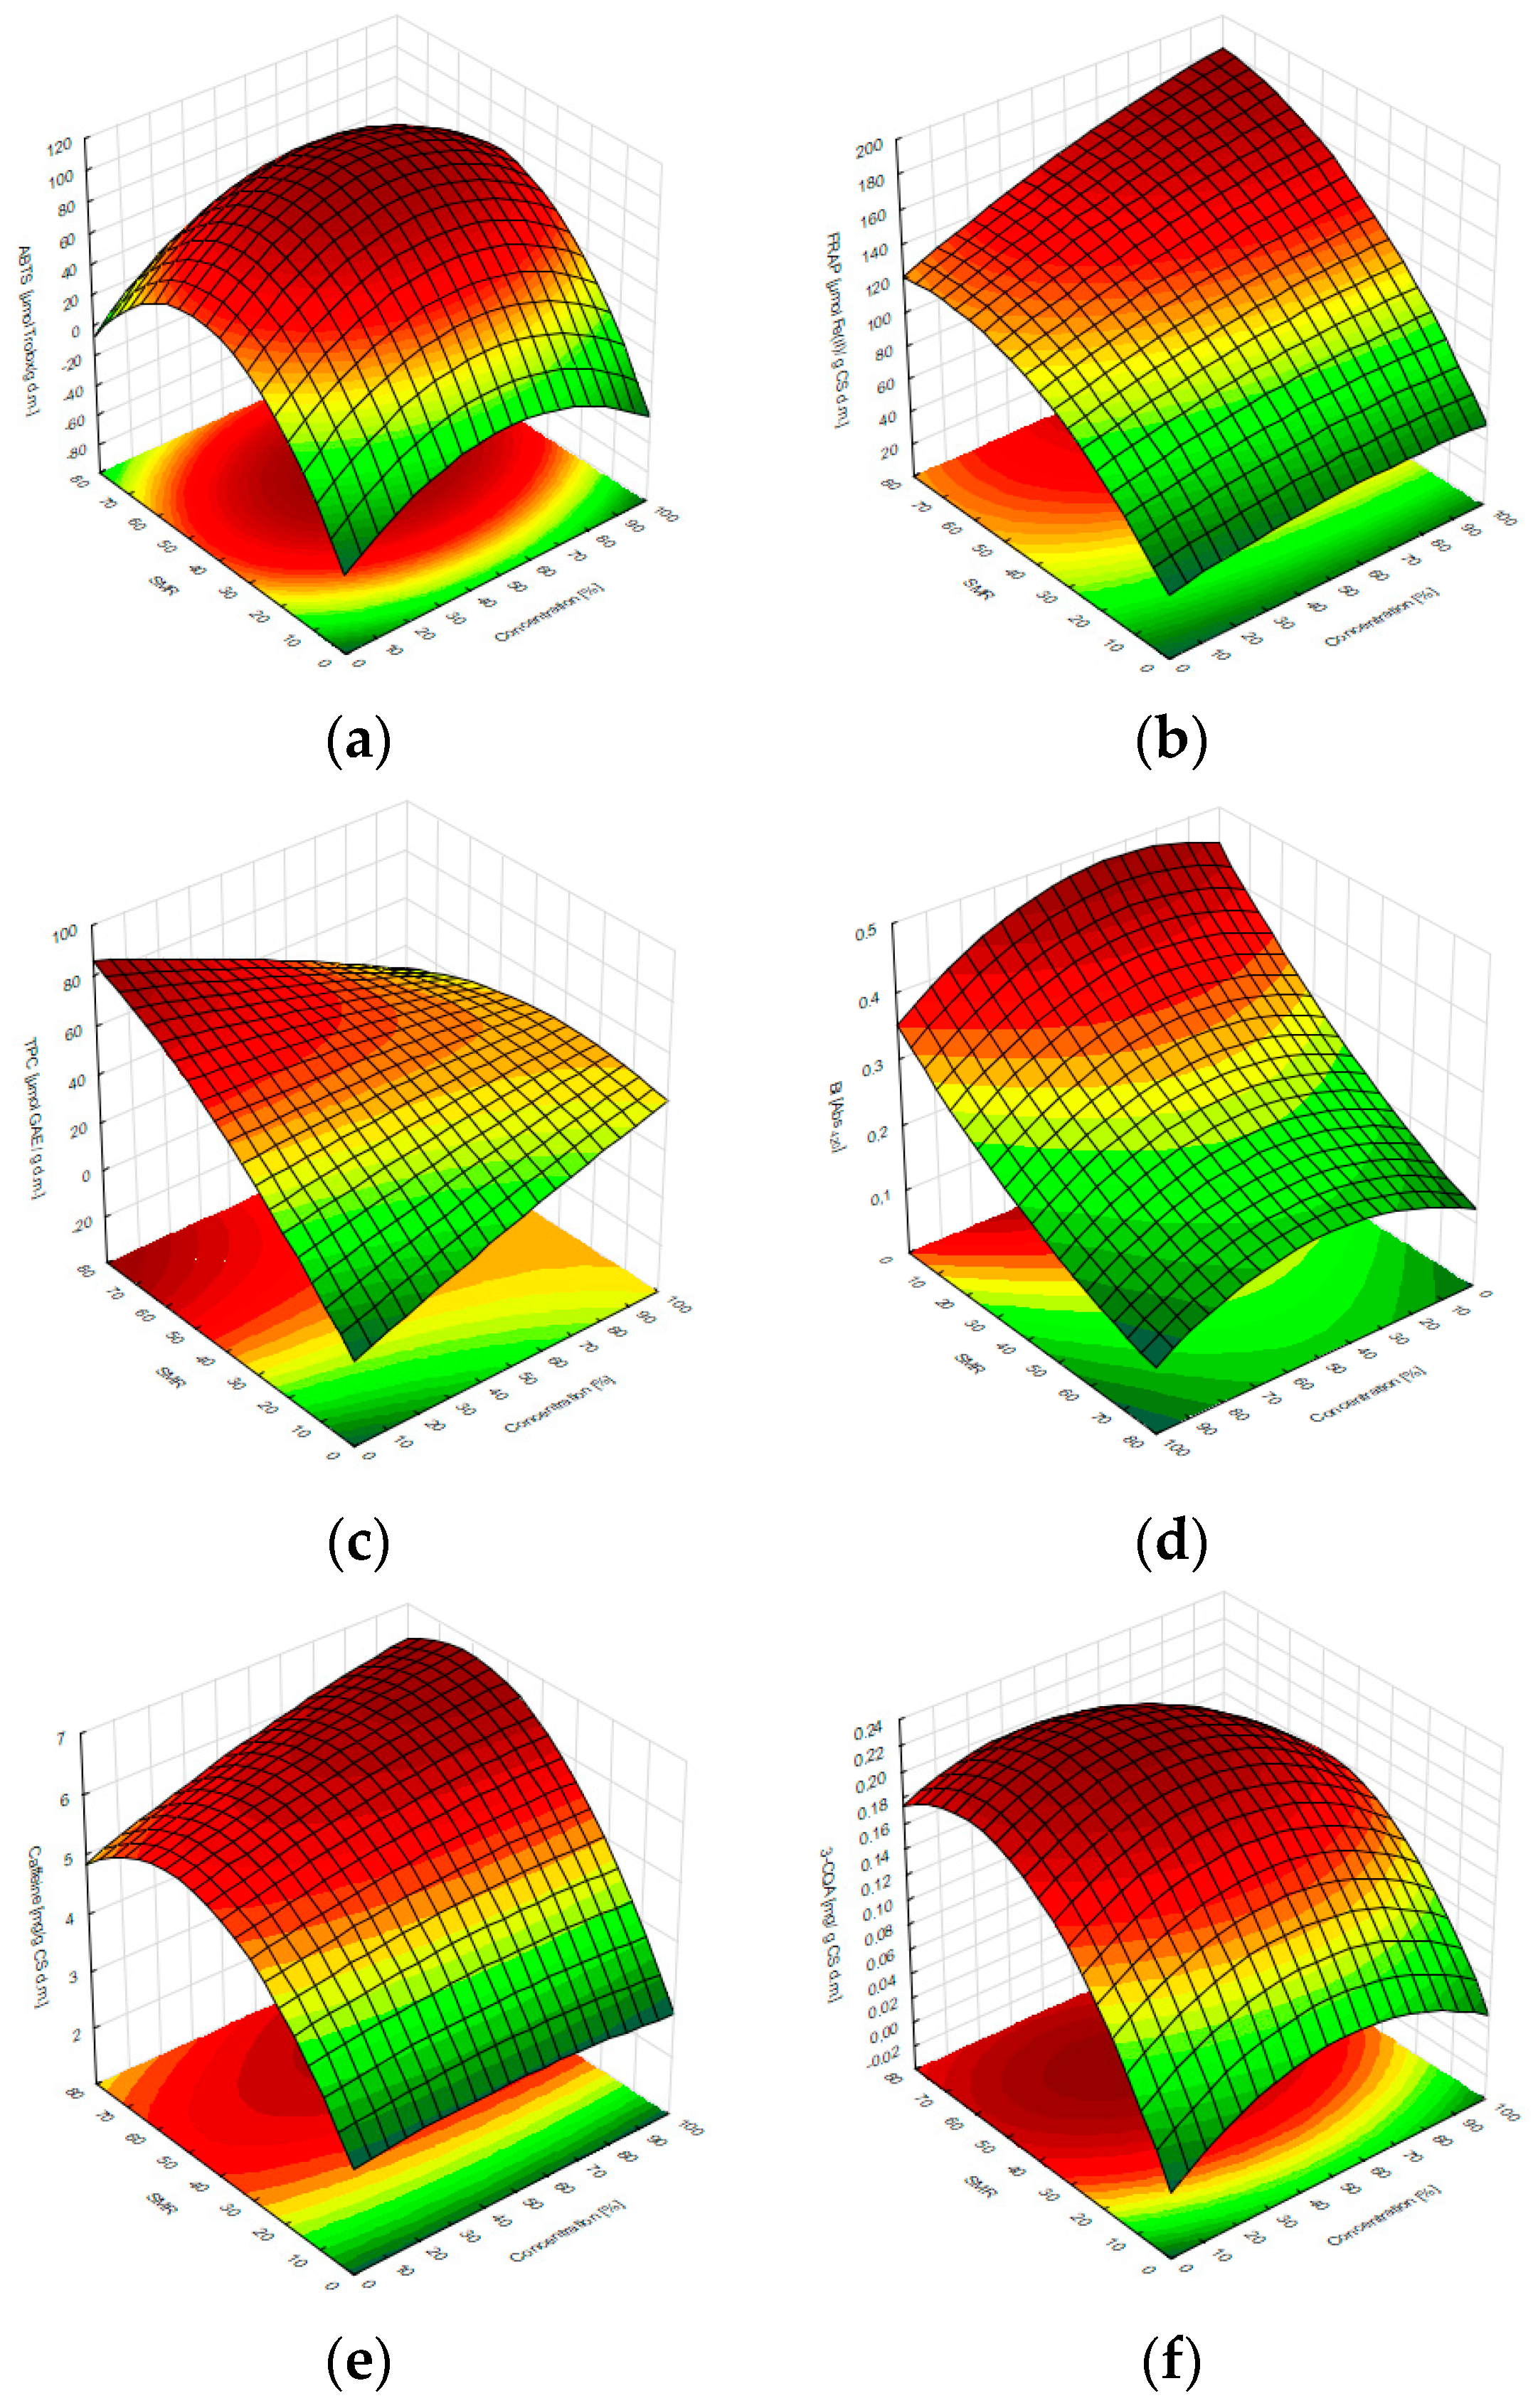
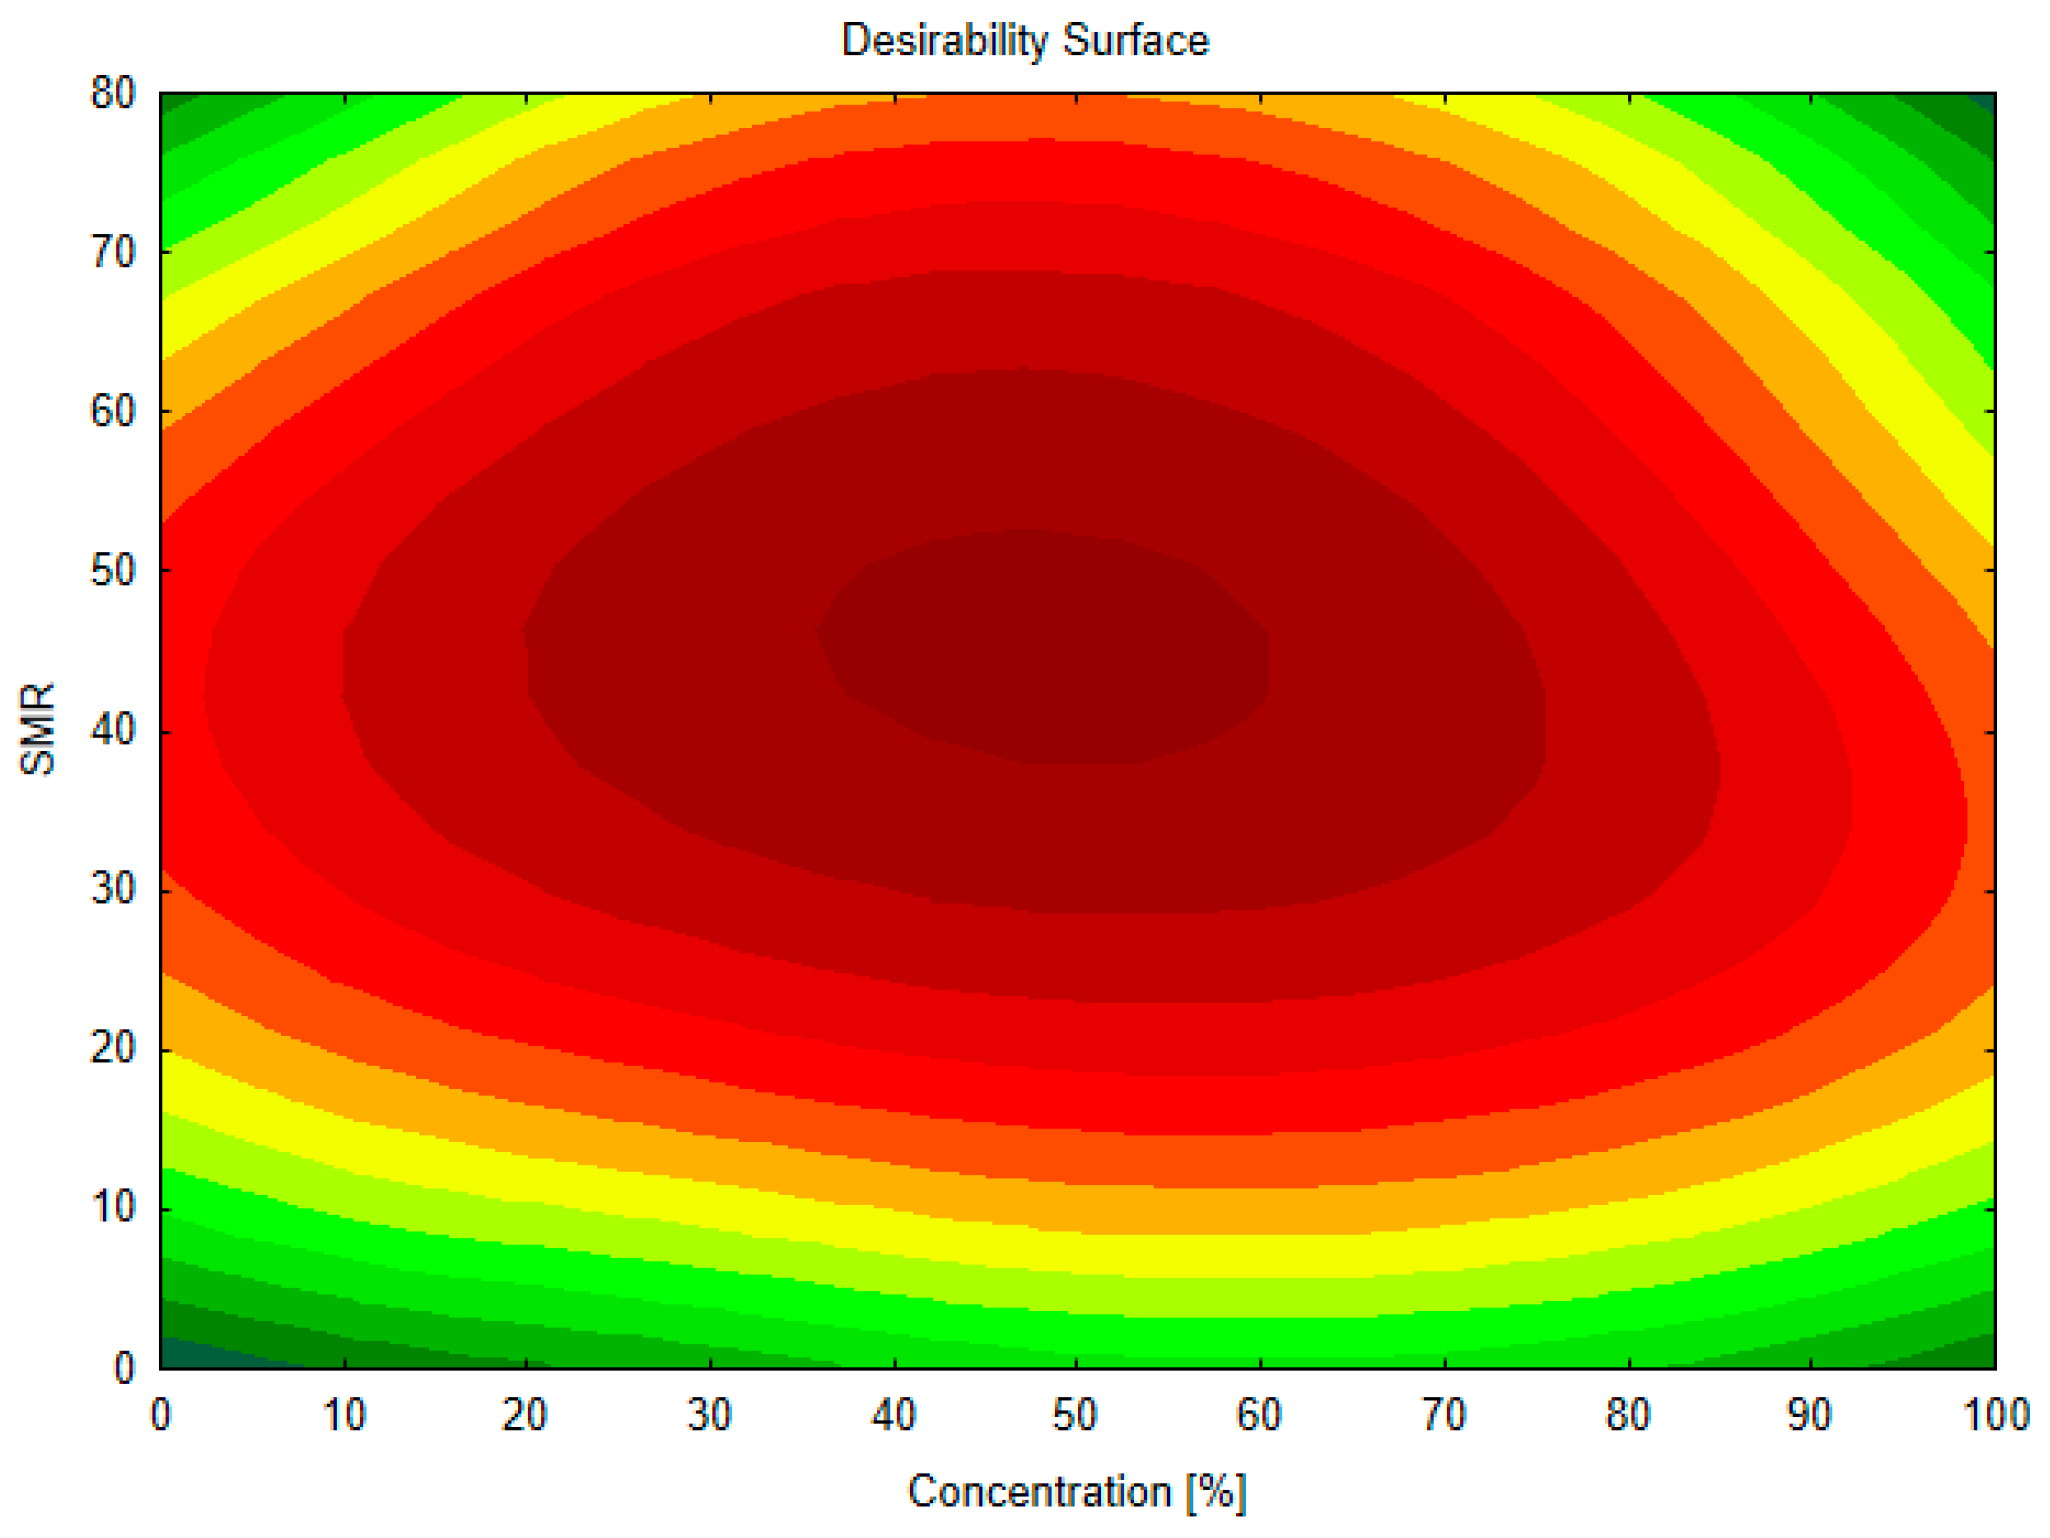
3.2. Optimization of the Extraction Conditions

In order to select optimal extraction conditions yielding extracts with the highest possible content of bioactive compounds and the highest antioxidant activity, and based on the results from the first stage of research, a new plan of experiments was created on the basis of the central compositional plan 22. In this plan, SMR and solvent concentration were left as extraction process variables, extending their range compared to the first step plan. At this stage, a broader analysis of the extracts was also carried out, including the antioxidant activity determined by the ABTS and FRAP methods, the TPC, the so-called browning factor and caffeine and chlorogenic acid (3-CQA) content. The results of the analyses of ethanol extracts prepared in the second stage of the research are presented in Table 4.
Recently, non-conventional methods such as ultrasound/microwave-assisted extraction or subcritical water extraction are commonly applied as alternative extraction techniques to traditional extraction processes. These techniques are recognized as more environmentally friendly with better overall yield. Conventional extraction methods are still considered as the reference methods to modern methodology [67]. Guglielmetti et al. [68] compared conventional solvent extraction (CSE) with ultrasound-assisted extraction (UAE) and microwave-assisted extraction (MAE). The authors demonstrated that, in the case of TPC, UAE and CSE gave similar results, while MAE TPC yield was significantly lower. CSE TPC ranged between 8.05 and 10.58 mg GAE/g d.m. CS, which is in agreement with the results of this study. In recent years, one of the most efficient methods of TPC extraction is subcritical water extraction. With the use of this method, Ginting et al. [69] obtained above 51 mg GAE/g CS, which is a significantly higher yield in comparison to conventional methods.
Figure 4 shows the Pareto charts describing the effects of the variables analyzed in the second stage of the research. In most cases, the SMR at both the linear and quadratic levels was the most significant effect. However, the smallest effect was observed in the interaction between the studied variables. This interaction was not statistically significant for all analyses.
On the basis of the data obtained in the second stage of the research, mathematical models were developed that describe changes in responses in individual analyses depending on SMR and ethanol concentration (Table 5). For simplicity, the formulas describing the mathematical models did not take into account the effects that turned out to be statistically insignificant. The lowest coefficient of determination (below 0.65) was found in the response models of TPC and caffeine content.
These formulas were the basis for the creation of contour plots presenting in a three-dimensional system the distribution of the predicted values of individual analyses in relation to the concentration of the solvent and the SMR (Figure 5). They were also used to determine the usable area (Figure 6), thanks to which it is easy to determine the optimal extraction conditions to obtain extracts with high antioxidant activity and a high content of bioactive compounds. In the case of the tested matrix, the most optimal results can be obtained with an extractant concentration of 50% and an SMR of 45 cm3/g.
In order to validate the mathematical models, new ethanol extracts were made under the following conditions: extraction solvent concentration 50%, SMR 45 cm3/g, extraction time 30 min, with the use of laboratory shaker with water bath. The values approximated on the basis of models and obtained during validation are presented in Table 6.
The deviations of the actual values obtained during validation tests and values approximated by the fitted models were all below 5%. This close agreement between experimental results and those predicted by the equations proves the model viability for the rapid prediction of the extraction results in the studied range.

4. Conclusions

Response surface methodology turned out to be an effective mathematical and statistical tool for modeling and optimizing the extraction process of bioactive compounds obtained from a coffee bean roasting by-product such as coffee silverskin. This technique enables not only the selection of the most favourable conditions for the extraction process, but also the obtaining of extracts with both a high content of bioactive compounds and antioxidant activity while performing a significant reduction in the number of experiments. Furthermore, response surface methodology allowed the significance of the effect of each extraction process independent variables and their interactions on the spectrophotometric and chromatographic methods used as responses to be determined. Among the examined process variables, the ratio of volume solvent to sample solid matrix and the concentration of used extractant are the most crucial factors affecting the extraction recovery yield of bioactive compounds from coffee silverskin. In accordance with the experimental data, the extraction with the use of 50% ethanol and the ratio of solvent volume to a sample matrix of 45:1 (v/w) for 30 min at 60 °C is the most promising variant of the process of extracting bioactive compounds from coffee silverskin. The ethanolic extract generated with the best variant of the extraction process could be considered a valuable source of caffeine (approx. 6.8 mg/g d.m. of the coffee silverskin) and phenolic compounds, including chlorogenic acids, with the content reaching 0.45 mg/g d.m. of the coffee silverskin sample. Additionally, the ABTS and FRAP assays revealed that this extract is characterized by high antioxidant activity (approx. 100 µmol Trolox/g d.m. of the coffee silverskin and approximately 180 µmol Fe(II)/g d.m. of the coffee silverskin, respectively). Taking the obtained findings into consideration, coffee silverskin can be proposed as a low cost and relatively stable waste plant material containing bioactive compounds with high antioxidant activity, which creates an opportunity for its valorization and innovative utilization approaches towards this potential environmentally harmful waste. Moreover, the authors would like to recommend that further experimental investigations will need to be conduted to evaluate the possibility of the implementation of coffee silverskin ethanolic extracts in liquid or powdered form as an ingredient of functional food products or biodegradable (packaging) materials used in the food industry.

Author Contributions

Conceptualization, R.B. and A.G.; methodology, R.B., A.G. and M.W.-W.; software, R.B.; validation, R.B., A.G. and M.W.-W.; formal analysis, R.B.; investigation, R.B.; data curation, R.B.; writing—original draft preparation, R.B.; writing—review and editing, A.G., M.W.-W. and I.P.; visualization, R.B. and I.P.; supervision, A.G. and M.W.-W.; project administration, R.B. and A.G.; funding acquisition, A.G. All authors have read and agreed to the published version of the manuscript.

Funding

The study was financially supported by sources of the Ministry of Education and Science within funds of the Institute of Food Sciences of Warsaw University of Life Sciences (WULS), for scientific research.

Institutional Review Board Statement

Not applicable.

Informed Consent Statement

Not applicable.

Data Availability Statement

Not applicable.

Conflicts of Interest

The authors declare no conflict of interest.

References

  1. Karmee, S.K. A spent coffee grounds based biorefinery for the production of biofuels, biopolymers, antioxidants and biocomposites. Waste Manag. 2018, 72, 240–254. [Google Scholar] [CrossRef]
  2. Farah, A. Coffee Constituents. In Coffee: Emerging Health Effects and Disease Prevention; Chu, Y.F., Ed.; John Wiley & Sons: Hoboken, NJ, USA, 2012; pp. 21–58. [Google Scholar]
  3. Głowacka, R.; Górska, A.; Wirkowska-Wojdyła, M.; Wołosiak, R.; Majewska, E.; Derewiaka, D. The influence of brewing method on bioactive compounds residues in spent coffee grounds of different roasting degree and geographical origin. Int. J. Food Sci. Technol. 2019, 54, 3008–3014. [Google Scholar] [CrossRef]
  4. Arya, S.S.; Venkatram, R.; More, P.R.; Vijayan, P. The wastes of coffee bean processing for utilization in food: A review. J. Food Technol. 2021, 59, 429–444. [Google Scholar] [CrossRef] [PubMed]
  5. International Coffee Organization (ICO). Coffee Market Report, October 2017. Available online: http://www.ico.org/documents/cy2017-18/cmr-1017-e.pdf (accessed on 9 March 2023).
  6. International Coffee Organization (ICO). Statistics. Trade Statistics Tables. World Coffee Consumption. Available online: http://www.ico.org/prices/new-consumption-table.pdf (accessed on 9 March 2023).
  7. International Coffee Organization (ICO). Historical Data on the Global Coffee Trade. Available online: https://www.ico.org/new_historical.asp (accessed on 8 April 2023).
  8. Martuscelli, M.; Esposito, L.; Di Mattia, C.D.; Ricci, A.; Mastrocola, D. Characterization of Coffee Silver Skin as potential Food-Safe Ingredient. Foods 2021, 10, 1367. [Google Scholar] [CrossRef]
  9. Getachew, A.T.; Chun, B.S. Influence of pretreatment and modifiers on subcritical water liquefaction of spent coffee grounds: A green waste valorization approach. J. Clean. Prod. 2017, 142, 3719–3727. [Google Scholar] [CrossRef]
  10. Iriondo-DeHond, A.; Garcia, N.A.; Fernandez-Gomez, B.; Guisantes-Batan, E.; Escobar, F.V.; Blanch, G.P.; San Andres, M.I.; Sanchez-Fortun, S.; del Castillo, M.D. Validation of coffee by-products as novel food ingredients. Innov. Food Sci. Emerg. 2019, 51, 194–204. [Google Scholar] [CrossRef]
  11. Pearce, D.W.; Turner, R.K. Economics of Natural Resources and the Environment; Johns Hopkins University Press: Baltimore, MD, USA, 1989; pp. 29–42. [Google Scholar]
  12. Winans, K.; Kendall, A.; Deng, H. The history and current applications of the circular economy concept. Renew. Sust. Energ. Rev. 2017, 68, 825–833. [Google Scholar] [CrossRef]
  13. Muscio, A.; Sisto, R. Are agri-food systems really switching to a circular economy model? Implications for European research and innovation policy. Sustainability 2020, 12, 5554. [Google Scholar] [CrossRef]
  14. Esposito, B.; Sessa, M.R.; Sica, D.; Malandrino, O. Towards circular economy in the agri-food sector. A systematic literature review. Sustainability 2020, 12, 7401. [Google Scholar] [CrossRef]
  15. Hamam, M.; Chinnici, G.; Di Vita, G.; Pappalardo, G.; Pecorino, B.; Maesano, G.; D’Amico, M. Circular economy models in agro-food systems: A review. Sustainability 2021, 13, 3453. [Google Scholar] [CrossRef]
  16. Brzezińska, R.; Bryś, J.; Giers, O.; Bryś, A.; Górska, A.; Ostrowska-Ligęza, E.; Wirkowska-Wojdyła, M. Quality evaluation of plant oil blends interesterified by using immobilized Rhizomucor miehei lipase. Appl. Sci. 2022, 12, 11148. [Google Scholar] [CrossRef]
  17. Stahel, W.R. The circular economy. Nature 2016, 531, 435–438. [Google Scholar] [CrossRef]
  18. Bigdeloo, M.; Teymourian, T.; Kowsari, E.; Ramakrishna, S.; Ehsani, A. Sustainability and circular economy of food wastes: Waste reduction strategies, higher recycling methods, and improved valorization. Mater. Circ. Econ. 2021, 3, 1–9. [Google Scholar] [CrossRef]
  19. Pashova, S.; Radev, R.; Dimitrov, G.; Ivanov, J. Edible coatings in food industry related to circular economy. Qual. Access Success 2018, 19, 111–117. [Google Scholar]
  20. Loizia, P.; Neofytou, N.; Zorpas, A.A. The concept of circular economy strategy in food waste management for the optimization of energy production through anaerobic digestion. Environ. Sci. Pollut. Res. 2019, 26, 14766–14773. [Google Scholar] [CrossRef]
  21. Panwar, D.; Saini, A.; Panesar, P.S.; Chopra, H.K. Unraveling the scientific perspectives of citrus by-products utilization: Progress towards circular economy. Trends Food Sci. Technol. 2021, 111, 549–562. [Google Scholar] [CrossRef]
  22. Zhang, Q.; Dhir, A.; Kaur, P. Circular economy and the food sector: A systematic literature review. Sustain. Prod. Consum. 2022, 32, 655–668. [Google Scholar] [CrossRef]
  23. Pannila, N.; Jayalath, M.M.; Thibbotuwawa, A.; Nielsen, I.; Uthpala, T.G.G. Challenges in Applying Circular Economy Concepts to Food Supply Chains. Sustainability 2022, 14, 16536. [Google Scholar] [CrossRef]
  24. Mayson, S.; Williams, I.D. Applying a circular economy approach to valorize spent coffee grounds. Resour. Conserv. Recycl. 2021, 172, 105659. [Google Scholar] [CrossRef]
  25. Overturf, E.; Pezzutto, S.; Boschiero, M.; Ravasio, N.; Monegato, A. The CirCo (circular coffee) project: A case study on valorization of coffee silverskin in the context of circular economy in Italy. Sustainability 2021, 13, 9069. [Google Scholar] [CrossRef]
  26. Del Pozo, C.; Bartrolí, J.; Alier, S.; Puy, N.; Fàbregas, E. Production of antioxidants and other value-added compounds from coffee silverskin via pyrolysis under a biorefinery approach. Waste Manag. 2020, 109, 19–27. [Google Scholar] [CrossRef]
  27. Bessada, S.M.; Alves, C.R.; Oliveira, M.B.P.P. Coffee silverskin: A review on potential cosmetic applications. Cosmetics 2018, 5, 5. [Google Scholar] [CrossRef]
  28. Rodrigues, F.; Palmeira-de-Oliveira, A.; das Neves, J.; Sarmento, B.; Amaral, M.H.; Oliveira, M.B.P.P. Coffee silverskin: A possible valuable cosmetic ingredient. Pharm. Biol. 2015, 53, 386–394. [Google Scholar] [CrossRef]
  29. Martins, S.; Mussatto, S.I.; Martínez-Avila, G.; Montañez-Saenz, J.; Aguilar, C.N.; Teixeira, J.A. Bioactive phenolic compounds: Production and extraction by solid-state fermentation. A review. Biotechnol. Adv. 2011, 29, 365–373. [Google Scholar] [CrossRef]
  30. Mesías, M.; Delgado-Andrade, C. Melanoidins as a potential functional food ingredient. Curr. Opin. Food Sci. 2017, 14, 37–42. [Google Scholar] [CrossRef]
  31. Rodríguez-Meizoso, I.; Jaime, L.; Santoyo, S.; Señoráns, F.J.; Cifuentes, A.; Ibáñez, E. Subcritical water extraction and characterization of bioactive compounds from Haematococcus pluvialis microalga. J. Pharmaceut. Biomed. 2010, 51, 456–463. [Google Scholar] [CrossRef]
  32. Borrelli, R.C.; Esposito, F.; Napolitano, A.; Ritieni, A.; Fogliano, V. Characterization of a new potential functional ingredient: Coffee silverskin. J. Agric. Food Chem. 2004, 52, 1338–1343. [Google Scholar] [CrossRef]
  33. Rehman, Z.U. Evaluation of antioxidant activity of methanolic extract from peanut hulls in fried potato chips. Plant Food Hum. Nutr. 2003, 58, 75–83. [Google Scholar] [CrossRef]
  34. Anand, S.P.; Sati, N. Artificial preservatives and their harmful effects: Looking toward nature for safer alternatives. Int. J. Pharm. Sci. Res. 2013, 4, 2496–2501. [Google Scholar]
  35. Azmir, J.; Zaidul, I.S.M.; Rahman, M.M.; Sharif, K.M.; Mohamed, A.; Sahena, F.; Jahurul, M.H.A.; Ghafoor, K.; Norulaini, N.A.N.; Omar, A.K.M. Techniques for extraction of bioactive compounds from plant materials: A review. J. Food Eng. 2013, 117, 426–436. [Google Scholar] [CrossRef]
  36. Piasecka, I.; Wiktor, A.; Górska, A. Alternative methods of bioactive compounds and oils extraction from berry fruit by-products—A review. Appl. Sci. 2022, 12, 1734. [Google Scholar] [CrossRef]
  37. Ballesteros, L.F.; Teixeira, J.A.; Mussatto, S.I. Selection of the solvent and extraction conditions for maximum recovery of antioxidant phenolic compounds from coffee silverskin. Food Bioprocess Technol. 2014, 7, 1322–1332. [Google Scholar] [CrossRef]
  38. Usman, I.; Hussain, M.; Imran, A.; Afzaal, M.; Saeed, F.; Javed, M.; Afzal, A.; Ashfaq, I.; Al Jbawi, E.; Saewan, S.A. Traditional and innovative approaches for the extraction of bioactive compounds. Int. J. Food Prop. 2022, 25, 1215–1233. [Google Scholar] [CrossRef]
  39. Bezerra, M.A.; Santelli, R.E.; Oliveira, E.P.; Villar, L.S.; Escaleira, L.A. Response surface methodology (RSM) as a tool for optimization in analytical chemistry. Talanta 2008, 76, 965–977. [Google Scholar] [CrossRef]
  40. Latha, S.; Sivaranjani, G.; Dhanasekaran, D. Response surface methodology: A non-conventional statistical tool to maximize the throughput of Streptomyces species biomass and their bioactive metabolites. Crit. Rev. Microbiol. 2017, 43, 567–582. [Google Scholar] [CrossRef]
  41. Weremfo, A.; Abassah-Oppong, S.; Adulley, F.; Dabie, K.; Seidu-Larry, S. Response surface methodology as a tool to optimize the extraction of bioactive compounds from plant sources. J. Sci. Food Agric. 2023, 103, 26–36. [Google Scholar] [CrossRef]
  42. Box, G.E.; Wilson, K.B. On the Experimental Attainment of Optimum Conditions. In Breakthroughs in Statistics; Springer Series in Statistics; Kotz, S., Johnson, N.L., Eds.; Springer: New York, NY, USA, 1992; pp. 270–310. [Google Scholar]
  43. Candioti, L.V.; De Zan, M.M.; Cámara, M.S.; Goicoechea, H.C. Experimental design and multiple response optimization. Using the desirability function in analytical methods development. Talanta 2014, 124, 123–138. [Google Scholar] [CrossRef]
  44. Said, K.A.M.; Amin, M.A.M. Overview on the response surface methodology (RSM) in extraction processes. J. Appl. Sci. Process Eng. 2015, 2, 8–17. [Google Scholar]
  45. Roshani Neshat, R.; Bimakr, M.; Ganjloo, A. Effects of Zedo gum edible coating enriched with microwave-agitated bed extracted bioactive compounds from lemon verbena leaves on oxidative stability of Oncorhynchus mykiss. J. Food Meas. Charact. 2022, 16, 4388–4401. [Google Scholar] [CrossRef]
  46. Polish Norm: PN-ISO 3534-2:2010; Statistics—Vocabulary and Symbols—Part 2: Applied Statistics. Polish Committee for Standardization: Warsaw, Poland, 2010.
  47. Singleton, V.L.; Rossi, J.A. Colorimetry of total phenolics with phosphomolybdic-phosphotungstic acid reagents. Am. J. Enol. Viticult. 1965, 16, 144–158. [Google Scholar] [CrossRef]
  48. Re, R.; Pellegrini, N.; Proteggente, A.; Pannala, A.; Yang, M.; Rice-Evans, C. Antioxidant activity applying an improved ABTS radical cation decolorization assay. Free Radic. Biol. Med. 1999, 26, 1231–1237. [Google Scholar] [CrossRef]
  49. Benzie, I.F.; Strain, J.J. The ferric reducing ability of plasma (FRAP) as a measure of “antioxidant power”: The FRAP assay. Anal. Biochem. 1996, 239, 70–76. [Google Scholar] [CrossRef]
  50. Chung, H.S.; Kim, D.H.; Youn, K.S.; Lee, J.B.; Moon, K.D. Optimization of roasting conditions according to antioxidant activity and sensory quality of coffee brews. Food Sci. Biotechnol. 2013, 22, 23–29. [Google Scholar] [CrossRef]
  51. Glowacka, R.; Górska, A.; Wirkowska-Wojdyla, M. Kawowa łuska srebrzysta-nowa, naturalna alternatywa pozyskiwania wybranych związków bioaktywnych. Zeszyty Problemowe Postępów Nauk Rolniczych 2018, 592, 15–25. [Google Scholar] [CrossRef]
  52. Wijekoon, M.J.O.; Bhat, R.; Karim, A.A. Effect of extraction solvents on the phenolic compounds and antioxidant activities of bunga kantan (Etlingera elatior Jack.) inflorescence. J. Food Compos. Anal. 2011, 24, 615–619. [Google Scholar] [CrossRef]
  53. Haminiuk, C.W.I.; Plata-Oviedo, M.S.V.; de Mattos, G.; Carpes, S.T.; Branco, I.G. Extraction and quantification of phenolic acids and flavonols from Eugenia pyriformis using different solvents. J. Food Sci. Technol. 2014, 51, 2862–2866. [Google Scholar] [CrossRef] [PubMed]
  54. Gokhan, Z.; Sinan, K.I.; Mahomoodally, M.F.; Angeloni, S.; Mustafa, A.M.; Vittori, S.; Maggi, F.; Caprioli, G. Chemical composition, antioxidant and enzyme inhibitory properties of different extracts obtained from spent coffee ground and coffee silverskin. Foods 2020, 9, 713. [Google Scholar]
  55. Gorinstein, S.; Zachwieja, Z.; Katrich, E.; Pawelzik, E.; Haruenkit, R.; Trakhtenberg, S.; Martin-Belloso, O. Comparison of the contents of the main antioxidant compounds and the antioxidant activity of white grapefruit and his new hybrid. LWT—Food Sci. Technol. 2004, 37, 337–343. [Google Scholar] [CrossRef]
  56. Sariburun, E.; Sahin, S.; Demir, C.; Turkben, C.; Uylaser, V. Phenolic content and antioxidant activity of raspberry and blackberry cultivars. J. Food Sci. 2010, 75, 328–335. [Google Scholar] [CrossRef]
  57. Yeong, J.-H.; Jung, H.; Lee, S.-R.; Lee, H.-J.; Hwang, K.T.; Kim, T.-Y. Anti-oxidant, anti-proliferative and anti-inflammatory activities of the extracts from black raspberry fruits and wine. Food Chem. 2010, 123, 338–344. [Google Scholar]
  58. Gan, C.Y.; Latiff, A.A. Optimisation of the solvent extraction of bioactive compounds from Parkia speciosa pod using response surface methodology. Food Chem. 2011, 124, 1277–1283. [Google Scholar] [CrossRef]
  59. Bhatt, B.D.; Parajuli, G.C. Study on total phenolic content (TPC), total flavonoid content (TFC), and antioxidant activities of Urtica dioica of Nepalese origin. J. Nepal Chem. Soc. 2017, 37, 113–118. [Google Scholar] [CrossRef]
  60. Yousuf, S.; Shabir, S.; Kauts, S.; Minocha, T.; Obaid, A.A.; Khan, A.A.; Mujalli, A.; Jamous, Y.F.; Almaghrabi, S.; Baothman, B.K.; et al. Appraisal of the antioxidant activity, polyphenolic content, and characterization of selected himalayan herbs: Anti-proliferative potential in HepG2 cells. Molecules 2022, 27, 8629. [Google Scholar] [CrossRef]
  61. Seal, T.; Chaudhuri, K.; Pillai, B.; Chakrabarti, S.; Mondal, T.; Auddy, B. Evaluation of antioxidant activities, toxicity studies and the DNA damage protective effect of various solvent extracts of Litsea cubeba fruits. Heliyon 2020, 6, e03637. [Google Scholar] [CrossRef]
  62. Zeroual, A.; Sakar, E.H.; Mahjoubi, F.; Chaouch, M.; Chaqroune, A.; Taleb, M. Effects of extraction technique and solvent on phytochemicals, antioxidant, and antimicrobial activities of cultivated and wild rosemary (Rosmarinus officinalis L.) from taounate region (Northern Morocco). Biointerface Res. Appl. Chem. 2022, 12, 8441–8452. [Google Scholar]
  63. DiNardo, A.; Brar, H.S.; Subramanian, J.; Singh, A. Optimization of microwave-assisted extraction parameters and characterization of phenolic compounds in Yellow European Plums. Can. J. Chem. Eng. 2018, 97, 256–267. [Google Scholar] [CrossRef]
  64. Sik, B.; Ajtony, Z.; Lakatos, E.; Szekelyhidi, R. The effects of extraction conditions on the antioxidant activities, total polyphenol and monomer anthocyanin contents of six edible fruits growing wild in Hungary. Heliyon 2022, 8, e12048. [Google Scholar] [CrossRef]
  65. Zuorro, A.; Lavecchia, R. Influence of extraction conditions on the recovery of phenolic antioxidants from spent coffee grounds. Am. J. Appl. Sci. 2013, 10, 478–486. [Google Scholar] [CrossRef]
  66. Medina-Torres, N.; Ayora-Talavera, T.; Espinosa-Andrews, H.; Sanchez-Contreras, A.; Pacheco, N. Ultrasound assisted extraction for the recovery of phenolic compounds from vegetable sources. Agronomy 2017, 7, 47. [Google Scholar] [CrossRef]
  67. Rasul, M.G. Conventional extraction methods use in medicinal plants, their advantages and disadvantages. Int. J. Basic Sci. Appl. Comput. 2018, 2, 10–14. [Google Scholar]
  68. Guglielmetti, A.; D’ignoti, V.; Ghirardello, D.; Belviso, S.; Zeppa, G. Optimisation of ultrasound and microwave-assisted extraction of caffeoylquinic acids and caffeine from coffee silverskin using response surface methodology. Ital. J. Food Sci. 2017, 29, 409–423. [Google Scholar]
  69. Ginting, A.R.; Kit, T.; Mingvanish, W.; Thanasupsin, S.P. Valorization of Coffee Silverskin through Subcritical Water Extraction: An Optimization Based on T-CQA Using Response Surface Methodology. Sustainability 2022, 14, 8435. [Google Scholar] [CrossRef]
Figure 1. Representative chromatograms of ethanolic CS extract for 3−CQA (A) and caffeine (B) detected by means of spectrophotometric detector UVD 170S at 325 nm and 276 nm, respectively.
Applsci 13 05388 g001
Figure 2. Pareto charts showing the effects of the tested extraction factors during the first stage of experimental design (type and concentration of the used solvent, SMR, extraction time, and type of used extraction apparatus) on the antioxidant activity measured by the ABTS assay (a) and TPC determination (b).
Applsci 13 05388 g002
Figure 3. Pareto charts of ethanol concentration, SMR, extraction time, and type of used extraction apparatus on the antioxidant activity measured by the ABTS assay (a) and TPC determination (b).
Applsci 13 05388 g003
Figure 4. Pareto charts showing the effects of the tested extraction factors (ethanol concentration and SMR) and their interaction during the second stage of extraction optimization experimental design on the antioxidant activity measured by the ABTS (a) and FRAP (b) assays, TPC determination (c), BI (browning index) absorbance measurements (d), chromatographic analysis of caffeine (e) and chlorogenic acid, 3−CQA (f) contents. (L) and (Q) correspond to the effects at linear and quadratic levels, respectively.
Applsci 13 05388 g004aApplsci 13 05388 g004b
Figure 5. Surface response plots and the corresponding contour plots representing the antioxidant activity measured by ABTS (a) and FRAP (b) assays, the TPC determination (c), BI (browning index) absorbance measurements (d), chromatographic analysis of caffeine (e) and chlorogenic acid, 3−CQA (f) contents, used to assess CS extracts characteristics obtained in the second stage of extraction optimization experimental design.
Applsci 13 05388 g005
Figure 6. Optimum region by overlay plots of the six analytical RSM responses (ABTS and FRAP assays, TPC determination, BI (browning index) absorbance measurements, chromatographic analysis of caffeine and chlorogenic acid (3−CQA) as a function of the ethanol concentration and SMR applied in the second stage of extraction optimization experimental design. The variables are shown in their original levels.
Applsci 13 05388 g006
Table 1. Experimental design layout applied in the first stage of extraction optimization of bioactive compounds from coffee silverskin. The extraction process variables are shown as real and (coded) values. US *—ultrasound assisted extraction, extraction conducted with ultrasound bath (w) or laboratory shaker with water bath (wo).
Type of SampleMethanol/EthanolWater
Solvent Concentration [%]Time
[min]
SMR
[cm3/g]
US *Time
[min]
SMR
[cm3/g]
US *
160 (−1)30 (−1)10 (−1)w (+1)30 (−1)10 (−1)w (+1)
2100 (+1)30 (−1)10 (−1)w (+1)90 (+1)10 (−1)w (+1)
360 (−1)90 (+1)10 (−1)w (+1)30 (−1)40 (+1)w (+1)
4100 (+1)90 (+1)10 (−1)w (+1)90 (+1)40 (+1)w (+1)
560 (−1)30 (−1)40 (+1)w (+1)30 (−1)10 (−1)wo (−1)
6100 (+1)30 (−1)40 (+1)w (+1)90 (+1)10 (−1)wo (−1)
760 (−1)90 (+1)40 (+1)w (+1)30 (−1)40 (+1)wo (−1)
8100 (+1)90 (+1)40 (+1)w (+1)90 (+1)40 (+1)wo (−1)
960 (−1)30 (−1)10 (−1)wo (−1)---
10100 (+1)30 (−1)10 (−1)wo (−1)---
1160 (−1)90 (+1)10 (−1)wo (−1)---
12100 (+1)90 (+1)10 (−1)wo (−1)---
1360 (−1)30 (−1)40 (+1)wo (−1)---
14100 (+1)30 (−1)40 (+1)wo (−1)---
1560 (−1)90 (+1)40 (+1)wo (−1)---
16100 (+1)90 (+1)40 (+1)wo (−1)---
Table 2. Experimental design layout applied in the second stage of extraction optimization of bioactive compounds from coffee silverskin. The extraction process variables are shown as real and (coded) values.
Type of SampleSolvent Concentration [%]SMR [cm3/g]
120 (−1)20 (−1)
280 (+1)20 (−1)
320 (−1)60 (+1)
480 (+1)60 (+1)
57.58 (−1.414)40 (0)
692.42 (+1.414)40 (0)
750 (0)11.72 (−1.414)
850 (0)68.28 (+1.414)
950 (0)40 (0)
1050 (0)40 (0)
Table 3. The results of the applied RSM responses in the first stage of extraction optimization experimental design—ABTS and TPC assays values for tested variants of methanolic, ethanolic, and aqueous CS extracts.
Type of SampleMethanolEthanolWater
ABTS [μmol Trolox/g d.m.]TPC [μmol GAE/g d.m.]ABTS [μmol Trolox/g d.m.]TPC [μmol GAE/g d.m.]ABTS [μmol Trolox/g d.m.]TPC [μmol GAE/g d.m.]
133.43 ± 0.6218.91 ± 0.1535.52 ± 0.2927.57 ± 0.2711.66 ± 0.2913.46 ± 0.10
224.75 ± 1.0515.47 ± 0.1923.65 ± 1.4922.10 ± 0.1711.65 ± 0.2713.15 ± 0.11
326.90 ± 0.8423.08 ± 0.2432.37 ± 0.3827.17 ± 0.1456.65 ± 1.4524.27 ± 0.71
422.92 ± 1.1415.96 ± 0.1123.97 ± 1.0524.95 ± 0.2464.16 ± 0.7227.44 ± 0.99
571.54 ± 1.0146.39 ± 0.4670.27 ± 0.8148.44 ± 0.6414.94 ± 0.1616.91 ± 0.09
673.90 ± 1.3336.30 ± 0.9365.10 ± 1.4125.95 ± 0.8811.16 ± 0.2313.07 ± 0.04
752.28 ± 1.4342.46 ± 0.8156.93 ± 1.6037.53 ± 0.4951.46 ± 1.6527.30 ± 0.33
862.40 ± 1.1729.60 ± 1.1770.34 ± 0.8934.02 ± 1.3648.00 ± 1.7624.18 ± 1.73
941.57 ± 0.4522.98 ± 0.0631.16 ± 0.6821.36 ± 0.11--
1023.46 ± 0.7216.71 ± 0.0518.62 ± 0.7118.52 ± 0.07--
1138.64 ± 0.2823.65 ± 0.1525.31 ± 0.5519.94 ± 0.13--
1226.61 ± 0.2015.69 ± 0.1722.76 ± 0.6917.09 ± 0.20--
1392.48 ± 1.8937.46 ± 0.5686.61 ± 2.8442.18 ± 0.69--
1461.43 ± 1.5628.30 ± 0.8260.22 ± 1.0630.06 ± 0.55--
1580.78 ± 1.0235.61 ± 0.3993.05 ± 1.8944.79 ± 0.65--
1663.49 ± 1.0742.12 ± 1.2158.22 ± 0.6630.74 ± 1.28--
Table 4. The results of the applied RSM responses in the second stage of extraction optimization experimental design—ABTS, FRAP, TPC, BI assays values and caffeine and chlorogenic acids contents for tested variants of ethanolic CS extracts.
Type of SampleABTS
[µmol Trolox/
g CS d.m.]
FRAP
[µmol Fe(II)/g CS d.m.]
TPC
[µmol GAE/
g CS d.m.]
BI
[Abs420]
Caffeine
[mg/g CS d.m.]
3−CQA
[mg/g CS d.m.]
154.63 ± 0.5490.50 ± 2.8838.73 ± 0.560.401 ± 0.0065.16 ± 0.260.324 ± 0.009
264.57 ± 1.29124.24 ± 1.0549.29 ± 0.570.364 ± 0.0036.09 ± 0.020.428 ± 0.002
372.98 ± 1.24139.94 ± 2.4843.88 ± 1.610.201 ± 0.0066.60 ± 0.010.356 ± 0.001
490.51 ± 1.10183.15 ± 0.7454.37 ± 1.680.187 ± 0.0046.75 ± 0.060.415 ± 0.003
562.22 ± 0.96131.25 ± 1.3743.46 ± 0.760.260 ± 0.0076.34 ± 0.060.401 ± 0.003
673.68 ± 0.86138.29 ± 1.3741.07 ± 0.640.202 ± 0.0066.77 ± 0.270.383 ± 0.001
737.22 ± 0.3465.77 ± 0.4424.25 ± 0.330.373 ± 0.0063.23 ± 0.060.292 ± 0.005
882.42 ± 2.49161.87 ± 2.3052.67 ± 1.720.233 ± 0.0056.67 ± 0.100.200 ± 0.002
9101.67 ± 0.94130.69 ± 0.7150.31 ± 1.110.297 ± 0.0055.94 ± 0.060.447 ± 0.004
10102.63 ± 0.92132.55 ± 0.7151.04 ± 1.310.297 ± 0.0136.15 ± 0.060.430 ± 0.005
Table 5. Formulas describing mathematical models matched to the data from the second stage of extraction optimization experimental design (x—extractant concentration, y—SMR) and the values of the coefficient of determination (R2) of the obtained mathematical models.
Tested RSM ResponseSimplified Fitted FunctionR2Model p-ValueLack-of-Fit p-Value
ABTS assay−47.02 + 1.74x − 0.02x2 + 4.37y − 0.05y2 + 0.003xy0.960.00510.3510
FRAP assay35.35 + 0.40x − 0.002x2 + 2.53y − 0.02y2 + 0.004xy0.790.00810.1834
TPC assay−0.61 + 0.46x − 0.001x2 + 1.57y − 0.01y2 − 0.01xy0.530.03440.1073
BI (Abs420)0.43 + 0.002x − 3 × 10−5x2 − 0.005y + 2 × 10⁻⁵y2 + 6 × 10⁻⁶xy0.910.00370.4172
Caffeine (HPLC)2.81 + 0.01x − 7 × 10−5x2 + 0.11y − 0.001y2 + 2 × 10⁻⁴xy0.590.04730.0981
3-CQA (HPLC)0.01 + 0.002x – 2 × 10−5x2 + 0.01y – 5 × 10⁻⁵y2 − 10−5xy0.770.01050.2376
Table 6. Verification of the mathematical models of the tested RSM responses—approximate values predicted by statistical analysis according to the fitted models and actual values of validation tests.
Tested RSM ResponseApproximated ValueActual ValueDeviation [%]
ABTS [µmol Trolox/g CS d.m.]101.86101.6−0.25
FRAP [µmol Fe(II)/g CS d.m.]131.96132.30.25
TPC [µmol GAE/g CS d.m.]50.8652.32.83
BI (Abs420)0.300.29−3.33
Caffeine [mg/g CS d.m.]6.045.9−2.32
3-CQA [mg/g CS d.m.]0.210.224.76
Disclaimer/Publisher’s Note: The statements, opinions and data contained in all publications are solely those of the individual author(s) and contributor(s) and not of MDPI and/or the editor(s). MDPI and/or the editor(s) disclaim responsibility for any injury to people or property resulting from any ideas, methods, instructions or products referred to in the content.

