


Abstract
In this study, the effective value of low-frequency (50 Hz) and high-frequency (700–2500 MHz) broadband electric field exposures was measured for 24 h in four different selected environments in a house. All the statistical values of 1000 data points recorded with two measuring devices for 24 h in each environment are calculated, the most appropriate curves are fitted to the data, and the curves are plotted by expressing their changes with respect to time. All statistical and parametric values of the density and cumulative probability functions of the curves are calculated and plotted. In broadband measurements, the broadband is divided into fifteen sub-bands, but the data are available in only six of these sub-bands. The six-layer human head model is created by using the middle frequencies of the six sub-bands used, and taking the permittivity (εr) and conductivity (σ) of each layer into consideration. The specific absorption rate (SAR) value in the brain is calculated by using the total transmission coefficient of six layers. The SAR value surrounding the head is obtained. These SAR values are interpreted by considering the Federal Communications Commission (FCC) and the Community European (CE) occupational and general public SAR limits.
1. Introduction
The rapid development of technology brings with it the result of living in an intense electromagnetic field. In our homes, there is low (50 Hz) frequency electromagnetic field exposure from the mains, which is required by all electrical household appliances, and from lighting. In addition, there is also broadband-induced electromagnetic field exposure. Technology, which has an important role in shaping society, necessitates living in electromagnetic fields of varying amplitude, from the low-frequency (50 Hz) formed by network and overhead lines to the high-frequency of the Ku (10–12 GHz) band of satellite broadcasts. Especially with the advent of the 5G system, the frequency used in communication has increased, and the damage it has caused on human tissue has increased even more since they have greater energy. Electromagnetic exposure has become a destiny in modern societies. Therefore, knowing both low and GSM-induced electromagnetic field exposure in the environments we live in is very important for the health and mental relaxation of the people in the environment. Based on this result, both low- and broadband-based measurements were made in four places where people living in a home environment spend a lot of time. The measurements were carried out in such a way that the devices saved 1000 data points in their memory for 24 h. In the measurements made, the effective value of the electric field was recorded. The data in all measurements were compared with the limit values determined by the International Radiation Protection Association (ICNIRP). In broadband-based measurements, the band between 700 MHz and 2500 MHz were divided into 15 bands, the band of the data was determined, and their statistical values were calculated. At the same time, the data received from the memory of the devices were plotted in MATLAB, depending on the time.
Some studies in this field are presented below. In addition to the low-frequency electric field measurements made in six minutes at 30 different points in the city center of Diyarbakir (Turkey), magnetic field measurements were made under the high voltage line within a one-hour period, and these measurement values were shown graphically. In the 50 Hz electric field measurements made at 30 points, it was noted that the limit value of 5000 V/m determined by ICNIRP was exceeded at three points [1]. Internal substations (TSs) commonly used in Spain are located inside residential buildings on the ground floor. The electromagnetic field emitted by these transformers causes people living in the surrounding buildings to be exposed to these fields. The Spanish municipality of Silla (Valencia, Spain) made measurements to determine the electromagnetic field level that people living in the buildings near these substations are exposed to, especially in places where they spend most of their time, such as bedrooms and living rooms, and whether this level is above the limit values determined in terms of health. In light of the measurements, it is recommended that the rooms in the house where the exposure is low be used as a living room or bedroom [2]. Measurements were made within six minutes in three micro-regions (school, home, and office) where the electromagnetic field is concentrated, and the average value of the field and its percentages in the GSM band are indicated (Belgium) [3]. In this study, a 24-question questionnaire consisting of different variables was applied to 80 selected personnel in Corlu (Tekirdag, Turkey) state hospital to determine the level of electromagnetic field exposure and to investigate its effects on the personnel working in this hospital. In order to determine the electromagnetic field, measurements were made in different parts of the hospital, and according to these measurements and the analysis results of the questionnaire, a statistically significant relationship was found between headache, weakness, irritability, fatigue, and forgetfulness and the electromagnetic field level in the environment where the hospital staff were [4]. Some studies have shown that the male reproductive system is one of the most sensitive organs to electromagnetic radiation. A study was conducted to elucidate the relationship between epigenetics and radiation. Studies on mice have shown that mice exposed to a certain magnetic field cause abnormal deoxyribonucleic acid (DNA) methylation on their genes [5]. In this study, magnetic field measurements were made around medium- and high-voltage transmission lines. In the regions 75 m away from the transmission lines in Antalya (Turkey), there are home school, etc. The electric fields and current densities induced by living people have been investigated [6]. There has been research on how electromagnetic fields affect multiple body functions (India) [7]. In our world created by modern technology, low-frequency electromagnetic field values created by the use of electrical devices have been measured and compared with limit values (Italy) [8]. Low (50 Hz) frequency and broadband (700 MHz–2500 MHz) high-frequency electric field effective values were measured at 32 points between the hours of 10:00 am. and 03:00 pm. on the central campus of Ordu University (Turkey). The measurements are set to save five values in the memory of the devices in six minutes at each point. Measurement results were plotted with MATLAB, and curves were fitted to the measurement values [9]. 50 Hz and broadband-sourced electric field effective value measurements were made in the selected region, and it was observed that the measured values were below the limit values (Turkey) [10]. In a study, it is aimed to evaluate the suitability of the work areas in terms of occupational health and safety by comparing the electromagnetic field levels in the work areas with national and international limit values, to determine the possible health effects of electromagnetic fields on the employees, to contribute to epidemiological and experimental research by determining the awareness levels of the employees on this issue, and to contribute to the electromagnetic field (Turkey) [11]. Electromagnetic field values created by television (Tv), radio, mobile phone, and wireless communication devices in closed environments (offices, public transportation vehicles) have been measured and evaluated in Italy [12]. An epidemiological study was conducted in France to investigate the effects of radiofrequency electromagnetic fields (RF-EMF) on humans. In that study, measurements were taken at a distance of 250 m from the base station in 354 houses. The study is the first to assess the RF-EMF exposure of people living near mobile phone base stations (MPBS) in urban areas in France. According to that study, there were significant differences in measurements between day and night and between weekdays and weekends [13]. The health effects of exposure to high voltage have been investigated [14]. A study was conducted to review the findings of 50 Hz exposure measurement studies conducted in European countries [15]. A study was carried out in order to determine the electromagnetic field value to which health personnel working in magnetic resonance imaging devices and diathermy devices are exposed in eleven different institutions operating in the health sector [16]. Electromagnetic field values were measured at 44 different points on Marmara University’s Goztepe (Istanbul, Turkey) campus, and it was observed that all of these measured values were below the limit values [17]. In a study, EMF values created by all wireless networks were measured five times on different days and times in business, entertainment, and shopping centers in the city center of the USA, Columbia, SC. Then, the statistics of these measurement values were made [18]. In addition to the RF-EMF measurement results and methods made so far, a forward-looking study has been conducted, asking which methods and parameters should be used to guide these methods in future studies [19]. Nilufer municipality (Bursa, Turkey) has prepared and presented these results in a report as a result of measurements and observations made at 74 points on 5–6 March 2007 to determine the level of electromagnetic pollution originating from high-voltage lines, transformers, and base stations within the borders of Bursa [20]. Within the coverage area of the base station located in the Bahcelievler neighborhood in the city center of Ordu (Turkey), the effective value measurement of the broadband-sourced electric field was made at 49 points, starting from the point close to the base station and moving away from the base station, provided that it remains within the coverage area. Results are shown on the map using Google Earth [21]. Broadband-sourced electric field effective value measurement was made at 500 points in the city center of Ordu (Turkey). In addition, 24 h measurements were taken in the houses opposite the base stations in the measurement areas, and the results of the measurements were evaluated [22]. For the measurement of the exposure values of infants living in Turkey to the electromagnetic field originating from GSM, the city of Izmir was selected as the pilot region, and the results were evaluated by measuring the electromagnetic field in the environments where a total of 151 babies living in certain houses in this city lived [23]. The electromagnetic field created by transformers and high-voltage lines in certain public areas in Konya (Turkey) city center was measured, and the results were compared with the limit values [24]. To find the SAR value of the electromagnetic field emitted by mobile phones in the human heart region, the values obtained by electrically modeling the heart were analyzed using the finite difference time domain method (FDTD) using MATLAB and compared with the limit values [25]. It is known that exposure to a non-ionizing electromagnetic field increases the temperature of cells in the human body, and its limits are determined in this way. In this study, it was determined that the fact that exposure can go beyond temperature in 5G should be shared with the public because the determined limits only take into account the thermal heating of the cell [26]. An electrical voxel model was created to represent the SAR value of mobile phones on the human head for a family of seven people. In this model, it is assumed that the youngest individual is 8 months old and the two oldest individuals are 43 years old. The distance between the hand holding the mobile phone and the head was modeled using the CST program, starting from 10 mm in 10 mm increments up to 40 mm [27]. The studies carried out in this field so far show that even if the electric field values are below the limit values, they not only heat the cells but also pose health risks.
2. Materials and Methods
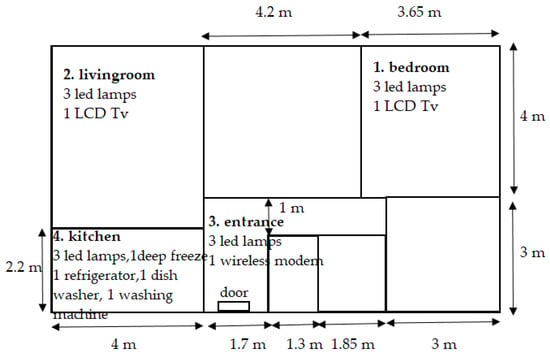
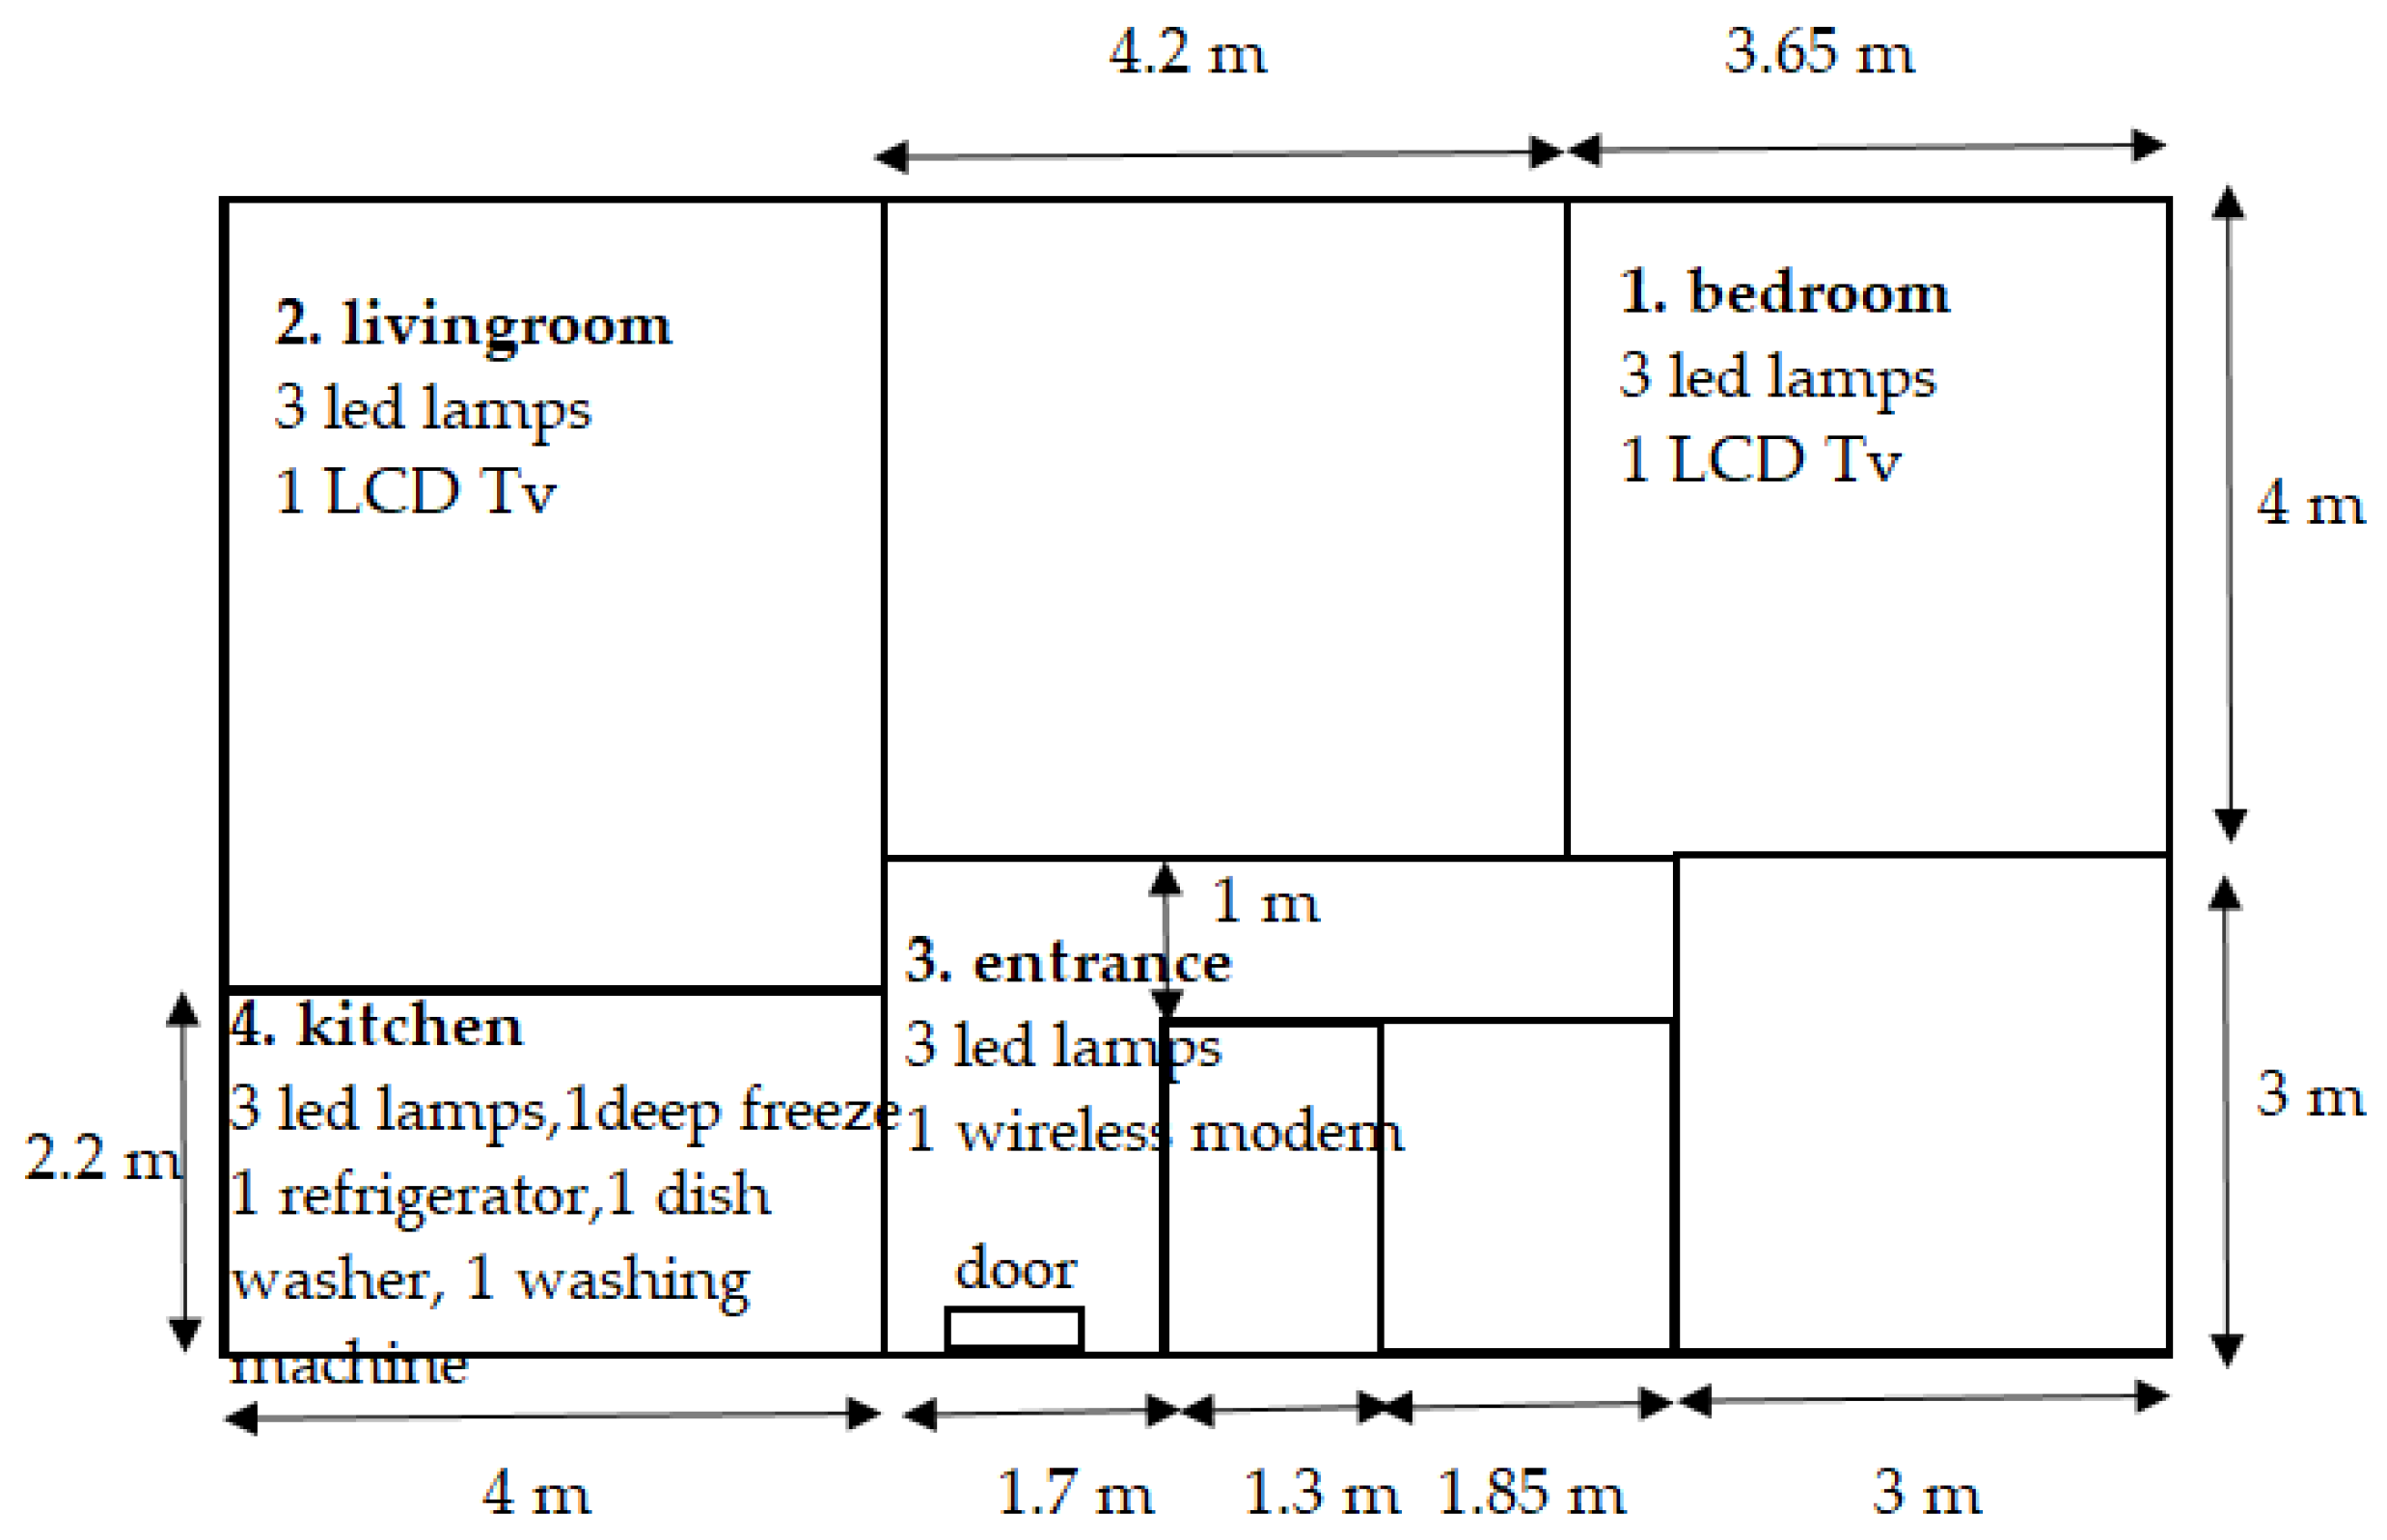
In a home environment, there are low-frequency electromagnetic wave emitters originating from the mains voltage used by lighting and electronic devices and high-frequency (broadband) electromagnetic wave emitters such as mobile phones and wireless modems. Figure 1 shows the four environments (bedroom, living room, entrance, and kitchen) in which measurements were made and the list of low- and high-frequency electromagnetic emitters in these four environments. The height of the measured floor from the ground is 15 m. Both the interior and exterior walls of the floor consist of 13 cm of bricks and 1 cm of concrete on top of the bricks.
Figure 1.
Measurement environments and electronic devices in the environment.
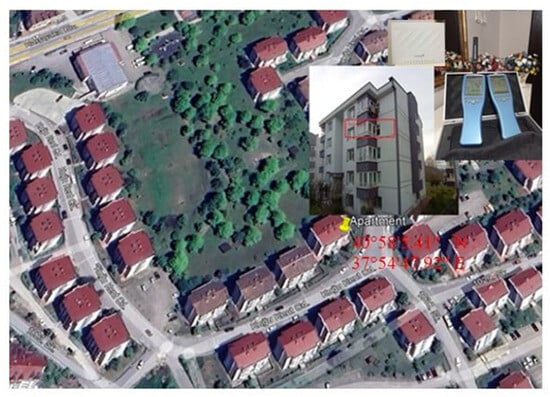
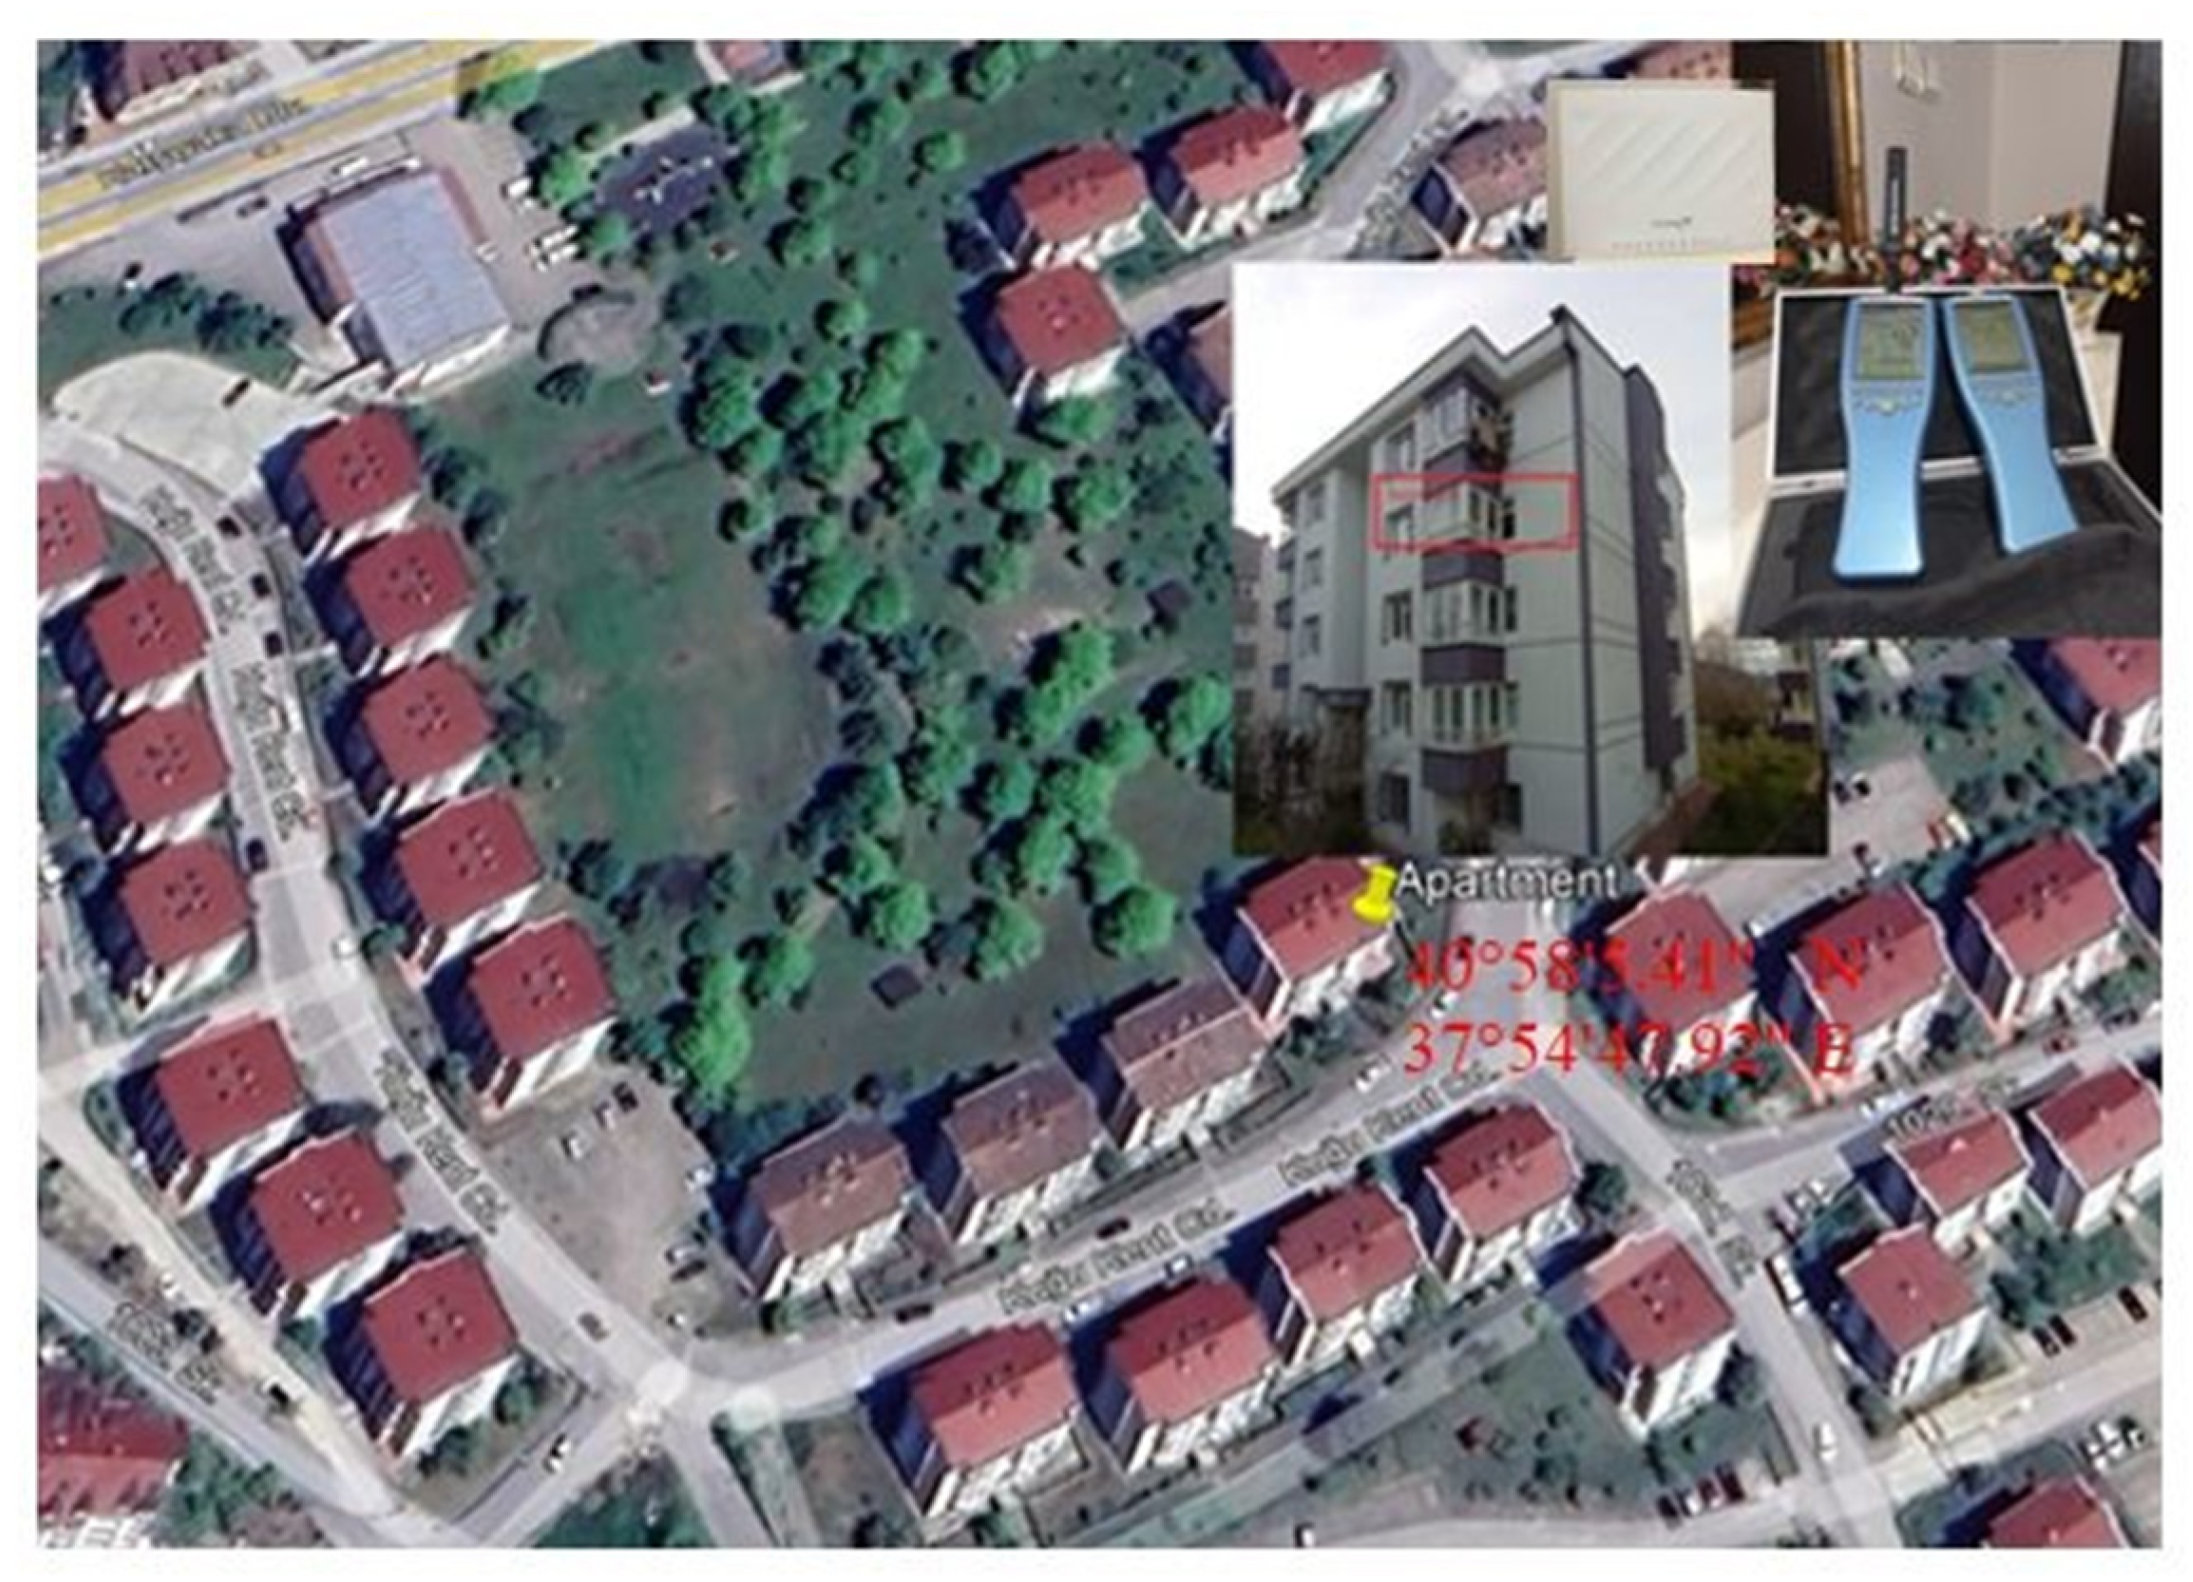
Figure 2 shows the building, floor, wireless modem, devices where the measurement was made, and location and coordinate information via Google Earth.
Figure 2.
Measurement place and measuring instruments.
There are institutions and organizations that determine the impact of both low- and high-frequency electromagnetic waves on human health, both the electric field and the limits of the SAR values created by these electric fields, especially on the human head, both nationally and internationally, depending on the frequency. While there may be countries that apply these international limit values as they are, there are countries that accept and implement values smaller than these values.
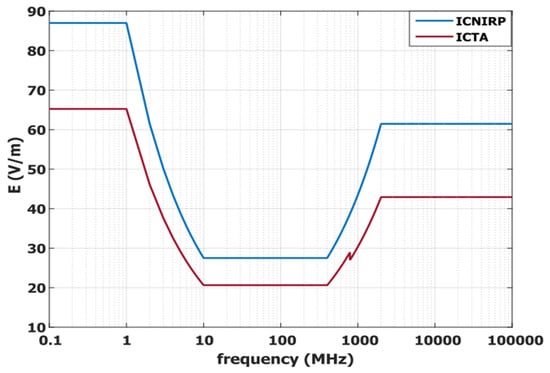
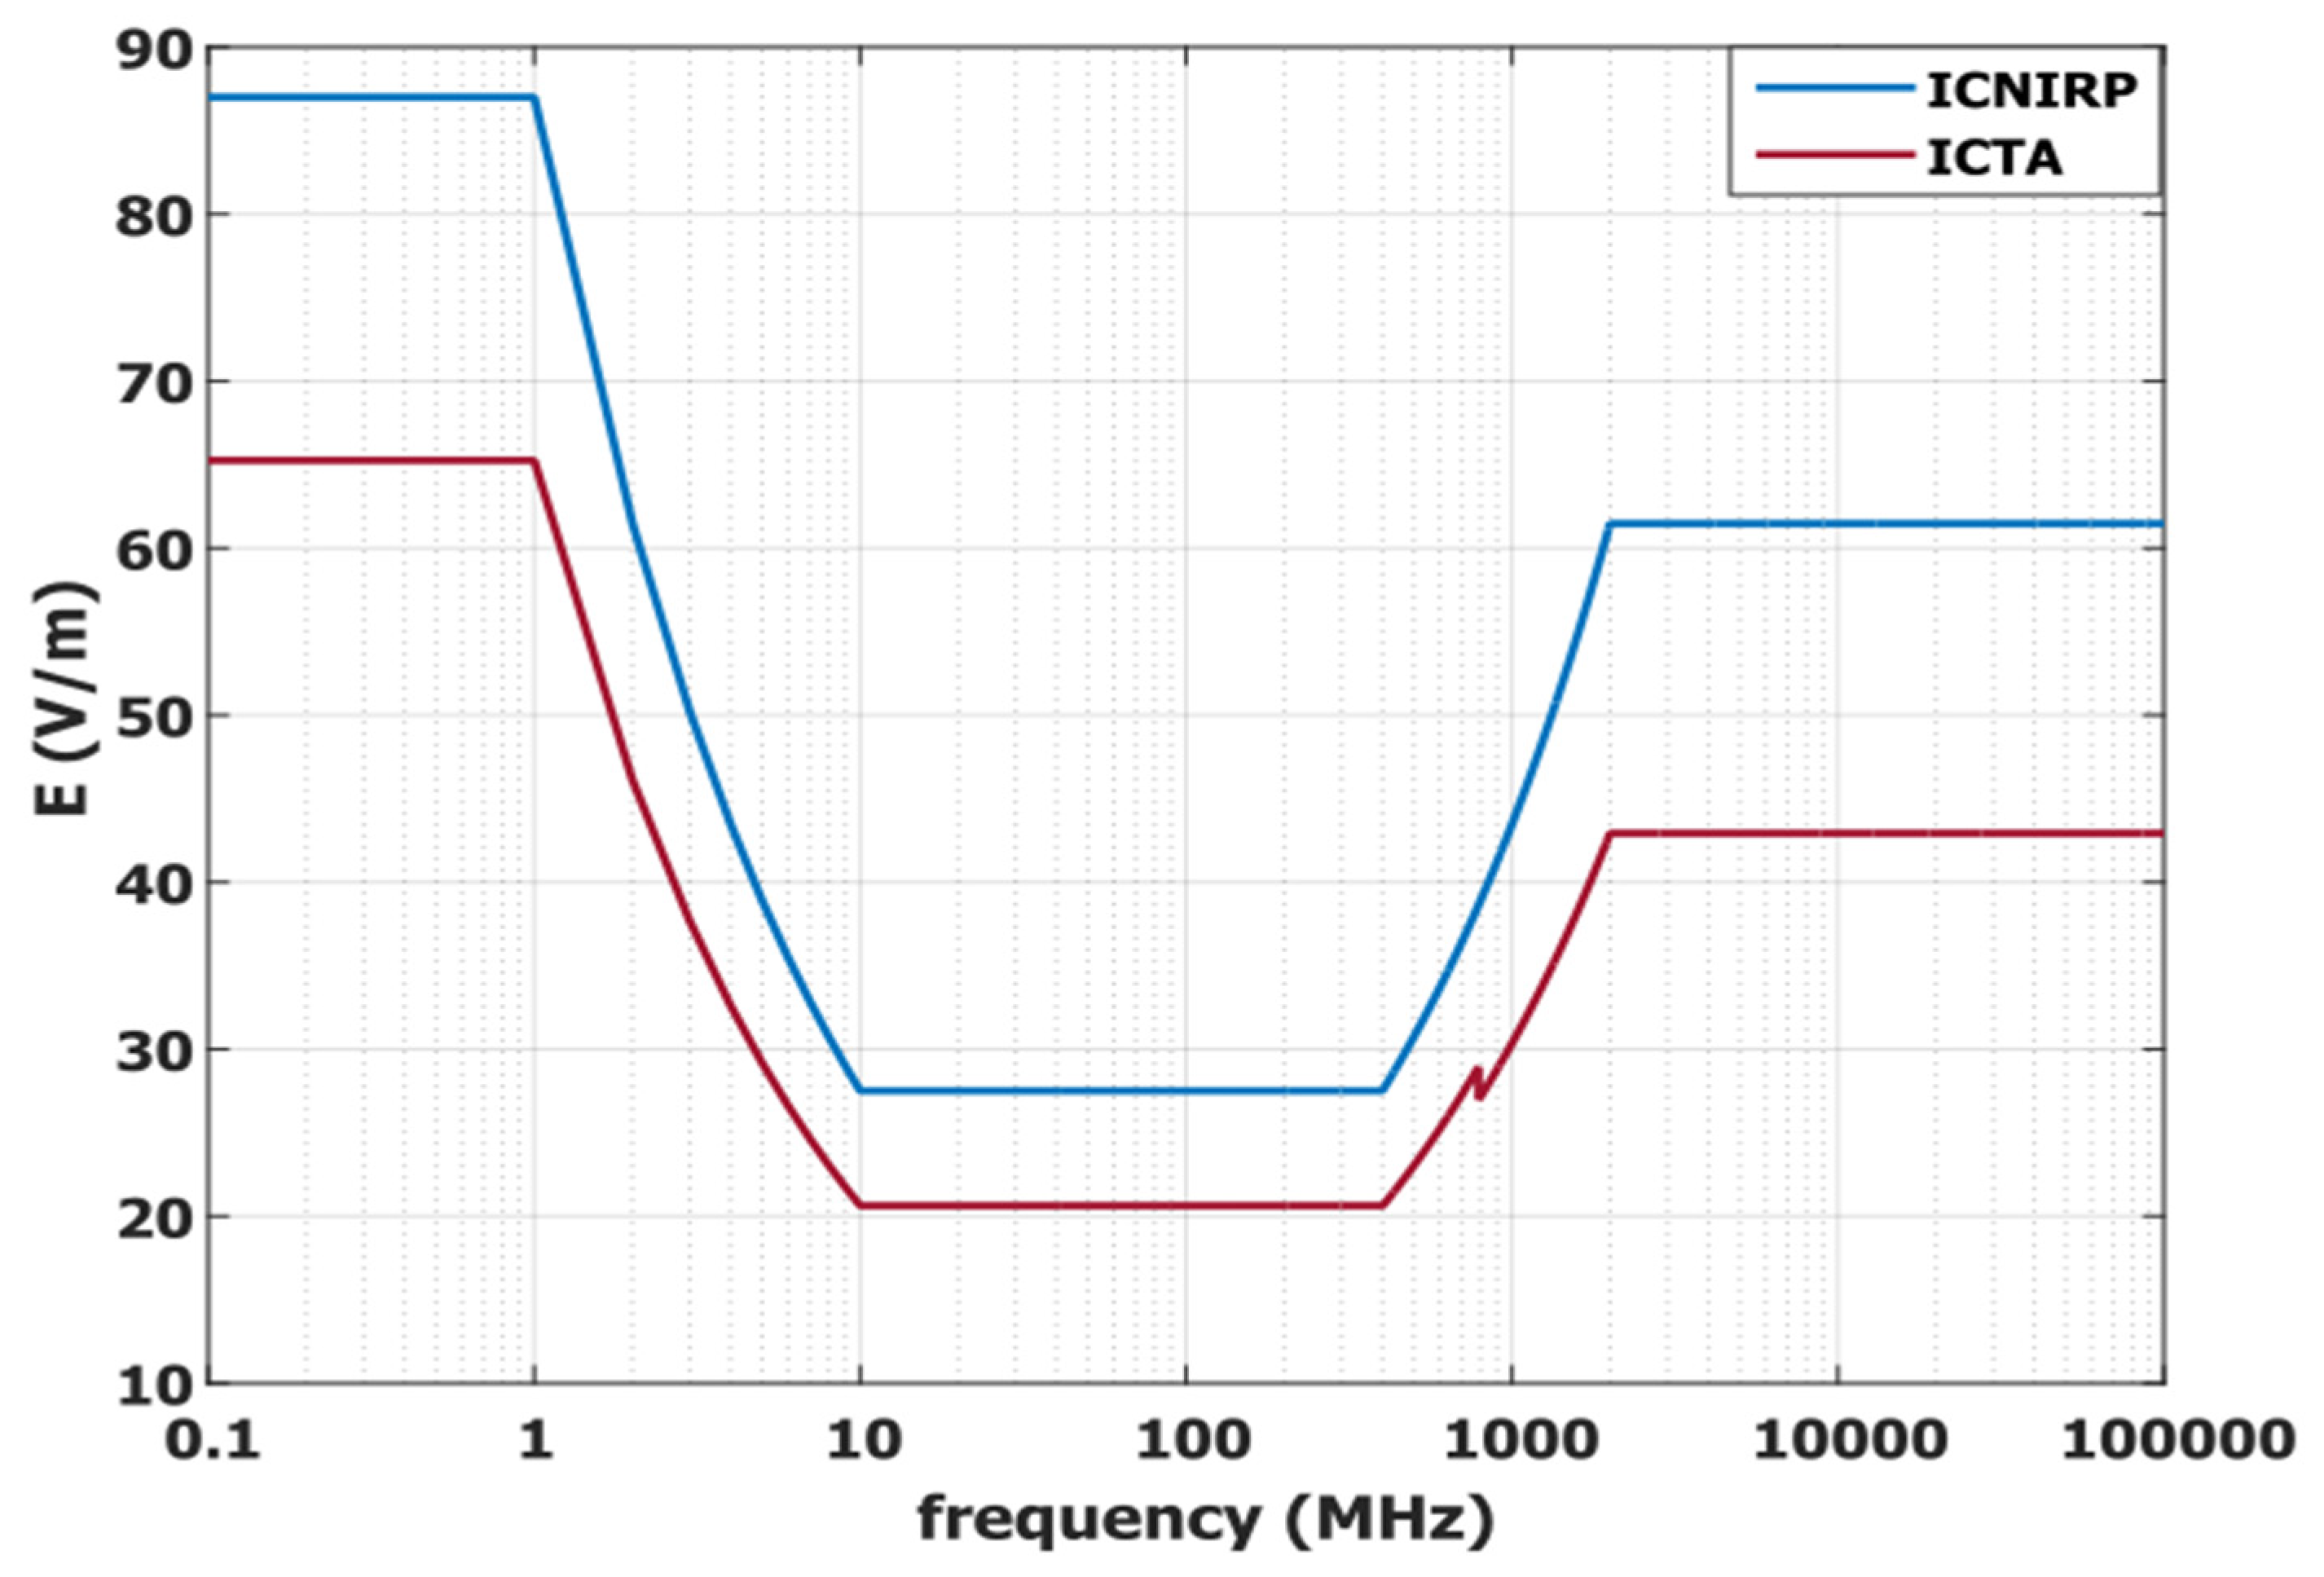
While ICNIRP is the international organization that determines these limit values, the Information Technologies and Communications Authority (ICTA) determines them in Turkey. ICTA uses 70% of the value determined by ICNIRP [28]. Figure 3 shows the variation of ICNIRP and ICTA’s general public exposure electric field limit values with frequency.
Figure 3.
Electric field limit values determined by ICNIRP and ICTA for humans [29].
In this study, low and broadband electric field effective values were measured in a house in four different environments for 24 h. 50 Hz source measurements were made with the NF-3035 measuring device (Gewerbegebiet Aaronia AG II, DE-54597 Strickscheid, Germany) (0–1 MHz), and broadband measurements were made with the HF-60105 device and the Omnilog 90200 antenna (Germany) (700 MHz–2500 MHz) connected to it. 1000 electric field effective values were recorded in every environment for 24 h.
Broadband is divided into 15 sub-bands, and the low and high-frequency values of each sub-band and the middle-frequency (fr) of each sub-band are shown in Table 1. It can be seen from the table that broadband electric field measurement values are distributed only in six sub-bands (LTE 800, ETC 1, GSM 900, ETC 2, LTE 1800, and WLAN), and the other nine sub-bands are empty.
Table 1.
Division of broadband into 15 subbands and frequency range.
By looking at the normalized root mean square error (NRMSE) values of all fitted curves, the curve with the smallest NRMSE value (0 < R-squared ≤ 1) was selected as the most suitable curve to determine whether the curves fitted to the density and cumulative probability (CP) values of the measured electric field effective values were the most suitable.
where N is the total number of measurements, i is the sample taken, xi is the measured electric field value, and is the electric field value of the fitted curve.
In order to calculate the SAR values caused by broadband measurement values on the head and brain of people living in the measurement environments, the density values and density values of the six-layer human head model created using the middle frequencies (fr) of the six sub-bands are shown in Table 2.
Table 2.
Electrical properties of the layers forming the head model according to the six sublayer frequencies.
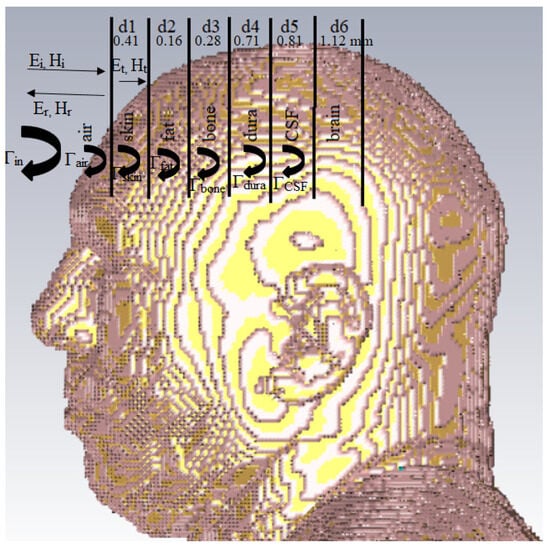
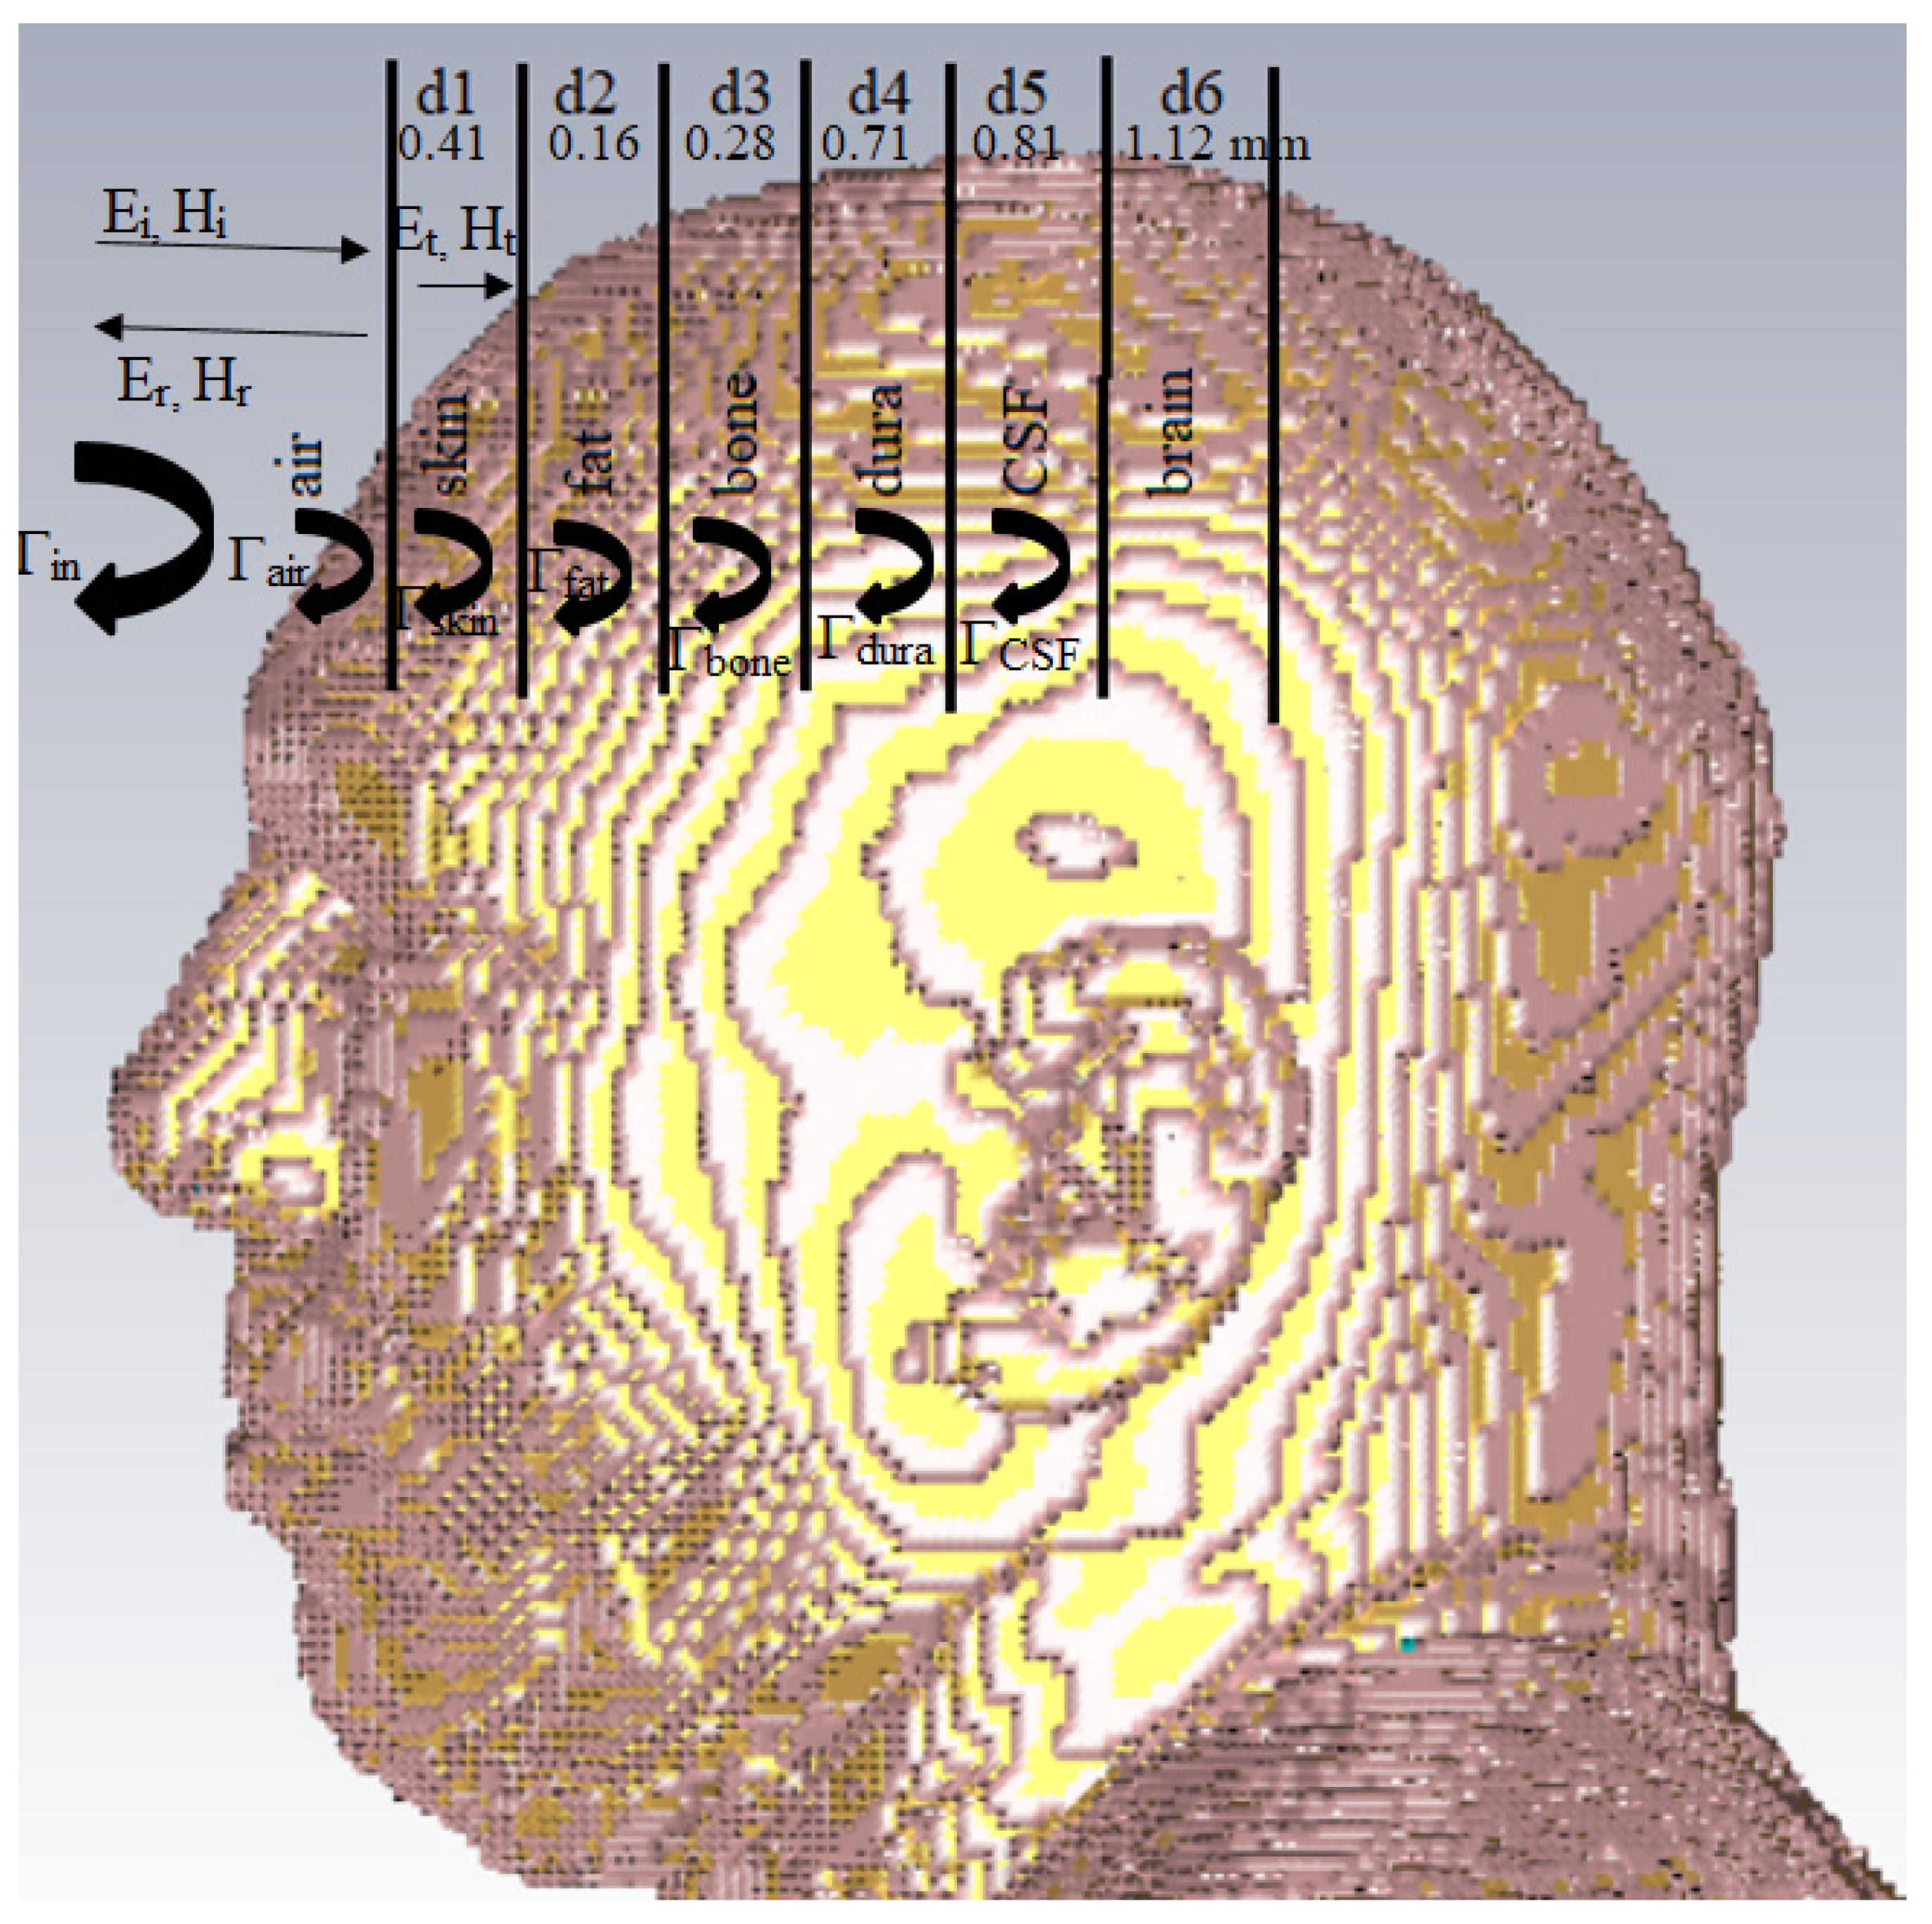
To calculate the SAR values of relative permittivity and electrical conductivity (S/m) (εr, σ) in Table 2, the six-layer head model, which is given for each layer and density values (εr, σ) and created by taking these into account, is shown in Figure 4.
Figure 4.
Head model created for SAR calculation [30].
Limits for SAR values are determined between 10 kHz and 10 GHz, taking as reference the 1 g and 10 g tissues of the exposed organ or the whole body. In this regard, while 1 g of tissue is taken as reference in the FCC, 10 g of tissue is taken as reference in the CE, and limit values have been determined for the working environment and public areas, as shown in Table 3.
Table 3.
Electrical properties of the layers forming.
To calculate the SAR values in the brain, all electrical components of the six-layer head model angular frequency (rad/s), permittivity (F/m), propagation constant, impedance of the medium (Ω), reflection coefficient, and transmission coefficient () are found using the following Equations (3)–(8).
Taking the head model, the total reflection coefficient seen from the entrance is calculated as
Then, to find the electric field values reaching the brain, the total transmission coefficient is calculated using Equation (10) [31].
The electric field values reaching the brain of the broadband electric field effective values measured in four environments are obtained by
The SAR value occurring in the brain is
The SAR value formed in the head part was calculated using the electric field effective values measured in four environments.
where
- : effective value of the measured electric field (V/m)
- ρ: mass density of the tissue (kg/m3)
Note: While performing SAR analysis, it was considered that the incoming electric field was perpendicular to the air–skin boundary.
3. Results
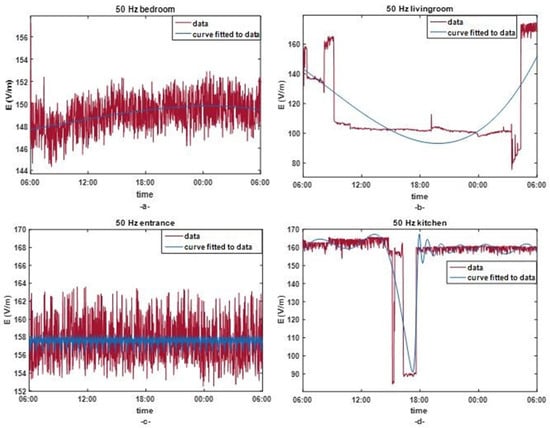
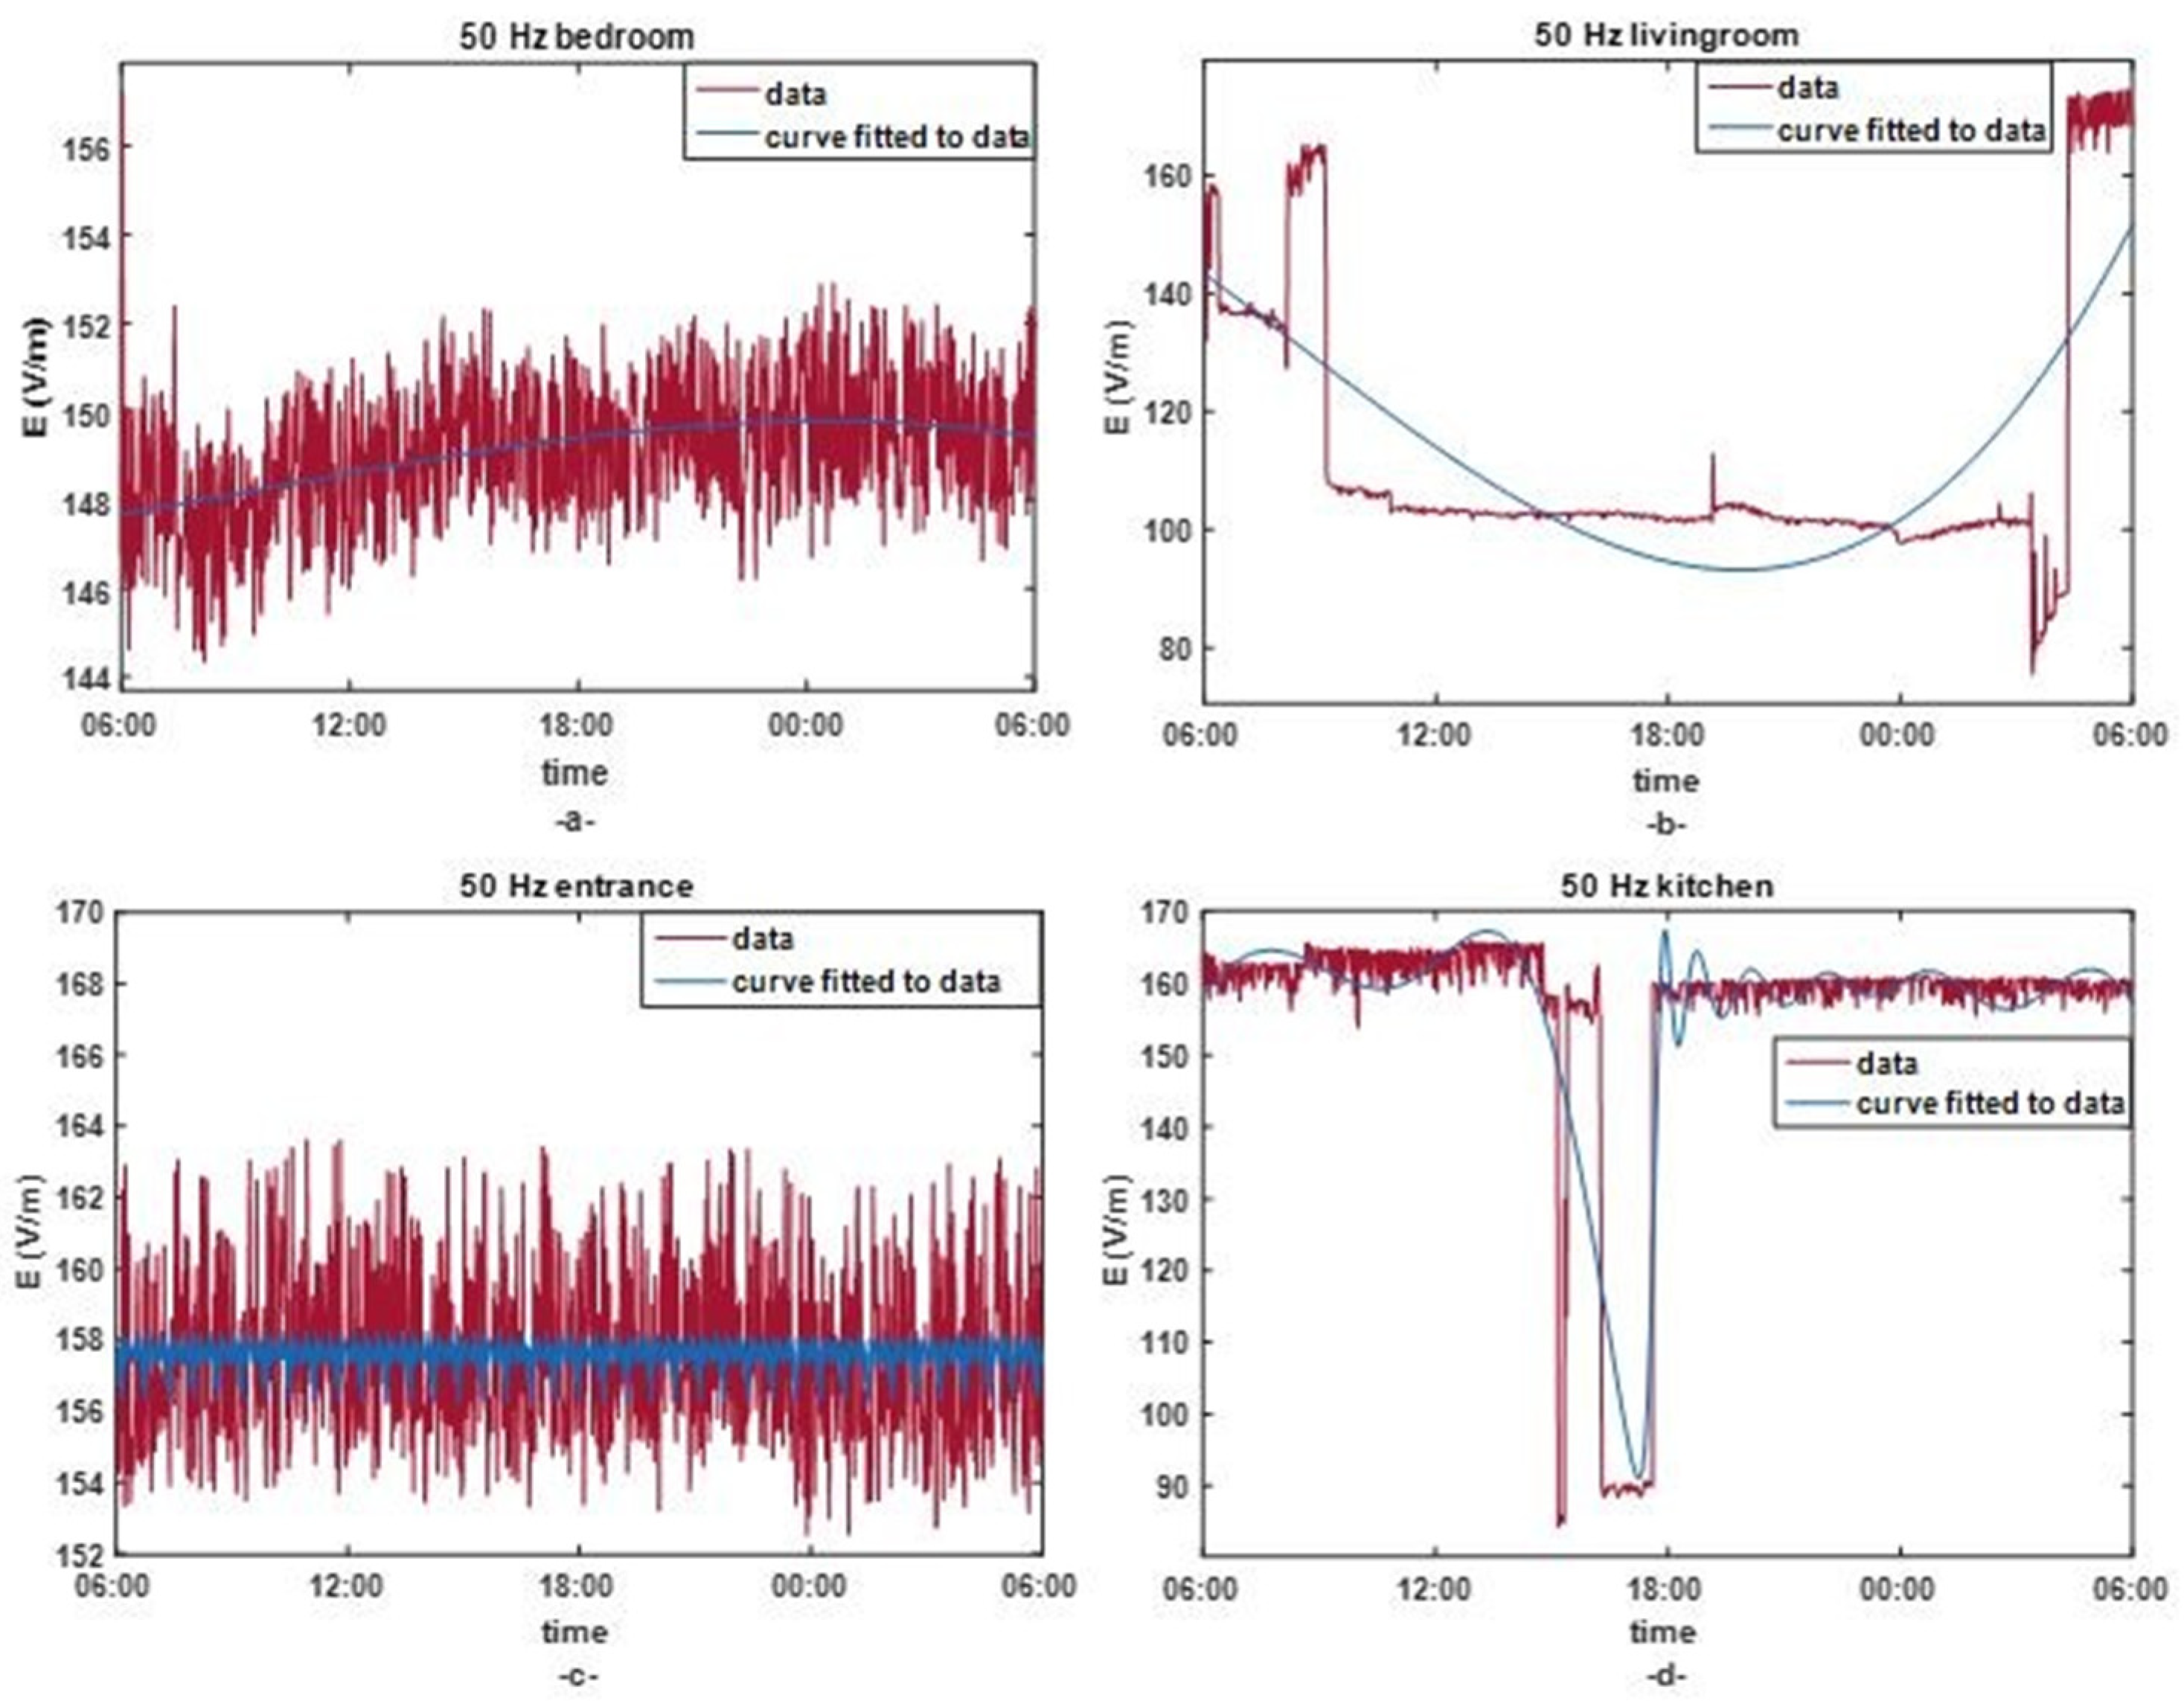
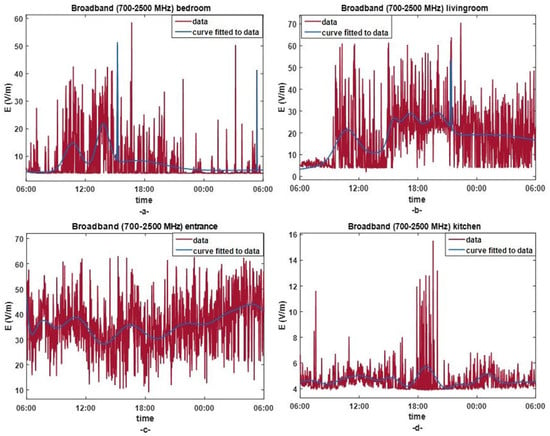
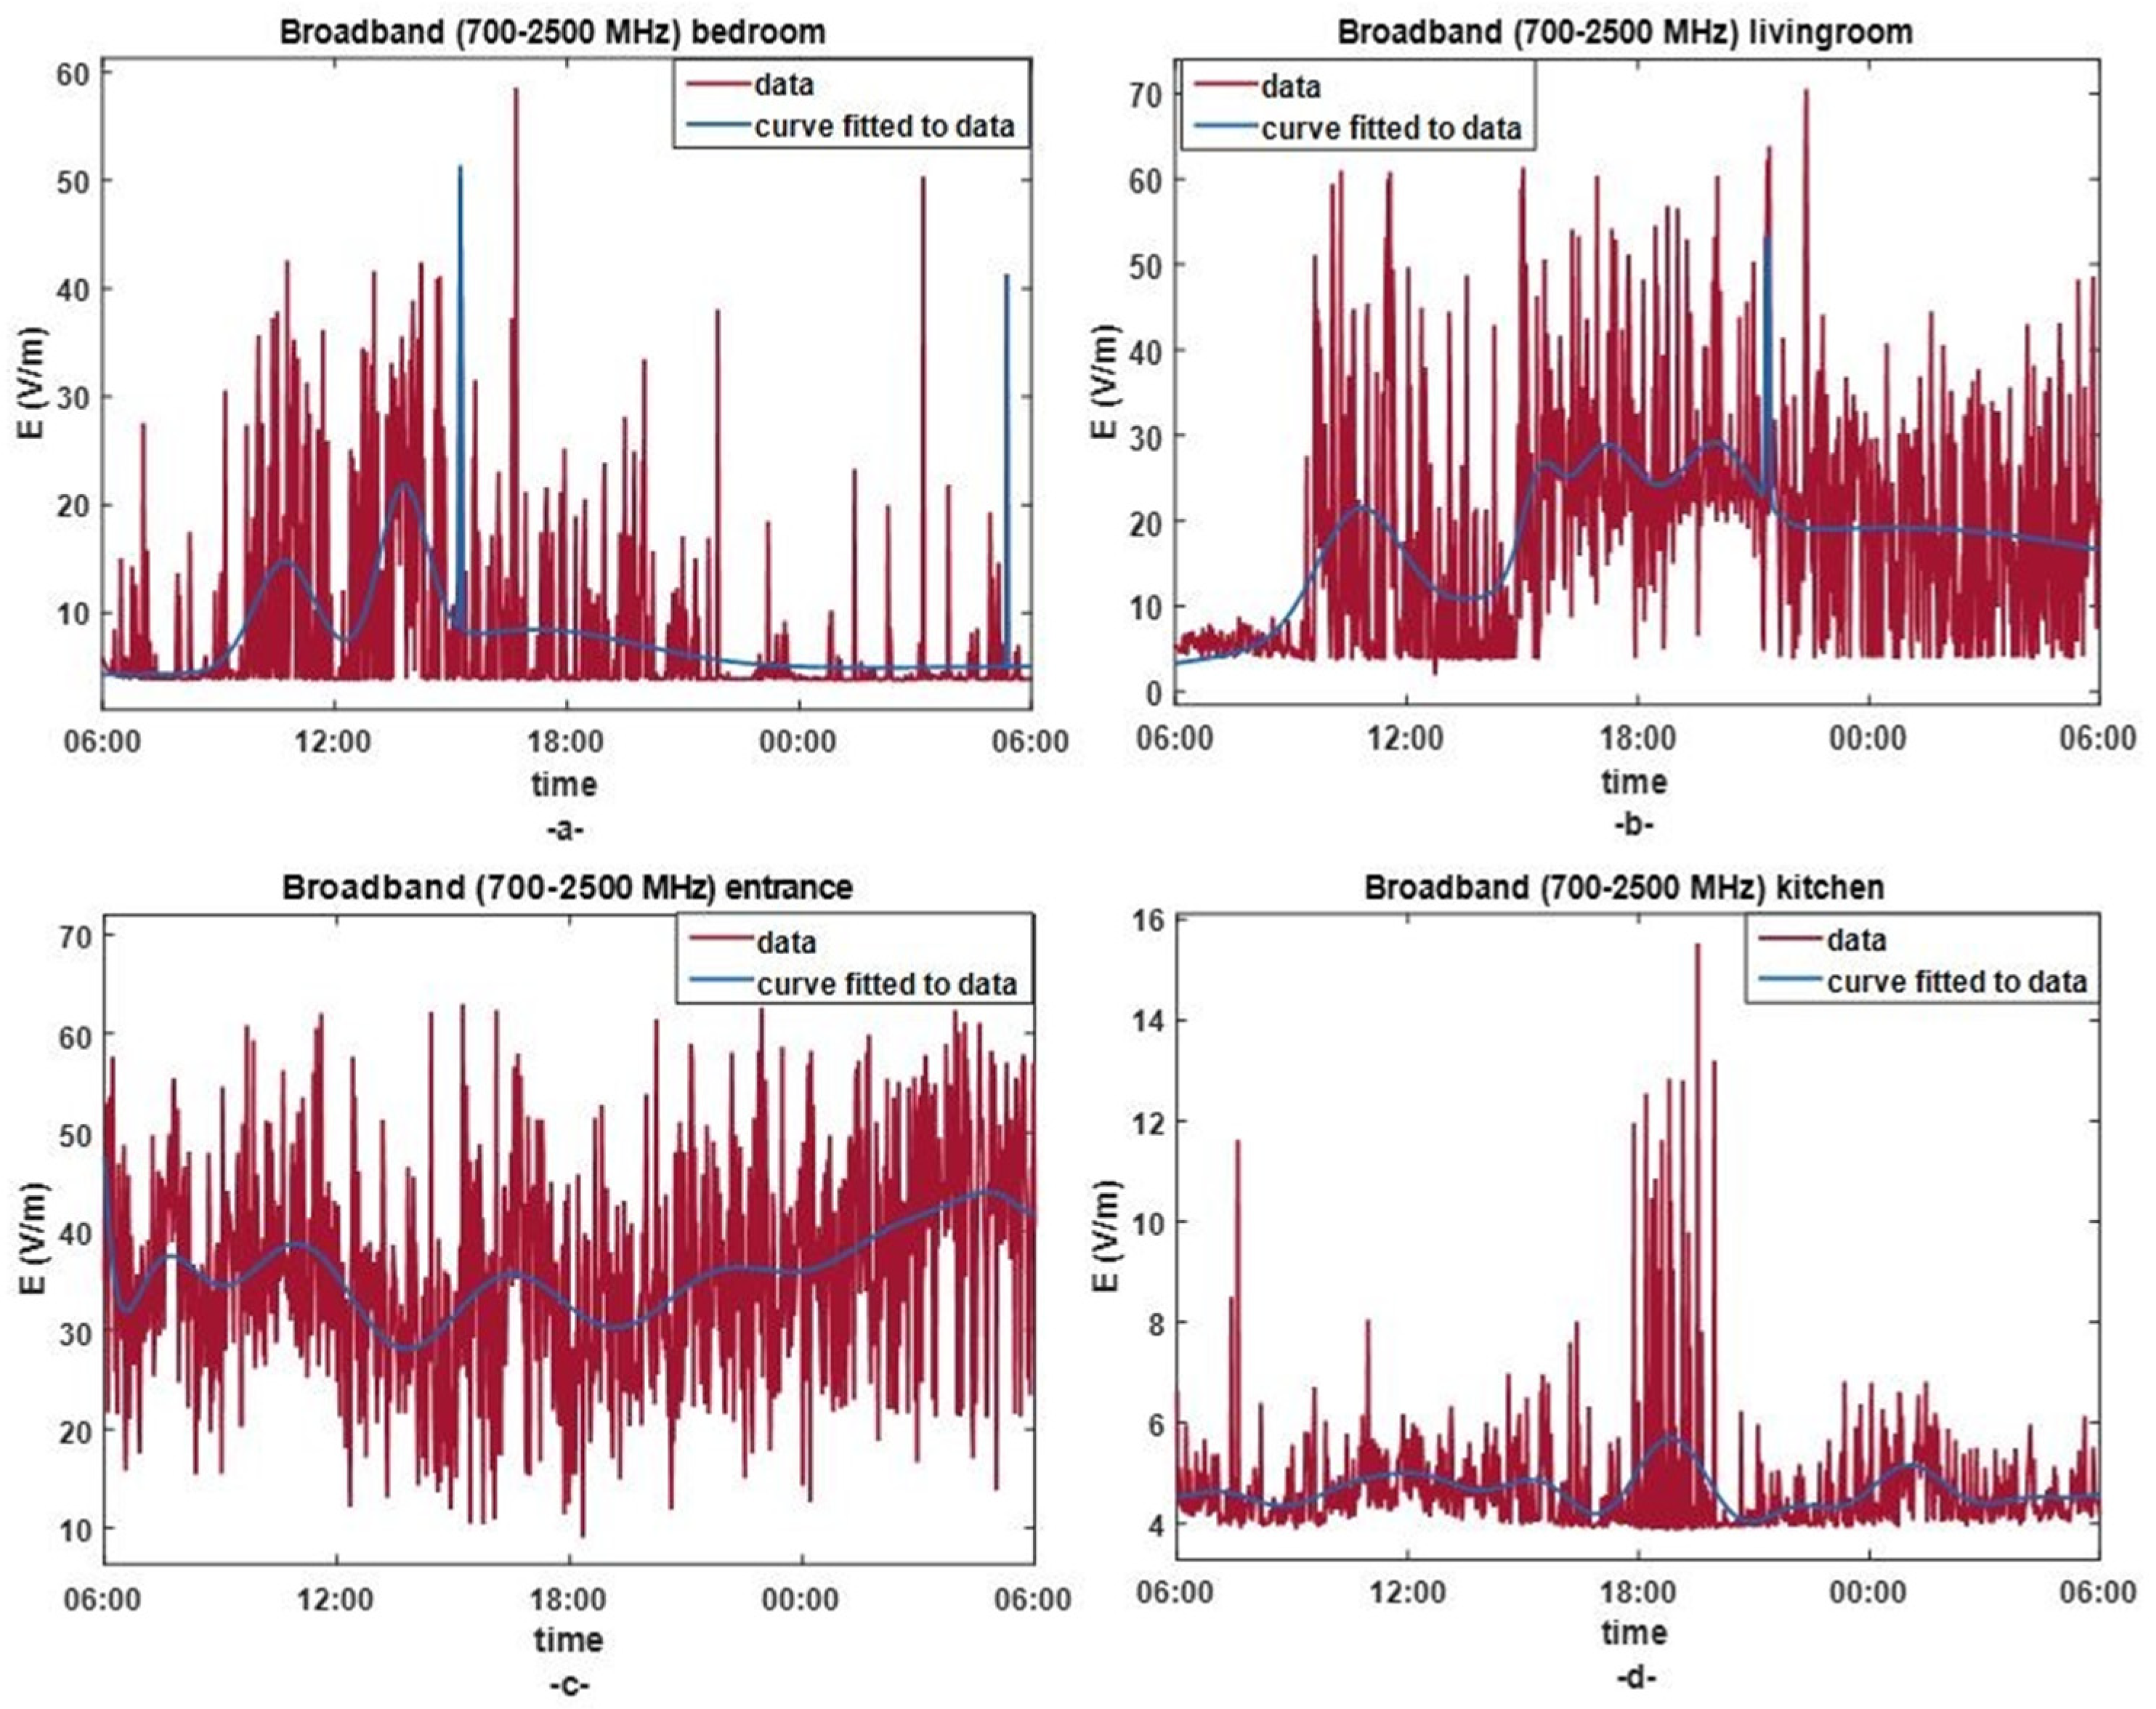
The variations of the low-frequency and broadband electric field effective values recorded for 24 h and the best fit curves fitted to these values are shown in Figure 5 and Figure 6, respectively. In Figure 5, since it is the entrance of the house and there is a single lamp and wireless modem in this environment, it is seen that the average electric field in this environment is the highest (157.55 V/m), but the change around this average (std) is 2.5 V/m. In other words, whether the lamp at the entrance is on or off does not have much of an effect on the electric field. It can be seen that the highest measured electric field value is 174 V/m and the lowest is 76 V/m. It is seen that all measured electric field values are well below the 5000 V/m limit value determined by ICNIRP for public environments; the highest measured value is 174 V/m, which corresponds to 3.48% of the limit value.
Figure 5.
Variation of 5 (a) bedroom, 5 (b) livingroom, 5 (c) entrance and 5 (d) kitchen 50 Hz electric field measurement values according to the number of measurements in the home environment.
Figure 6.
Variation of 6 (a) bedroom, 6 (b) livingroom, 6 (c) entrance and 6 (d) kitchen broadband electric field measurement values in the home environment over time.
In Figure 6, it can be seen that the average and standard deviation (std) of the electric field in the entrance environment where the wireless modem is located and the living room environment located nearby are larger than the other two environments.
As a result of using three LED lamps and a mobile phone in the bedroom environment until going to bed and leaving it to charge without turning it off, the electric field value was measured higher than in the kitchen environment. It can be seen that the electric field values measured in the kitchen, which is far from the wireless modem and where there are not many mobile phones, are quite low. Table 4 gives the statistical results of the 50 Hz and broadband electric field effective values for four environments.
Table 4.
Some statistical values of 50 Hz and broadband-sourced electric field measurement in a home environment.
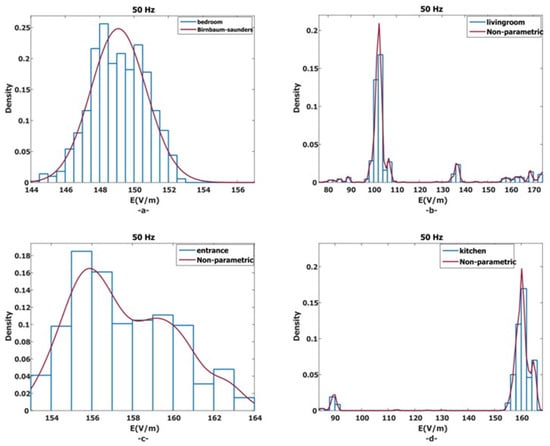
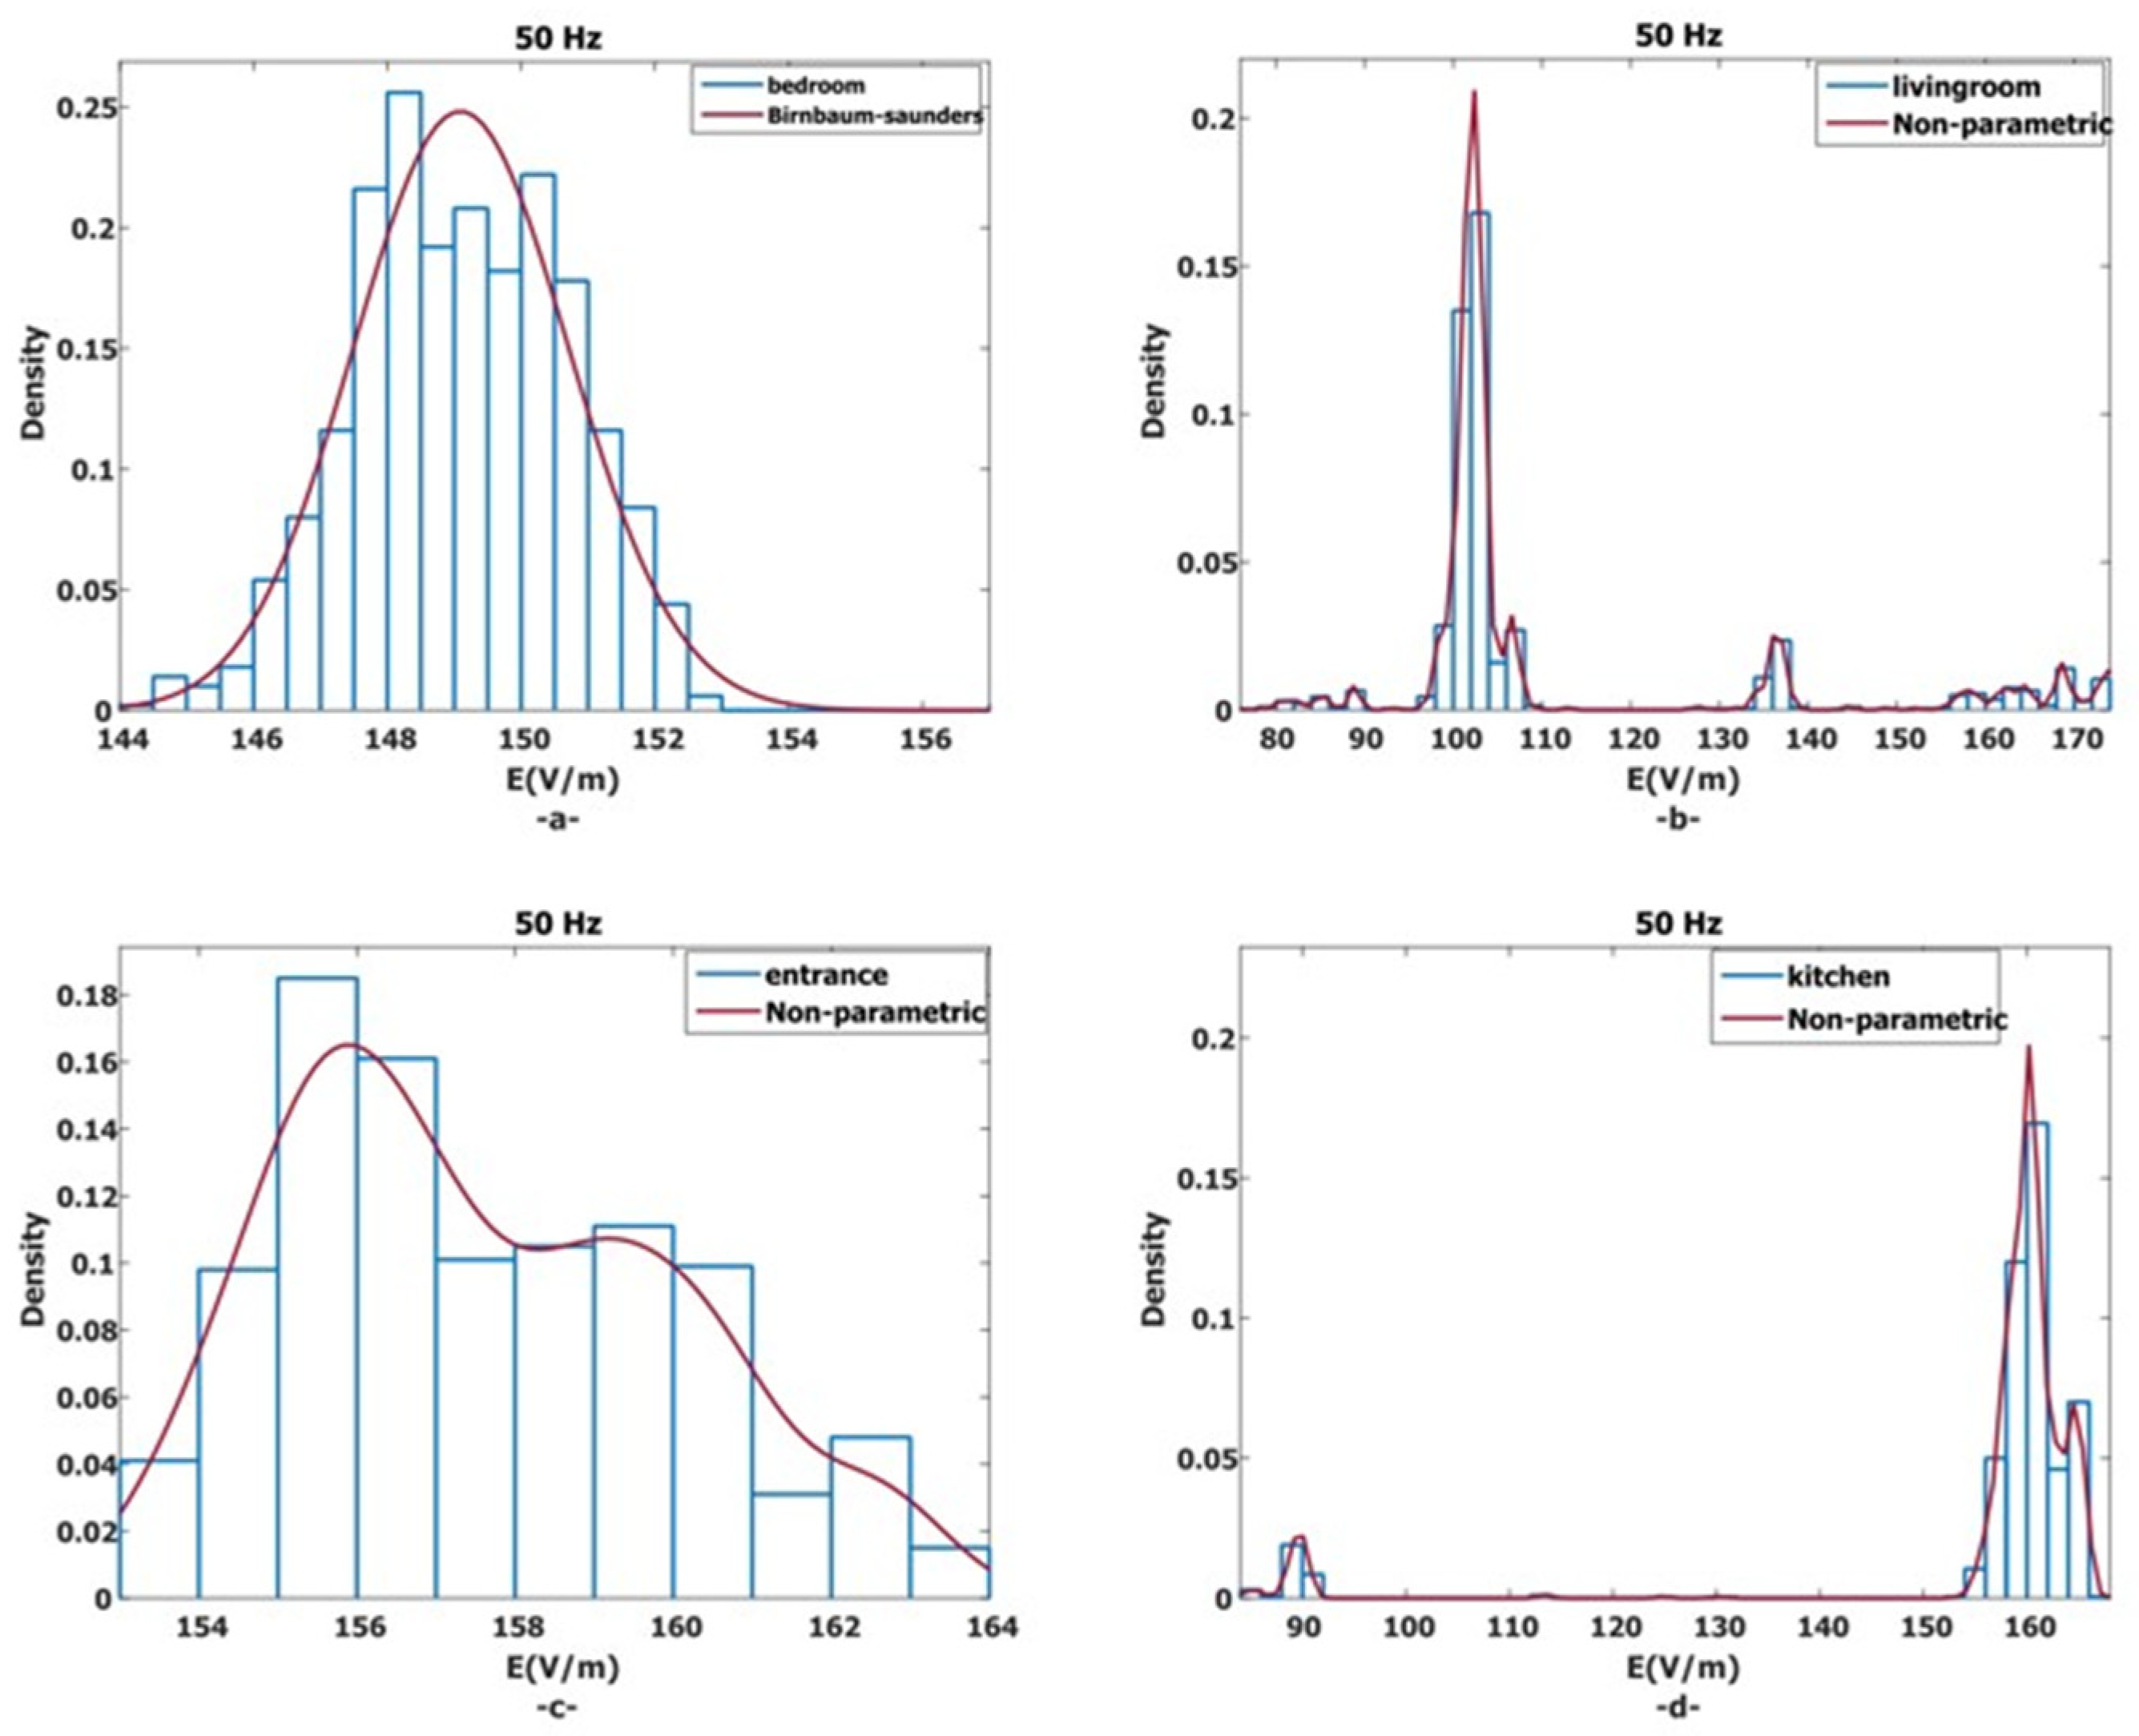
According to Table 4, the highest electric field value is 71 V/m, which corresponds to 116.39% of the limit value (61 V/m) determined by ICNIRP. The lowest value is 2 V/m. Again, it is seen that the electric field value is very high in the environments where the wireless modem is located and near it (living room and entrance), above the limit value of ICNIRP. According to the measurement results, ICNIRP’s limit value was exceeded 10 times, 7 times in the living room environment, and 3 times in the entrance environment. Figure 7 shows the variations of low-frequency density values and the best fit curves fitted to these values depending on the electric field values.
Figure 7.
Density changes of 50 Hz 7 (a) bedroom, 7 (b) livingroom, 7 (c) entrance and 7 (d) kitchen source electric field measurements made in four different environments and curves fitted to these changes.
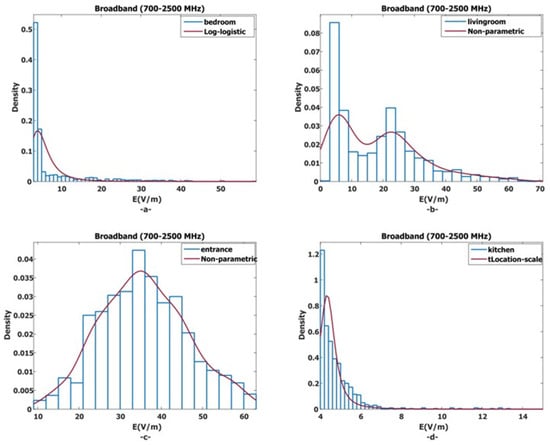
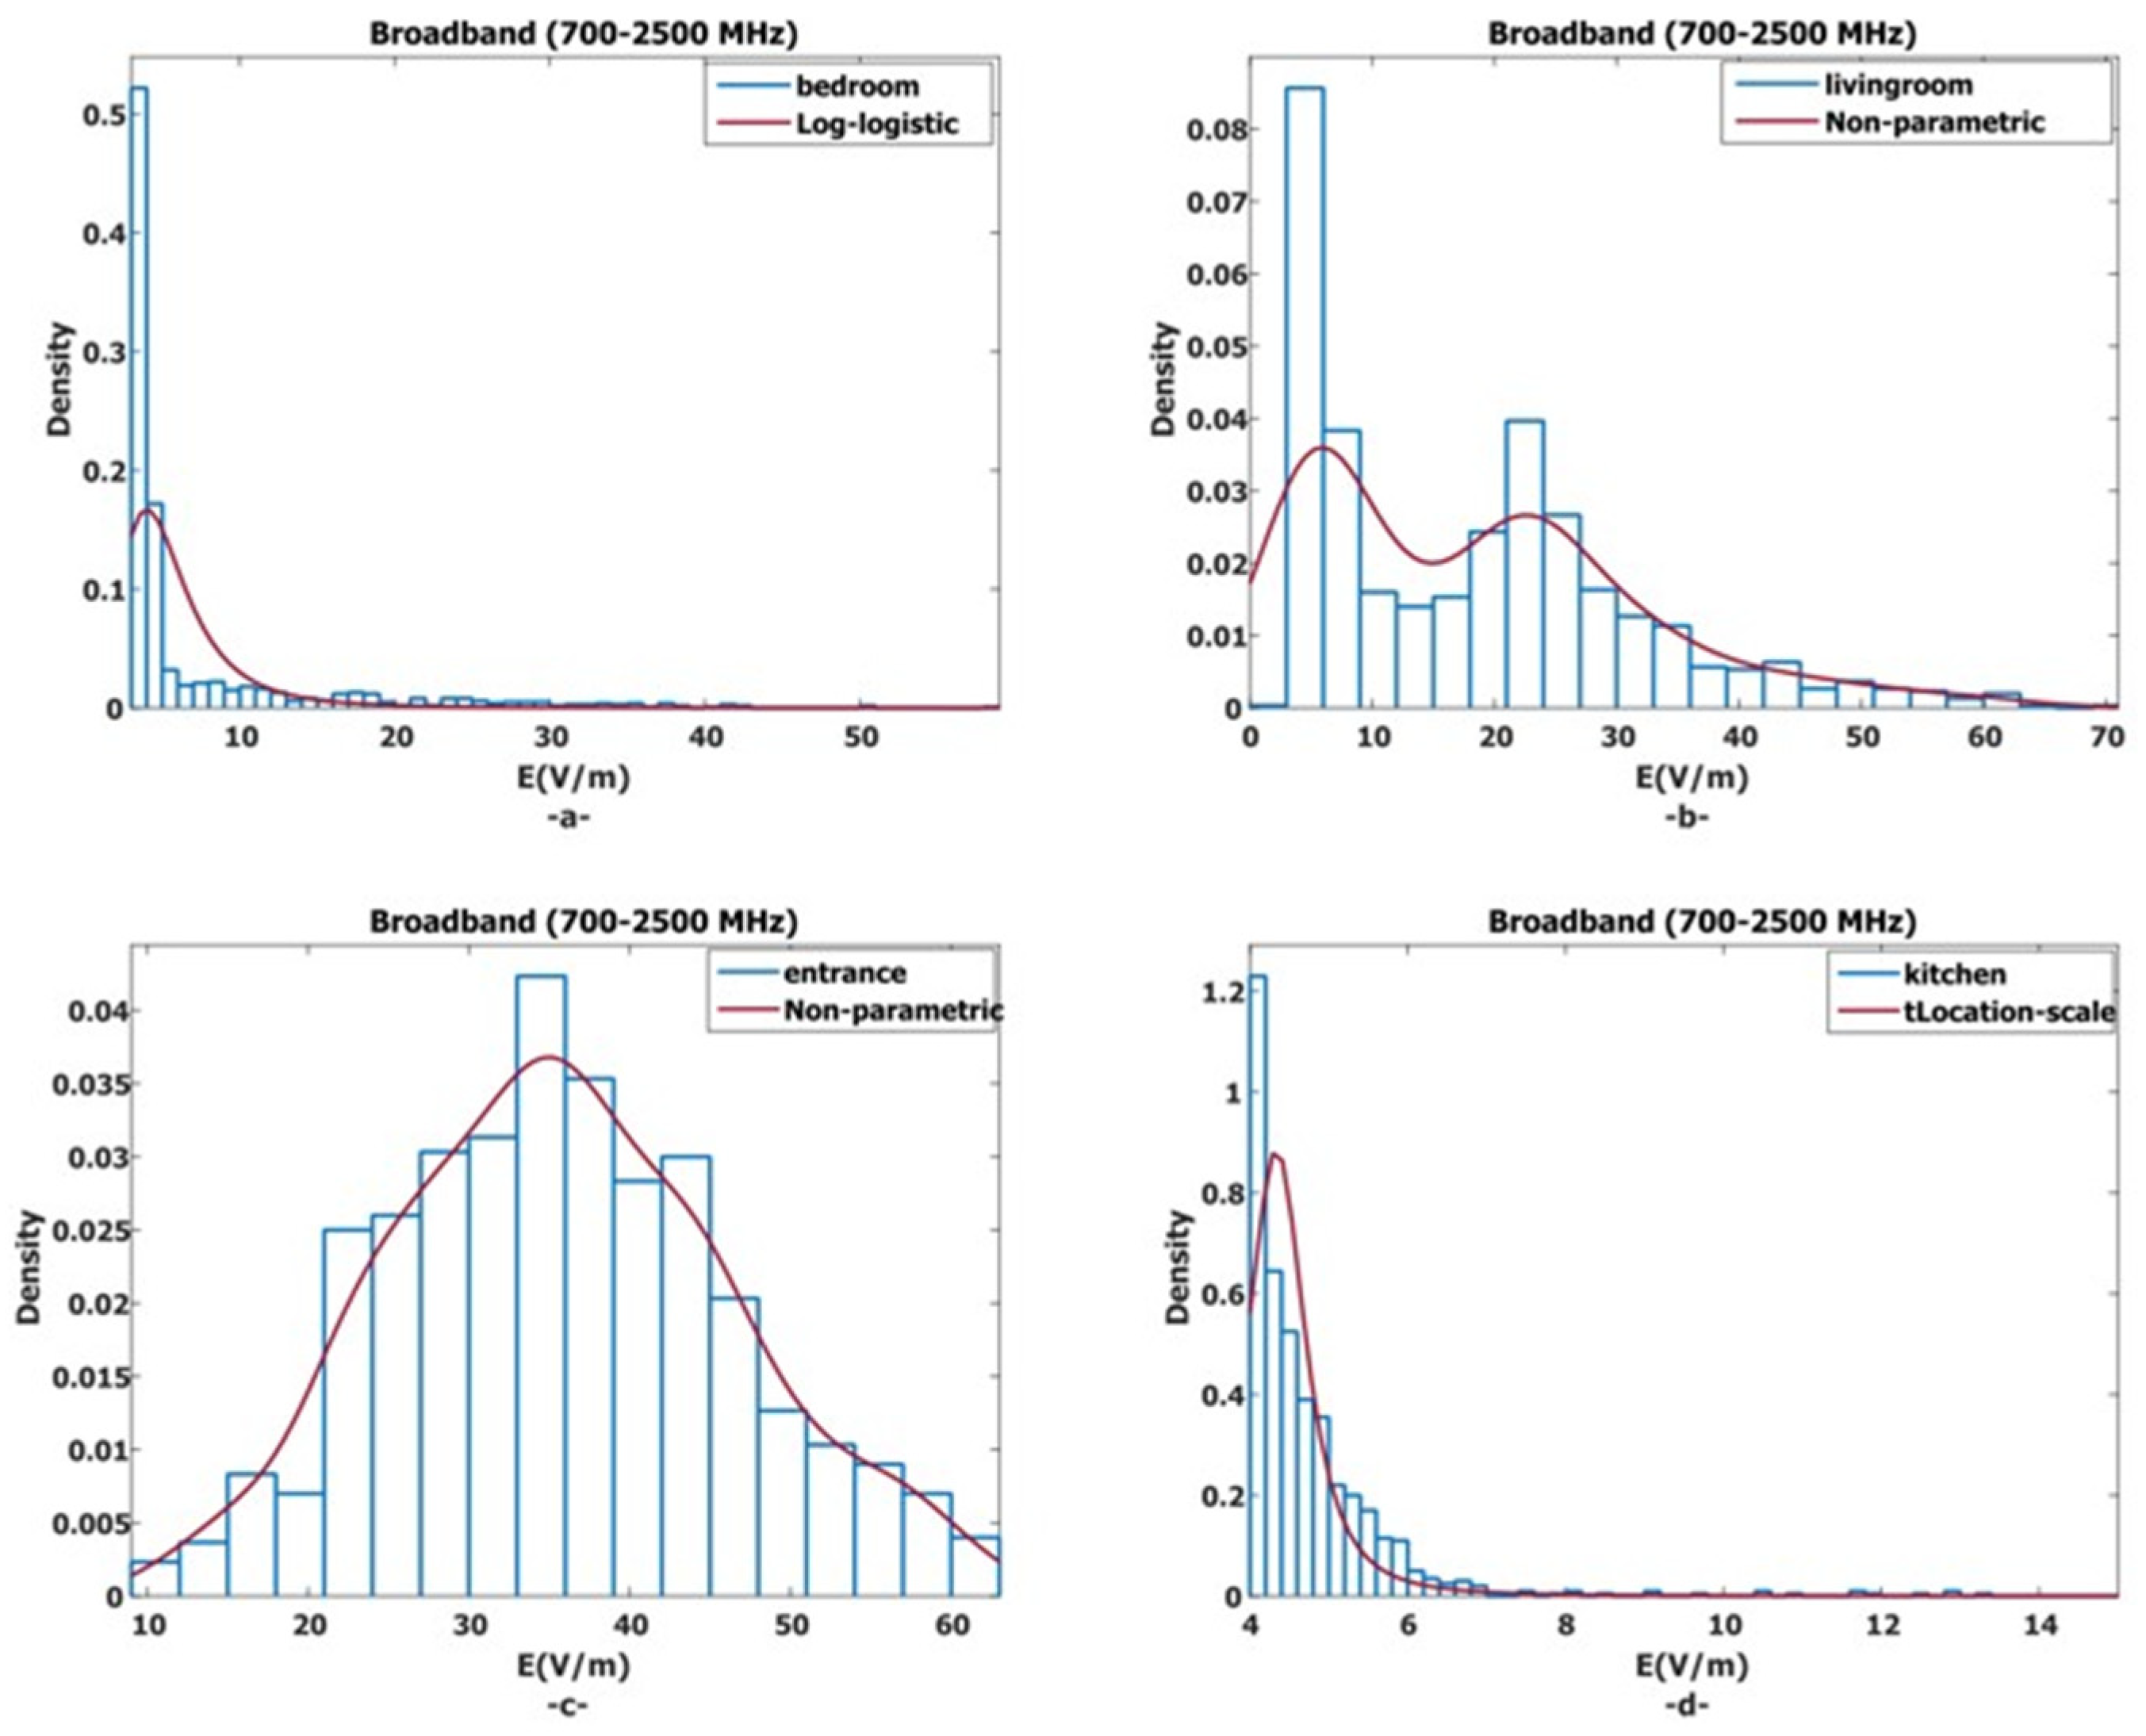
For example, the density (probability of occurrence) of 149 V/m in the bedroom is 0.2. Figure 8 shows the variations of broadband density values and the best fit curves fitted to these values. Figure 8 shows that the variations in the bedroom and kitchen have a narrower band, while the variations in the other two environments where the wireless modem is located have a wider band.
Figure 8.
Density changes of broadband 8 (a) bedroom, 8 (b) livingroom, 8 (c) entrance and 8 (d) kitchen -induced electric field measurements made in four different environments and curves fitted to these changes.
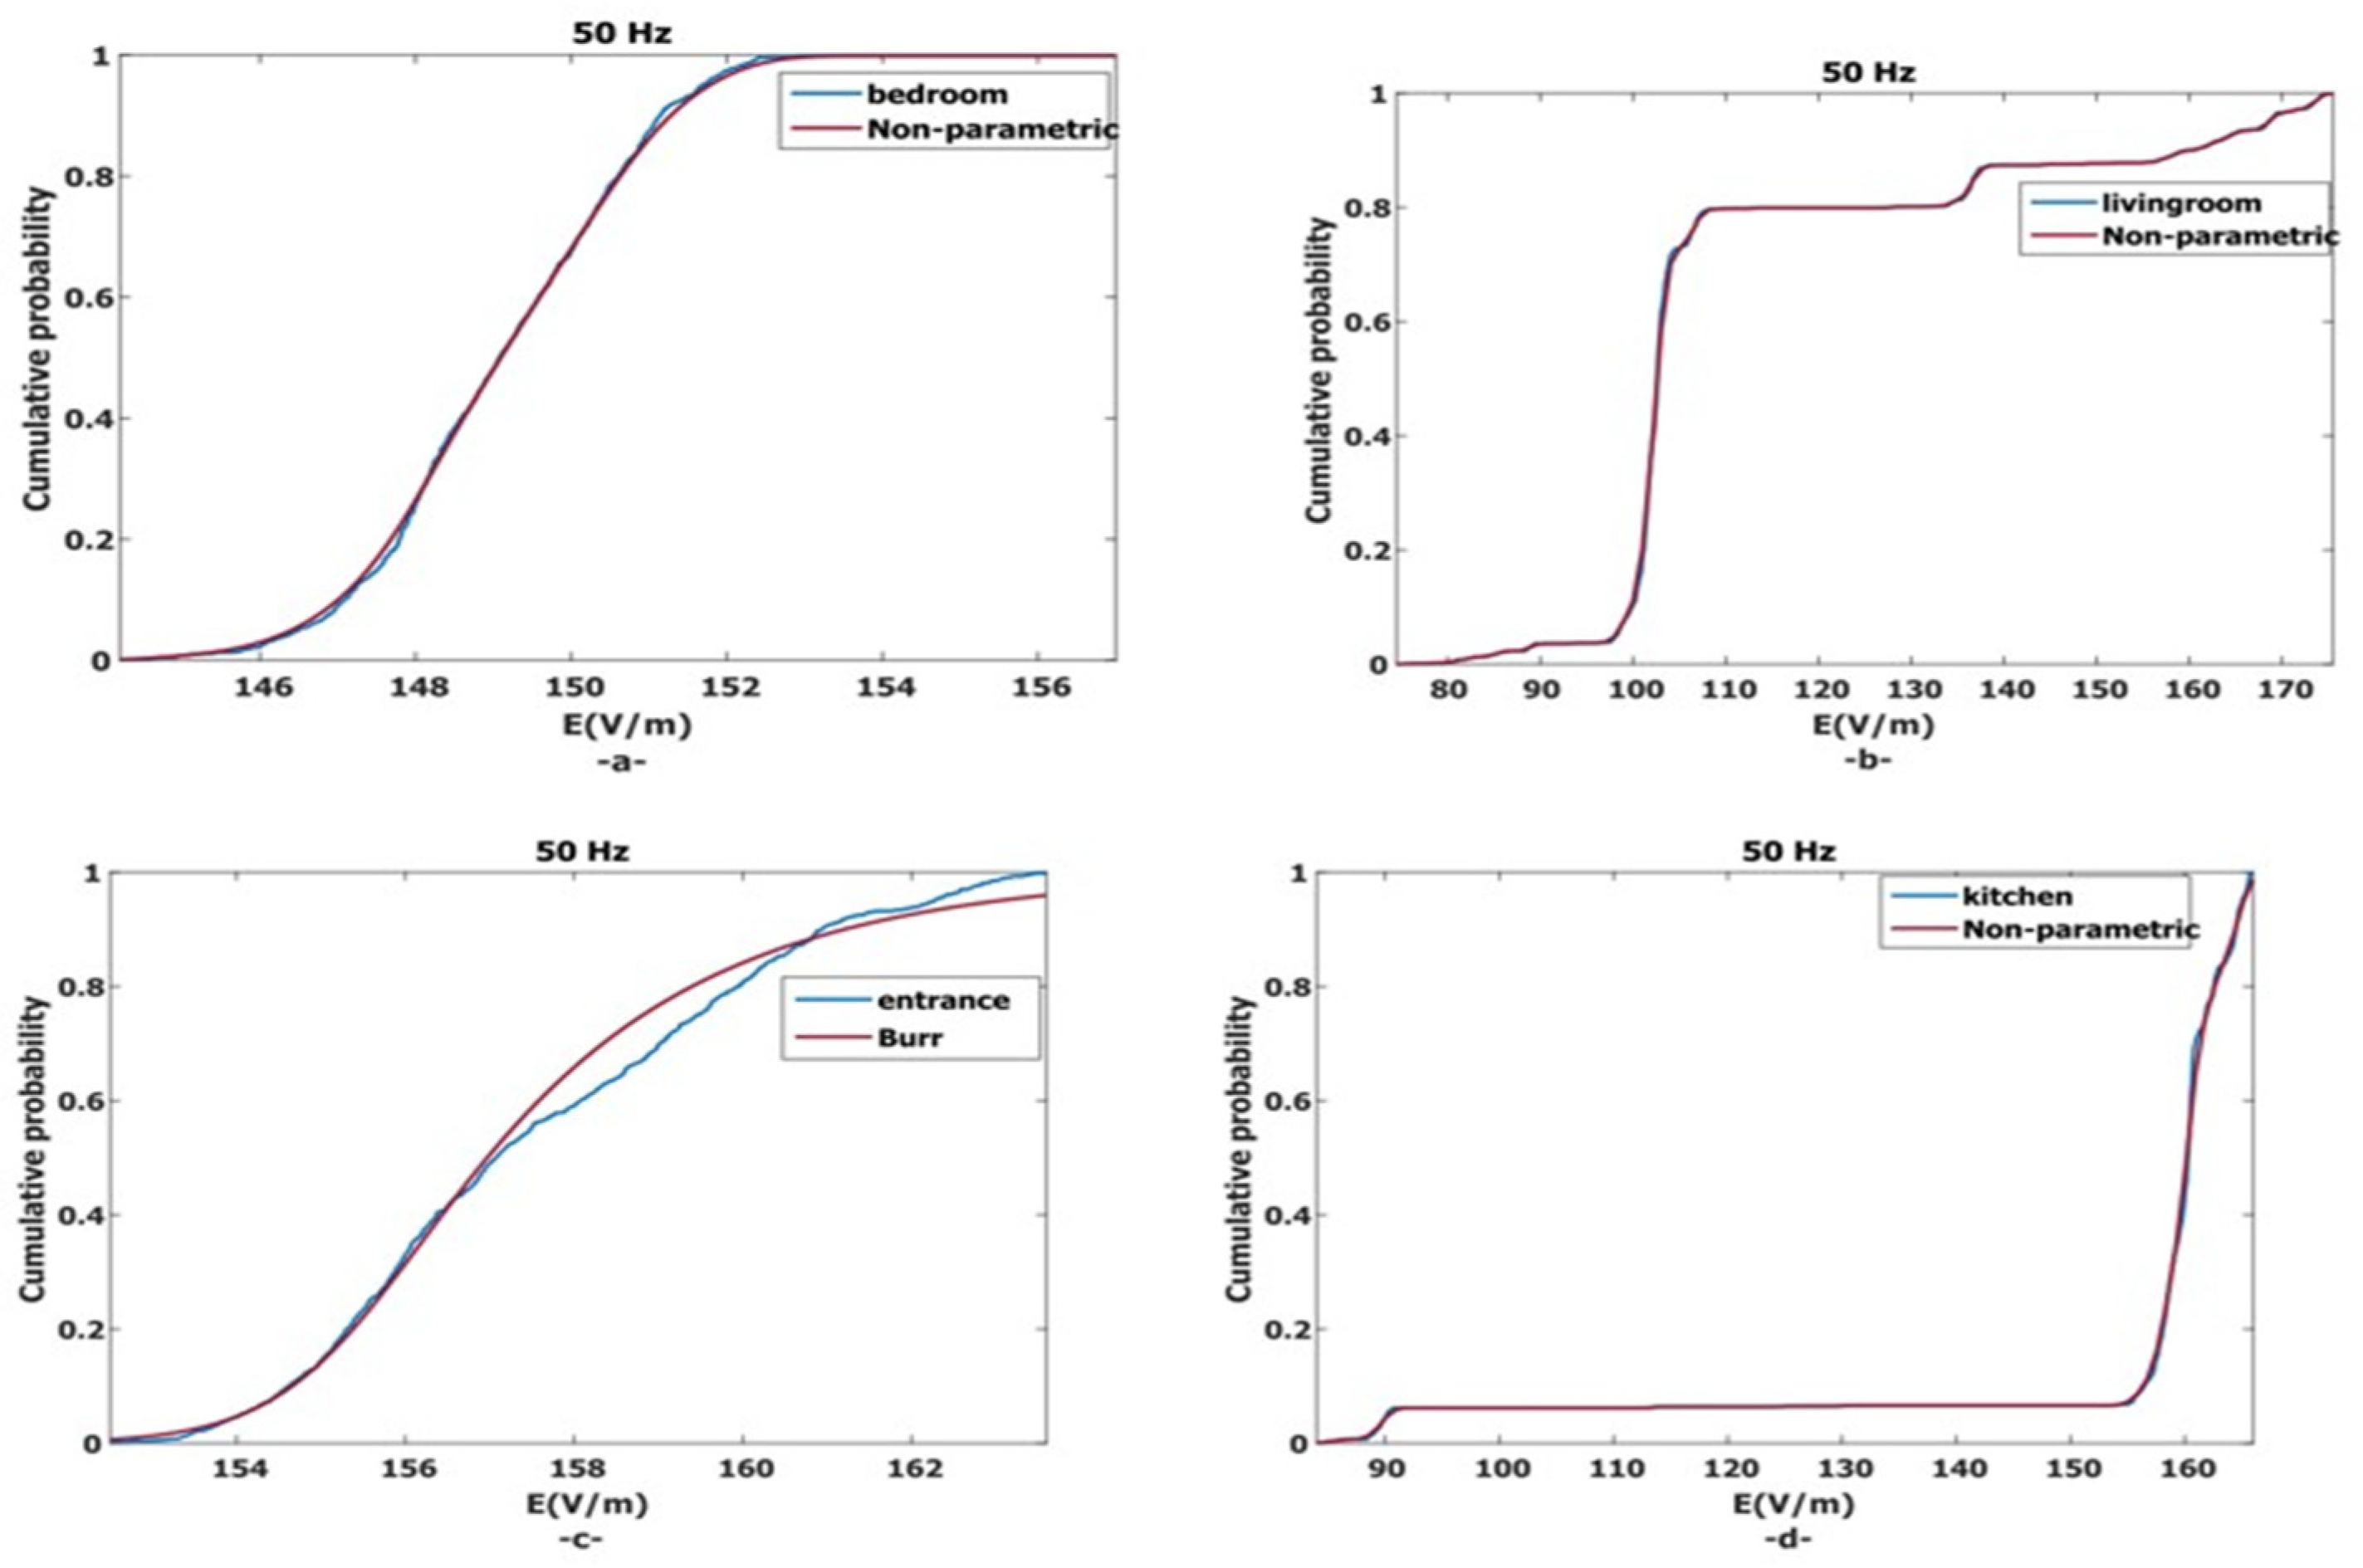
Figure 9 shows the cumulative probability values (percentage of success) of 50 Hz measurements and the changes in the best-fit curves fitted to them. It is seen that the variations in the curves in the bedroom and entrance are smoother, and the variations in the other two environments are more variable.
Figure 9.
Cumulative probability changes of 50 Hz 9 (a) bedroom, 9 (b) livingroom, 9 (c) entrance and 9 (d) kitchen source electric field measurements in four different environments and curves fitted to these changes.
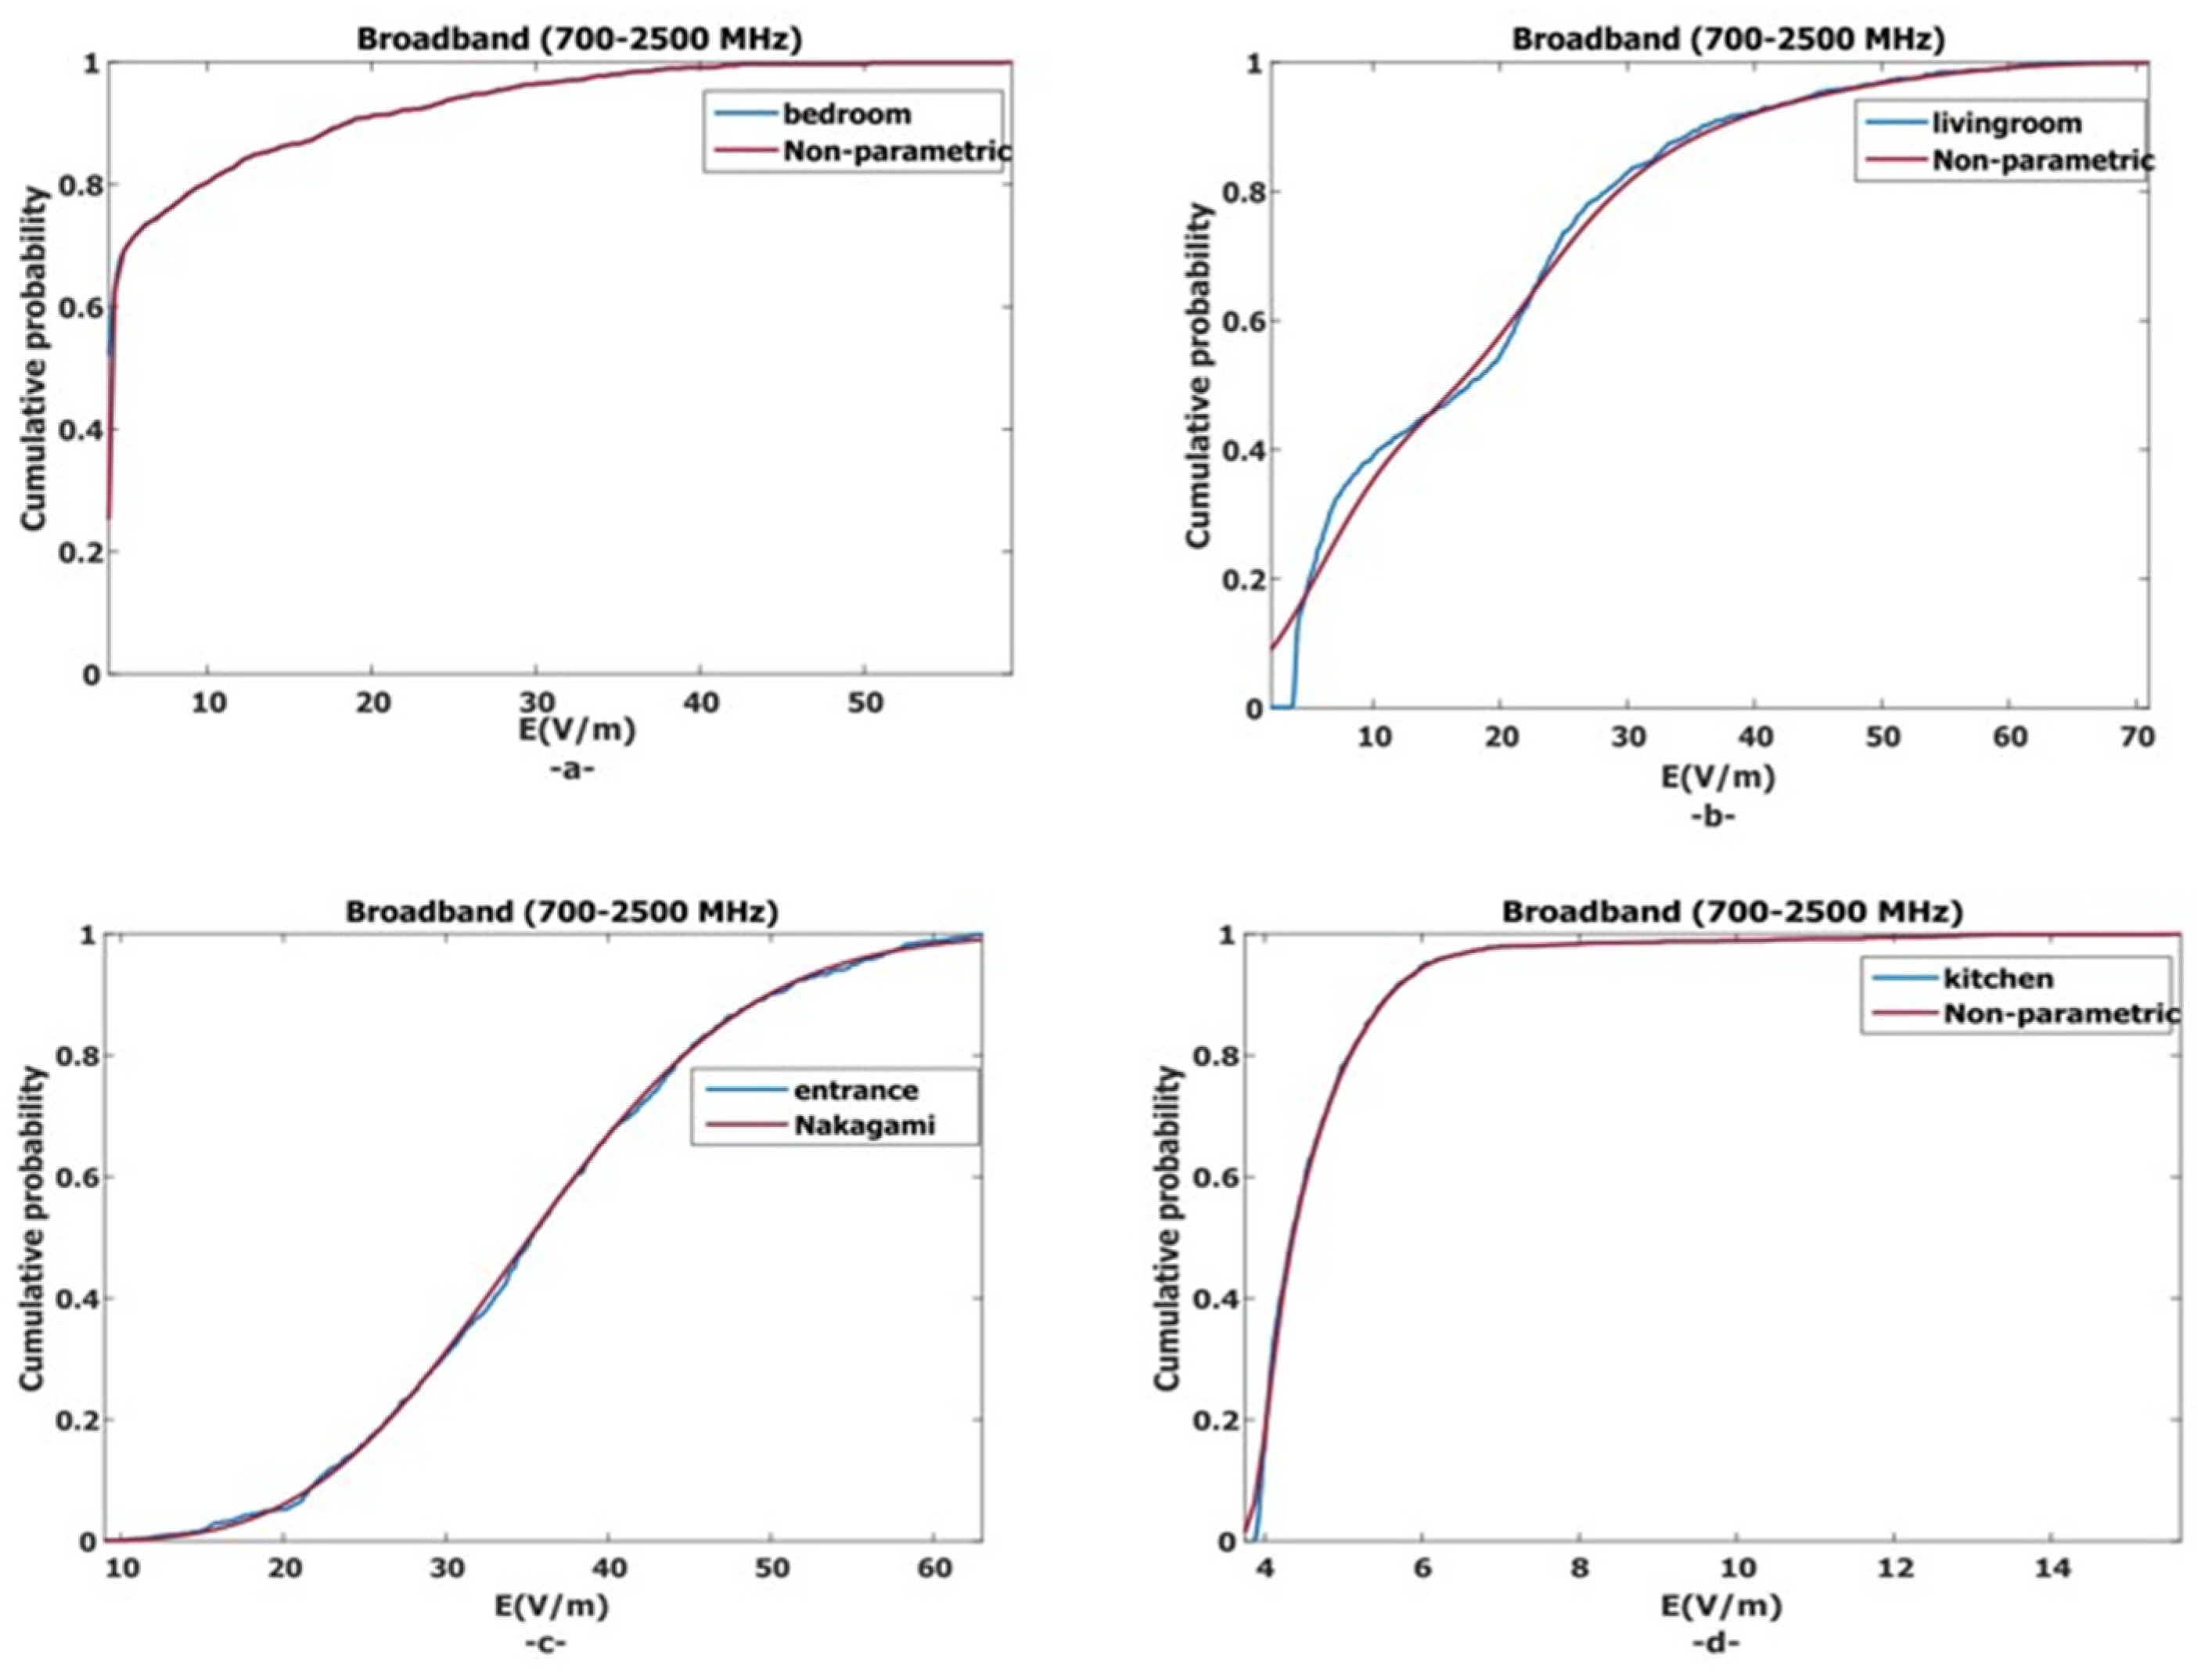
Figure 10 shows the cumulative probability values (percentage of success) of broadband measurements and the changes in the best-fit curves fitted to them. It can be seen from the figure that the data for all four environments shows a smooth change.
Figure 10.
Cumulative changes of 10 (a) bedroom, 10 (b) livingroom, 10 (c) entrance and 10 (d) kitchen 50 Hz broadband-induced electric field measurements in four different environments and curves fitted to these changes.
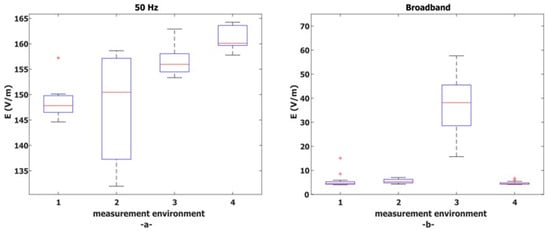
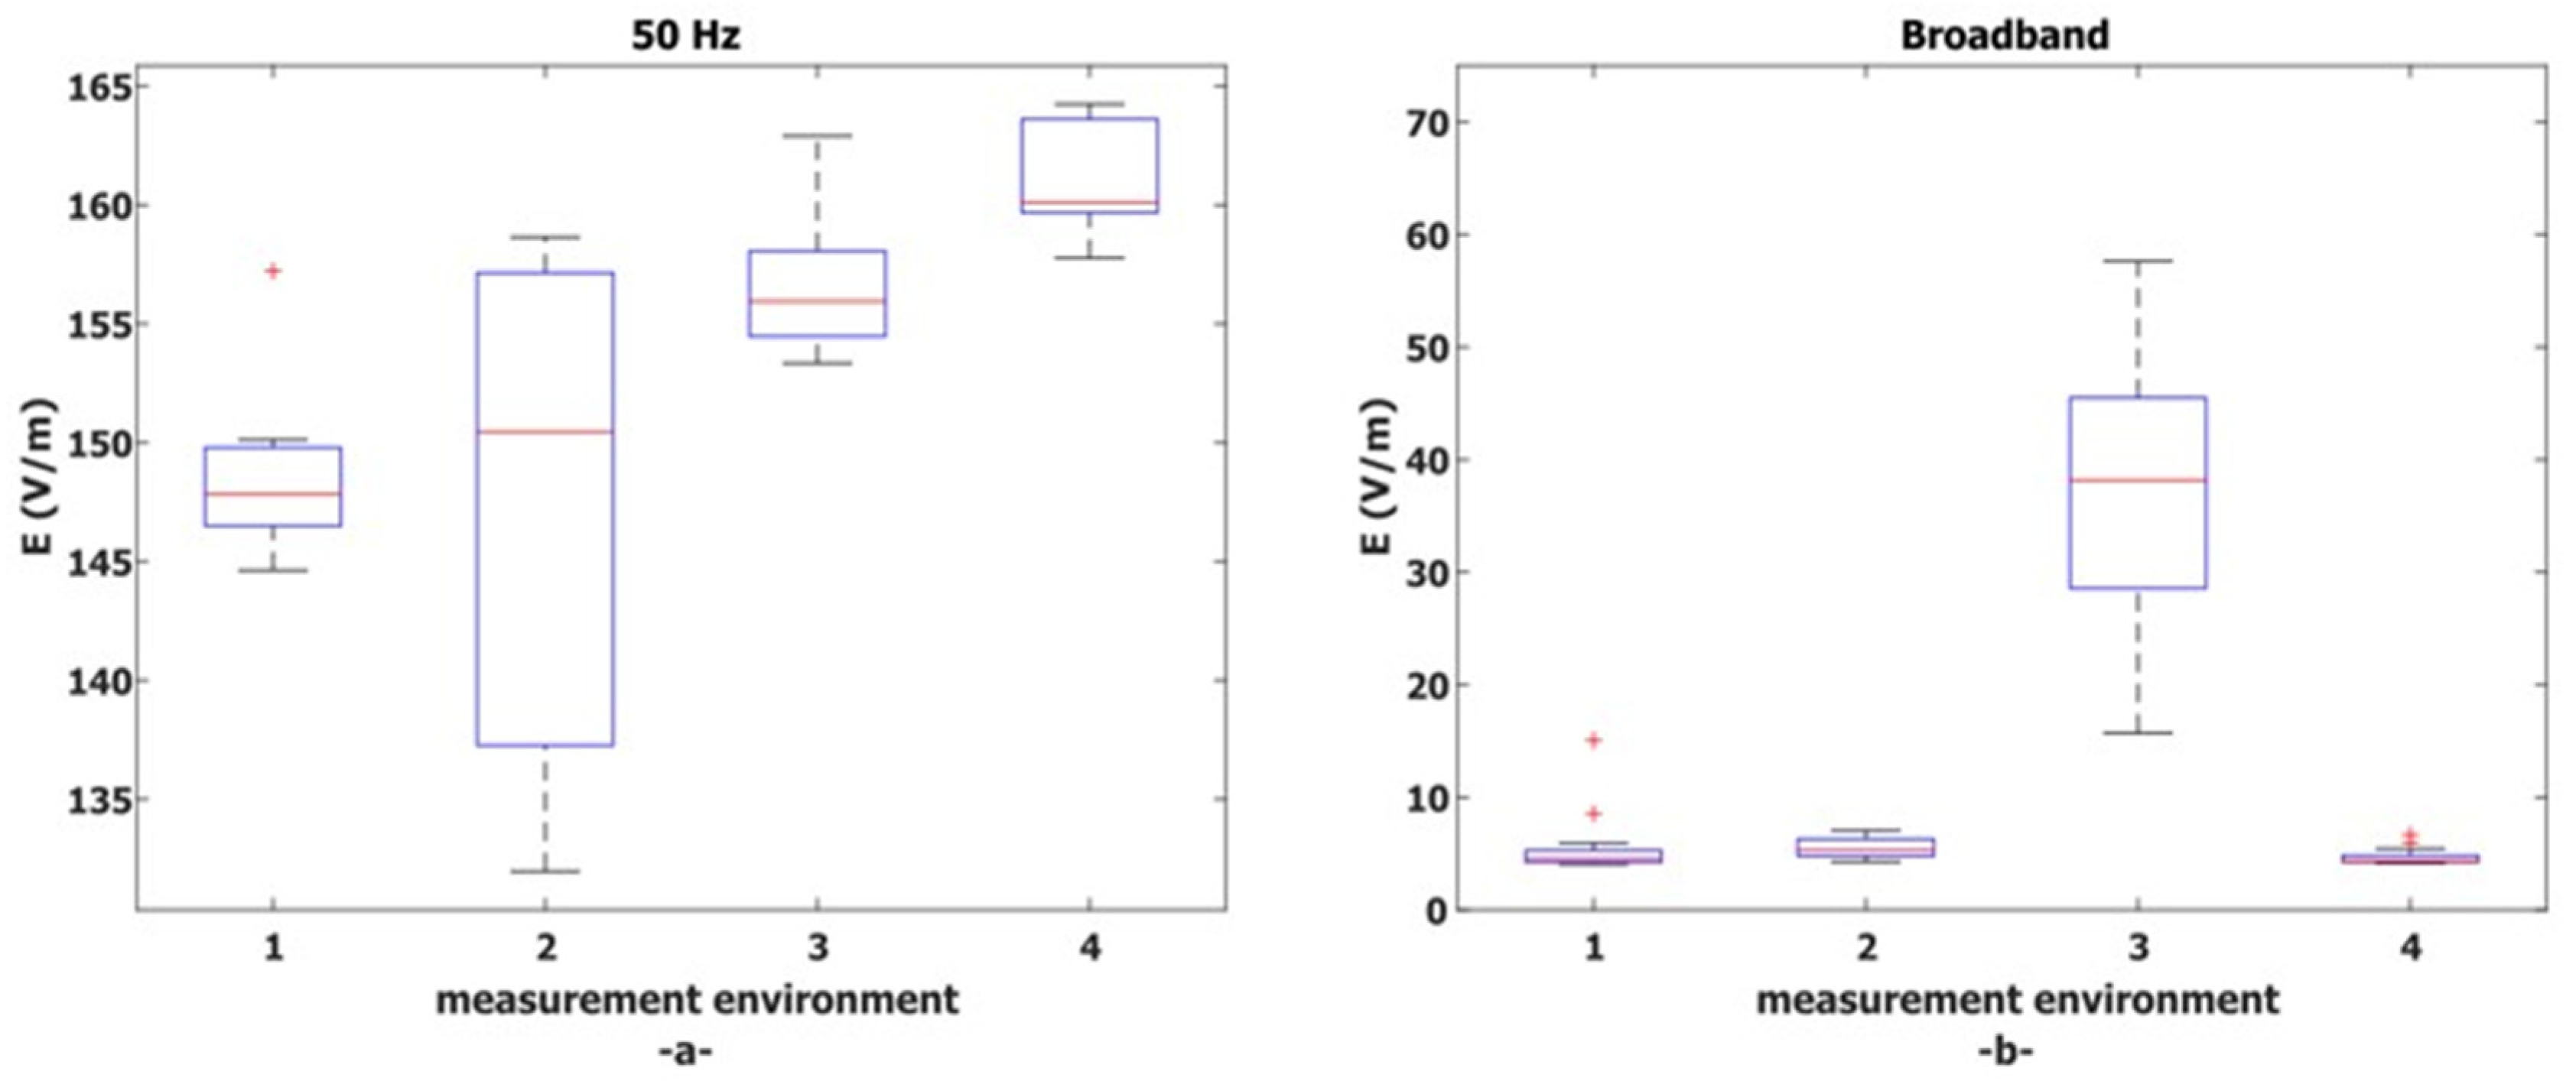
Figure 11 shows the change of 50 Hz (a) and broadband (b) electric field statistical values depending on the measurement environment.
Figure 11.
Variation of the statistical values of the effective electric field values obtained in (a) low-frequency, and (b) broadband electrical measurement according to the environments.
In Table 5, the number, percentage, average, and total of broadband electric field measurements within 1000 data points in six sub-bands are given. In Table 5, of the 1000 electric field effective values measured for the 1st environment (bedroom), 960 (96%) are ETC 2, 10 of them are GSM 900 (1%) and the remaining 30 electric field fields are measured in the ETC 1 (30%) sub-band. In the second environment, it is seen that 959 electric field values for the medium are in the ETC 2 (95.9%), 21 in the GSM 900 (2.1%), 19 in the LTE 800 (1.9%), and 1 in the LTE 1800 (0.1%) sub-band. It can be seen from the table that the measurements are concentrated in the ETC 2 sub-band (96%; 95.9%; 99.8%; and 48.1%).
Table 5.
Shows the distribution of measurements from broadband (700–2500 MHz) in fifteen subbands according to the number of data points, total electric field, and average electric field.
The mathematical expressions of the curves applied to the measurement results are given below (Density function).
The mathematical expressions of the curves applied to the measurement results are given below (CP).
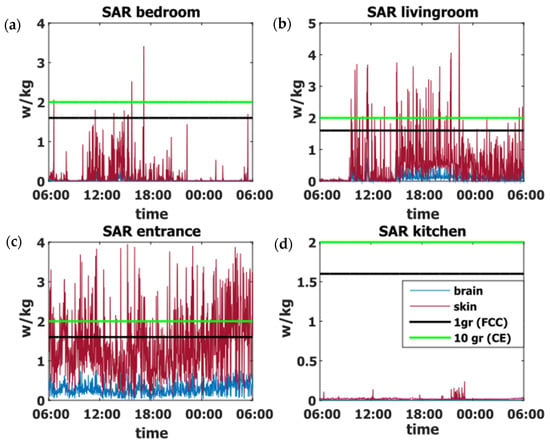
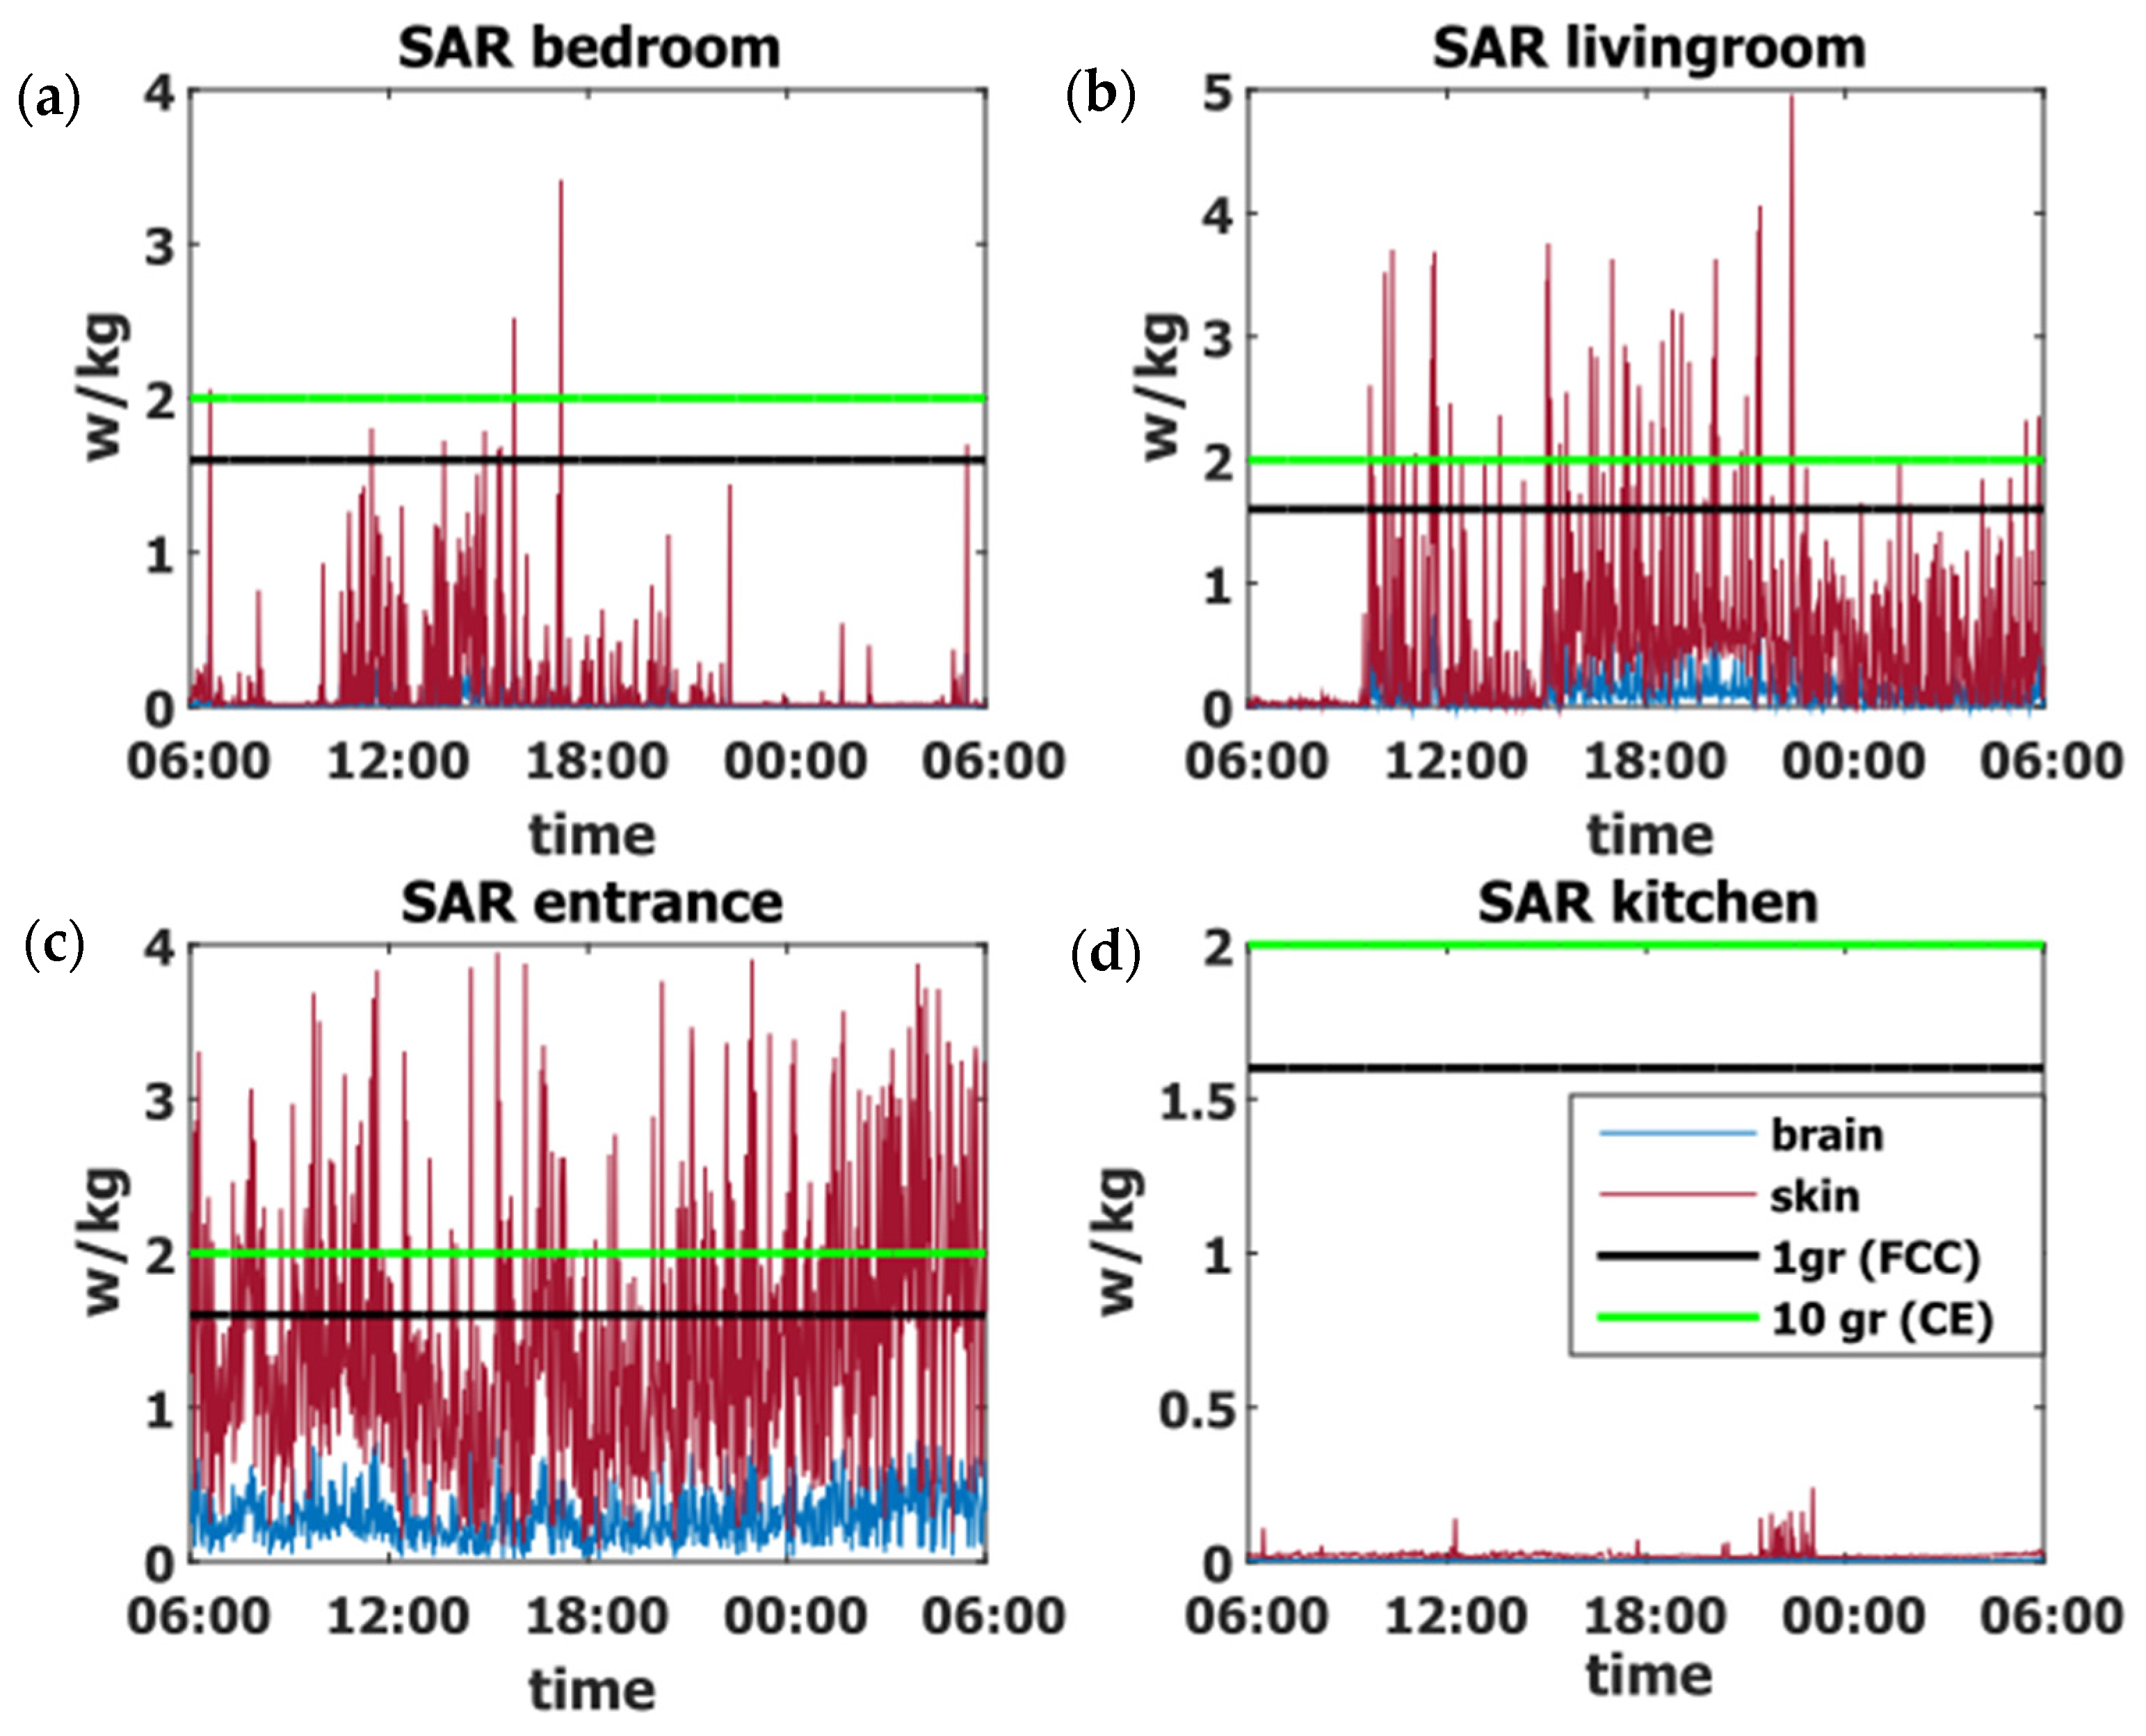
In Figure 12, the SAR values created by the broadband electric field values in the human head and brain in four environments are given, as well as the limit values recommended by ICNIRP and accepted by FCC and CE for the general public, and their variations.
Figure 12.
Change of 12 (a) bedroom, 12 (b) livingroom, 12 (c) entrance and 12 (d) kitchen SAR values in the head and brain in four environments over time, taking into account the limit values of FCC and EC.
As can be seen from Figure 12, SAR values in the other three environments, except the kitchen environment, exceed both (FEC and CE) limit values. It is seen that the limit values are exceeded greatly in the entrance and living room environments where the wireless modem is located. Especially in the entrance environment, the highest SAR value measured is 3.75 W/kg and its average is 1.74 W/kg, and this average is seen to be above the FCC’s limit value. The highest SAR value measured was 4.69 W/kg in the living room environment, and this value is 293.12% of the FCC and 234.5% of the CE. It can be seen that most of the SAR value occurring in the head part of the entrance environment is above the limit values of both CE and FCC. In Table 6, considering the middle frequencies of the six sub-bands, all the electrical variations of each of the six layers are shown in the table by finding the (εr, σ) at these frequencies.
Table 6.
All electrical properties of the head model were created for SAR calculation.
Table 7 shows the comparison between the changes revealed in the studies carried out in this field so far and my proposed study.
Table 7.
Comparison of my work with existing studies.
4. Conclusions
In this study, the effective value of low-frequency and broadband electric fields that people are exposed to was measured and interpreted for an apartment in four different environments where people spend most of their time in 24 h. Statistical (min, max, average, and std.) values of 1000 electric field effective values measured for all four environments were obtained. The changes in the electric field values obtained from both low and broadband measurements and the most suitable curves fitted to these values were plotted with respect to time using Matlab. The most appropriate curves are fitted to the density and CP functions of the same electric field values, and their changes with respect to the electric field are plotted on the same figure. Density and CP functions were expressed mathematically. To find the SAR value created by the electric field values recorded in broadband measurement on the heads and brains of people in the measurement environment, first, six sub-bands where these measurement values were concentrated were identified, the middle frequencies of these sub-bands were determined, and the statistical values of field changes within this sub-band were extracted. For the head model, assuming that the human head consists of six layers, starting from the skin to the brain, for the electrical modeling of each layer, εr and σ values corresponding to the middle frequencies of the subbands were determined, SAR values occurring in the head and brain were calculated, and their changes over time were plotted. It was observed that the values obtained from the 50 Hz measurement were far below the limit values determined by ICNIRP. In broadband measurements, it was observed that the values recorded, especially in the entrance and living room areas near the wireless modem, were quite high, and the highest value recorded in these environments was 293.12% of the FCC’s limit value and 234.5% of the CE limit value. It has been observed that these high SAR values will cause serious health problems for people living in environments where they are recorded, and it has been determined how serious a source of electromagnetic exposure the wireless modem is.
Funding
This research received no external funding.
Institutional Review Board Statement
Not applicable.
Informed Consent Statement
Not applicable.
Data Availability Statement
All the data required are available within the manuscript.
Conflicts of Interest
The author declares no conflicts of interest.
References
- Cansiz, M.; Celik, A.R.; Kurt, M.B. Measurements of Electric and Magnetic Field Intensities at 50 Hz Mains Frequency and Comparison of Measurement Results to Icnirp’s Reference Levels for General Public Exposure. Pamukkale Univ. J. Eng. Sci. 2014, 20, 294–299. [Google Scholar] [CrossRef] [Scilit]
- Camba, A.N.; Garcia, J.S.; Perretta, C.G. Exposure to 50 Hz Magnetic Fields in Homes and Areas Surrounding Urban Transformer Stations in Silla (Spain): Environmental Impact Assessment. Sustainability 2018, 10, 2641. [Google Scholar] [CrossRef] [Scilit]
- Verloock, L.; Joseph, W.; Goemimne, F.; Martens, L.; Verlaek, M.; Constandt, K. Assessment of Radio Frequency Exposures in Schools, Homes and Public Places in Belgium. Health Phys. 2014, 107, 503–513. [Google Scholar] [CrossRef] [Scilit] [PubMed]
- Aksan, O. Bir Devlet Hastanesindeki Elektromanyetik Alan (ema) Tespiti ve Saglik Calisanlarina Olasi Saglık Etkileri. Master’s Thesis, Tekirdag Namık Kemal Universitesi Fen Bilimleri Enstitusu, Tekirdag, Turkey, 2019. [Google Scholar]
- Liu, Y.; Liu, W.; Liu, K.; Ao, L.; Zhong, J.L.; Cao, J.; Liu, J. Effect of 50Hz Extremely Low-Frequency Electromagnetic Fields on the DNA Methylation and DNA Methyltransferases in Mouse Spermatocyte-Derived Cell Line GC-2. BioMed Res. Int. 2015, 2015, 237183. [Google Scholar]
- Helhel, S.; Ozen, S. Evaluation of Residential Exposure to Magnetic Field Produced by Power Lines Near Homes and Working Environments. Int. J. Eng. Appl. Sci. 2010, 2, 1–10. [Google Scholar]
- Singh, S.; Kapoor, N. Health Implications of Electromagnetic Fields, Mechanisms of Action, and Research Needs. Adv. Biol. 2014, 2014, 198609. [Google Scholar] [CrossRef] [Scilit]
- Calabro, E. Introduction to the Special Issue, Electromagnetic Waves Pollution. Sustainability 2018, 10, 3326. [Google Scholar] [CrossRef] [Scilit]
- Mutlu, M.; Kara, M. Low and High Frequency Exposure Electric Field Measurement in Ordu University Main Campus. In Proceedings of the 2nd International Technological Sciences and Design Symposium, Giresun, Turkey, 2–5 June 2022. e-ISBN: 978-975-2481-26-8. [Google Scholar]
- Baykan, P.; Unal, E.S. Measurement of Electromagnetic Radiation Emitted by Dect Phones Used in Office Environments and Evaluation of the Results in Terms of Occupational Health and Safety. East. Anatol. J. Sci. 2019, 5, 7–22. [Google Scholar]
- Silsupur, G.B. Ofis Ortamindaki Mesleki Elektromanyetik Alan Maruziyetinin Belirlenmesi ve Risk Duzeyinin Tespit Edilerek Cozum Onerilerinin Gelistirilmesi. Research Thesis, T.C. Calısma ve Sosyal Guvenlik Bakanligi Is Sagligi ve Guvenligi Genel Mudurlugu. Is Sagligi ve Guvenligi, Ankara, Turkey, 2016. [Google Scholar]
- Chiaramello, E.; Bonato, M.; Fiocchi, S.; Tognola, G.; Parazzini, M.; Ravazzani, P.; Wiart, J. Radio Frequency Electromagnetic Fields Exposure Assessment in Indoor Environments: A Review. Int. J. Environ. Res. Public Health 2019, 16, 955. [Google Scholar] [CrossRef] [Scilit]
- Giudici, P.D.; Genier, J.C.; Martin, S.; Doré, J.-F.; Ducimetière, P.; Evrard, A.-S.; Letertre, T.; Ségala, C. Radiofrequency exposure of people living near mobile-phone base stations in France. Environ. Res. J. 2020, 194, 110500. [Google Scholar] [CrossRef] [Scilit]
- Tynes, T.; Klæboe, L.; Haldorsen, T. Residential and occupational exposure to 50 Hz magnetic fields and malignant melanoma: A population based study. Occup. Environ. Med. 2003, 60, 343–347. [Google Scholar] [CrossRef] [Scilit] [PubMed]
- Gajšek, P.; Ravazzani, P.; Grellier, J.; Samaras, T.; Bakos, J.; Thuróczy, G. Review of Studies Concerning Electromagnetic Field (EMF) Exposure Assessment in Europe: Low Frequency Fields (50 Hz–100 kHz). Int. J. Environ. Res. Public Health 2016, 13, 875. [Google Scholar] [CrossRef] [Scilit] [PubMed]
- Cal, S. Saglik Sektorunde Calisanlarin Elektromanyetik Alan Maruziyetinin Belirlenmesi ve Cozum Onerilerinin Gelistirilmesi. Specialization Thesis, TC Calisma ve Sosyal Guvenlik Bakanligi Is Sagligi ve Guvenligi Genel Mudurlugu Is Sagligi ve Guvenligi Uzmanlık Tezi. Ankara, Turkey, 2016. [Google Scholar]
- Kunter, F. Students Exposure to Radio Frequency Electromagnetic Fields in Marmara University. Marmara Fen Bilim. Derg. 2015, 27, 32–36. [Google Scholar] [CrossRef] [Scilit]
- Koppel, T.; Hardell, L. Measurements of radiofrequency electromagnetic fields, including 5G, in the city of Columbia, SC, USA. World Acad. Sci. J. 2022, 4, 22. [Google Scholar] [CrossRef] [Scilit]
- Roosli, M.; Frei, P.; Bolte, J.; Neubauer, G.; Cardis, E.; Feychting, M.; Gajsek, P.; Heinrich, S.; Joseph, W.; Mann, S.; et al. Conduct of a personal radiofrequency electromagnetic field measurement study: Proposed study protocol. Environ. Health 2010, 9, 23. [Google Scholar] [CrossRef] [Scilit] [PubMed]
- Cerezci, O. Bursa Nilufer ilcesi Elektromanyetik Kirlilik Raporu. Elektromanyetik Alan ve Saglik Etkileri; Bursa Nilufer Belediyesi: Nilufer, Turkey, 2012; pp. 1–132. [Google Scholar]
- Mutlu, M.; Kurnaz, C. Evaluation of the Electromagnetic Field Levels in Ordu City Center for the Selected Base Stations’ Coverage Areas 1. In Proceedings of the International Techcnological Design Symposium, Giresun, Turkey, 27–29 June 2018; pp. 657–665. [Google Scholar]
- Kurnaz, C.; Mutlu, M. Comprehensive Radiofrequency Electromagnetic Field Measurements and Assessments: A City Center Example. Environ Monit Assess 2020, 192, 334. [Google Scholar] [CrossRef] [Scilit] [PubMed]
- Atikan, B.Y.; Bilgin, M.D.; Aksit, S. Turkiye’de bir Sehir Merkezinde Yasayan Sut Cocuklarinda ev ici Elektromanyetik Alan Maruziyeti. Balikesir Muhendislik Dergisi 2018, 2, 150–159. [Google Scholar]
- Seyfi, L.; Akbal, B. Konya’daki Bazı Yuksek Gerilim Hatti ve Trafo Binalari Yakininda Yapilan Manyetik Alan Olcumlerinin Degerlendirilmesi. In Proceedings of the 2nd International Symposium on Innovative Approaches in Scientific Studies, Samsun, Turkey, 30 November–2 December 2018; Volume 3, pp. 217–223. [Google Scholar]
- Malathi, A.C.J. Electromagnetic Radiation Hazards on Humans Due to Mobile Phones. Indian J. Sci. Technol. 2016, 9, 1–7. [Google Scholar]
- Calvente, I.; Núñez, M.I. Is the sustainability of exposure to non-ionizing electromagnetic radiation possible? Med. Clin. 2024, 162, 387–393. [Google Scholar] [CrossRef] [Scilit]
- Ahmad, N.A.; Saharan, P.F. SAR Measurement from Mobile Phone and Its Effect to Human Body. Elektrika 2023, 22, 63–69. [Google Scholar] [CrossRef] [Scilit]
- Available online: https://www.emrkoruma.com/index.php?part=rz6 (accessed on 19 February 2023).
- Environmental Health Criteria 238-Extremely Low Frequency Fields. 2024; pp. 1–543. Available online: https://tuketici.btk.gov.tr/uploads/pages/tuketici-rehberi/baz-istasyonu-brosur.pdf (accessed on 20 February 2023).
- Yekeen, O.O.; Nicholas, A.A. 3G, 4G, 5G Cell Tower and Their Effects on Human Health: Case Study of the Brain. Int. J. Eng. Appl. Sci. Technol. 2020, 5, 20–24. [Google Scholar] [CrossRef] [Scilit]
- Balanis, A.C. Advanced Engineering Eectromagnetics; John Wiley & Sons: Hoboken, NJ, USA, 2012. [Google Scholar]
- Kurnaz, C.; Mutlu, M. Uzun sureli radyofrekansı elektromanyetik alan seviyesinin izlenmesi ve modellenmesi. Gazi Univ. Muhendis. Mimar. Fak. Derg. 2021, 36, 669–684. [Google Scholar] [CrossRef] [Scilit]
- Engiz, B.K.; Kurnaz, C. Long-term electromagnetic field measurement and assessment for a shopping mall. Radiat. Prot. Dosim. 2017, 175, 321–329. [Google Scholar] [CrossRef] [Scilit] [PubMed]
- Kurnaz, C.; Engiz, B.K. Distribution fitting for long term electric field strength measurements. In Proceedings of the 40th International Conference on Telecommunications and Signal Processing (TSP), Barcelona, Spain, 5–7 July 2017; pp. 1–5. [Google Scholar]
- Engiz, B.K.; Kurnaz, C. Ev Ortamında Maruz Kalinan Baz Istasyonu Kaynakli Elektrik Alan Siddetinin Izlenmesi ve Degerlendirilmesi. Afyon Kocatepe Univ. Fen Ve Muhendis. Bilim. Derg. 2018, 18, 913–920. [Google Scholar]

Disclaimer/Publisher’s Note: The statements, opinions and data contained in all publications are solely those of the individual author(s) and contributor(s) and not of MDPI and/or the editor(s). MDPI and/or the editor(s) disclaim responsibility for any injury to people or property resulting from any ideas, methods, instructions or products referred to in the content. |
© 2024 by the author. Licensee MDPI, Basel, Switzerland. This article is an open access article distributed under the terms and conditions of the Creative Commons Attribution (CC BY) license (https://creativecommons.org/licenses/by/4.0/).