Designing and Planning of Studies of Driver Behavior at Pedestrian Crossings Using Whole-Vehicle Simulators
Abstract
1. Introduction
2. Principles of Simulator Testing
3. Simulator Sickness
4. Planning and Design of Studies of Driver Behavior at Pedestrian Crossings Using Simulators
4.1. Defining the Research Context and Assumptions
- -
- Analysis of the impact of the type of pedestrian crossing;
- -
- Analysis of the impact of the method (system) of warning;
- -
- Analysis of the impact of surrounding infrastructure conditions;
- -
- Analysis of the impacts of driving speed and weather conditions (including time of day);
- -
- Analysis of the impact of the behavior of vulnerable traffic participants (pedestrian and cyclist);
- -
- Analysis of the impacts of internal and external distractors on attention.
- -
- Elimination of the effect of driver fatigue during the study (short testing time);
- -
- Elimination of the effect of additional medical conditions on driving ability;
- -
- Eliminating the impact of driving experience;
- -
- Eliminating the impact of road infrastructure lighting and driver glare;
- -
- Eliminating the impact of additional vehicle safety systems (including “assistances” and obstacle detection sensors).
4.2. Selection of the Type of the Driving Simulator
4.3. Research Planning
4.4. Defining the Research Scenario
4.5. Configuration of the Set of Recorded Data
4.6. Research Ethics
4.7. Participant Training
4.8. Research Context Implementation—Attentional Distractors
5. Final Simulation Research Method of Driver Behavior at Pedestrian Crossings
5.1. Validation of Final Research Method of Driver Behavior at Pedestrian Crossings
- -
- Urban infrastructure;
- -
- Suburban infrastructure;
- -
- An area with sparse infrastructure;
- -
- Forest area;
- -
- An area without infrastructure.
- -
- Variant 1: sign D-6 “pedestrian crossing”;
- -
- Variant 2: sign D-6 “pedestrian crossing” and horizontal sign “airport” in the form of a permanent light signal;
- -
- Variant 3: sign D-6 “pedestrian crossing” and horizontal sign “airport” in the form of a flashing light signal;
- -
- Variant 4: sign D-6 “pedestrian crossing” and variable message sign (VMS) “STOP” in the form of a solid light signal;
- -
- Variant 5: sign D-6 “pedestrian crossing” and variable message sign (VMS) “STOP” in the form of a flashing light signal;
- -
- Variant 6: sign D-6 “pedestrian crossing” and variable content sign (VMS) “pictogram” in the form of a solid light signal;
- -
- Variant 7: a D-6 “pedestrian crossing” sign and a variable content sign (VMS) “pictogram” in the form of a flashing light signal.
- -
- A pedestrian walking normally;
- -
- A pedestrian who, after entering the crossing, stops and turns around;
- -
- A pedestrian who, after stepping into the crosswalk, stops for a moment and continues walking;
- -
- A pedestrian running across a crosswalk;
- -
- A pedestrian in an inebriated state (varying speed and angle of movement);
- -
- A cyclist crossing a bicycle crossing.
5.2. Alternative Markings for Pedestrian Crossings without Traffic Lights
5.3. Additional Surveyed Questions
- ✓
- In your opinion, was the pictogram or the STOP sign more legible during the study?
- ✓
- Which of the pictograms and text signs presented is the most understandable to you?
- ✓
- Were there any elements along the route that were confusing to you in some way during the ride? If “yes”, please specify which ones, if “no” please skip the question.
- ✓
- In your opinion, did the signs that appeared guarantee sufficient time to react in a situation where a pedestrian appeared at a pedestrian crossing? If “no” please justify why, if “yes” please skip the question.
- ✓
- In your opinion, what did the light signs built into the roadway mean?
- ✓
- Is the sensation of driving in the simulator in your case comparable to driving a conventional vehicle in normal traffic?
- ✓
- In your opinion, is the placement of variable message signs (pictograms and text signs) on the screen on the right side of the road optimal and does not cause discomfort when reading the intent of the sign? If “no” please justify why, if “yes” please skip the question.
- ✓
- Which of the signs was visually “better” for you to perceive?
- ✓
- Which of the signs was more difficult for you to understand and required more attention?
- ✓
- Which of the signs shown do you think could be used in front of a pedestrian crossing? (you can mark more than one answer)
- ✓
- Were any of the behaviors of pedestrians or cyclists surprising to you? If “yes” please justify which ones, if “no” please skip the question.
- ✓
- How long have you held your driver’s license?
- ✓
- How many kilometers on average do you drive per year as a driver?
- ✓
- Are you a professional driver?
- ✓
- Have you been fined for speeding in the last 5 years?
- ✓
- Do you have a visual impairment?
6. Conclusions
Author Contributions
Funding
Institutional Review Board Statement
Informed Consent Statement
Data Availability Statement
Conflicts of Interest
References
- Benlagha, N.; Charfeddine, L. Risk factors of road accident severity and the development of a new system for prevention: New insights from China. Accid. Anal. Prev. 2020, 136, 105411. [Google Scholar] [CrossRef] [PubMed]
- Vaiana, R.; Perri, G.; Iuele, T.; Gallelli, V. A Comprehensive Approach Combining Regulatory Procedures and Accident Data Analysis for Road Safety Management Based on the European Directive 2019/1936/EC. Safety 2021, 7, 6. [Google Scholar] [CrossRef]
- Almukdad, A.; Muley, D.; Alfahel, R.; Alkadour, F.; Ismail, R.; Alhajyaseen, W.K. Assessment of different pedestrian communication strategies for improving driver behavior at marked crosswalks on free channelized right turns. J. Saf. Res. 2023, 84, 232–242. [Google Scholar] [CrossRef]
- Hallsworth, M. A manifesto for applying behavioural science. Nat. Hum. Behav. 2023, 7, 310–322. [Google Scholar] [CrossRef]
- Zhao, X.; Wang, Z.; Xu, Z.; Wang, Y.; Li, X.; Qu, X. Field experiments on longitudinal characteristics of human driver behavior following an autonomous vehicle. Transp. Res. Part C Emerg. Technol. 2023, 114, 205–224. [Google Scholar] [CrossRef]
- Ahmed, H.U.; Huang, Y.; Lu, P. A Review of Car-Following Models and Modeling Tools for Human and Autonomous-Ready Driving Behaviors in Micro-Simulation. Smart Cities 2021, 4, 314–335. [Google Scholar] [CrossRef]
- Zakrzewicz, W.; Sys, E.; Mrowicki, A.; Siczek, K.; Kubiak, P. Safety issues for electric and hybrid vehicles. In Proceedings of the 2020 XII International Science-Technical Conference AUTOMOTIVE SAFETY, Kielce, Poland, 21–23 October 2020; pp. 1–7. [Google Scholar] [CrossRef]
- Racewicz, S.; Kazimierczuk, P.; Kolator, B.; Olszewski, A. Use of 3 kW BLDC motor for light two-wheeled electric vehicle construction. IOP Conf. Ser. Mater. Sci. Eng. 2018, 421, 042067. [Google Scholar] [CrossRef]
- Khan, D.; Burdzik, R. Measurement and analysis of transport noise and vibration: A review of techniques, case studies, and future directions. Measurement 2023, 220, 113354. [Google Scholar] [CrossRef]
- Khan, D.; Burdzik, R. A review on different regulation for the measurement of transport noise and vibration. J. Meas. Eng. 2023, 11, 196–213. [Google Scholar] [CrossRef]
- Faus, M.; Alonso, F.; Esteban, C.; Useche, S. Are Adult Driver education Programms Effective? A Systematic Review of Evaluations of Accident Prevention Training Courses. Int. J. Educ. Psychol. 2023, 12, 62–91. [Google Scholar] [CrossRef]
- World Health Organisation. Global Status Report on Road Safety; WHO: Geneva, Switzerland, 2013; Volume 364, pp. 88–111. [Google Scholar]
- Wundersitz, L.N.; Hutchinson, T.P. Identyfying and Improving Exposure Measures. Univ. Adel. Adel. Aust. 2018, 164, 102–110. [Google Scholar]
- Goldenbeld, C.; Van Schagen, I. The credibility of speed limits on 80 km/h rural roads: The effects of roads and personality characteristics. Accis. Anal. Prev. 2007, 39, 1121–1130. [Google Scholar] [CrossRef]
- Burdzik, R.; Celiński, I.; Rozmus, J. An innovative method of research on the perception and selection of the message of the variable message sign. In Proceedings of the International Scientific Conference Transport of the 21st Century, Józefów, Poland, 30 August–2 September 2022; Siergiejczyk, M., Rosiński, A., Eds.; Oficyna Wydawnicza Politechniki Warszawskiej: Warsaw, Poland, 2022; pp. 43–44, ISBN 978-83-8156-413-7. [Google Scholar]
- Azad, A. Road Traffic Crash Data: An overview on sources, Problems, and Collection Methods. J. Transp. Technol. 2017, 7, 206–219. [Google Scholar] [CrossRef]
- Niezgoda, M.; Kamiński, T.; Ucińska, M.; Kruszewski, M. Effective Methods for Drivers Research with use of driving simulator. J. Kones Powertrain Transp. 2011, 18, 309–316. [Google Scholar]
- Ronen, A.; Yair, N. The adaptation period to a driving simulator. Transp. Res. Part F 2013, 18, 94–106. [Google Scholar] [CrossRef]
- Racewicz, S.; Chrzan, P.; Riu, D.M.; Retière, N.M. Time domain simulations of synchronous generator modelled by half-order system. In Proceedings of the IECON 2012-38th Annual Conference on IEEE Industrial Electronics Society, Montreal, QC, Canada, 25–28 October 2012. [Google Scholar] [CrossRef]
- Asmael Noor, M.; Waheed, M.Q. Analysis of Pedestrian Characteristics Crossing along Roads. Transp. Probl. 2023, 18, 189–200. [Google Scholar] [CrossRef]
- Iwanowicz, D. Traffic control at pedestrian priority crossings with guaranteed lane throughput capacity as exemplified by the legal regulations applicable in Poland. Sci. J. Silesian Univ. Technology. Ser. Transport. 2024, 122, 85–109, ISSN 0209-3324. [Google Scholar] [CrossRef]
- Alhabib, M.H.; Ali, Q.I. Internet of autonomous vehicles communication infrastructure: A short review. Diagnostyka 2023, 24, 2023302. [Google Scholar] [CrossRef]
- Van Winsum, W.; Brookhuis, K.A.; De Waard, D. A comparison of different ways to approximate time-to-line crossing (TLC) during car driving. Accid. Anal. Prev. 2016, 32, 47–56. [Google Scholar] [CrossRef]
- Saetren, G.B.; Pedersen, P.A.; Robertsen, R.; Haukeberg, P.; Rasmussen, M.; Lindheim, C. Simulator training in driver education—Potential Gains and Challenges. In Safety and Reliability-Safe Societies in Changing World; CRC Press: Boca Raton, FL, USA, 2018; pp. 2045–2049. [Google Scholar] [CrossRef]
- Papakostas, C.; Troussas, C.; Krouska, A.; Sgouropoulou, C. Measuring User Experience Usability and Interactivity of a Personalized Mobile augmented reality Training System. Sensors 2021, 21, 3888. [Google Scholar] [CrossRef]
- Brooks, J.O.; Goodenough, R.R.; Crisler, M.C.; Klein, N.D.; Alley, R.L.; Koon, B.L.; Logan, W.C., Jr.; Ogle, J.H.; Tyrrell, R.A.; Wills, R.F. Simulator sickness during driving simulation studies. Accid. Anal. Prev. 2010, 42, 788–796. [Google Scholar] [CrossRef] [PubMed]
- Domeyer, J.E.; Cassavaugh, N.D.; Backs, R.W. The use of adaptation to reduce simulator sickness in driving assessment and research. Accid. Anal. Prev. 2013, 53, 2117–2124. [Google Scholar] [CrossRef]
- Biernacki, M.; Dziuda, Ł. Simulator sickness as a valid issue of simulator-based research. Med. Pr. 2012, 63, 377–388. [Google Scholar]
- Sharples, S.; Cobb, S.; Moody, A.; Wilson, J.R. Virtual reality induced symptoms and effects: Comaprison of head mounted display, desktop and projection display systems. Displays 2018, 29, 58–69. [Google Scholar] [CrossRef]
- Kennedy, R.S.; Allgood, G.O.; van Hoy, B.W.; Lilienthal, M.G. Motion sickness symptoms and postural changes following flights in motion-based flight trainers. J. Low Freq. Noise Vib. 1987, 6, 147–154. [Google Scholar] [CrossRef]
- Curry, R.; Artz, B.; Cathey, L.; Grant, P.; Greenberg, J. Kennedy SSQ results: Fixed vs. motion-base ford simulators. In Proceedings of the Driving Simulation Conference, Paris, France, January 2002; pp. 289–300. [Google Scholar]
- Zhang, Y.; Angell, L.; Pala, S.; Shimonomoto, I. Bench-Marking Drivers Visual and Cognitive Demands: A Feasibility Study. SAE Int. J. Passeng. Cars—Mech. Syst. 2015, 8, 584–593. [Google Scholar] [CrossRef]
- Mehler, B.; Reimer, B.; Dusek, J.A. MIT AgeLab Delayed Digit Recall Task (n-Back); MIT AgeLab white paper number 2011-3B; MIT: Cambridge, MA, USA, 2011. [Google Scholar]
- Burdzik, R.; Celiński, I.; Młyńczak, J. Study of the Microsleep in Public Transport Drivers. In Research Methods and Solutions to Current Transport Problems. ISCT21 2019; Siergiejczyk, M., Krzykowska, K., Eds.; Advances in Intelligent Systems and Compu-ting; Springer: Cham, Switzerland, 2020; Volume 1032. [Google Scholar] [CrossRef]
- Hartfiel, B.; Kroys, A.; Kruithof, N.; Stark, R. Driving Simulator with VR Glasses for Evaluation of New Interior Concepts. ATZ Worldw. 2019, 121, 16–23. [Google Scholar] [CrossRef]
- Jamson, S.L.; Jamson, A.H. The validity of a low-cost simulator for the assessment of the effects of in-vehicle information systems. Saf. Sci. 2010, 48, 1477–1483. [Google Scholar] [CrossRef]
- Ali, Y.; Sharma, A.; Haque, M.M.; Zheng, Z.; Saifuzzaman, M. The impact of the connected environment on driving behavior and safety: A driving simulator study. Accid. Anal. Prev. 2020, 144, 105643. [Google Scholar] [CrossRef]
- Salas, E.; Rosen, M.A.; Held, J.D.; Weismuller, J.J. Performance measurement in simulation based training; A review and best practces. Simul. Gaming 2009, 40, 328–376. [Google Scholar] [CrossRef]
- Valero-Mora, P.M.; Zacares, J.J. Sanchez-Garcia, M.; Tormo-Lancero, M.T.; Faus, M. Conspiracy beliefs are related to the use of smartphones behind the wheel. Int. J. Environ. Health Res. 2021, 18, 7725. [Google Scholar] [CrossRef] [PubMed]
- Grządziela, A.; Kluczyk, M. Shock Absorbers Damping Characteristics by Lightweight Drop Hammer Test for Naval Machines. Materials 2021, 14, 772. [Google Scholar] [CrossRef]
- Gąsiorek, K.; Odachowska, E.; Ucińska, M. Psychological determinants of driver behaviour in experimental road marking research. Autobusy Tech. Eksploat. Syst. Transp. 2017, 18, 12. [Google Scholar]
- Wassink, I.; Van Dijk, B.; Zwiers, J.; Nijholt, A.; Kuipers, J.; Brugman, A. Generating dynamics scenarios in a driving simulator. IEEE Intel. Syst. 2020, 21, 28–32. [Google Scholar] [CrossRef]
- Odachowska, E.; Ucińska, M.; Gąsiorek, K. Psychological Determinants of the Driver’s Behaviour in the Context of Introducing Experimental Road Signs in Poland. In International Scientific Conference Transport of the 21st Century; Springer: Cham, Switzerland, 2020; pp. 295–306. [Google Scholar] [CrossRef]
- Godley, S.T.; Triggs, T.J.; Fildes, B.N. Driving simulator validation for speed research. Accid. Anal. Prev. 2002, 34, 589–600. [Google Scholar] [CrossRef] [PubMed]
- ISO Standard Number 14198; Road Vehicles—Ergonomic Aspects of Transport Information and Control Systems—Calibration Tasks for Methods which Assess Driver Demand Due to the Use of In-Vehicle Systems. ISO: Geneva, Switzerland, 2019.



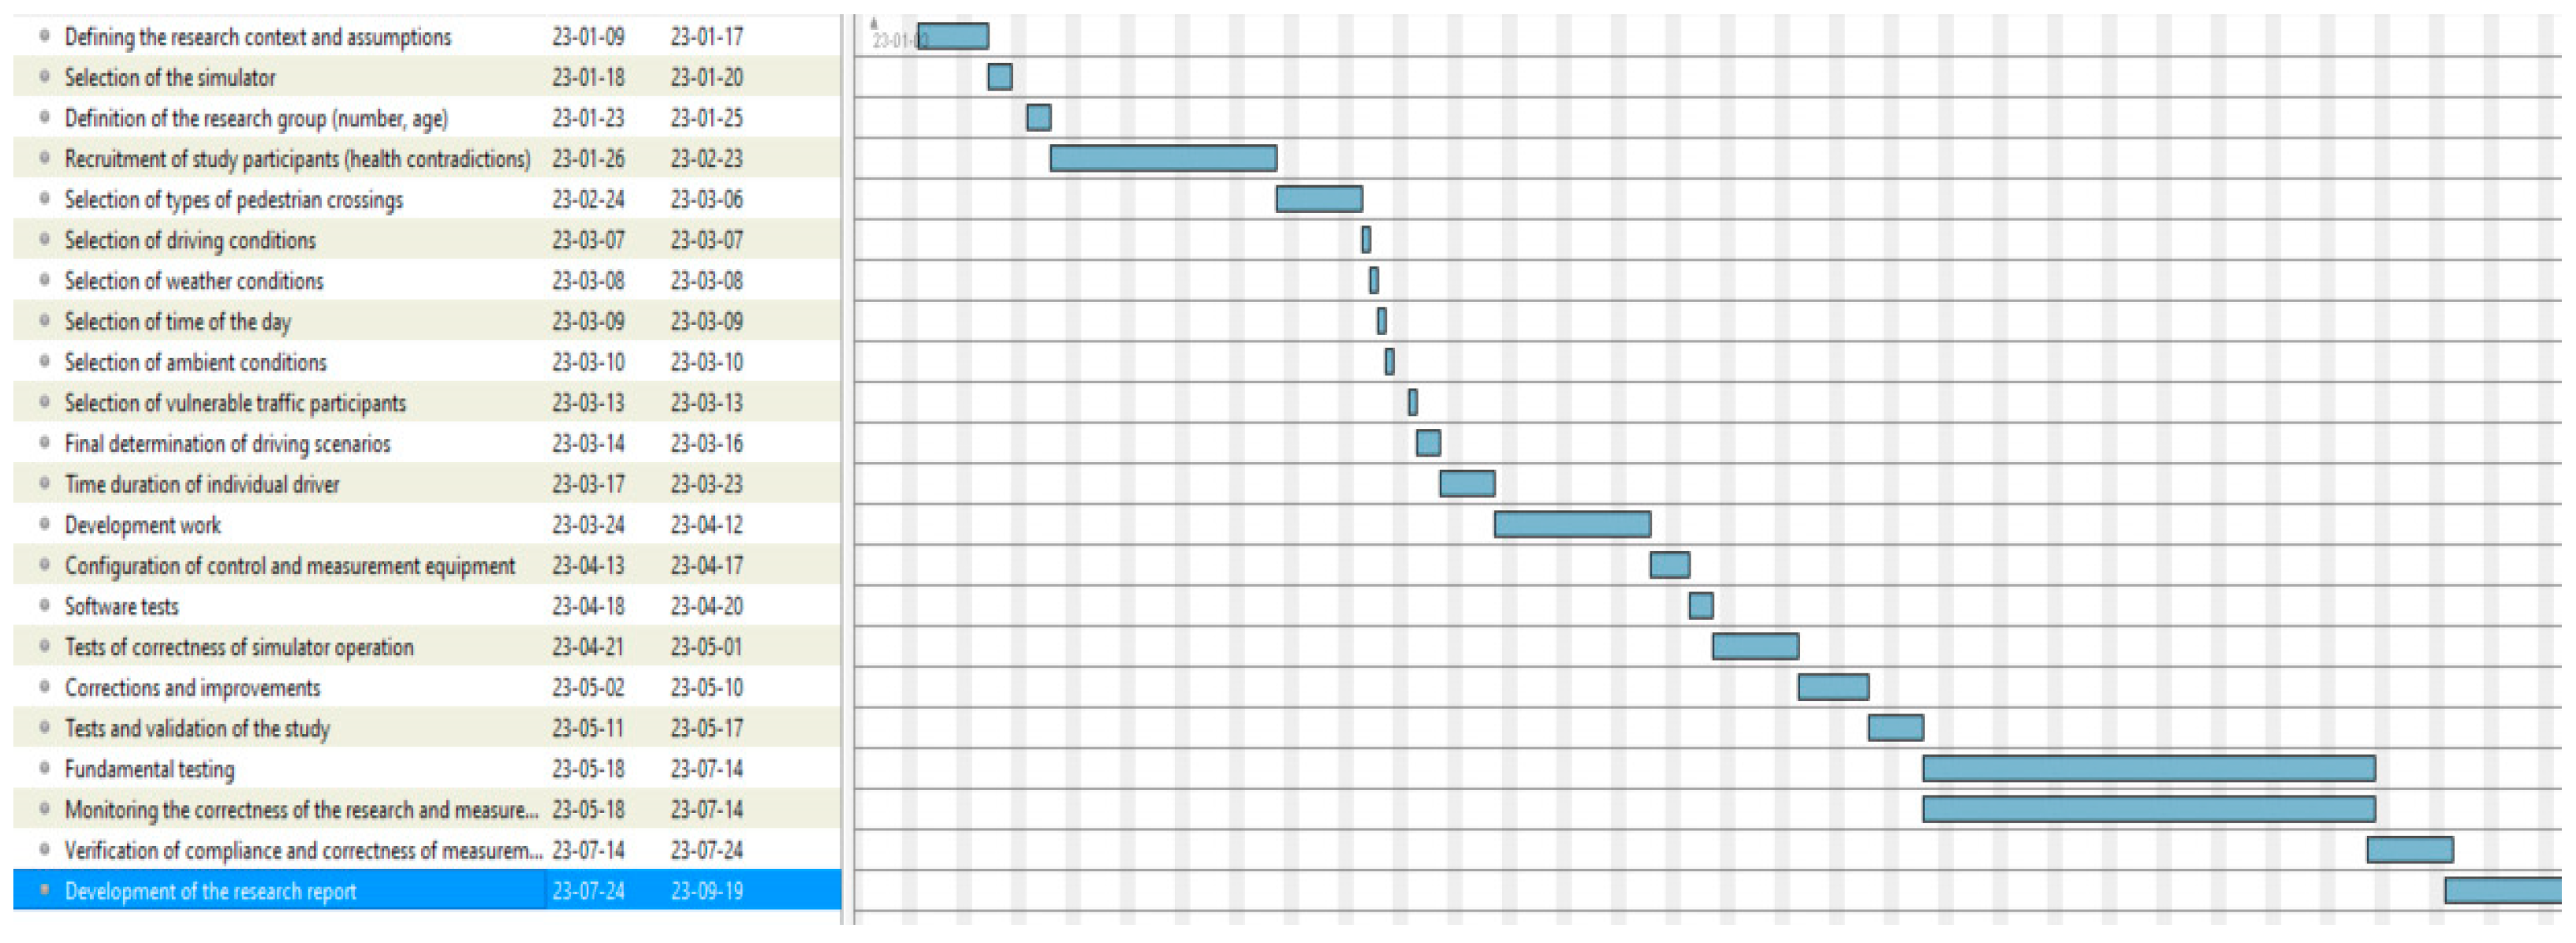



| Operation | Time Duration |
|---|---|
| 1—Defining the research context and assumptions | 1 week |
| 2—Selection of simulator | 3 days |
| 3—Definition of the research group (number and age, etc.) | 1 day |
| 4—Recruitment of study participants (verification of health contraindications) | 3 weeks |
| 5—Selection of context (e.g., types of pedestrian crossings) | 1 week |
| 6—Selection of driving conditions (e.g., speed and location) | 1 day |
| 7—Selection of weather conditions | 1 day |
| 8—Selection of times of day and night of research | 1 day |
| 9—Selection of ambient conditions (built environment) | 1 day |
| 10—Selection of vulnerable traffic participants | 1 day |
| 11—Final determination of driving scenarios—3 days | 3 days |
| 12—Estimation of the time of individual driving stages and the total study | 3 days |
| 13—Development work (design of the study according to the guidelines) | 2 weeks |
| 14—Configuration of control and measurement equipment (determination of recorded data) | 3 days |
| 15—Software tests | 3 days |
| 16—Tests of correctness of simulator operation | 5–7 days |
| 17—Corrections and improvements—1 week | 1 week |
| 18—Tests and validation of the study (evaluation of compliance with the assumptions, purpose, and scope of the basis) | 5 days |
| 19—Core research (according to the accepted scope) | 2–6 weeks |
| 20—Monitoring the correctness of the research and measurement process (in parallel with 19) | 2–6 weeks |
| 21—Verification of compliance and correctness of measurement results | 1–2 weeks |
| 22—Development of the research report | 4–6 weeks |
Disclaimer/Publisher’s Note: The statements, opinions and data contained in all publications are solely those of the individual author(s) and contributor(s) and not of MDPI and/or the editor(s). MDPI and/or the editor(s) disclaim responsibility for any injury to people or property resulting from any ideas, methods, instructions or products referred to in the content. |
© 2024 by the authors. Licensee MDPI, Basel, Switzerland. This article is an open access article distributed under the terms and conditions of the Creative Commons Attribution (CC BY) license (https://creativecommons.org/licenses/by/4.0/).
Share and Cite
Burdzik, R.; Simiński, D.; Kruszewski, M.; Niedzicka, A.; Gąsiorek, K.; Zabieva, A.B.; Mamala, J.; Dębicka, E. Designing and Planning of Studies of Driver Behavior at Pedestrian Crossings Using Whole-Vehicle Simulators. Appl. Sci. 2024, 14, 4217. https://doi.org/10.3390/app14104217
Burdzik R, Simiński D, Kruszewski M, Niedzicka A, Gąsiorek K, Zabieva AB, Mamala J, Dębicka E. Designing and Planning of Studies of Driver Behavior at Pedestrian Crossings Using Whole-Vehicle Simulators. Applied Sciences. 2024; 14(10):4217. https://doi.org/10.3390/app14104217
Chicago/Turabian StyleBurdzik, Rafał, Dawid Simiński, Mikołaj Kruszewski, Anna Niedzicka, Kamila Gąsiorek, Aliya Batyrbekovna Zabieva, Jarosław Mamala, and Ewa Dębicka. 2024. "Designing and Planning of Studies of Driver Behavior at Pedestrian Crossings Using Whole-Vehicle Simulators" Applied Sciences 14, no. 10: 4217. https://doi.org/10.3390/app14104217
APA StyleBurdzik, R., Simiński, D., Kruszewski, M., Niedzicka, A., Gąsiorek, K., Zabieva, A. B., Mamala, J., & Dębicka, E. (2024). Designing and Planning of Studies of Driver Behavior at Pedestrian Crossings Using Whole-Vehicle Simulators. Applied Sciences, 14(10), 4217. https://doi.org/10.3390/app14104217


