
Research on Acoustic Emission Characteristics and Crack Evolution during Rock Failure under Tensile and Tensile- and Compressive-Shear Stress States

Abstract
:1. Introduction
2. Test Procedures
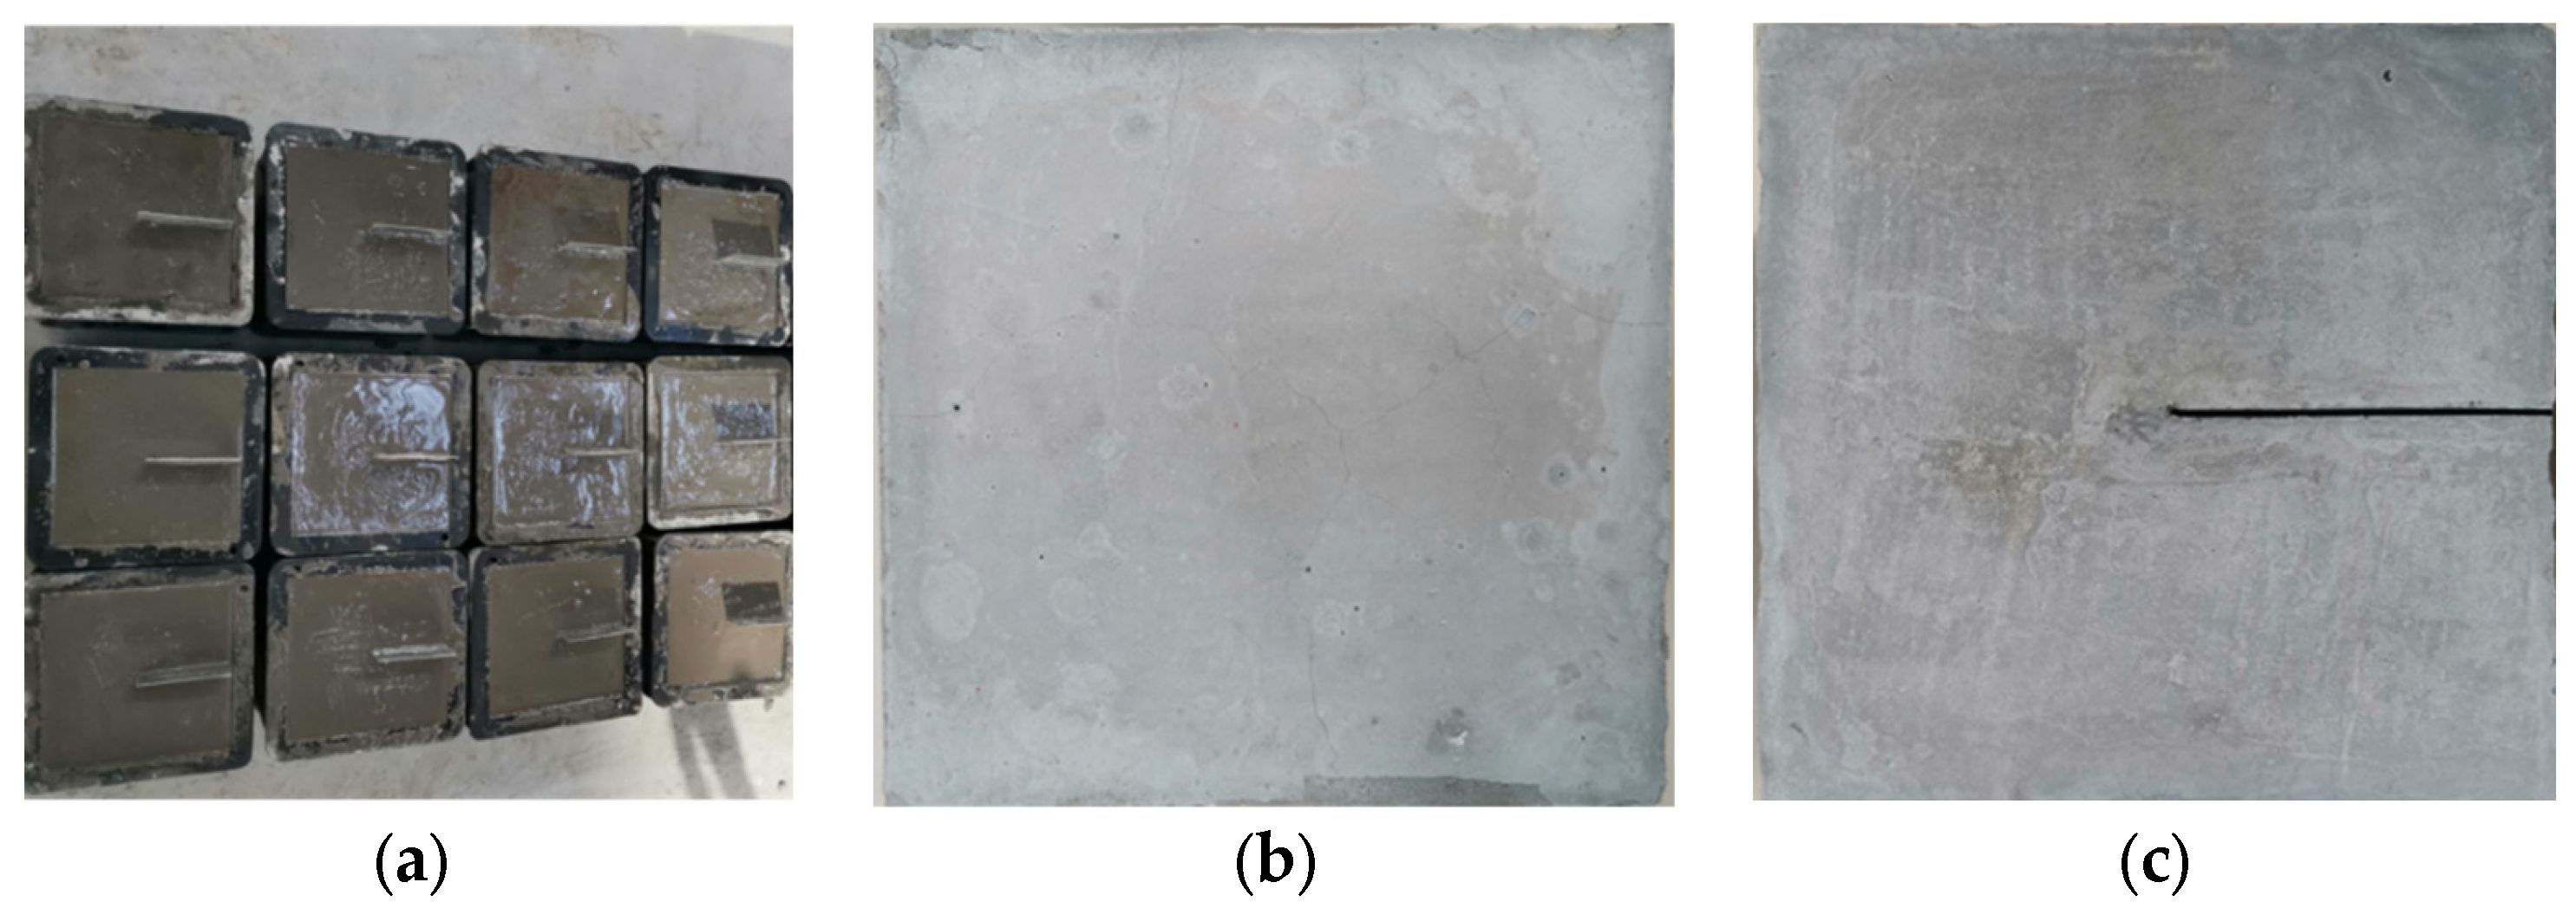
2.1. Specimen Preparation
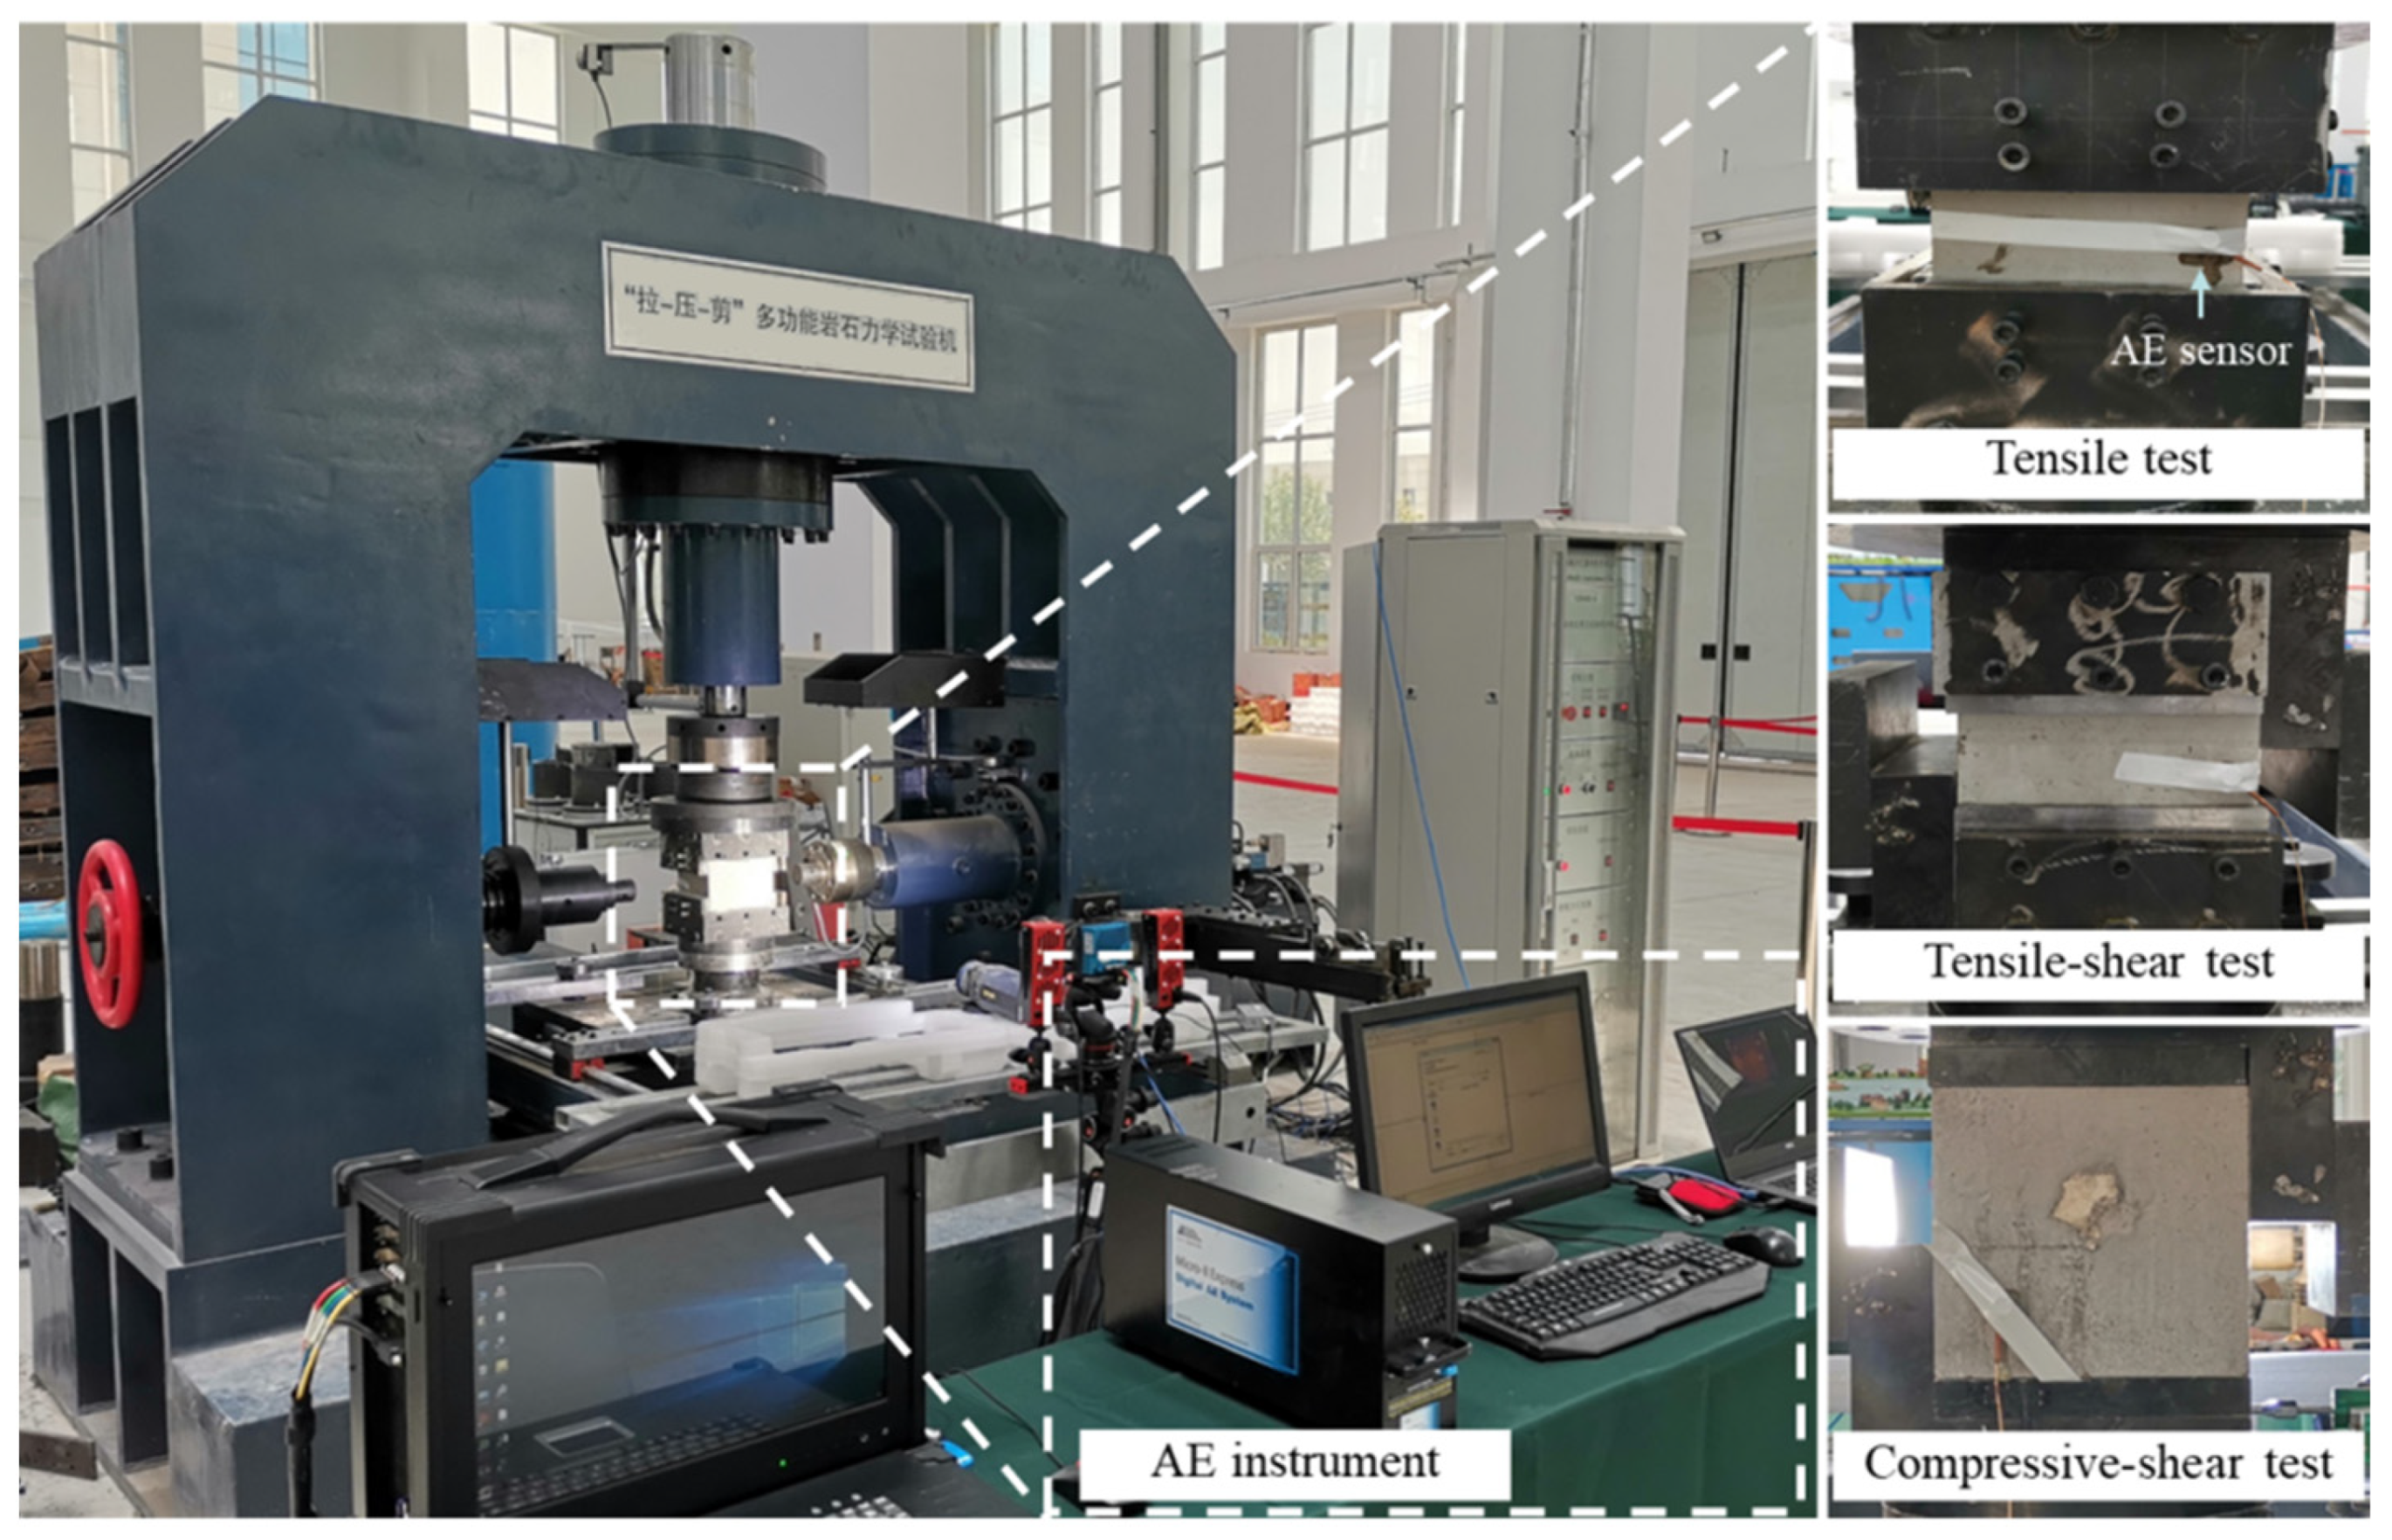
2.2. Test and Monitoring Methods
3. Results Analysis
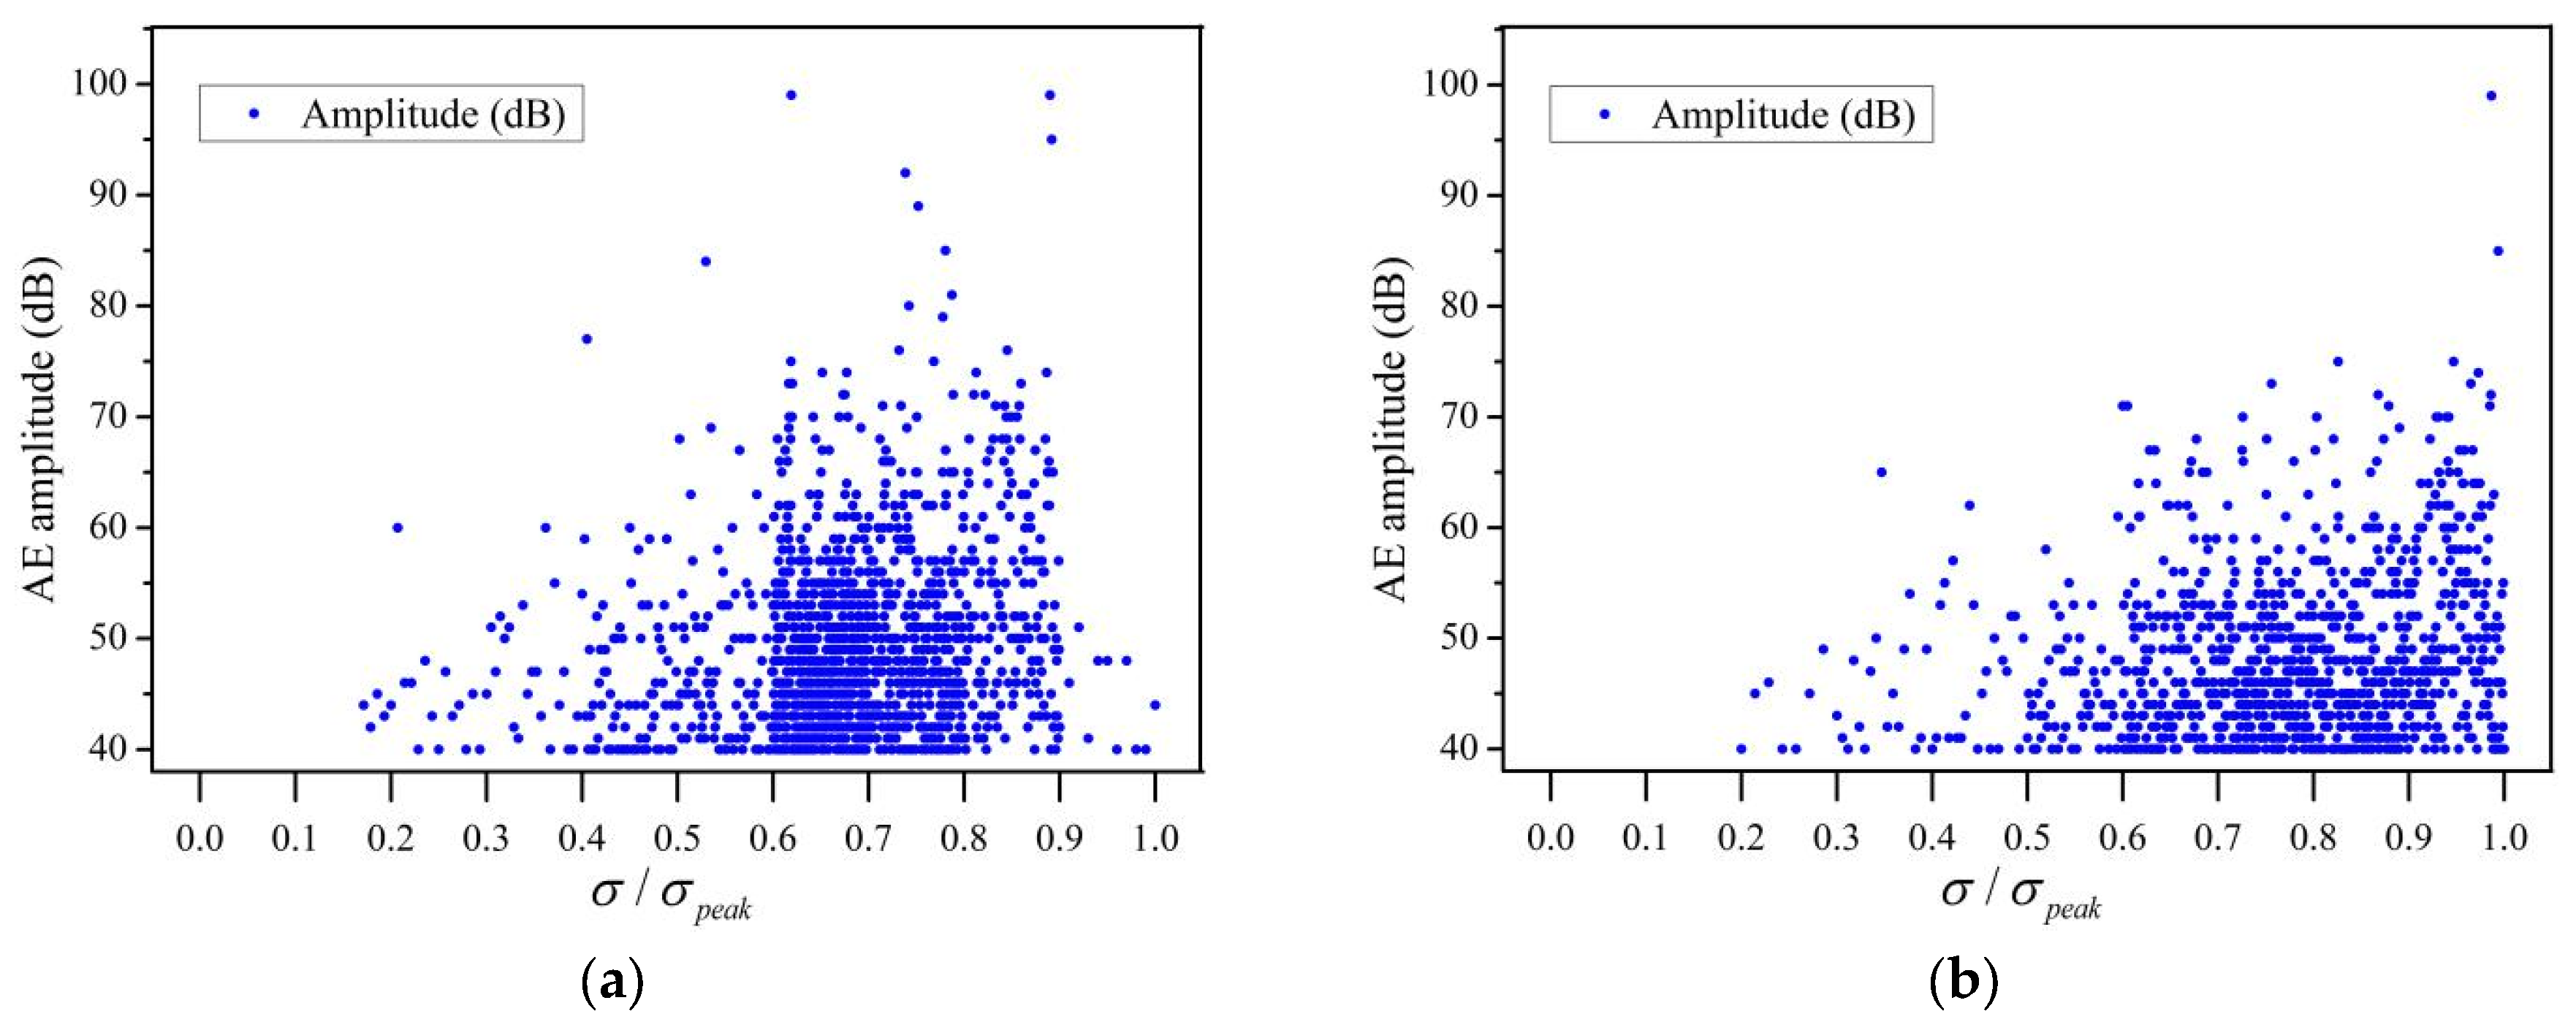
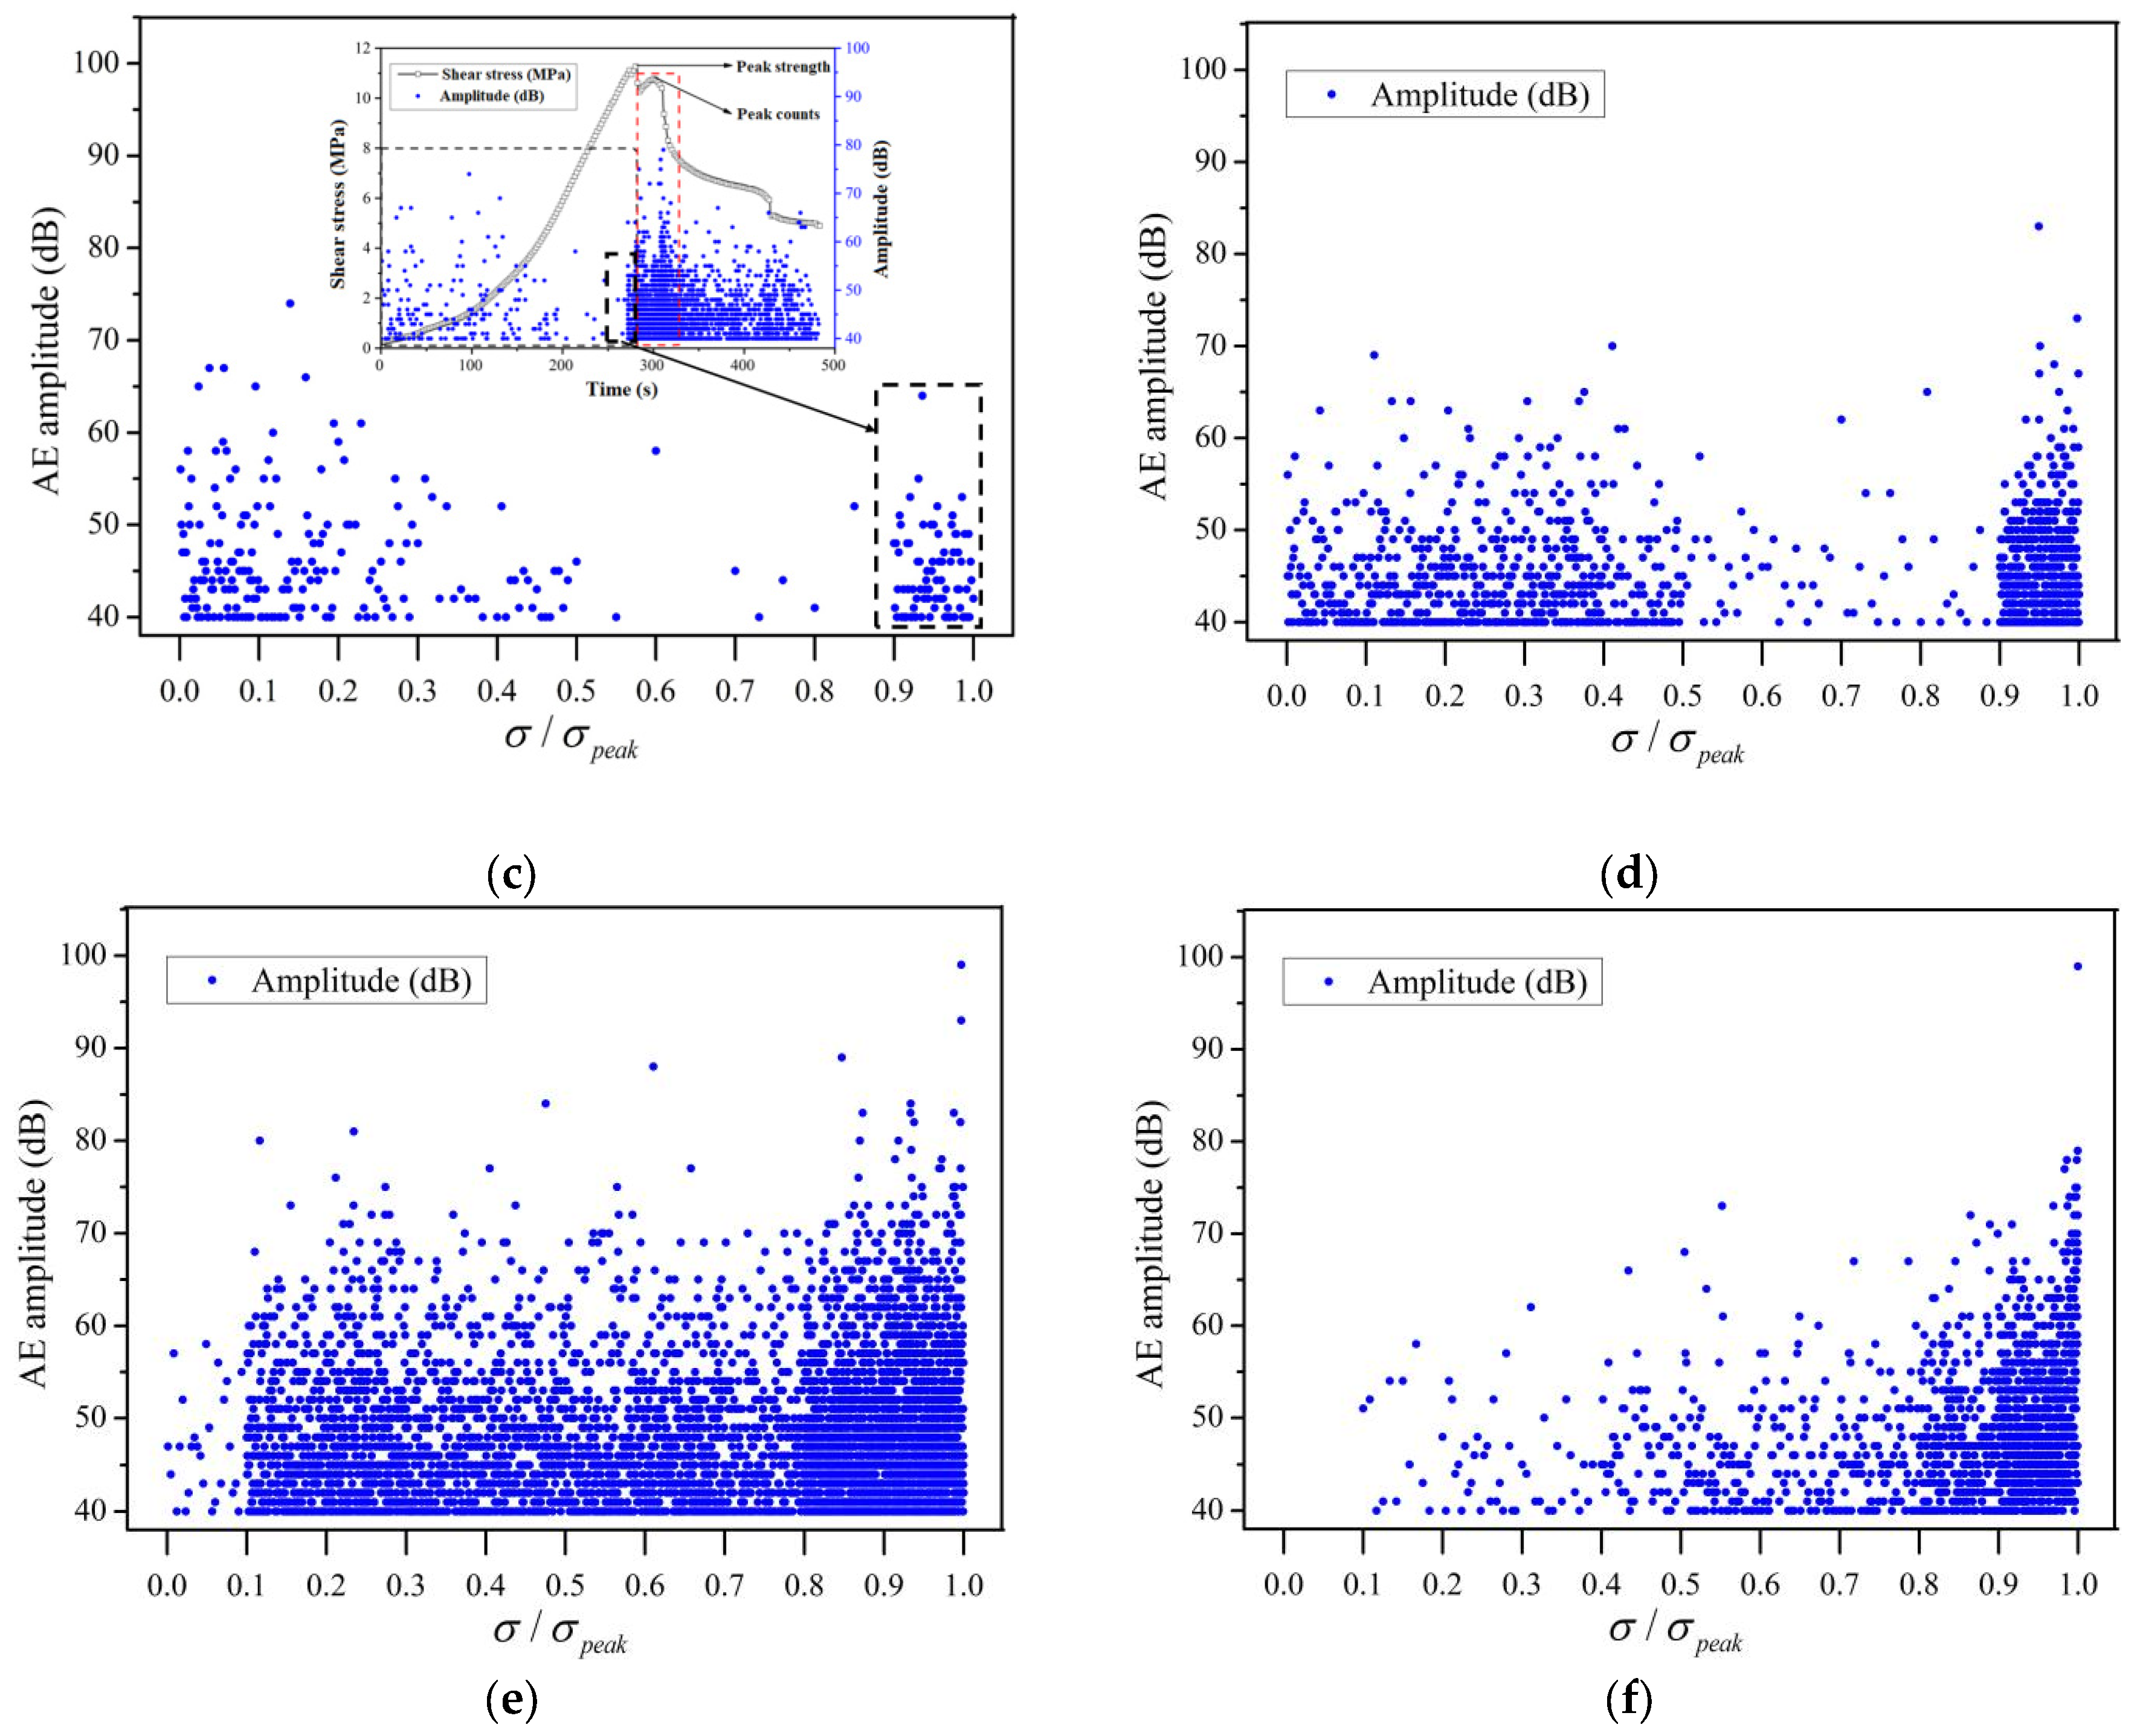
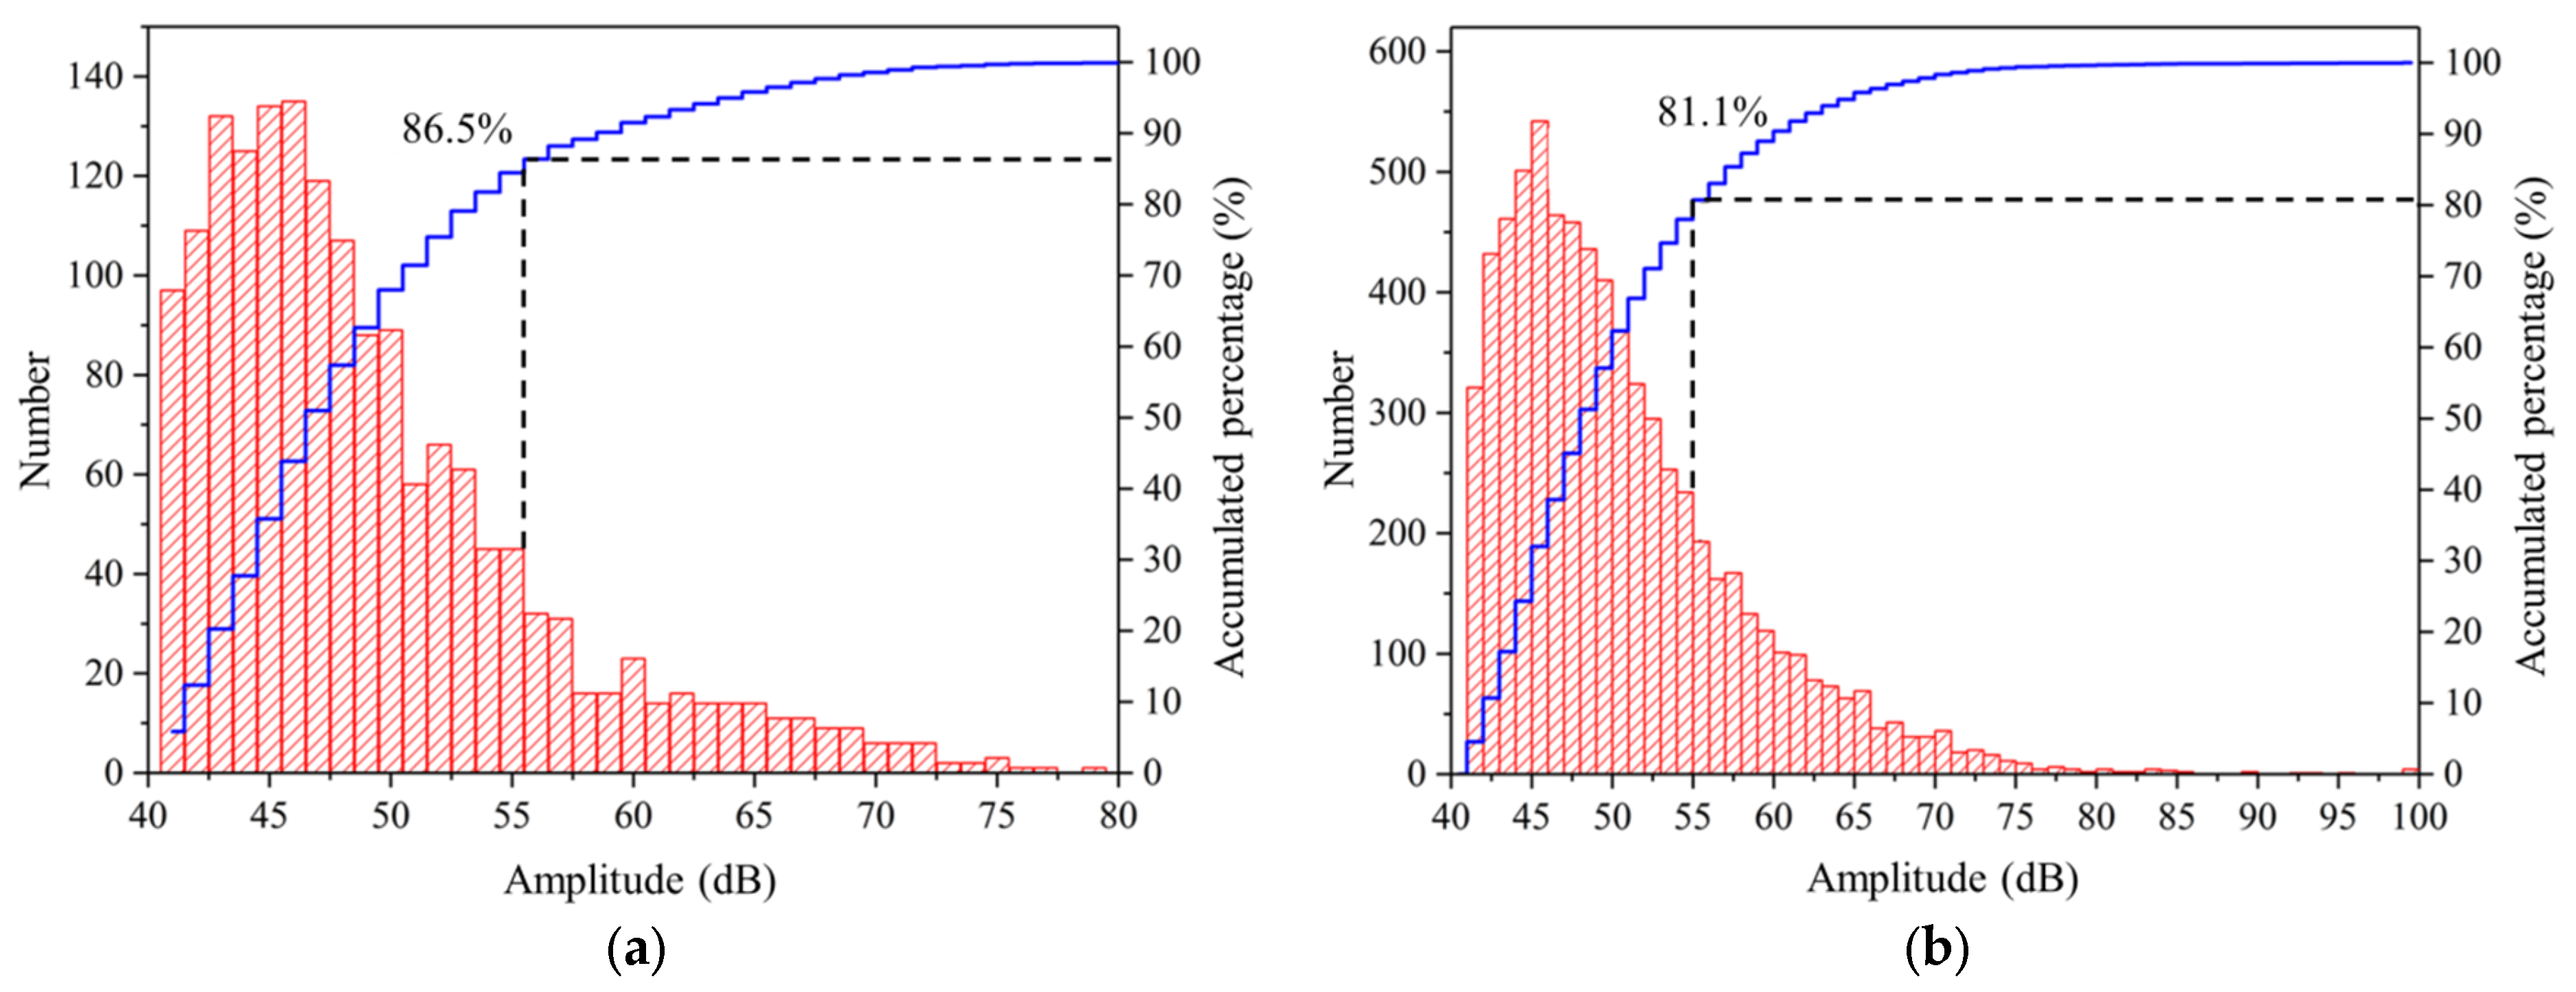
3.1. AE Amplitudes
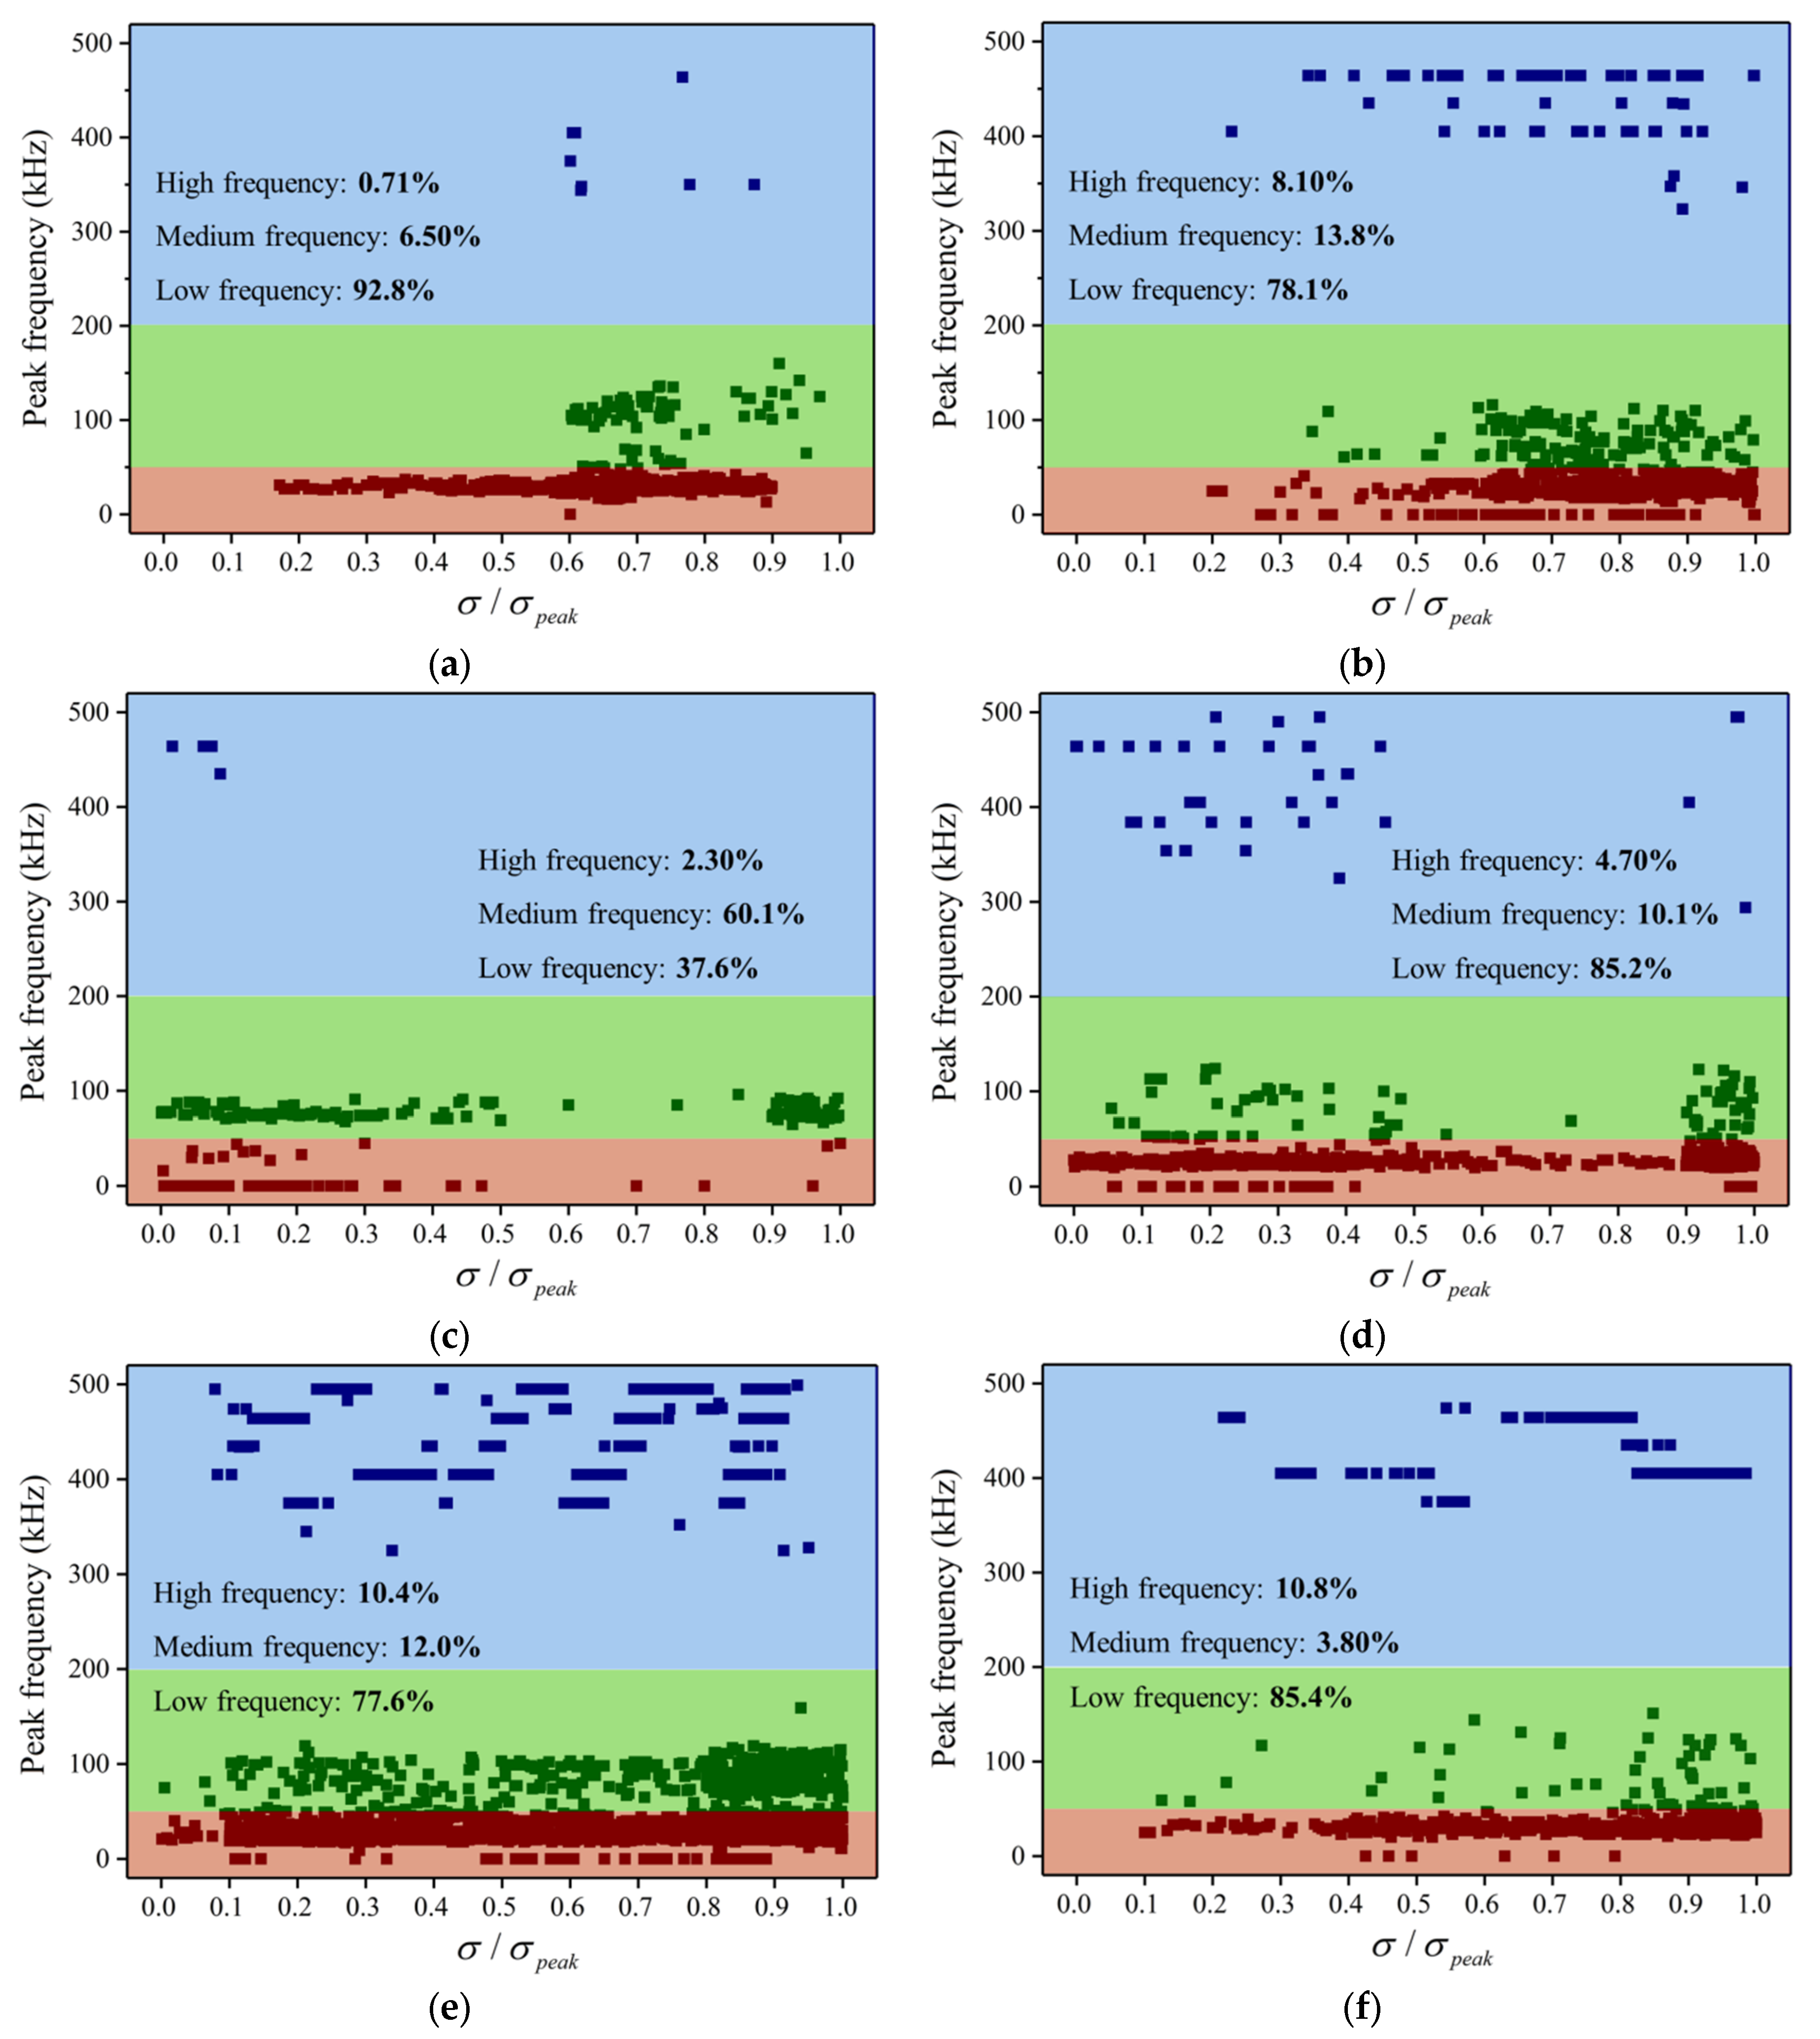
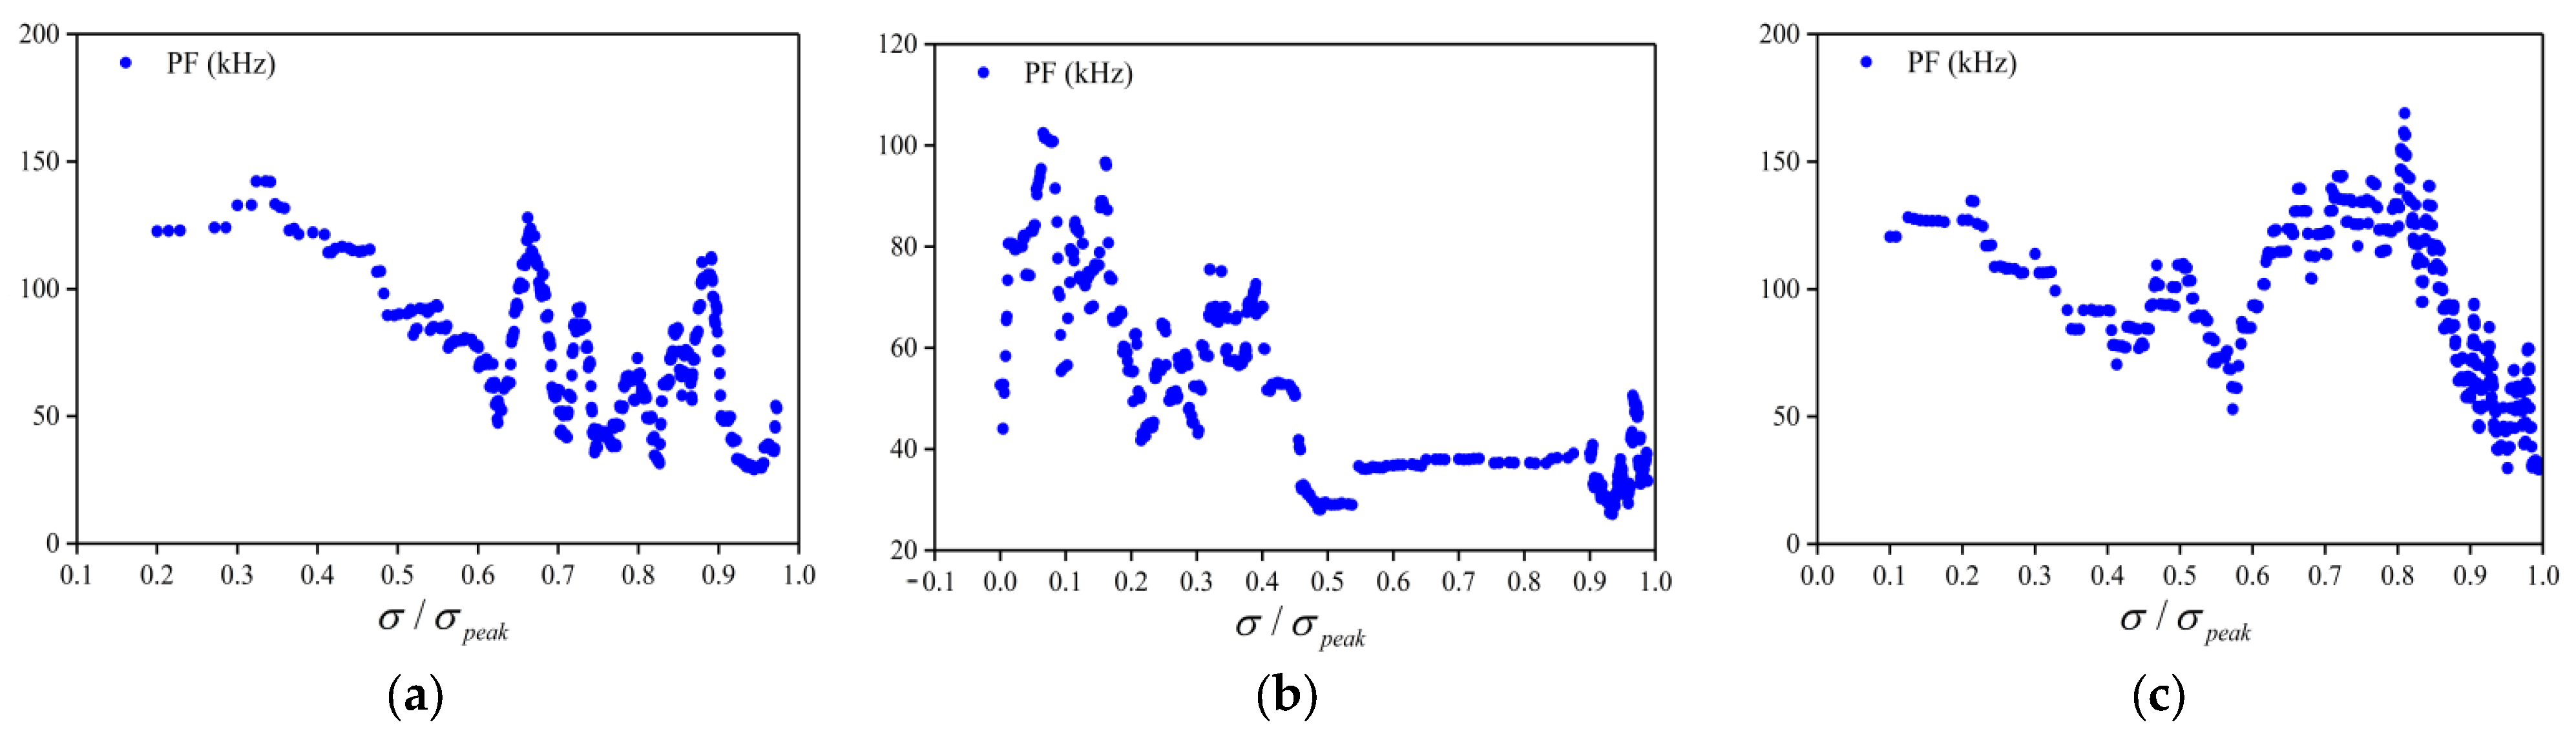
3.2. AE Peak Frequency
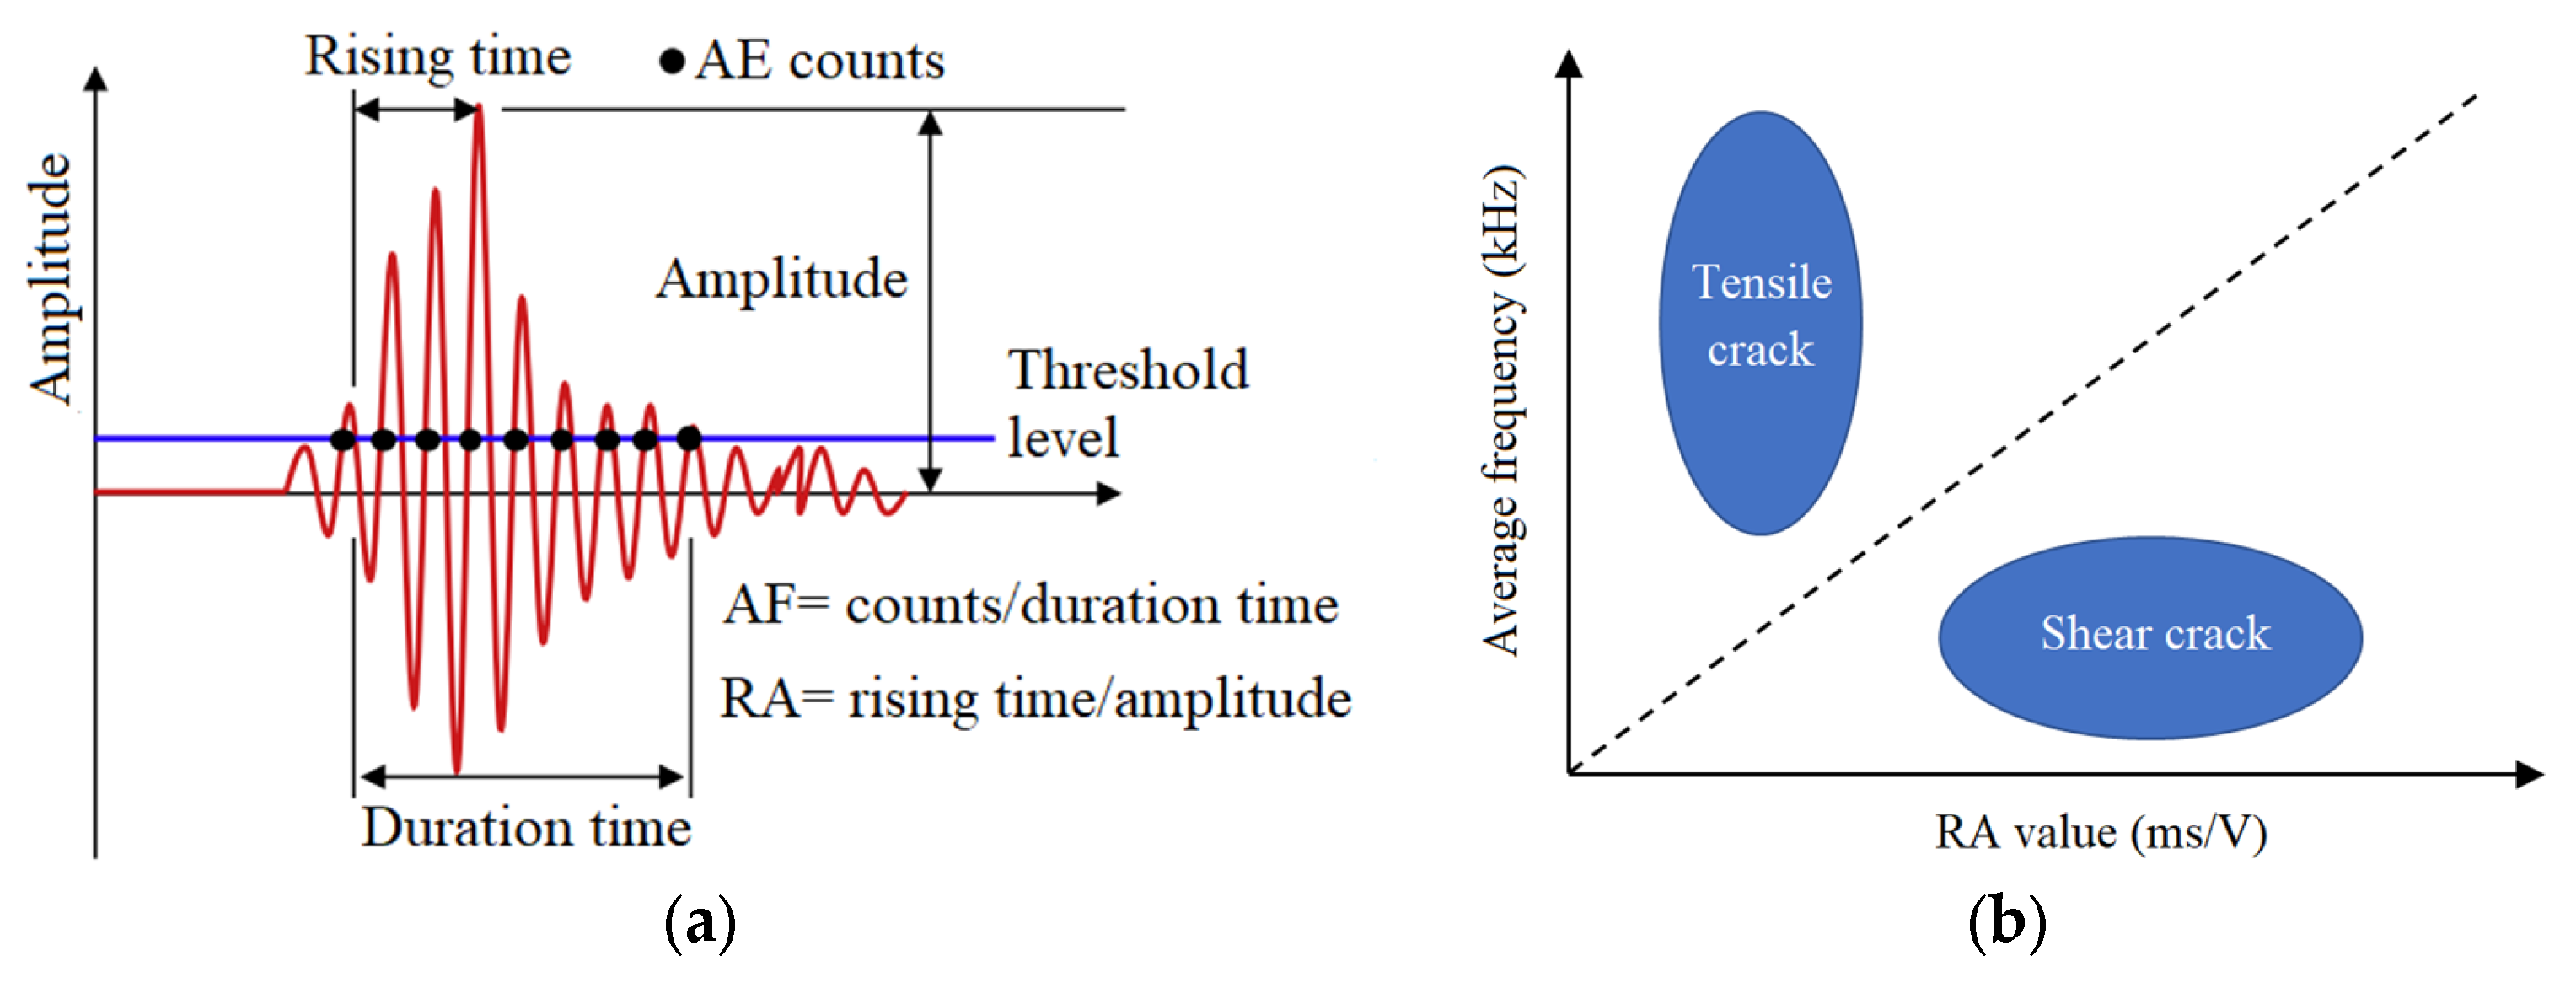
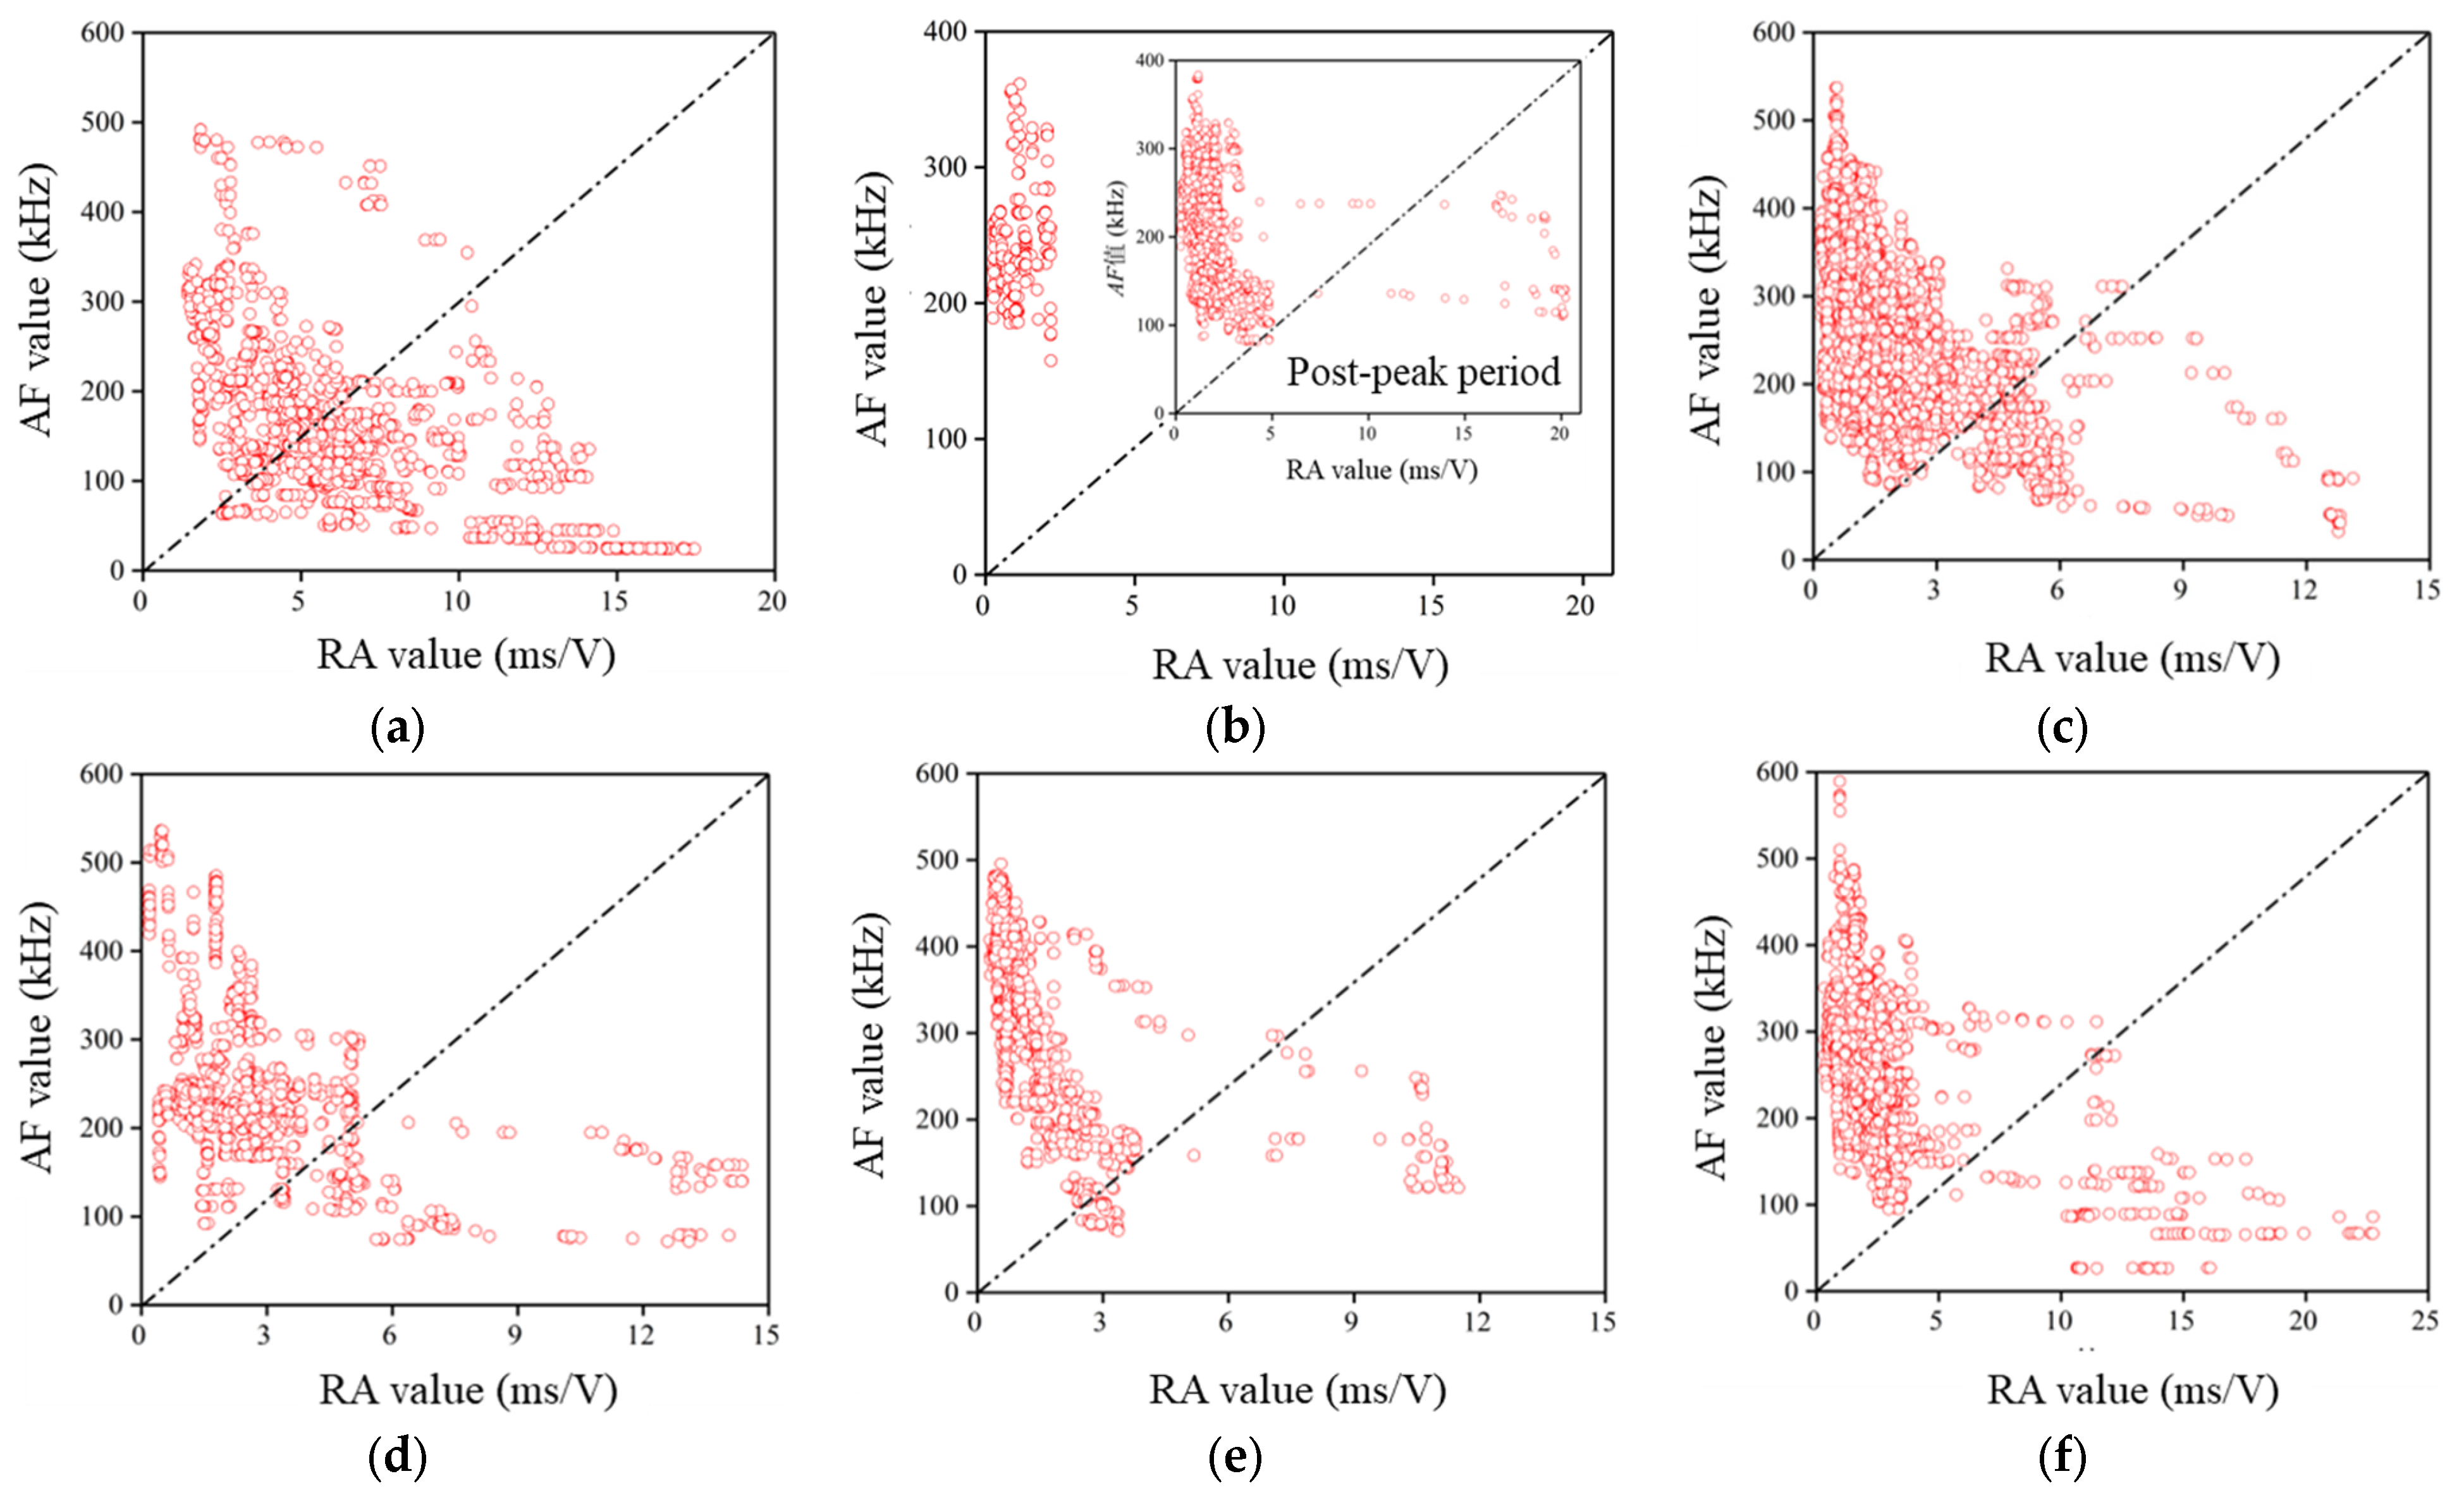
3.3. Classification of Crack Types
4. Conclusions
Author Contributions
Funding
Institutional Review Board Statement
Informed Consent Statement
Data Availability Statement
Acknowledgments
Conflicts of Interest
References
- Hu, J.; Li, S.; Liu, H.; Li, L.; Shi, S.; Qin, C. New modified model for estimating the peak shear strength of rock mass containing nonconsecutive joint based on a simulated experiment. Int. J. Geomech. 2020, 20, 04020091. [Google Scholar] [CrossRef]
- Sosnovskiy, L.A.; Sherbakov, S.S.; Khonsari, M.M.; Bogdanovich, A.V. From fatigue and tribology to tribo-fatigue. Int. J. Mater. Struct. Integr. 2021, 14, 164–237. [Google Scholar] [CrossRef]
- Shcherbakov, S.S. Modeling of the damaged state by the finite-element method on simultaneous action of contact and noncontact loads. J. Eng. Phys. Thermophys. 2012, 85, 472–477. [Google Scholar] [CrossRef]
- Shcherbakov, S.S. State of volumetric damage of tribo-fatigue system. Strength Mater. 2013, 45, 171–178. [Google Scholar] [CrossRef]
- Bian, C.; Wang, J.Y.; Guo, J.Y. Damage mechanism of ultra-high performance fibre reinforced concrete at different stages of direct tensile test based on acoustic emission analysis. Constr. Build. Mater. 2021, 267, 120927. [Google Scholar] [CrossRef]
- Chen, G.Q.; Sun, X.; Wang, J.C.; Wang, D.; Zhu, Z. Detection of cracking behaviors in granite with open precut cracks by acoustic emission frequency spectrum analysis. Arab. J. Geosci. 2020, 13, 258. [Google Scholar] [CrossRef]
- Chen, W.C.; Chen, L.H.; Chen, Y.C. Using a novel shear apparatus coupled with acoustic emission to investigate shear fracture evolution of cement-based materials in macro- and micro-views. Constr. Build. Mater. 2018, 187, 665–673. [Google Scholar] [CrossRef]
- Du, K.; Li, X.F.; Wang, S.; Tao, M.; Li, G.; Wang, S. Compressive-shear failure properties and acoustic emission (AE) characteristics of rocks in variable angle shear and direct shear tests. Measurement 2021, 183, 109814. [Google Scholar] [CrossRef]
- Kourkoulis, S.K.; Pasiou, E.D.; Dakanali, I.; Stavrakas, I.; Triantis, D. Notched marble plates under direct tensile: Mechanical response and fracture. Constr. Build. Mater. 2018, 167, 426–439. [Google Scholar] [CrossRef]
- Shang, D.L.; Chen, Y.D.; Zhao, Z.H.; Shangguan, S.; Qi, X. Mechanical behavior and acoustic emission characteristics of intact granite undergoing direct shear. Eng. Fract. Mech. 2021, 245, 107581. [Google Scholar] [CrossRef]
- Wang, J.Y.; Guo, J.Y. Damage investigation of ultra high performance concrete under direct tensile test using acoustic emission techniques. Cem. Concr. Compos. 2018, 88, 17–28. [Google Scholar] [CrossRef]
- Chen, J.; Zhou, H.; Zeng, Z.Q.; Lu, J. Macro- and microstructural characteristics of the tension-shear and compressive-shear fracture of granite. Rock Mech. Rock Eng. 2020, 53, 201–209. [Google Scholar] [CrossRef]
- Huang, D.; Cen, D.F.; Song, Y.X. Comparative investigation on the compressive-shear and tension-shear behaviour of sandstone at different shearing rates. Rock Mech. Rock Eng. 2020, 53, 3111–3131. [Google Scholar] [CrossRef]
- Guo, K.L.; Yang, L.; Sheng, X.C.; Mei, J.; Xiang, L.B.; Zhang, B.; Yang, W.M.; Song, G.X. Fracture mechanical behavior and AE characteristics of rock-like material containing 3-D crack under hydro-mechanical coupling. Rock Soil Mech. 2019, 11, 4380–4390. (In Chinese) [Google Scholar]
- Das, A.K.; Suthar, D.; Leung, C.K.Y. Machine learning based crack mode classification from unlabeled acoustic emission waveform features. Cem. Concr. Res. 2019, 121, 42–57. [Google Scholar] [CrossRef]
- Kumar, C.V.; Vardhan, H.; Murthy, C.S.; Karmakar, N.C. Estimating rock properties using sound signal dominant frequencies during diamond core drilling operations. J. Rock Mech. Geotech. 2019, 11, 850–859. [Google Scholar] [CrossRef]
- Yang, J.; Mu, Z.L.; Yang, S.Q. Experimental study of acoustic emission multi-parameter information characterizing rock crack development. Eng. Fract. Mech. 2020, 232, 107045. [Google Scholar] [CrossRef]
- Jiang, R.C.; Dai, F.; Liu, Y.; Li, A.; Feng, P. Frequency characteristics of acoustic emissions induced by crack propagation in rock tensile fracture. Rock Mech. Rock Eng. 2021, 54, 2053–2065. [Google Scholar] [CrossRef]
- Li, L.R.; Deng, J.H.; Zheng, L.; Liu, J.F. Peak frequency characteristics of acoustic emissions in white marble during direct tensile tests. Rock Mech. Rock Eng. 2017, 50, 1337–1346. [Google Scholar] [CrossRef]
- Zhao, K.; Yang, D.; Gong, C.; Zhuo, Y.; Wang, X.; Zhong, W. Evaluation of internal microcrack evolution in red sandstone based on time-frequency domain characteristics of acoustic emission signals. Constr. Build. Mater. 2020, 260, 120435. [Google Scholar] [CrossRef]
- Ban, Y.X.; Fu, X.; Xie, Q.; Zhou, X. Evaluation of fracture morphology of shale in Brazilian tests and analysis of power spectral characteristics. Chin. J. Geotech. Eng. 2019, 41, 2307–2315. (In Chinese) [Google Scholar]
- Zhang, Y.B.; Liang, P.; Yao, X.L.; Sun, L.; Tian, B.-Z.; Liu, X.-X. Experimental study of energy and frequency characteristics of acoustic emissions induced from tensile and shear cracks in tunnel rockburst process. Eur. J. Environ. Civ. Eng. 2020, 26, 3961–3980. [Google Scholar] [CrossRef]
- Hu, J.; Wang, M.; Rong, X.; Wang, X.; Xiong, Z.; Shi, S. Influences of Joint Persistence on the Compressive-Shear and Tensile-Shear Failure Behavior of Jointed Rock Mass: An Experimental and Numerical Study. Rock Mech. Rock Eng. 2023, 56, 8151–8165. [Google Scholar] [CrossRef]
- Li, S.; Hu, J.; Amann, F.; Li, L.; Liu, H.; Shi, S.; Hamdi, P. A multifunctional rock testing system for rock failure analysis under different stress states: Development and application. J. Rock Mech. Geotech. 2022, 14, 1531–1544. [Google Scholar] [CrossRef]
- Liu, Y.M.; Xia, C.C. Study of models and strength behavior of rock mass containing discontinuous joints in direct shear. Chin. J. Geotech. Eng. 2006, 28, 1242–1247. (In Chinese) [Google Scholar]
- Aggelis, D.G.; Matikas, T.E.; Shiotani, T. Advanced acoustic techniques for health monitoring of concrete structures. In The Song’s Handbook of Concrete Durability; Kim, S.H., Ann, K.Y., Eds.; Middleton Publishing, Inc.: London, UK, 2010; pp. 331–378. [Google Scholar]
- JCMS-IIIB5706; Japan Construction Material Standards. Monitoring Method for Active Cracks in Concrete by Acoustic Emission. The Federation of Construction Material Industries: Kumamoto, Japan, 2003.
- Farhidzadeh, A.; Mpalaskas, A.C.; Matikas, T.E.; Farhidzadeh, H.; Aggelis, D.G. Fracture mode identification in cementitious materials using supervised pattern recognition of acoustic emission features. Constr. Build. Mater. 2014, 67, 129–138. [Google Scholar] [CrossRef]
- Nguyen-Tat, T.; Ranaivomanana, N.; Balayssac, J.P. Identification of tensile failure in concrete by Acoustic Emission. In Proceedings of the International Conference on Materials, Structures and Construction Technology—2017 (MSC 2017), Riga, Latvia, 27–29 September 2017. [Google Scholar]


| Uniaxial Compressive Strength (MPa) | Uniaxial Tensile Strength (MPa) | Elastic Modulus (GPa) | Poisson’s Ratio | Rock Cohesion (MPa) | Internal Friction Angle of Rock (°) |
|---|---|---|---|---|---|
| 18.29 | 0.77 | 4.76 | 0.18 | 5.45 | 36.5 |
| Test Type | Rock Specimen Number | Normal Stress/MPa | Joint Persistence (JP) |
|---|---|---|---|
| Tensile test | T1 | / | 0% |
| T2 | / | 50% | |
| Tensile-shear test | TS1 | −0.15 | 0% |
| TS2 | −0.15 | 50% | |
| Compressive-shear test | CS1 | 5 | 0% |
| CS2 | 5 | 50% |
| Test Type | Specimen Number | Classification Method | Tensile Crack Percentage | Shear Crack Percentage | Shear Cracks’ Percentage Error |
|---|---|---|---|---|---|
| Tensile test | T1 | RA–AF | 48.0% | 52.0% | −30.5% |
| Amplitude–PF | 78.5% | 21.5% | |||
| T2 | RA–AF | 82.5% | 17.5% | −0.6% | |
| Amplitude–PF | 83.1% | 16.9% | |||
| Compressive-shear test | CS1 | RA–AF | 100% | 0.0% | 3.2% |
| Amplitude–PF | 96.8% | 3.2% | |||
| CS2 | RA–AF | 91.9% | 8.1% | 0.8% | |
| Amplitude–PF | 91.1% | 8.9% | |||
| Tensile-shear test | TS1 | RA–AF | 93.0% | 7.0% | 9.8% |
| Amplitude–PF | 83.2% | 16.8% | |||
| TS2 | RA–AF | 87.9% | 12.1% | 4.4% | |
| Amplitude–PF | 83.5% | 16.5% |
Disclaimer/Publisher’s Note: The statements, opinions and data contained in all publications are solely those of the individual author(s) and contributor(s) and not of MDPI and/or the editor(s). MDPI and/or the editor(s) disclaim responsibility for any injury to people or property resulting from any ideas, methods, instructions or products referred to in the content. |
© 2024 by the authors. Licensee MDPI, Basel, Switzerland. This article is an open access article distributed under the terms and conditions of the Creative Commons Attribution (CC BY) license (https://creativecommons.org/licenses/by/4.0/).
Share and Cite
Xu, Y.; Hu, J.; He, P.; Wang, G.; Pan, H. Research on Acoustic Emission Characteristics and Crack Evolution during Rock Failure under Tensile and Tensile- and Compressive-Shear Stress States. Appl. Sci. 2024, 14, 545. https://doi.org/10.3390/app14020545
Xu Y, Hu J, He P, Wang G, Pan H. Research on Acoustic Emission Characteristics and Crack Evolution during Rock Failure under Tensile and Tensile- and Compressive-Shear Stress States. Applied Sciences. 2024; 14(2):545. https://doi.org/10.3390/app14020545
Chicago/Turabian StyleXu, Yifan, Jie Hu, Peng He, Gang Wang, and Haolan Pan. 2024. "Research on Acoustic Emission Characteristics and Crack Evolution during Rock Failure under Tensile and Tensile- and Compressive-Shear Stress States" Applied Sciences 14, no. 2: 545. https://doi.org/10.3390/app14020545