
An Estimation of Speech Privacy Class Based on ISO Parameter


School of Electrical Engineering, University of Belgrade, Bulevar Kralja Aleksandra 73, 11120 Belgrade, Serbia
*
Author to whom correspondence should be addressed.
Appl. Sci. 2024, 14(3), 967; https://doi.org/10.3390/app14030967
Submission received: 27 November 2023
/
Revised: 13 January 2024
/
Accepted: 15 January 2024
/
Published: 23 January 2024
(This article belongs to the Special Issue Architectural Acoustics: From Theory to Application)
Abstract
:This paper examines speech privacy in both residential and commercial spaces. The ASTM E2638 standard defines the Speech Privacy Class (SPC) parameter, which measures speech privacy based on the signal-to-noise ratio at the listener’s position. This paper proposes estimating the SPC value using relevant ISO parameters commonly used in European practice: the apparent sound reduction index in dB (defined by ISO 16283-1, 2 standards) and the equivalent ambient noise level in dBA (defined by the ISO 1996-1 standard). The estimated value of the SPC parameter in this paper is referred to as the Speech Privacy Index (SPI). A diverse range of situations, i.e., rooms, was analyzed in the field. These rooms varied in terms of purpose, organization, dimensions, furnishings, isolation from other spaces, and internal and external environments. The results of the experiments demonstrate a strong correlation between the SPC value estimated according to ISO parameters (the proposed method) and the SPC as defined in the ASTM E standard. This indicates that the proposed method can provide an indicator of the state of speech privacy in buildings. The significance of the proposed calculation method (i.e., the STI parameter) lies in its ability to be applied at the building design stage, as well as after its completion, during routine testing.
1. Introduction
The term ‘comfort’ embodies convenience in its most general sense [1]. Extending this notion, ‘sound comfort’ has been introduced in the field of building acoustics. While air [2], thermal [3], and light comfort [4] have long been routine considerations for designers [5], sound comfort has only recently gained the recognition it deserves in the planning and construction of residential and commercial buildings [6,7]. There are several reasons why sound comfort should be accorded greater significance in the engineering domain. Firstly, its shortcomings become immediately apparent upon entering a building. Inadequate sound insulation is swiftly noticed after moving into an apartment or settling into a workplace [8]. Secondly, rectifying potential deficiencies in sound comfort is particularly challenging due to the intricate pathways through which sound travels between rooms [9]. Lastly, the health consequences resulting from inadequate sound comfort are the most challenging to address, as they fall within the realm of mental health, changes in which can only be discerned with a significant delay [10,11].
From the standpoint of building users, perhaps the most crucial aspect of sound comfort is privacy [12]. Privacy entails a condition in which the sounds generated by neighbors’ activities, particularly speech from the surrounding environment, remain undisturbed [13]. The issue of privacy in buildings is not only about protecting confidential speech but also extends to other domains. Speech, being an acoustic signal rich in information, inherently captures attention in the mind, often involuntarily. As a consequence, the audibility and intelligibility of speech in the environment can draw attention and, in the worst-case scenario, disrupt concentration at work [14,15]. Speech can range from imperceptible and barely noticeable to intelligible or completely understandable, with various intermediate levels defined on a scale of perception. It is also a reality that ensuring sound comfort in buildings involves administrative aspects, encompassing house rules and even legal and regulatory documents [12,16]. Nevertheless, the primary arena for seeking solutions to guarantee sound comfort and privacy, as its paramount dimensions, lies in the domain of construction and technical measures defined by the building project and subsequently implemented during construction.
One crucial step in ensuring privacy is preventing the recognition of speech from neighboring rooms [17]. In modern engineering practice, the challenge of recognizing speech within the same room has become increasingly prevalent, particularly in open-space offices [18]. In the building design process, privacy is typically addressed indirectly through the selection of partition structures (walls, ceilings, doors, windows) and their insulating properties [19]. However, many design analyses focus solely on assessing the minimum required value of the sound reduction index (R) for partitions in relevant positions within the building, often without broader consideration of the context in which these partitions will be situated [20]. While attenuating sounds through the insulating properties of partitions is one aspect of ensuring privacy, an equally important aspect is understanding the ambient noise levels in spaces where privacy is sought [21].
The explanation of the physical process compromising privacy is rooted in the fundamental principles of telecommunications, where the consideration of the signal-to-noise ratio (SNR) is paramount [22]. This concept equally applies to spoken communication within the acoustic domain. The term ‘signal’ refers to the acoustic speech signal with all its dynamic nuances, while ‘noise’ denotes ambient noise present in the listener’s environment [23]. The distinction from telecommunications lies in the fact that the ability to ‘extract’ a speech signal from noise is determined by the inherent limitations of the sense of hearing and cannot be enhanced. The literature has demonstrated that the SNR at the listener’s location governs the audibility and intelligibility of speech [24]. This implies that the environment in which speech is heard plays a crucial role in determining privacy [25]. Due to the dynamic characteristics of the speech signal, its signal-to-noise ratio is a complex, time-varying quantity that can only be discussed statistically [26]. It has been demonstrated that speech becomes unintelligible when the mean value of the SNR across 1/3 octave bands drops to approximately −2 dB [25,27]. This relationship is particularly evident in the frequency range crucial for speech, spanning from the 1/3 octave band with a central frequency of 160 Hz to the 5 kHz range.
Research related to speech privacy in the literature primarily refers to office buildings, meeting rooms and open-plan offices [28,29]. Some research specifically looks at user satisfaction with speech privacy [14]. Research on speech privacy measurements in buildings can be found [30], as well as studies on speech privacy prediction [31]. In the literature, various solutions for quantifying the state of speech privacy are reported [32]. The speech transmission index (STI) is a well-known measure of intelligibility, most suited to the evaluation of speech intelligibility in rooms, with stimuli subjected to additive noise and reverberance [33,34]. However, the STI measure suffers from the problem of being poorly correlated to the subjectively measured intelligibility of stimuli subjected to nonlinear processing [35]. Standard ASTM E1130-16 [36] introduces another parameter based on the signal-to-noise ratio, describing the state of speech privacy in open-plan offices. This parameter is called the Articulation Index (AI) [37] and is determined based on measurement results and the introduced form of the speech signal spectrum. The speech intelligibility index (SII) was developed to predict the intelligibility of the speech signal by weighting the importance of different frequency regions of audibility for a given speech test [38,39]. SII refers to the calculation of the SNR at each frequency, with subsequent adjustments for the hearing threshold and masking effects in the frequency domain. SII has a high correlation with speech intelligibility, so it can be considered as a better and more accurate indicator than AI [40]. A group of researchers led by Bradley has extensively addressed the privacy of indoor speech, approaching the problem from diverse angles [25,27,41]. Guided primarily by their research, the American standard ASTM E2638 [42] was formulated and adopted. This standard introduces a parameter known as Speech Privacy Class (SPC), providing a quantitative measure of speech privacy within a room from the perspective of a potential listener located in an adjacent room. The SPC parameter, as defined in the standard, serves as a measure of speech security and confidentiality, particularly in meeting rooms [43]. Despite its original purpose, it can be applied to various settings, including residential buildings. The SPC value represents the sum of two parameters: non-normalized sound level difference (D) between rooms and the ambient noise level (Lb) at the potential listener’s location.
Building upon the North American standard ASTM E2638 [42], this paper introduces a method for evaluating the state of speech privacy in buildings, accounting for parameters commonly used in regions predominantly adhering to ISO standards. Currently, in the part of the world that follows ISO standards, there is no single parameter to quantify the state of speech privacy at the listener’s location. This serves as motivation for the research conducted in this paper. The quantification of partition insulation between rooms, following ISO standards, involves utilizing the sound reduction index of the partition. The sound reduction index is determined either in laboratory conditions (R) or in situ (R’) [20]. Typically, the sound reduction index of the partition is expressed as a single-number quantity known as the airborne sound insulation rating Rw, or R’w for in situ conditions [44]. This parameter plays a crucial role in various aspects, such as building design criteria, contractor practices, production of building elements, insulation measurements, etc. According to ISO standards, the environmental noise level is quantified through an equivalent level weighted by an A-filter to consider the influence of the human sense of hearing on sound perception LA,eq [45]. The concept of this paper lies in the utilization of two key parameters—R’w as an indicator of insulation status and LA,eq as a sound level quantifier—to determine speech privacy levels at the listener’s location. In this context, the Speech Privacy Index (SPI), expressed in dB, is introduced in this paper as the sum of parameters R’w and LA,eq. The primary focus of this paper is to explore the correlation between the SPC parameter, as defined by the standard, and the proposed SPI parameter through 43 field measurements. The main research objective is to test the hypothesis regarding the mutual correlation of these two parameters, ultimately assessing whether the proposed parameter serves as an effective measure of speech privacy in buildings. Additionally, the correlation between the proposed SPI parameter and the AI parameter used by newer standards in North America will be examined.
The paper is organized as follows. In Section 2, a theoretical overview of issues pertaining to sound insulation and ambient noise in buildings will be provided. Section 3 presents the applied methods, primarily ways to quantify the state of noise and isolation in buildings, as well as methods for qualitative and quantitative assessment of the state of speech privacy. In Section 4, the research results are presented and discussed. Results describing different situations in the field, measured values of ambient noise and the state of insulation are presented. The obtained values of the proposed parameter and the standardized parameter for speech privacy in buildings are given and a comparative analysis is conducted, which is the major contribution of the paper. The main conclusions of the research are summarized in Section 5.
2. Background
2.1. Ambient Noise and Speech Level in the Room
Figure 1 schematically depicts a typical scenario involving the positioning of two rooms, regardless of whether they serve as residential or business spaces. The assumption is that one room (the source room) is engaged in specific activities generating a sound field, while the other room (the receiving room) serves as the location for speech privacy analysis. The receiving room is described by the volume V and reverberation time T. The rooms are separated by a partition construction with a surface area S12 and a sound reduction index R. It is important to note that the sound reduction index is a frequency-dependent variable, signifying that it encompasses a range of values rather than a single numerical figure. Ambient noise, denoted by the level Lb in Figure 1, acts as a determining factor in the signal-to-noise ratio within residential premises, predominantly infiltrating them through three potential pathways:
- As noise that passes through the elements of the facade from the outside environment (its level is denoted as Lin in Figure 1);
- As noise that passes through partition structures from neighboring rooms (its level is denoted as L2 in Figure 1);
- As the noise of devices and installations within the receiving room (its level is denoted as Lequip. in Figure 1).
The external noise (indicated by the level Lin) infiltrates the room through the dividing elements of the façade. Primarily, these pathways involve sound transmission through the glass panes of windows, as illustrated in Figure 1, and possibly balcony doors. It is worth noting that façade walls exhibit significantly higher insulation power compared to glass (Rwall >> Rwin, as indicated by smaller arrows in Figure 1). The acoustic environment surrounding residential premises is largely influenced by traffic-generated sounds. The noise level Lin is contingent on factors such as traffic intensity, the type of traffic (cars, buses, trains, etc.), and the configuration of buildings bordering the street, as well as façade structures.
By contrast, the acoustic environment within the building surrounding the receiving room encompasses all sounds generated by human activities, denoted by the noise level L2. This acoustic backdrop is shaped by the everyday activities in neighboring apartments, but it can also result from various disruptive activities occasionally categorized as “antisocial” behavior [46]. Additionally, various operational mechanisms integral to the building’s functionality may contribute to the ambient noise. It is important to note that regulations regarding the design of residential buildings explicitly prohibit the placement of rooms with such functionalities directly adjacent to living spaces [47].
In residential premises, in addition to the two mentioned noise components, there may also be equipment noise (Lequip) emanating from appliances within the receiving room, such as air conditioners, fans, computers, HVAC systems, etc. [48]. The dominant component in constituting ambient noise inside a room depends on the type and purpose of the building, the environment in which the building is located, the construction system employed, the equipment of the room with devices that potentially generate noise, the age of those devices, and various other factors.
Speech from the neighborhood penetrates the receiving room through the partition construction that separates them. The starting point in analyzing this process is the level of speech (L1,speech) created by the neighboring sound environment right next to the border wall. This sound environment is characterized by periodicity, non-stationarity, and significant variability over time. The sound power that reaches the receiving room depends on the sound reduction index of the partition R exposed to sound and its surface area S12. Consequently, a speech signal with a defined level value, L2,speech, is transmitted into the receiving room. The level of the speech signal at the point of origin, L1,speech, is determined by the potential range of sound power that the vocal tract can generate. Standards that prescribe conditions for partitions in a building are usually based on data regarding the expected sound level produced by normal human conversation. In residential buildings, this is somewhat limited by house rules. According to regulations in Serbia, the expected equivalent sound level in residential premises should not exceed 70 dB(A) [49]. Previous research provided detailed insights into the sound level in residential premises, illustrating the potential impact of noise during daily activities [46]. As part of these studies, information on measured sound levels during conversations in apartments revealed that the equivalent speech level in rooms typically ranges from 60 dB(A) to 73 dB(A). In commercial buildings, the noise level in the premises is inherently controlled by work requirements. Research results that illustrate the speech sound level in meeting rooms, typically found in office buildings, are presented in [41]. Based on measurements in 79 halls, it was concluded that the equivalent speech level in them is 60 ± 2 dB(A). This level is significantly lower than the speech level occasionally occurring in apartments.
Sound insulation requirements in buildings are defined by construction norms and adjusted to ensure that human speech generated at an expected level at one side of the walls is not understood, but it is noticed on the opposite side. In that process, some expected value of ambient noise in the premises of the buildings was implicitly adopted as a constant. However, the engineering approach to this issue faces the fact that the level of ambient noise in the premises has a rather variable value for multiple reasons. Numerous examples of compromised privacy in buildings exist, even when the sound insulation requirements from the current regulations are fulfilled. This indicates that engineering practice requires an improved approach for determining the state of privacy and thus the quality of buildings. This approach needs to take into account both quantities that determine the signal-to-noise ratio at the listener’s position—the speech level and ambient noise level.
2.2. Measurements of Sound Insulation in Buildings
The ISO 16283-1 standard defines measurement procedures, measuring devices, and the method for calculating the frequency-dependent parameter R [50]. These procedures are intended for rooms with volumes ranging from 10 m3 to 250 m3 in the frequency range of 50 Hz to 5000 Hz. The process of measuring the sound reduction index of a partition can be explained using the example shown in Figure 1. The partition being tested divides two rooms and has an area S12. In the source room, a non-directional sound source is placed. The sound levels measured in the source room are averaged to obtain the value L1. Similarly, in the receiving room, the level L2 is calculated. The level difference (D) is defined as the difference between the level values in 1/3-octave frequency bands between the source and receiving rooms. In the receiving room, it is necessary to measure the ambient noise level at several positions, and the average value is denoted as Lb. If the differences in the level values L2 and Lb are lower than 6 dB, a level correction must be performed according to [49]. Additionally, it is necessary to measure the reverberation time at several positions in the receiving room T according to ISO 3382-2 [51]. The sound reduction index of the partition is then calculated using the following equation:
where V represents the volume of the receiving room. The apostrophe indicates an in situ value. The measured sound reduction index result is expressed as a single-number quantity for airborne sound insulation, R′w, calculated according to ISO 717-1 [44].
3. Methodology
3.1. Speech Privacy Class (SPC)
Some solutions for quantifying the state of speech privacy can be found in the literature, taking into account the SNR at the listening position. One acceptable solution for the research in this paper is outlined in the American standard ASTM E2638 [42]. The procedure presented within is based on publications by the Bradley group, who have extensively researched this topic [25,27]. The standard introduces a parameter known as Speech Privacy Class (SPC), offering a quantitative measure of speech privacy within a room (the source room in Figure 1) from the perspective of a potential listener situated outside of it (the receiving room in Figure 1). The SPC, defined in the standard as a measure of speech security and confidentiality in meeting rooms, can also be applied in other contexts, including residential buildings. According to the standard, SPC is determined as the sum of two factors: the non-normalized level difference (D) between rooms and the ambient noise level (Lb) at the listener’s position:
SPC = D + Lb.
The first factor, the level difference (D), reflects the quality of sound insulation. Previous research on speech sound levels in meeting rooms and apartments has provided insight into the statistical properties of these sound signals. This information allows us to determine the SNR when listening to speech from an adjacent room by considering the level of the speech signal through the level difference D. The second factor, the ambient noise level, defines the effect of masking due to sounds from the environment. A higher SPC value indicates a lower SNR at the listening position, implying greater privacy. The standard specifies that determining the SPC value requires that all relevant quantities are measured in 1/3-octave bands, including the calculation of isolation within these frequency ranges:
where Di and Lsour,i, are the level difference and sound level in the source room in the 1/3 octave band denoted by i, respectively. Lreciv,i represents the sound level in the receiving room in the same frequency range. Both quantities are considered in the range relevant to speech, between 160 Hz and 5000 Hz, which constitutes a total of 16 bands. Calculating the SPC requires the calculation of the overall level difference, which is defined as the unweighted mean across all 16 considered 1/3 octave bands:
Di = Lsour,i − Lreciv,i,
The overall noise level in the receiving room is calculated in the same way:
The anticipated states of speech privacy for different SPC values are described in [25] and in the appendix of the ASTM E2638 standard [42]. Table 1 provides these descriptions. The descriptions outline probable states of speech intelligibility and audibility. It becomes evident that privacy becomes relatively satisfactory only with an SPC value above 70 dB. Due to the dynamics within prolonged speech and within each sentence, the speech level can only be statistically observed through the long-term effective value. Therefore, SPC values from Table 1 can only be interpreted in terms of the most likely frequency of occurrence of more or less audible segments.
Important conclusions regarding the required values of the sound reduction index in residential buildings can be drawn from the values shown in the table. For instance, at an ambient noise level of around 20 dB in the residential premises of an apartment, it is necessary to achieve a sound reduction index value of approximately 60 dB towards the neighbors for complete speech privacy. The minimum value of the sound reduction index of partitions between rooms, traditionally adopted for decades in the design of residential buildings and defined as such in the standard [49], falls significantly below the value needed to ensure privacy.
3.2. Determination of SPC Confidence Intervals
The SPC parameter depends on the sound level values in both the source and receiving rooms, as well as on the ambient noise level in the receiving room. Based on this, it is concluded that the confidence interval (CI) for the SPC parameter values will depend on the mentioned levels and their corresponding confidence intervals [42]. The 95% confidence interval (CI_value) indicates that, for multiple repeated measurements, there is a 95% probability that the SPC parameter value will fall within the range of SPC ± CI_value. This interval can be calculated for each measurement of the sound reduction index of the partition at each location. The 95% confidence interval for the sound level in the source room can be calculated as follows [42]:
where n is the number of microphone positions in the source room, Lsi is the sound level for each microphone position in the source room, and Ls(avg) is the average level value for all microphone positions and all 1/3 octave frequency bands between 160 Hz and 5000 Hz. Similarly, it is possible to determine the 95% confidence interval for the sound level in the receiving room,
and for the ambient noise level,
Finally, the value of the 95% confidence interval for the SPC is given as follows:
3.3. Articulation Index AI
Another way to describe the speech privacy is defined by the ASTM E1130-16 standard [36]. This standard is applied in the analysis of open-plan offices, but examples of its use in other types of spaces can be found in the literature [52]. In contrast to the SPC parameter, which does not consider the spectrum of the speech signal as a factor influencing privacy, the E1130-16 standard introduces the Articulation Index (AI) parameter, which describes the speech signal source itself. The parameter is defined by the following equation:
where wi is the frequency weighting factor, defined in tabular form in the standard, and SNR is the speech signal-to-noise ratio. SNR is determined from the selected source reference sound pressure level (LSpeech), defined in tabular form in the standard. The value of D is obtained as the difference between the measured sound level 1 m away from the source and the sound level measured at the potential listener’s location. The background noise level (LbA), weighted by the A curve, is obtained as the ambient noise recorded at the location where speech is heard. The useful signal level represents the difference between the normalized speech spectrum (defined by standard) and the measured levels difference D. In this way, the speech privacy analysis introduces the speech sound level in 1/3-octave bands and weighting factors, from 200 Hz to 5000 Hz. The value of the Articulation Index AI is obtained in the range from 0 to 1, wherein a value of 0 means that the speech is completely unintelligible at the receiving location.
3.4. Proposed Procedure for Calculating SPI
In the part of the world where ISO standardization is applied, the evaluation of sound comfort is based on the measurement of the sound reduction index according to the ISO 16283-1 standard [50] and the equivalent level of ambient noise, LA,eq, expressed in dB(A) according to the ISO 1996-1 standard [45]. The result of the sound insulation measurement is expressed by the single-number value of the sound reduction index, R’w. This paper proposes a modification to the method for determining the Speech Privacy Class (SPC), which would be based on using the values obtained according to ISO standardization. The proposed parameter (which makes sense as an SPC) is named the Speech Privacy Index (SPI) and is defined as
SPI = R′w + LA,eq.
In this paper, a substantial number of in situ scenarios are examined to determine whether the Speech Privacy Index (SPI) accurately estimates the Speech Privacy Class. An affirmative answer would imply that SPI can be used to assess the level of speech privacy between rooms using standard indicators defined by ISO standards that are routinely measured. The authoritative values of the partition’s sound reduction index, R’w, are prevalently used as input data in the building design phase. Information on equivalent ambient noise levels can be found in the literature [53]. By acquiring these two values and applying the proposed method, it is possible to assess the level of speech privacy even in the facility design phase.
Interestingly, the importance of ambient noise levels in protecting privacy is also recognized in the standard procedures for quantifying the state of privacy in open-space offices. The relevant ISO standard, which defines parameters for quality assessment in these specific spaces, also includes the measurement of the equivalent level of ambient noise [44]. The procedure described in that standard considers the impact of noise indirectly, through the decrease in the value of speech level with distance. The distance from the speaker at which the speech signal is “drowned” in the existing ambient noise, and thus becomes practically unintelligible, is also taken into account.
4. Results and Discussion
4.1. Analyzed Rooms
In this paper, tests were conducted using rooms of varying purposes, volumes, and shared wall surfaces to assess the proposed method. These rooms also exhibited differences in reverberation times. A total of 43 measurements of the sound reduction index of partitions between rooms were performed following the ISO standard [50]. All analyzed partitions were wall-mounted without doors or windows. The differentiation among rooms based on their purpose primarily involves the spatial organization and the quantity of furniture. Bedrooms and living rooms, for instance, feature a plethora of furniture items such as beds, sofas, bar tables, wardrobes, carpets, heavy curtains, and more. In contrast, classrooms typically house tables and chairs, with hard floors lacking carpets, and may have acoustic treatment on the ceiling or walls. Offices primarily contain chairs and desks, with additional items like smaller wardrobes and computer equipment. The analyzed case-scenario rooms included 12 living rooms (27.9% of the total number analyzed), 6 bedrooms (14%), 8 hotel rooms (18.6%), 5 classrooms (11.6%), and 12 office spaces (27.9%).
In the conducted measurements, the rooms differed not only in terms of their intended purpose but also varied in size. Furthermore, the surface of the shared wall between the rooms, whose sound reduction index was measured, was also variable. Figure 2 illustrates the relationship between the volume of the receiving room V and the surface area of the shared wall S12 whose sound reduction index was measured. Each point on the graph represents a distinct measurement location. It is evident that the volume of the receiving rooms spans from 23 m3 to 130 m3, indicating significant variations in room dimensions. The surface area of the common wall ranges from 8 m2 to 35 m2. These diverse conditions provide a robust foundation for testing SPC estimation methods in different real-world scenarios.
Furnishing a room induces changes in the sound absorption coefficient within the space. The presence of furniture, such as beds, sofas, curtains, and carpets, increases the absorption coefficient of the room, particularly at higher frequencies, resulting in shorter reverberation times in such spaces. Considering the diversity of the rooms under consideration, a detailed analysis of reverberation times was conducted. The reverberation times were determined for different frequency bands between 160 Hz and 5000 Hz. Given the substantial number of rooms, each with different reverberation times for different frequency bands, the measurement results are organized and presented as shown in Figure 3. The x-axis represents different rooms (labeled from 1 to 43). The room order is not arranged by categories but follows the naming convention of the measurement locations. This order will be maintained throughout the remainder of the manuscript. In Figure 3, the y-axis represents frequency bands, and the reverberation time values are depicted using a color scale, where warm colors (including red) indicate larger values, while cooler colors (including dark blue) indicate smaller values. The reverberation time varies between 0.25 s and 3 s. Figure 3 illustrates that a considerable number of rooms exhibit a relatively short reverberation time, around 0.5 s. This is attributed to the presence of furniture with higher absorption coefficients, particularly in bedrooms, living rooms, and hotel rooms. Conversely, longer reverberation times were observed in office spaces and classrooms with larger volumes, such as those numbered 32, 33, and 35.
To further analyze the acoustic properties, Figure 4a displays the measured values of the sound reduction index for all measurement locations. In the majority of locations, the sound reduction index exceeds 50 dB, indicating relatively good insulation. However, in some cases, the insulating power of the partitions falls below 35 dB. These lower values suggest potential issues in the construction of the partitions. Measurement locations with low values of reverberation time (13, 14, 15, 16, 42, and 43) exhibit the lowest insulation values. This could imply that, in addition to the structural characteristics of the partition, the reverberation time is also a dominant factor. However, based on measurements at other locations, such a conclusion was dismissed. The reverberation times for measurement locations 6 and 7 are also short, but the insulation power in these cases is over 50 dB. These measurement locations are characterized by a small partition wall surface and small receiving room volume, resulting in a high insulation value. Based on these examples, it is concluded that a clear relationship between individual room characteristics and the insulation power cannot be established.
Figure 4b illustrates the equivalent values of the ambient noise level at all measurement locations. The noise measurement results reveal significant variations in ambient conditions from one location to another. The highest values range from 26 dB(A) to 32 dB(A), with most values well below 30 dB(A). Regulations in Serbia limit the permissible ambient noise level to 30 dB(A). Consequently, it can be inferred that the analyzed measurement locations exhibit a low level of ambient noise. This is likely attributed to the facade elements possessing good insulating properties, the devices within the rooms producing low noise, and a lack of substantial human activity in neighboring rooms.
Figure 4c depicts the spectra of ambient noise at all measurement locations, expressed in dB. It can be observed that, in most cases, the highest levels of ambient noise occur in frequency ranges below 400 Hz. At several measurement locations, maximum noise levels can be noticed beyond 1000 Hz, which is a result of specific human activities at those locations. The figure also illustrates the averaged spectrum of ambient noise from all locations to determine the shape of the ambient noise spectrum. The average spectrum exhibits a monotonically decreasing trend towards higher frequencies, which is coherent with data from the literature [54]. For the proposed parameter SPI, the equivalent noise level expressed in dBA is used, resulting in a weighted spectrum with the A-weighting characteristic. The A-weighting characteristic introduces significant attenuation at low frequencies, resulting in similar noise levels for different frequency ranges. It can be concluded that the frequency content will not affect the calculated parameter value.
It should be noted that the measured values of the sound reduction index for the partitions at all measurement locations fall within the range of 20 to 65 dB. The equivalent level of ambient noise in the receiving rooms from all measurement locations is within the range from 22 to 42 dB(A). This means that partitions with substantially different insulating properties and ambient noise conditions were analyzed. Therefore, adequate input data is provided to properly validate the proposed speech privacy evaluation parameter.
4.2. SPC Confidence Intervals
Figure 5a displays the confidence intervals calculated for all measurement locations. The maximum values of the 95% confidence intervals for the levels in the transmitting and receiving room are below 1 dB. The confidence interval for the ambient noise level in the receiving room is below 2.1 dB. Based on these results, it is concluded that the ambient noise level is the dominant factor contributing to the total measurement uncertainty [42]. The ambient noise level varies in repeated measurements due to changes in ambient conditions.
Figure 5b shows the confidence intervals for the SPC parameter at all measurement locations. The 95% confidence interval for the SPC is in the range between 0.3 and 2.4 dB. Values of ΔSPC are most closely related to the confidence interval values for the ambient noise level. It can be observed that large values were obtained for measurement locations 5, 6, 7, 38, and 40. It is noted that the same locations also exhibit the highest confidence interval values for the ambient noise level.
4.3. Correlation between the SPC and SPI Parameters
A comparative analysis of the SPC values calculated by (2) and the SPI values calculated by (11) was conducted. The results are shown in Figure 6. All 43 measurement results are presented as black circles, where the x-coordinate represents the value of the SPC parameter, and the y-coordinate represents the value of the SPI parameter. It can be observed that the measured values are clustered around the hypothetical line SPI = SPC. This indicates that for the same measurement location, the SPC and SPI parameters are approximately the same. However, a more detailed analysis of the relationship between these two parameters is necessary.
Based on the values of both parameters, the regression line was determined using the least square deviation criterion. The best-fitted line (solid black line) for the data presented in the diagram is y = 1.11 x − 3.17 (SPI = 1.11 SPC − 3.17 dB). To evaluate the similarity of the obtained data, Pearson’s coefficient of correlation (r) was calculated, resulting in a value of r = 0.95. The maximum value of the correlation coefficient (r) is 1. Comparing these two values, it can be concluded that there is a very good correlation between SPI and SPC. The R-squared (R2) statistical measure, in this case, is 0.91, indicating that the linear regression model describes the analyzed data well. Based on this, it can be stated that the initial hypothesis of a good match between the values of the SPC parameter and the proposed SPI parameter is correct. In Figure 6, the red dashed line shows the limits of the 95% confidence interval for the obtained regression line. In the value range for SPC and SPI below 55 dB, there are only five measurement situations. Also, in the analyzed data, there are only two values higher than 80 dB. Due to the small amount of data in the mentioned ranges, the confidence intervals in those ranges are wider compared to the zone where the majority of analyzed data is located. At the edges of the observed range, the confidence interval values are around ±3 dB. On the other hand, the confidence interval values in the middle of the range (around 65 dB) are around ±1 dB.
Based on the good correlation between the SPC parameter and the proposed SPI parameter, it can be concluded that the evaluation of the state of privacy can also be performed based on the SPI using categories from Table 1. Table 2 provides an overview of the state of speech privacy in the analyzed locations by categories. It is observed that in 25% of the examined cases, the state of speech privacy corresponds to the worst category from the privacy standpoint, i.e., speech from the adjacent room is almost always heard and often understood. In about 30% of locations, speech from the adjacent room is often heard and certain phrases are understood (second and third category). Speech from the adjacent room is unintelligible in only 5% of all locations, and only 11% ensure that speech is essentially unintelligible and rarely heard. None of the 43 analyzed situations can be sorted into the best category (speech imperceptible).
Based on the presented results for the values of the SPC and SPI parameters, it is concluded that the state of speech privacy is relatively poor in most of the analyzed situations. When observing the values of the sound partitions’ sound reduction index in the observed locations, the insulation conditions mostly seem satisfactory. The mismatch between insulation and speech privacy is a consequence of the low level of ambient noise prevailing at the measurement locations (typically below 30 dB(A)). This confirms previous conclusions from the literature, which indicate that the ambient noise is very important for the state of speech privacy.
4.4. Correlation between the Articulation Index (AI) and SPI Parameters
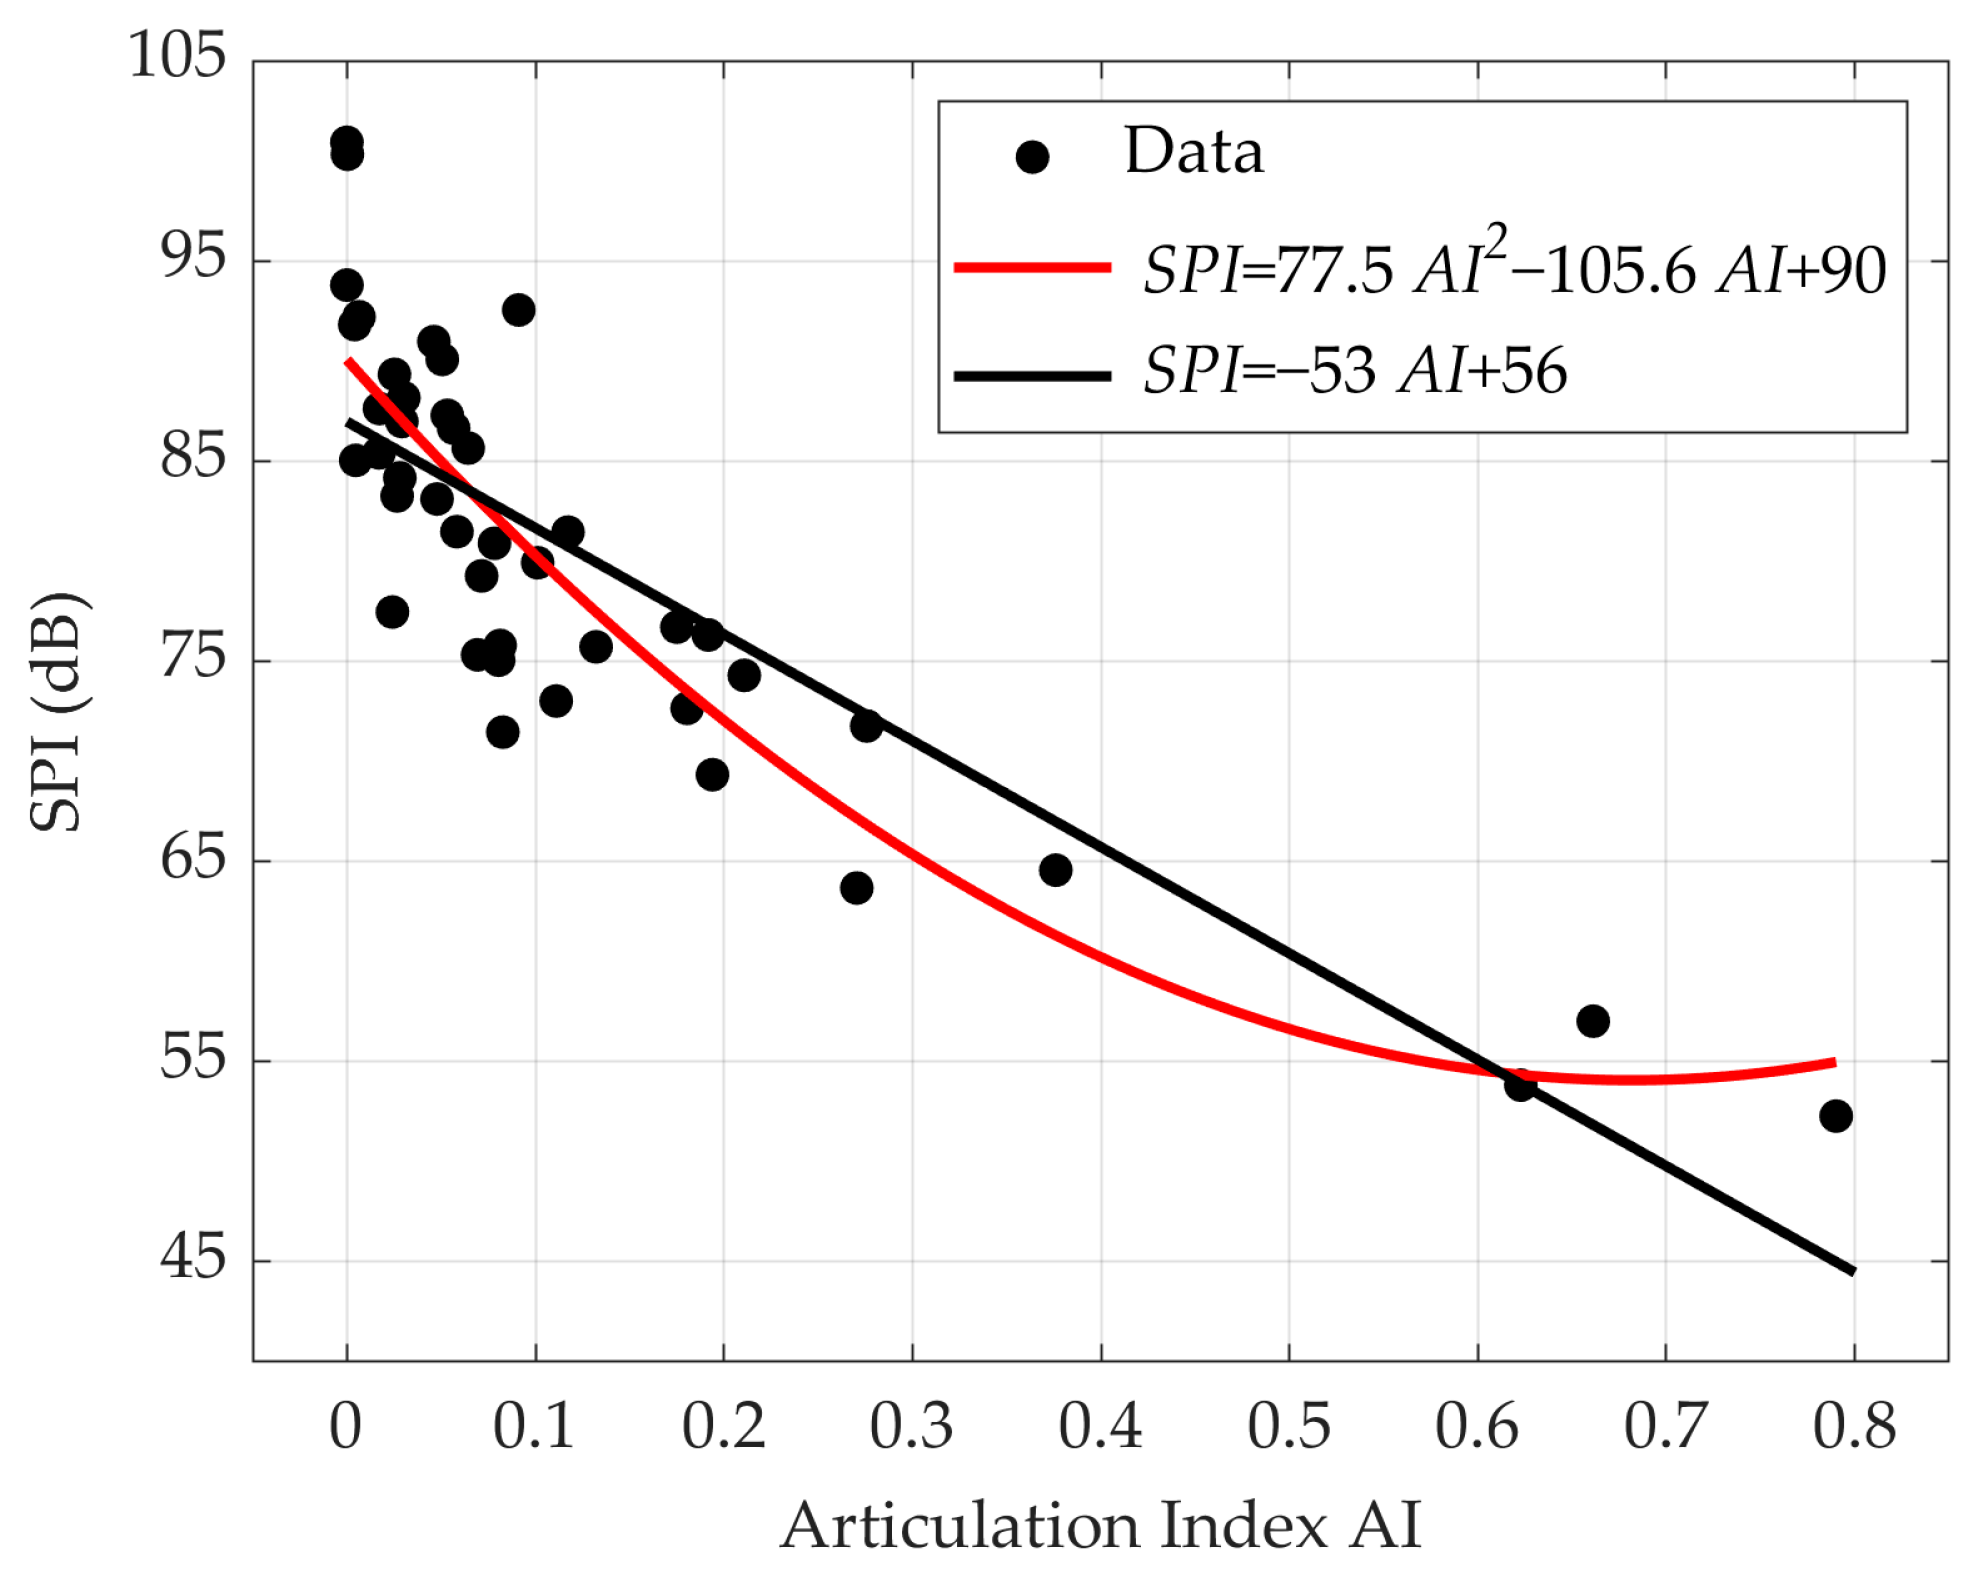
The relationship between the Articulation Index AI, calculated using Equation (10), and the proposed parameter SPI is illustrated in Figure 7. All 43 measurement results are represented by black circles. Based on the values of the two parameters, the least squares method was used to fit the data using two regression curves. The first approach uses linear regression to obtain a relationship similar to the one between SPC and SPI. The second approach uses polynomial regression to fit the data using a second-degree polynomial function.
The best linear fit for the data presented in the diagram is SPI = −53 AI + 56 dB. The linear model is represented by a black line in Figure 7. To assess the similarity of the obtained data, Pearson’s coefficient of correlation (r) is calculated, and its value is r = 0.85. Comparing these two correlation coefficient values, it can be concluded that there is a very good correlation between AI and SPI. The second-degree polynomial model is described by the equation SPI = 77.5 AI2 − 105.6 AI + 90 dB and represented by the red line in Figure 7. The Pearson correlation coefficient between this model and the analyzed data is r = 0.90. Based on the values of the Pearson coefficients, it is concluded that the polynomial model better approximates the relationship between AI and PI parameters. The literature provides data on the relationship between AI and SPC, indicating that the relationship for enclosed spaces is not linear but polynomial [52]. Since this study has demonstrated that the relationship between SPC and SPI is linear, it can be argued that the obtained dependency is coherent with the literature results. This analysis shows that the proposed parameter SPI is well correlated with the Articulation Index AI (and consequently, the Privacy Index). This implies that SPI can be used to describe the state of privacy in partitioned spaces.
4.5. Practical Implementation Potential
By calculating and examining the parameter SPC and the proposed SPI parameter, the method for quantifying the state of speech privacy in different types of premises is demonstrated. In the future, this should prompt practical adjustments of standard measurement procedures in buildings, with the aim of providing users with a clearer indication of the achieved conditions. A potential first step might include expanding the form for displaying sound insulation measurement results to include additional data on the measured value of the equivalent noise. This approach is particularly useful in cases where measurements are conducted in existing buildings due to tenant complaints. The analysis presented in this paper suggests that solutions can also be sought in the domain of ambient noise control within living spaces. Recently, the sound masking technique has been used to enhance privacy and reduce disturbance by creating background noise [55,56]. This technique is based on the continuous emission of additional noise to increase ambient noise at the listener’s location, thereby enhancing speech privacy. Specifically designed sounds are reproduced using a dedicated system, usually positioned in the ceiling. Various types of noise are used, traffic noise, fan noise, nature sounds, etc., with careful adjustment of reproduction levels [57]. One of the aims of future research is to conduct measurements in spaces with such systems and use the proposed SPI parameter to determine the effectiveness of the sound masking system.
5. Conclusions
The authors’ recent experience in acoustical consulting has highlighted the need for a numerical indicator to express the speech privacy level, reflecting the acoustic quality of apartments in multidwelling buildings. The SPC parameter, as defined by the ASTM E2638 standard using an Anglo-Saxon approach, was identified as a valuable indicator for assessing speech privacy in buildings. While there is limited information about its widespread use, perhaps due to its original focus on meeting rooms, it appears to be a useful indicator for residential spaces as well. The results presented in this paper demonstrate that the same approach can be applied using ISO parameters. SPC can be estimated with acceptable accuracy based on available data measured in buildings according to ISO standards, such as the single value indicator of sound insulation (sound reduction index R’w) and the equivalent noise level (LA,eq) in dB(A). These data are commonly provided by noise and building acoustics measurement software and are widely used. This extends the application of the principles formalized by standards for assessing the state of privacy in dwellings according to European practice. In this paper, it was shown through 43 in situ measurements of the sound reduction index and ambient noise that the correlation between the SPC parameter and the proposed SPI parameter is very good. This indicates that the SPI parameter can serve as an assessment of the state of speech privacy in residential or commercial spaces. The value of SPI can be predicted in the building design stage, as well as after construction, using data routinely obtained during the building’s final testing. It has been demonstrated that there is also a strong correlation between the proposed parameter SPI and the Articulation Index (AI), which is commonly used in the Western Hemisphere to quantify the state of speech privacy in open-plan offices.
Author Contributions
Conceptualization, M.M.; methodology, M.B. and D.Š.P.; software, M.B.; validation, T.M. and M.B.; formal analysis, T.M. and D.Š.P.; investigation, M.B.; resources, M.M.; data curation, M.B. and T.M.; writing—original draft preparation, M.B., M.M., and T.M.; writing—review and editing, M.B.; visualization, M.B.; supervision, D.Š.P.; project administration, T.M.; funding acquisition, M.M. All authors have read and agreed to the published version of the manuscript.
Funding
This work was financially supported by the Ministry of Science, Technological Development and Innovation of the Republic of Serbia under contract numbers 451-03-47/2023-01/200125.
Institutional Review Board Statement
Not applicable.
Informed Consent Statement
Not applicable.
Data Availability Statement
Data are contained within the article.
Conflicts of Interest
The authors declare no conflict of interest.
References
- Siefert, M.L. Concept Analysis of Comfort. Nurs. Forum 2002, 37, 16–23. [Google Scholar] [CrossRef] [PubMed]
- Jia, L.-R.; Han, J.; Chen, X.; Li, Q.-Y.; Lee, C.-C.; Fung, Y.-H. Interaction between Thermal Comfort, Indoor Air Quality and Ventilation Energy Consumption of Educational Buildings: A Comprehensive Review. Buildings 2021, 11, 591. [Google Scholar] [CrossRef]
- Aqilah, N.; Rijal, H.B.; Zaki, S.A. A Review of Thermal Comfort in Residential Buildings: Comfort Threads and Energy Saving Potential. Energies 2022, 15, 9012. [Google Scholar] [CrossRef]
- Blanco Cadena, J.D.; Poli, T.; Košir, M.; Lobaccaro, G.; Mainini, A.G.; Speroni, A. Current Trajectories and New Challenges for Visual Comfort Assessment in Building Design and Operation: A Critical Review. Appl. Sci. 2022, 12, 3018. [Google Scholar] [CrossRef]
- Monteiro da Silva, S.; Guedes de Almeida, M. Thermal and acoustic comfort in buildings. In Proceedings of the International Congress and Exposition on Noise Control Engineering: INTER-NOISE 2010, Lisbon, Portugal, 13–16 June 2010. [Google Scholar]
- Rasmussen, B. Sound insulation between dwellings—Requirements in building regulations in Europe. Appl. Acoust. 2010, 71, 373–385. [Google Scholar] [CrossRef]
- Montiel, I.; Mayoral, A.M.; Navarro Pedreño, J.; Maiques, S. Acoustic Comfort in Learning Spaces: Moving Towards Sustainable Development Goals. Sustainability 2019, 11, 3573. [Google Scholar] [CrossRef]
- Andargie, M.; Touchie, T.; O’Brien, W.; Müller-Trapet, M. A field study of the relationship between sound insulation and noise annoyance, activity disturbance and wellbeing in multi-unit residences. Appl. Acoust. 2023, 206, 109291. [Google Scholar] [CrossRef]
- Galbrun, L. The prediction of airborne sound transmission between two rooms using first-order flanking paths. Appl. Acoust. 2008, 69, 1332–1342. [Google Scholar] [CrossRef]
- Guha, M. Noise pollution and mental health. J. Ment. Health 2022, 31, 605–606. [Google Scholar] [CrossRef]
- Di Blasio, S.; Shtrepi, L.; Puglisi, G.E.; Astolfi, A. A Cross-Sectional Survey on the Impact of Irrelevant Speech Noise on Annoyance, Mental Health and Well-being, Performance and Occupants’ Behavior in Shared and Open-Plan Offices. Int. J. Environ. Res. Public Health 2019, 16, 280. [Google Scholar] [CrossRef]
- Cavanaugh, W.; Farrell, W.; Hirtle, P.; Watters, B. Speech Privacy in Buildings. J. Acoust. Soc. Am. 1962, 34, 475–492. [Google Scholar] [CrossRef]
- Benz, S.L.; Kuhlmann, J.; Schreckenberg, D.; Wothge, J. Contributors to Neighbor Noise Annoyance. Int. J. Environ. Res. Public Health 2021, 18, 8098. [Google Scholar] [CrossRef] [PubMed]
- Lee, S.; Kim, J.; Kim, S.; Song, H.; Ryu, J. An online survey on self-reported workplace design and personal factors concerning speech privacy satisfaction in open-plan office environment. Appl. Acoust. 2023, 202, 109179. [Google Scholar] [CrossRef]
- Braat-Eggen, E.; Poll, M.K.; Hornikx, M.; Kohlrausch, A. Auditory distraction in open-plan study environments: Effects of background speech and reverberation time on a collaboration task. Appl. Acoust. 2019, 154, 148–160. [Google Scholar] [CrossRef]
- Regulation on noise indicators, limit values, methods for evaluating noise indicators, disturbance and harmful effects of noise in the environment. 75/2010. The Official Gazette Republic Serbia, 1 June 2010.
- Robinson, M.; Hopkins, C.; Worrall, K.; Jackson, T. Thresholds of information leakage for speech security outside meeting rooms. JASA Express Lett. 2014, 136, 1149–1159. [Google Scholar] [CrossRef] [PubMed]
- Ren, X. Combined effects of dominant sounds, conversational speech and multisensory perception on visitors’ acoustic comfort in urban open spaces. Landsc. Urban Plan. 2023, 232, 104674. [Google Scholar] [CrossRef]
- Yu, J.; Wang, S.; Qiu, X.; Shaid, A.; Wang, L. Contributions of various transmission paths to speech privacy of open ceiling meeting rooms in open-plan offices. Appl. Acoust. 2016, 112, 59–69. [Google Scholar] [CrossRef]
- ISO 140; Measurement of Sound Insulation in Buildings and of Building Elements—Part 3: Laboratory Measurement of Airborne Sound Insulation of Building Elements. International Organization for Standardization: Geneva, Switzerland, 1998.
- Chevret, P. Release from masking of speech intelligibility due to fluctuating ambient noise in open-plan offices. Appl. Acoust. 2016, 101, 156–167. [Google Scholar] [CrossRef]
- Proakis, J.; Salehi, M. Fundamentals of Communication Systems, 2nd ed.; Pearson: London, UK, 2014; pp. 275–294. [Google Scholar]
- In Jo, H.; Santika, B.; Lee, H.; Jeon, J. Classification of sound environment based on subjective response with speech privacy in open plan offices. Appl. Acoust. 2022, 189, 108595. [Google Scholar] [CrossRef]
- Sato, H.; Morimoto, M.; Ohtani, S.; Hoshino, Y.; Sato, H. Subjective evaluation of speech privacy at consulting rooms in hospitals: Relationship between feeling evoked by overhearing speech and word intelligibility score. Appl. Acoust. 2017, 124, 38–47. [Google Scholar] [CrossRef]
- Bradley, J.; Gover, B. Speech Privacy Class for Rating the Speech Privacy of Meeting Rooms. Can. Acoust. 2008, 36, 22–23. [Google Scholar]
- Krasnov, A.; Green, E.R.; Engels, B.; Corden, B. Enhanced speech privacy in office spaces. Build. Acoust. 2019, 26, 57–66. [Google Scholar] [CrossRef]
- Gover, B.; Bradley, J. Measures for assessing architectural speech security (privacy) of closed offices and meeting rooms. J. Acoust. Soc. Am. 2004, 116, 3480–3490. [Google Scholar] [CrossRef] [PubMed]
- Hongisto, V.; Keränen, J. Comfort Distance—A Single-Number Quantity Describing Spatial Attenuation in Open-Plan Offices. Appl. Sci. 2021, 11, 4596. [Google Scholar] [CrossRef]
- Kim, J.; Dear, R. Workspace satisfaction: The privacy communication trade-off in open plan offices. J. Environ. Psychol. 2013, 36, 18–26. [Google Scholar] [CrossRef]
- Koukounian, V. A systematic investigation to assess the merits of measurement preconditions critical to speech privacy standards. J. Acoust. Soc. Am. 2022, 151, A50. [Google Scholar] [CrossRef]
- Keränen, J.; Hongisto, V. Prediction of the spatial decay of speech in open-plan offices. Appl. Acoust. 2013, 74, 1315–1325. [Google Scholar] [CrossRef]
- Müller-Trapet, M. Harmonizing Different Metrics for Speech Privacy. In Proceedings of the 23rd International Congress on Acoustics, Aachen, Germany, 9–13 September 2019. [Google Scholar]
- Payton, K.; Braida, L. A method to determine the speech transmission index from speech waveforms. J. Acoust. Soc. Am. 1999, 106, 3637–3648. [Google Scholar] [CrossRef]
- Schwerin, B.; Paliwal, K. An improved speech transmission index for intelligibility prediction. Speech Commun. 2014, 65, 9–19. [Google Scholar] [CrossRef]
- Goldsworthy, R.; Greenberg, J. Analysis of speech-based Speech Transmission Index methods with implications for nonlinear operations. J. Acoust. Soc. Am. 2004, 116, 3679–3689. [Google Scholar] [CrossRef]
- ASTM E1130-16; Standard Test Method for Objective Measurement of Speech Privacy in Open Plan Spaces Using Articulation Index. ASTM International: West Conshohocken, PA, USA, 2021.
- Amlani, A.; Punch, J.; Ching, T. Methods and applications of the audibility index in hearing aid selection and fitting. Trends Amplif. 2002, 6, 81–129. [Google Scholar] [CrossRef]
- Stiles, D. Speech intelligibility index (SII). SAGE Encycl. Hum. Commun. Sci. Disord. 2019, 4, 1770–1772. [Google Scholar] [CrossRef]
- Kates, J.; Arehart, K. Coherence and the speech intelligibility index. J. Acoust. Soc. Am. 2005, 117, 2224–2237. [Google Scholar] [CrossRef]
- Pavlovic, C. The speech intelligibility index standard and its relationship to the articulation index, and the speech transmission index. J. Acoust. Soc. Am. 2006, 119, 3326. [Google Scholar] [CrossRef]
- Bradley, J.; Gover, B. Speech levels in meeting rooms and the probability of speech privacy problems. J. Acoust. Soc. Am. 2010, 127, 815–822. [Google Scholar] [CrossRef]
- ASTM E2638-10; Standard Test Method for Objective Measurement of the Speech Privacy Provided by a Closed Room. ASTM International: West Conshohocken, PA, USA, 2017.
- Fortier, C. Speech Privacy Class measurements in Real Office Buildings according to the new ASTM 2638 standard and related STC values. In Proceedings of the Inter Noise, Ottawa, ON, Canada, 23–26 August 2009. [Google Scholar]
- ISO 717-1; Acoustics Rating of Sound Insulation in Buildings and of Building Elements—Part 1: Airborne Sound Insulation. International Organization for Standardization: Geneva, Switzerland, 2013.
- ISO 1996-1; Acoustics—Description, Measurement and Assessment of Environmental Noise—Part 1: Basic Quantities and Assessment Procedures. International Organization for Standardization: Geneva, Switzerland, 2016.
- Adnađević, M.; Mijić, M.; Šumarac Pavlović, D.; Mašović, D. Noise in dwellings generated in normal home activities—General approach. In Proceedings of the Forum Acusticum, Aalburg, Denmark, 7–12 September 2011. [Google Scholar]
- Rulebook on conditions and norms for the design of residential buildings and apartments. 82/2015. The Official Gazette Republic Serbia, 2015.
- Di Loreto, S.; Serpilli, F.; Lori, V.; Di Perna, C. Comparison between Predictive and Measurement Methods of Speech Intelligibility for Educational Rooms of Different Sizes with and without HVAC Systems. Energies 2023, 16, 2719. [Google Scholar] [CrossRef]
- U.J6.201; Technical Requirements for Designing and Constructing of Buildings. Institute for Standardization of Serbia: Belgrade, Serbia, 1990.
- ISO 16283-1; Acoustics—Field Measurement of Sound Insulation in Buildings and of Building Elements—Part 1: Airborne Sound Insulation. International Organization for Standardization: Geneva, Switzerland, 2014.
- ISO 3382; Acoustics Measurement of Room Acoustic Parameters Part 2: Reverberation Time in Ordinary Rooms. International Organization for Standardization: Geneva, Switzerland, 2008.
- Müller-Trapet, M.; Gover, B. Relationship between the privacy index and the speech privacy class. J. Acoust. Soc. Am. 2019, 145, 435–441. [Google Scholar] [CrossRef]
- Mijić, M.; Šumarac Pavlović, D.; Bjelić, M.; Miljković, T. The influence of “silence” on sound comfort. In Proceedings of the ETRAN, Srebrno Jezero, Serbia, 3–6 June 2019. [Google Scholar]
- Zaporozhets, O.; Fiks, B.; Jagniatinskis, A.; Tokarev, V.; Karpenko, S.; Mickaitis, M. Indoor noise A-level assessment related to the environmental noise spectrum on the building façade. Appl. Acoust. 2022, 185, 108380. [Google Scholar] [CrossRef]
- Glean, A.A.; Gatland, S.D., II; Elzeyadi, I. Visualization of Acoustic Comfort in an Open-Plan, High-Performance Glass Building. Buildings 2022, 12, 338. [Google Scholar] [CrossRef]
- Wallace, D.; Cheer, J. Design and evaluation of personal audio systems based on speech privacy constraints. J. Acoust. Soc. Am. 2020, 147, 2271–2282. [Google Scholar] [CrossRef]
- Renz, T.; Leistner, P.; Liebl, P. Auditory distraction by speech: Sound masking with speech-shaped stationary noise outperforms−5 dB per octave shaped noise. J. Acoust. Soc. Am. 2018, 143, 212–217. [Google Scholar] [CrossRef] [PubMed]
Figure 1.
Schematic representation of the components of ambient noise and how it reaches the receiving room.
Figure 1.
Schematic representation of the components of ambient noise and how it reaches the receiving room.
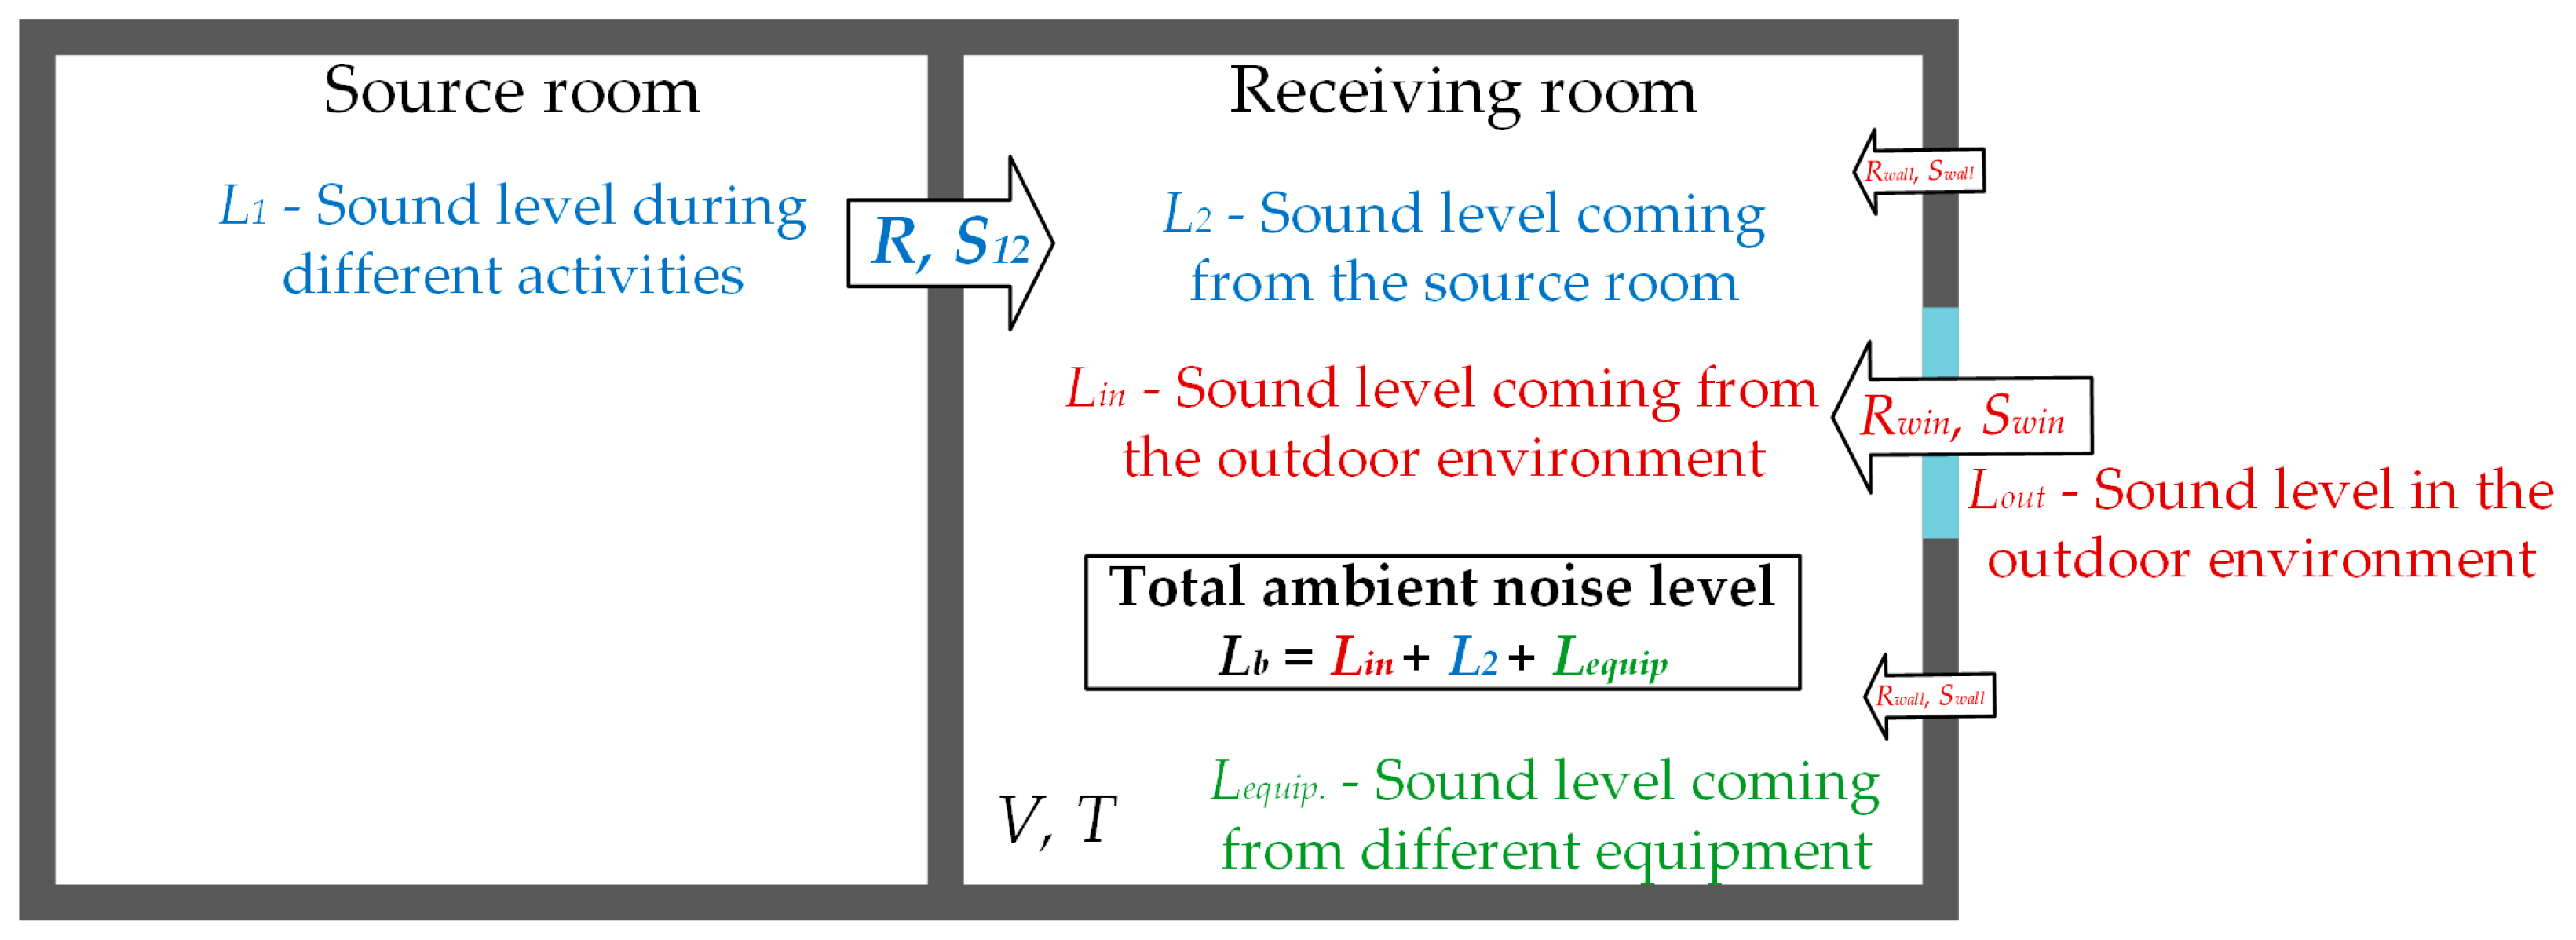
Figure 2.
Relation between the volume of receiving room and common surface between the source and receiving room for all measurement locations. Each point represents a distinct measurement location.
Figure 2.
Relation between the volume of receiving room and common surface between the source and receiving room for all measurement locations. Each point represents a distinct measurement location.
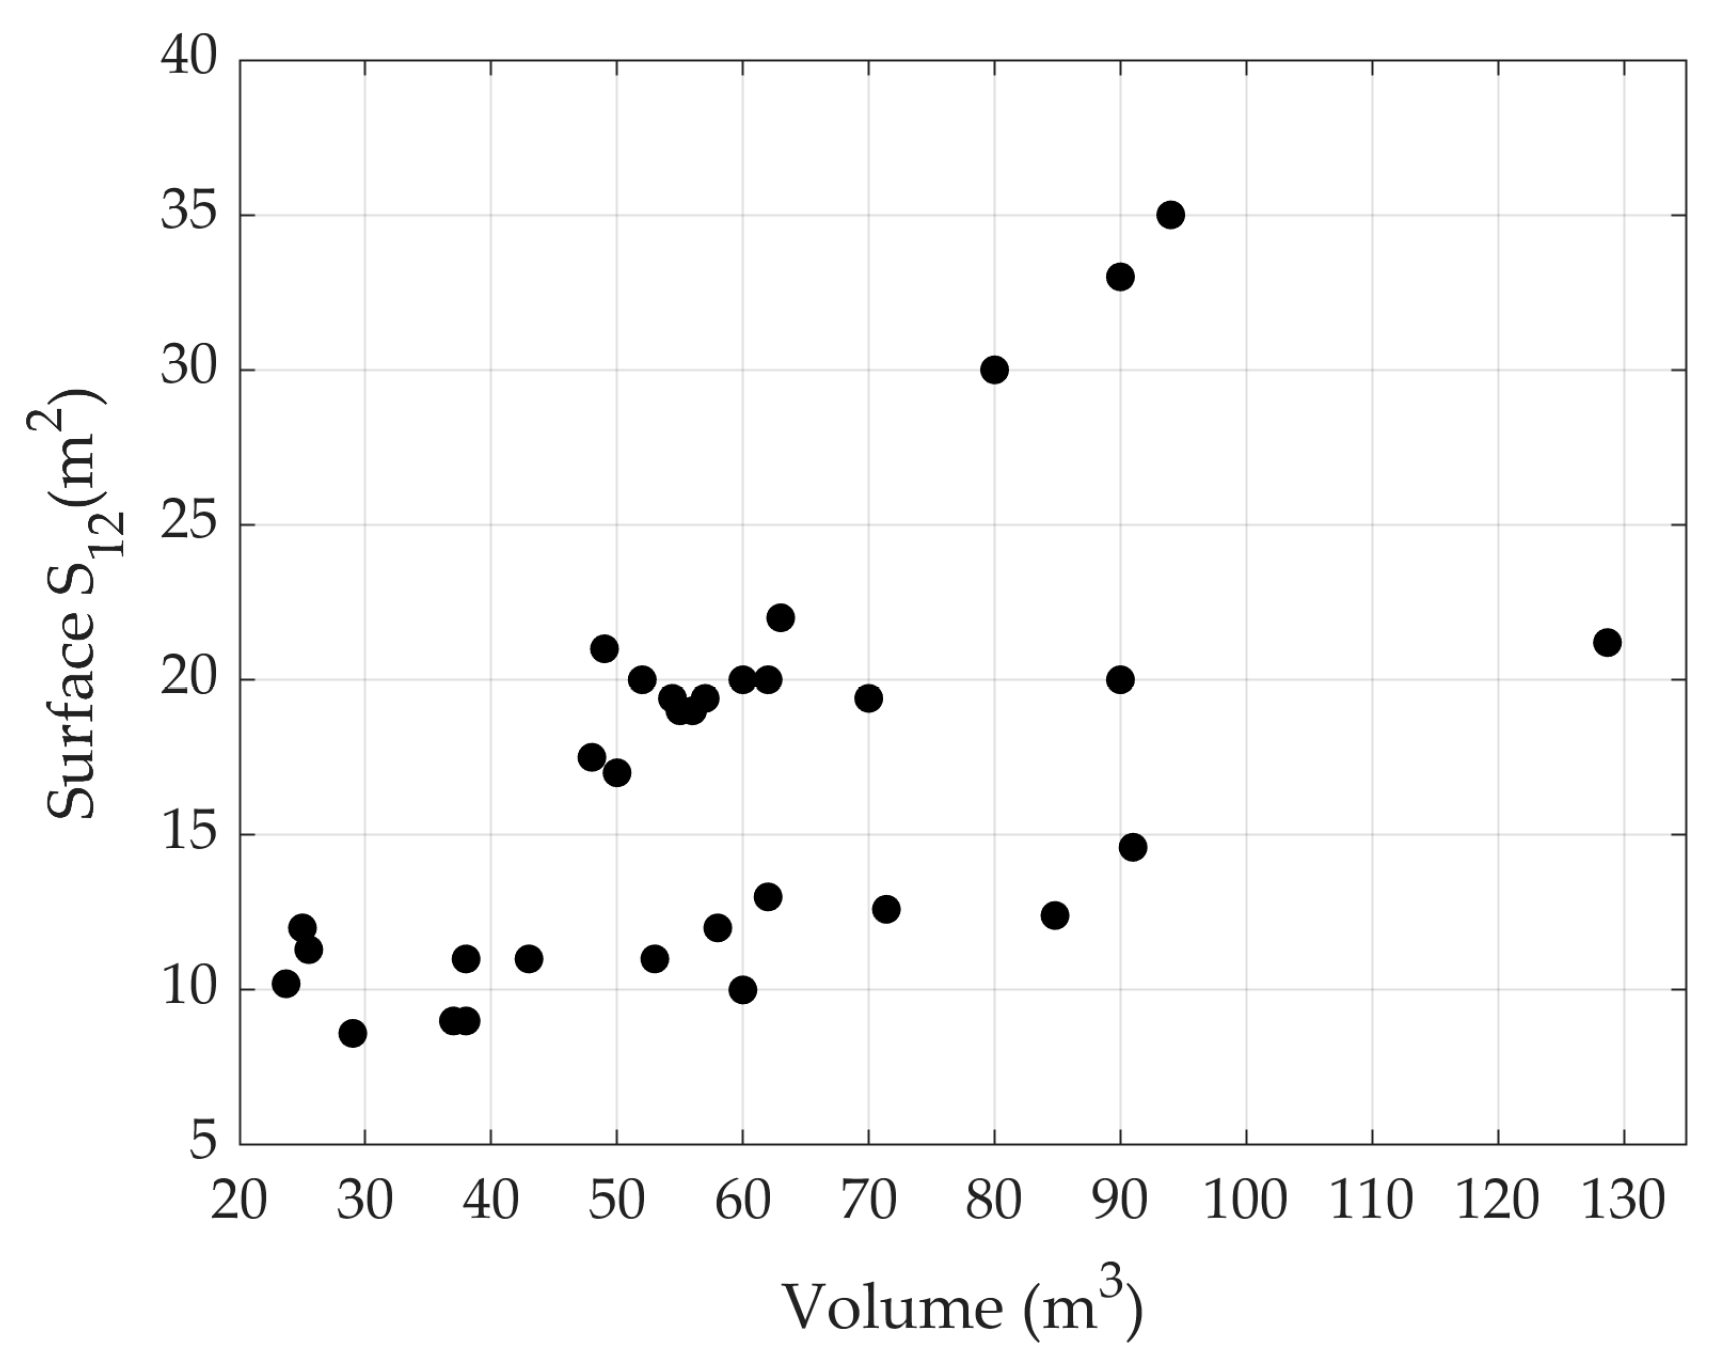
Figure 3.
Frequency dependence of reverberation time for all measurement locations.

Figure 4.
(a) Measured sound reduction index for all rooms; (b) equivalent level of ambient noise in receiving rooms; (c) spectrum of ambient noise at all measurement locations (The gray lines represent the results of all measurements. The black line represents the average value. Dots represent values in 1/1 octave bands.).
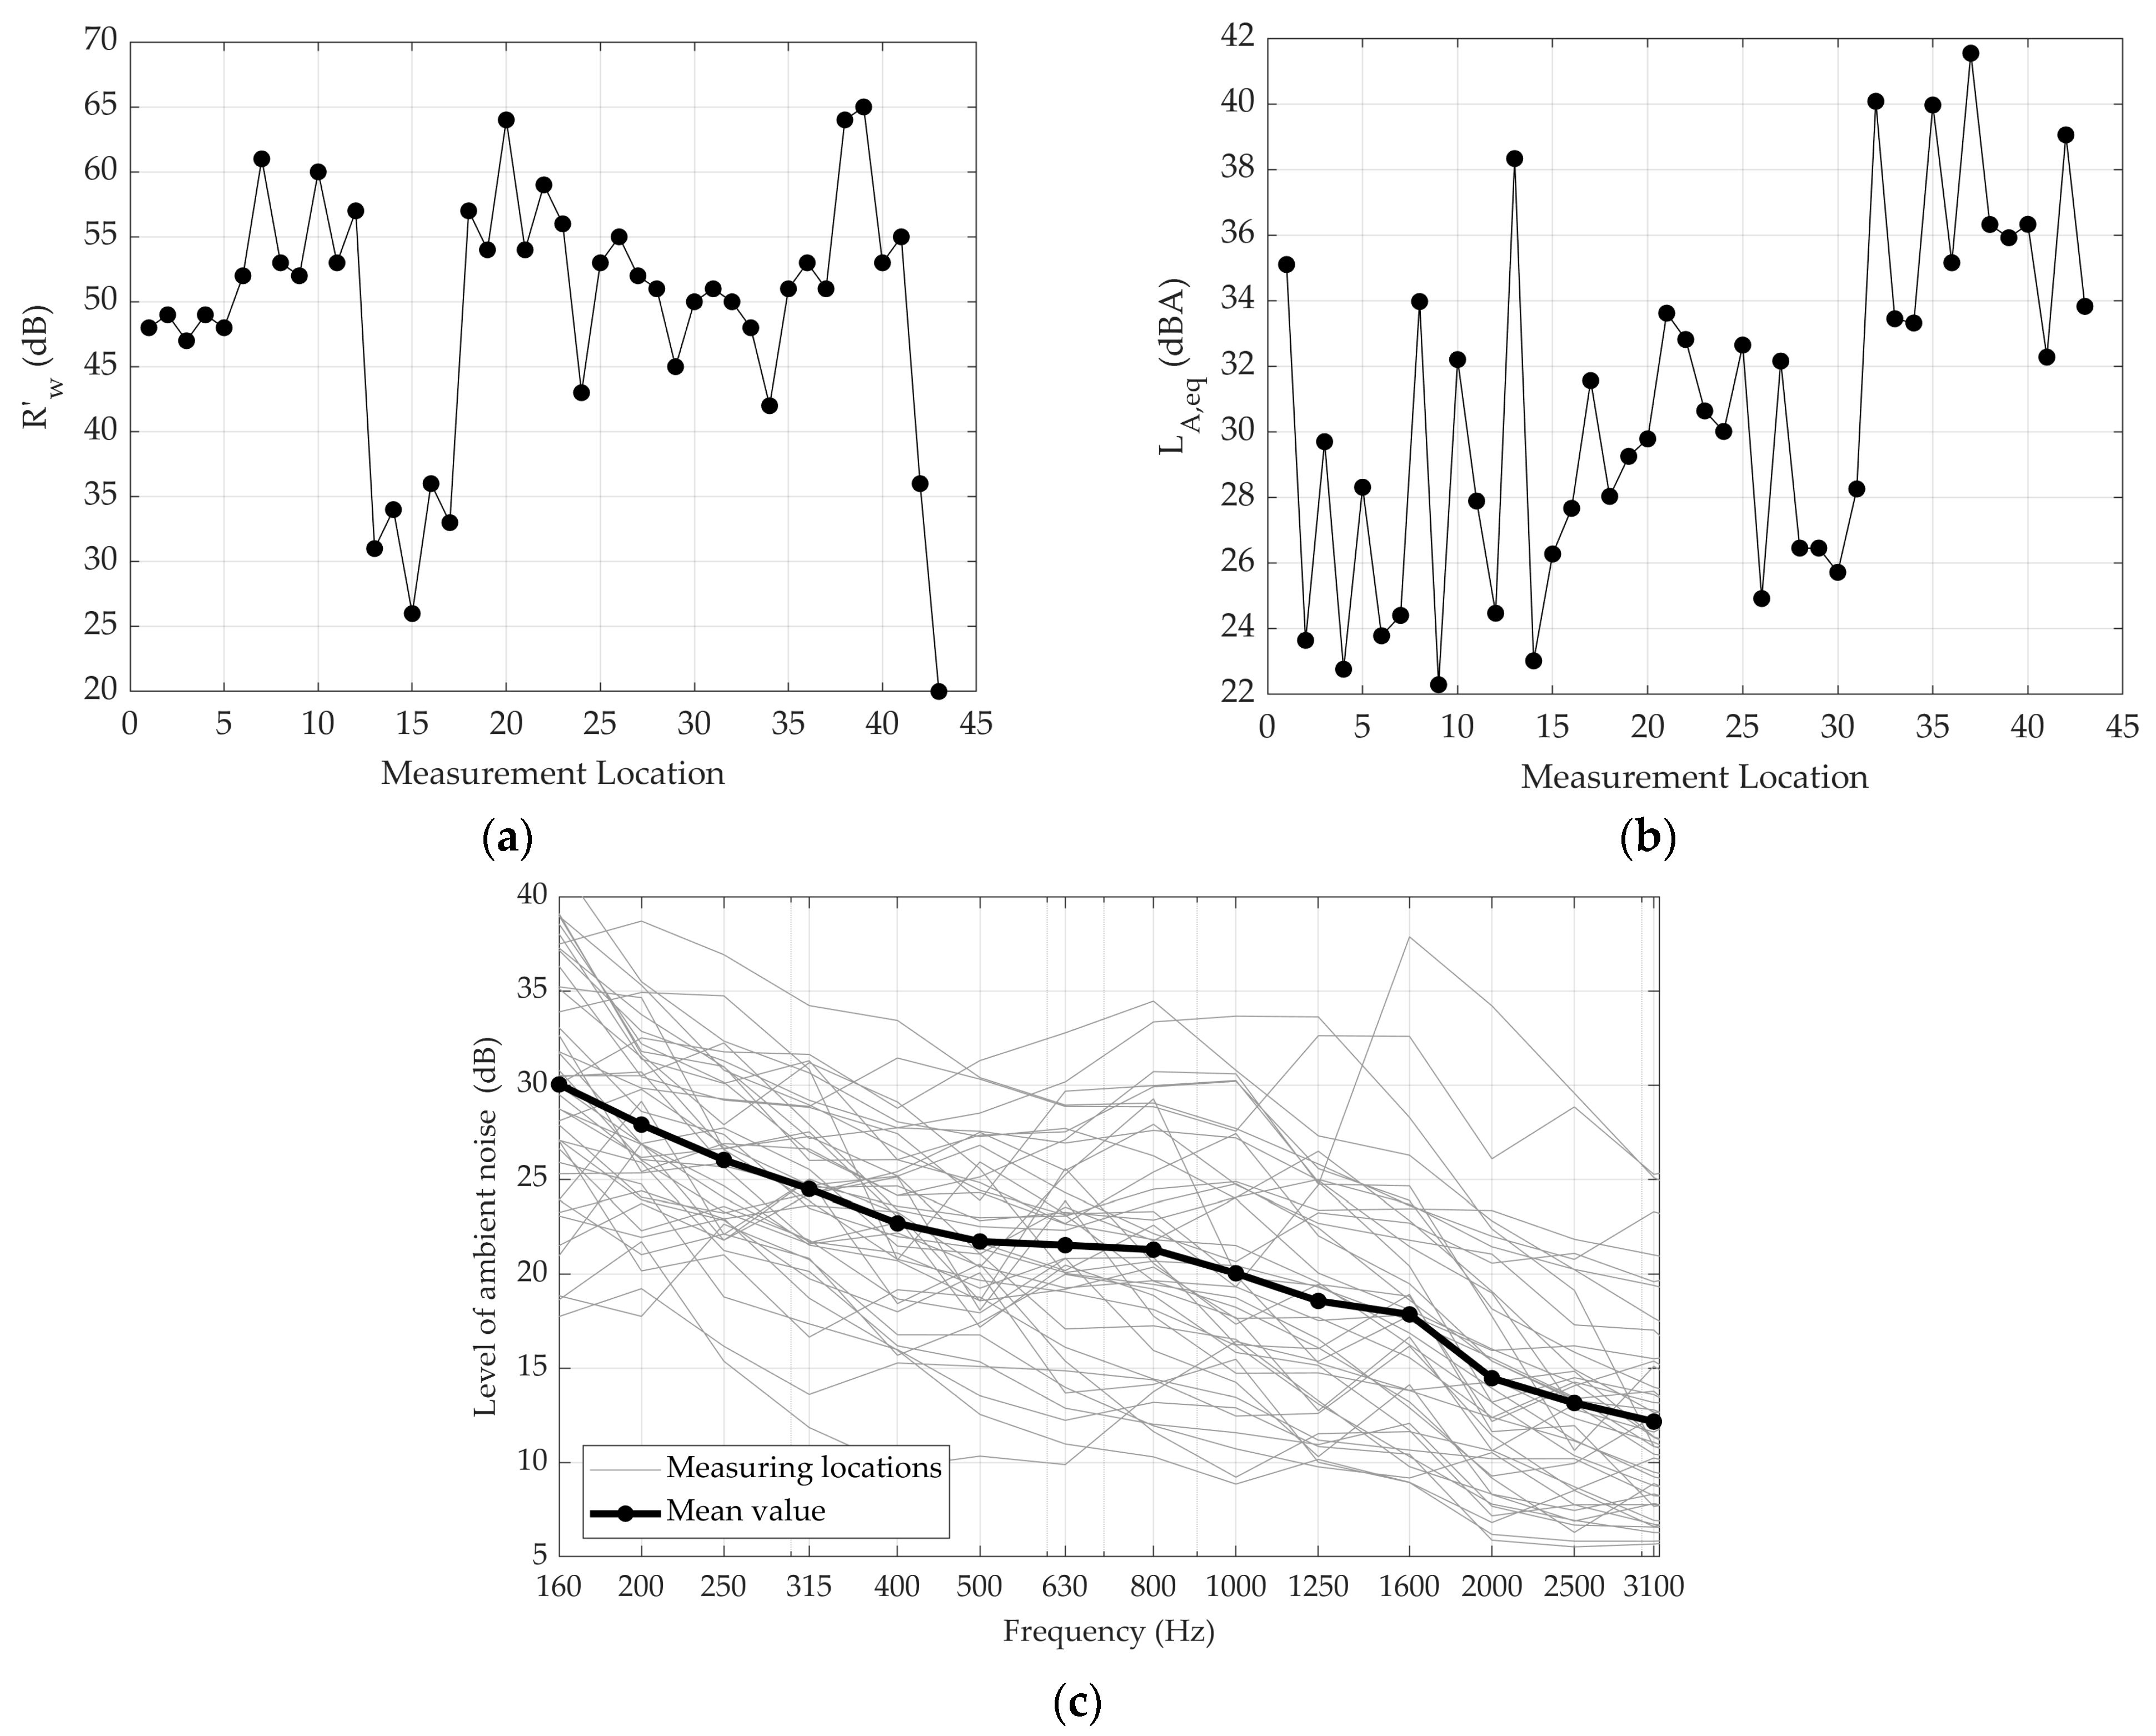
Figure 5.
Confidence intervals (95%) at all measurement locations for (a) the source room, receiving room, and background noise levels; (b) the SPC parameter. Each point represents a distinct measurement location.
Figure 5.
Confidence intervals (95%) at all measurement locations for (a) the source room, receiving room, and background noise levels; (b) the SPC parameter. Each point represents a distinct measurement location.
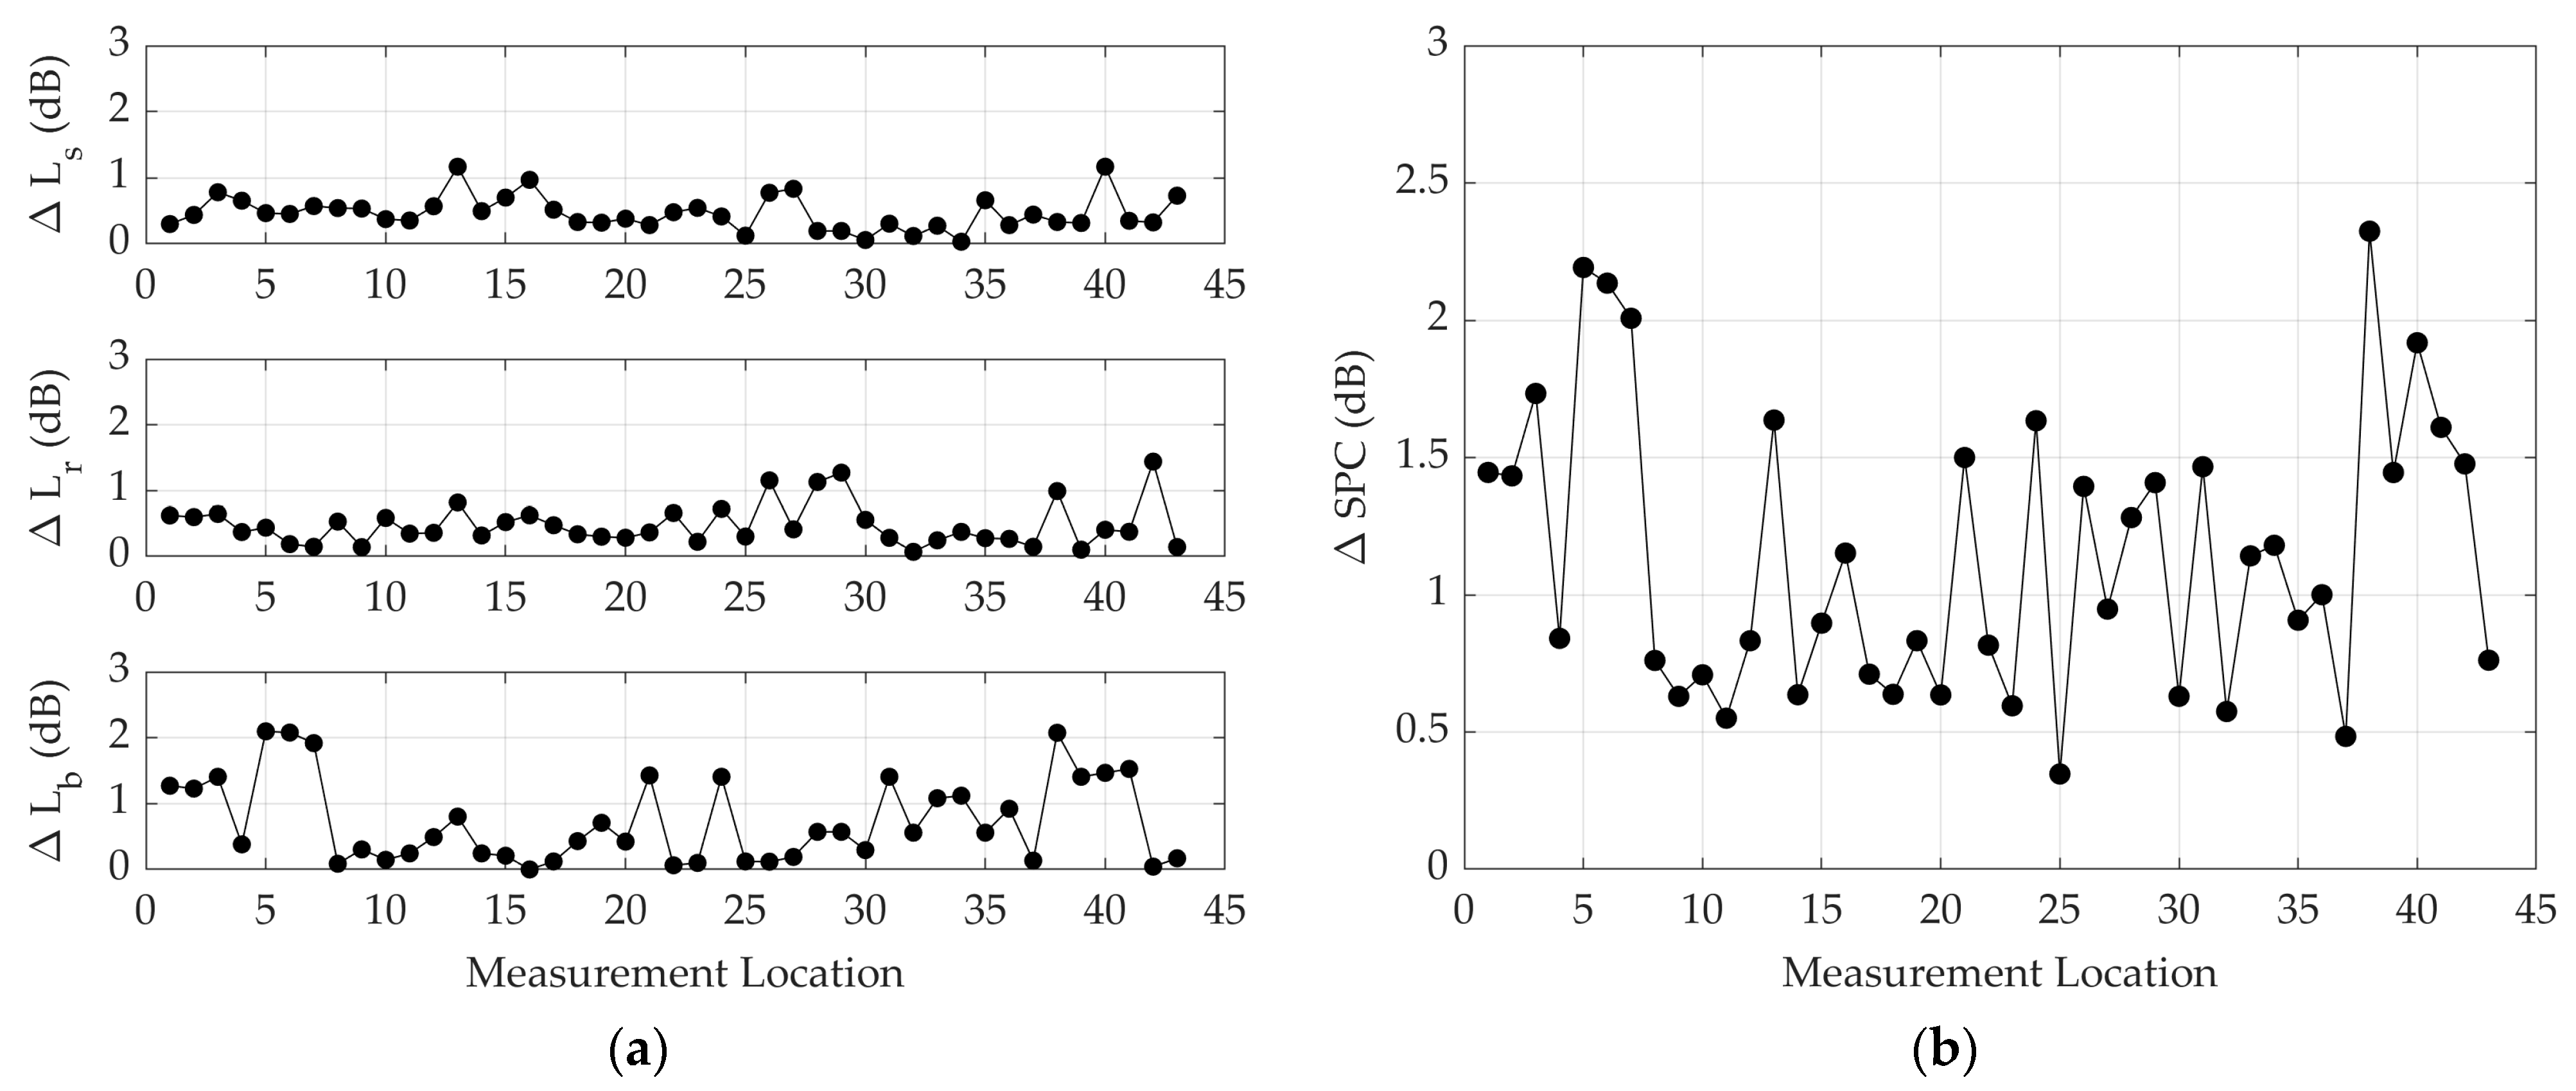
Figure 6.
Relation between the SPC and the SPI (calculated with Equations (2) and (11)).
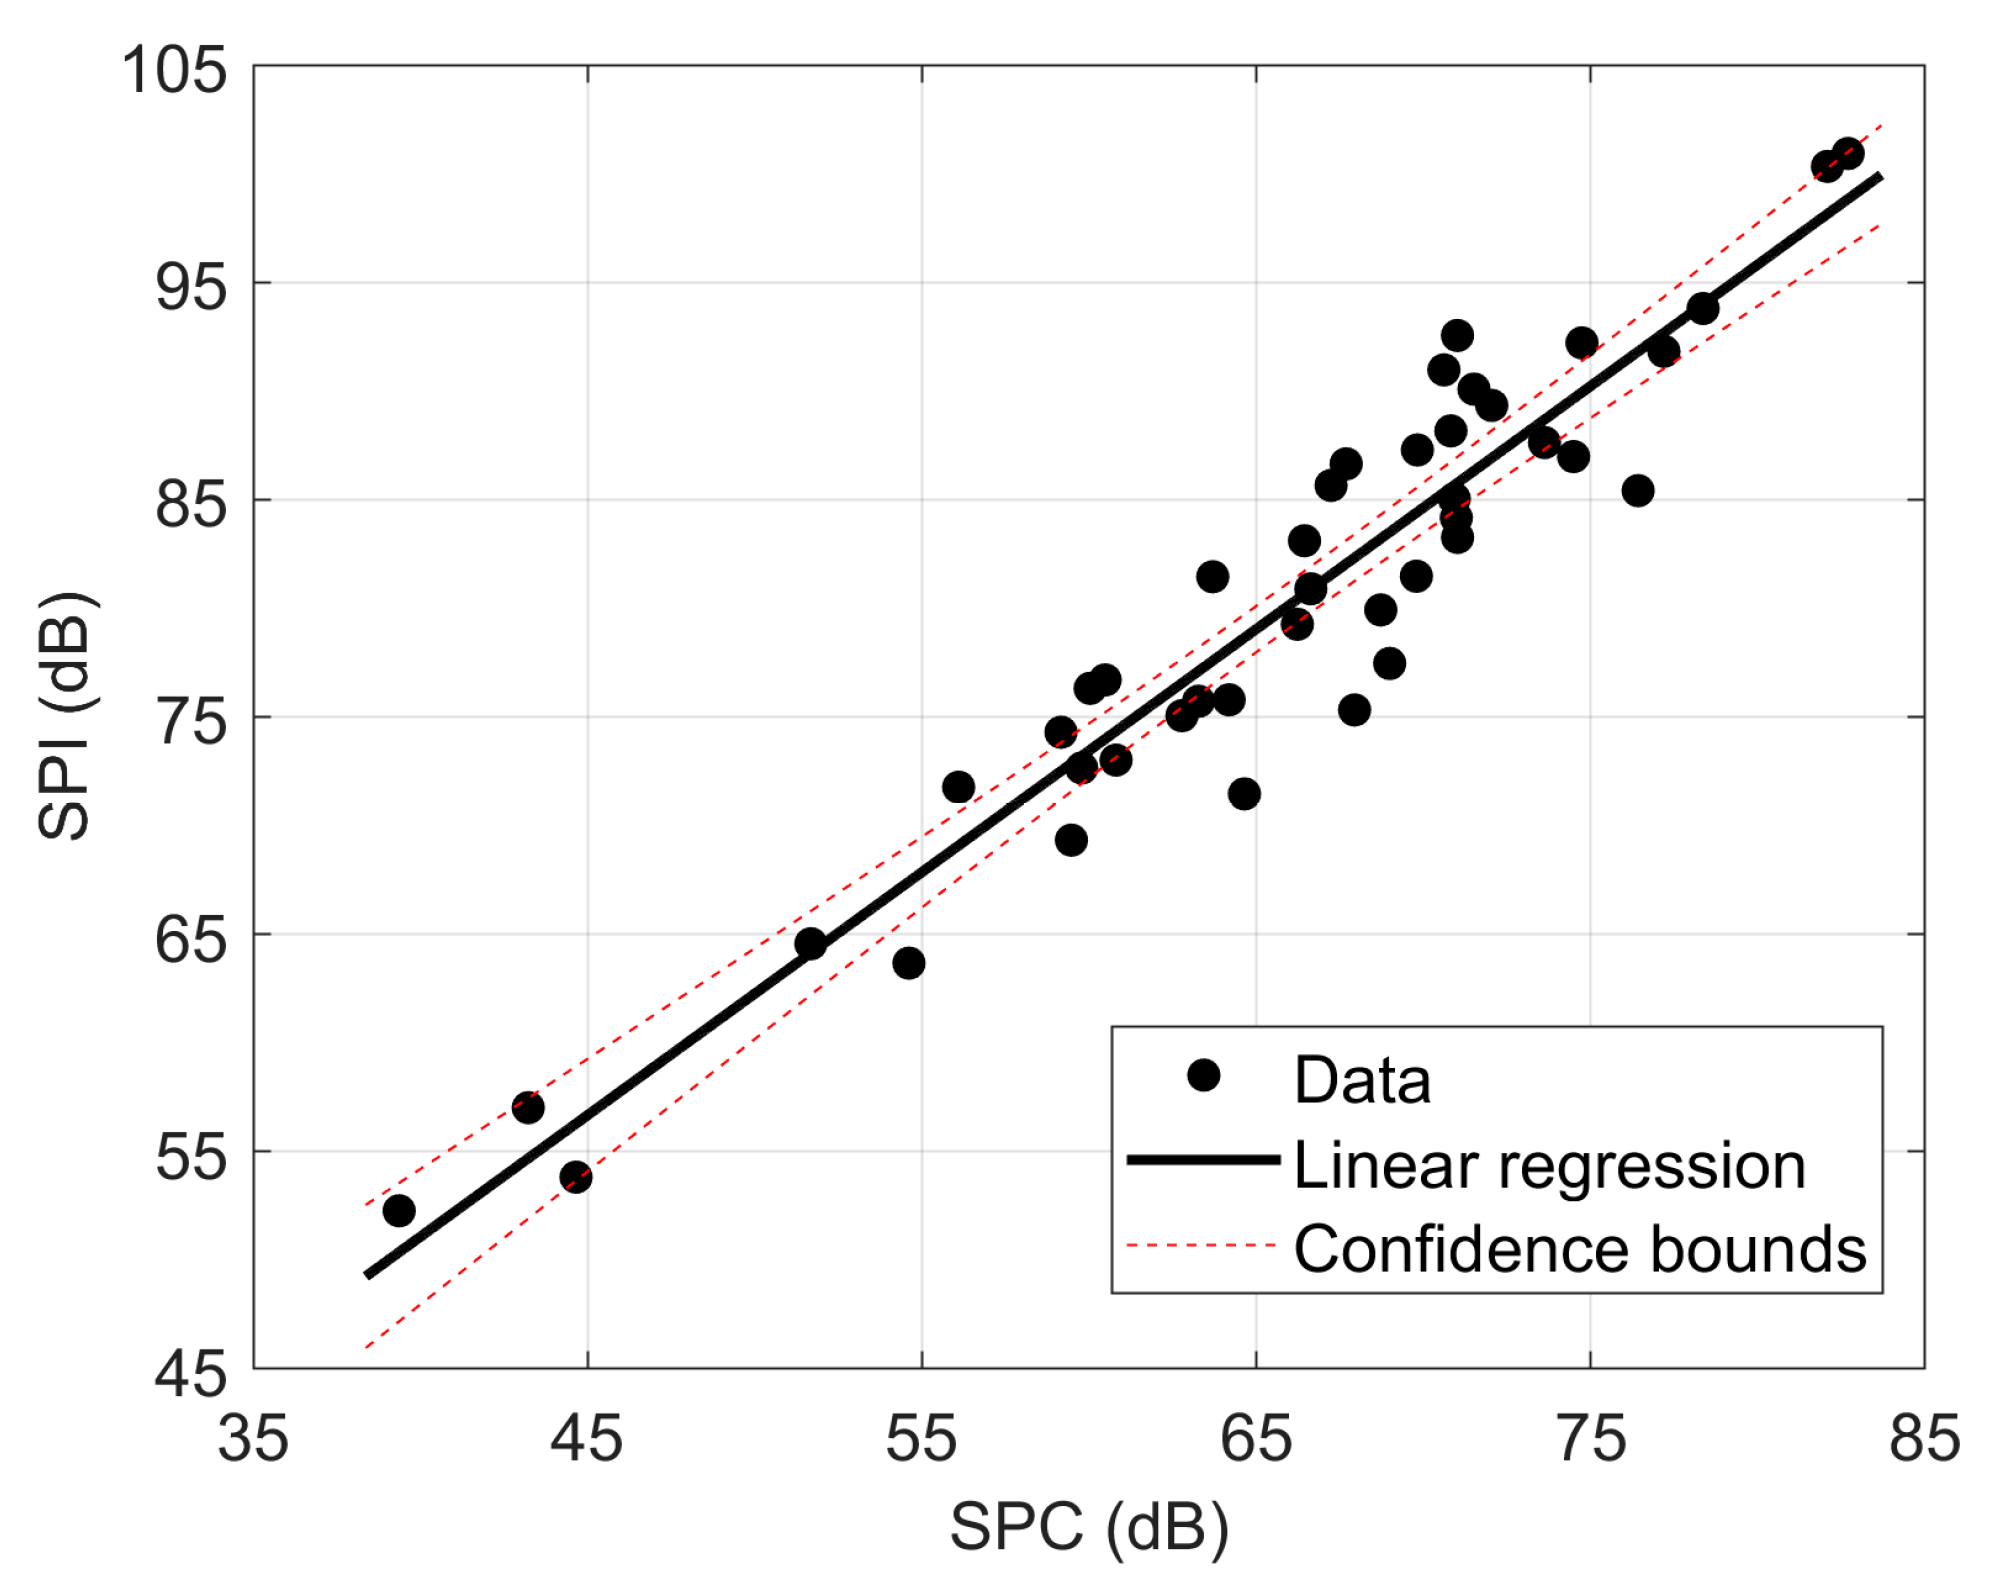
Figure 7.
Relation between the AI and the SPI (calculated with Equations (10) and (11)).

Table 1.
Descriptions of privacy states for different values of the SPC parameter [25].
Table 1.
Descriptions of privacy states for different values of the SPC parameter [25].
| SPC | Privacy States |
|---|---|
| <60 | Speech is almost always audible and often understood |
| 60–65 | Speech mostly audible; short spoken phrases occasionally understood |
| 65–70 | Speech is often heard; short spoken phrases are less often understood |
| 70–75 | Speech is rarely heard; speech is essentially unintelligible (short phrases heard no more than once every 15 min) |
| 75–80 | Speech is seldom audible, and when heard, it is incomprehensible. |
| 80–85 | Speech possibly heard every 15 min; speech unintelligible |
| >85 | Speech imperceptible |
Table 2.
Measurement locations categorized by speech privacy status [25].
Table 2.
Measurement locations categorized by speech privacy status [25].
| SPC | Number of Measurement Location |
|---|---|
| <60 | 11 |
| 60–65 | 5 |
| 65–70 | 8 |
| 70–75 | 12 |
| 75–80 | 5 |
| 80–85 | 2 |
| >85 | 0 |
Disclaimer/Publisher’s Note: The statements, opinions and data contained in all publications are solely those of the individual author(s) and contributor(s) and not of MDPI and/or the editor(s). MDPI and/or the editor(s) disclaim responsibility for any injury to people or property resulting from any ideas, methods, instructions or products referred to in the content. |
© 2024 by the authors. Licensee MDPI, Basel, Switzerland. This article is an open access article distributed under the terms and conditions of the Creative Commons Attribution (CC BY) license (https://creativecommons.org/licenses/by/4.0/).
Share and Cite
MDPI and ACS Style
Bjelić, M.; Miljković, T.; Mijić, M.; Pavlović, D.Š. An Estimation of Speech Privacy Class Based on ISO Parameter. Appl. Sci. 2024, 14, 967. https://doi.org/10.3390/app14030967
AMA Style
Bjelić M, Miljković T, Mijić M, Pavlović DŠ. An Estimation of Speech Privacy Class Based on ISO Parameter. Applied Sciences. 2024; 14(3):967. https://doi.org/10.3390/app14030967
Chicago/Turabian StyleBjelić, Miloš, Tatjana Miljković, Miomir Mijić, and Dragana Šumarac Pavlović. 2024. "An Estimation of Speech Privacy Class Based on ISO Parameter" Applied Sciences 14, no. 3: 967. https://doi.org/10.3390/app14030967
Note that from the first issue of 2016, this journal uses article numbers instead of page numbers. See further details here.