

Charactering Human-Caused Fires Using GIS-Based Dimensionality Reduction Techniques in Keelung City, Taiwan

1
Department of Harbor and River Engineering, National Taiwan Ocean University, Keelung 202301, Taiwan
2
Department of Civil Engineering, National Central University, Taoyuan 320317, Taiwan
*
Author to whom correspondence should be addressed.
Appl. Sci. 2024, 14(5), 1930; https://doi.org/10.3390/app14051930
Submission received: 27 January 2024
/
Revised: 23 February 2024
/
Accepted: 26 February 2024
/
Published: 27 February 2024
(This article belongs to the Special Issue New Trends of GIS Technology in Environmental Studies)
Abstract
:Fires resulting from human activities, encompassing arson, electrical problems, smoking, cooking mishaps, and industrial accidents, necessitate understanding to facilitate effective prevention. This study investigates human-caused fires in Keelung City, Taiwan, employing geographic information system (GIS)-based dimensionality reduction techniques. By analyzing eleven diverse factors, including fire incident density, population-related, building-related and economic-related features, valuable insights are gained for enhancing fire prevention. Utilizing principal component analysis (PCA), factor analysis (FA), and out-of-bag (OOB) predictor importance, our algorithm identifies key factors explaining dataset variance. Results from three approaches reveal a significant link between fire incidents and the elderly population, buildings over 40 years old, and the tertiary sector in the economy, contributing to developing effective measures for mitigating and managing fire occurrences.
1. Introduction
Fire disaster is one of the common hazards in various regions, such as Japan, Europe, Australia, Greece, and Taiwan [1,2,3,4,5,6,7,8,9]. According to diverse statistical analyses and methodologies used to streamline datasets when investigating the causes of fire occurrences and regional characteristics [2,3,5,9], fire incidents are categorized into various causes, including electrical factors, mechanical equipment, smoldering materials, spontaneous combustion of flammable substances, cigarette butts, candles, suicide, cooking-related fires, stoves, religious activities, ancestral worship, tomb sweeping, bonfires, construction accidents, playing with fire, gas leaks or explosions, fireworks, chemicals, traffic accidents, natural disasters, unknown causes, and other reasons [10,11]. In exploration of factors influencing fire safety, Karemaker et al. [12] mentioned that the elderly population faces concerning domestic fires, highlighting the urgent need for targeted interventions to mitigate such risks in their homes. As underscored by Laban et al. [13], the age of the dwelling emerges as a critical factor amplifying the susceptibility to fire hazards. Their research signals that as houses age, the risk of fire incidents escalates, shedding light on a nuanced aspect of fire safety that demands attention [13]. Furthermore, there are socioeconomic dimensions of fire safety, acknowledging the significance of socioeconomic factors as prominent predictors of fire rates at the neighborhood level [14]. Through a synthesis of these factors and insights from the existing literature [10,11,12,13,14], our study seeks to provide a nuanced and comprehensive perspective on the interconnections between demographic shifts, structural aging, economic dynamics, and fire safety.
According to data from Taiwan in 2021 [15], there were a total of 21,684 reported fire incidents, leading to a significant economic loss surpassing 355.2 million New Taiwan Dollars (NTD). These incidents resulted in approximately 192 fatalities and 304 injuries. In the context of Keelung City, there were 133 reported fire incidents in the same year. Among these incidents, electrical factors emerged as the predominant cause, constituting 39 cases and representing 29% of the total occurrences [16,17]. Based on the fire investigation data from the Keelung City Fire Bureau in the past decade [18], building fires are the most common type of fires in Keelung City. The investigation data reveals that most fire incidents in the city are caused by human negligence, with electrical factors and cooking-related fires being the primary causes [17,18]. Previous studies in various countries, including Spain, Japan, and Europe [2,3,6], have utilized various approaches like principal component analysis (PCA), comparative analysis, and statistical analysis to explore the factors behind fire incidents and regional attributes. PCA stands out as a prevalent dimensionality reduction technique frequently employed in the investigation of fire incidents and regional attributes, identifying numerous factors associated with fire characteristics [19,20,21,22]. These variables encompassed average population density, household density, ratios of elderly population, and more. Findings from the prior studies [2,5,23,24,25] indicate that the spatial-temporal dynamics within fire regime attributes, including fire frequency, burnt area, occurrences of large fires, and incidents of both natural and human origin, constitute a critical component of fire regime characterization. These findings unveiled spatiotemporal trends in fires [26,27]. Additionally, the geographic information system (GIS) enables spatial analysis and the integration of spatial data for environmental analysis and disaster management [28,29]. Combining GIS with PCA aids in identifying spatial patterns and trends associated with human-caused fires [30], offering multiple benefits for delineating fire patterns [31]. This integration establishes a robust framework for characterizing fires [32,33], integrating spatial analysis, dimensionality reduction, pattern recognition, risk factor identification, and effective visualization and communication of results [29,30,31].
In addition to employing PCA to investigate spatiotemporal trends in fires, previous studies utilize various other dimensionality reduction methods like factor analysis (FA) and linear discriminant analysis to investigate the factors contributing to fires [19,22,32]. Dimensionality reduction aims to decrease the number of features in a dataset while retaining as much information as possible. PCA and FA are both techniques used for dimensionality reduction, but they adopt different methods to project the data onto a lower-dimensional space while preserving important information [19,20]. PCA has been employed to analyze fire incidents and regional attributes, identifying various factors including human activities, industrial behaviors, building types, and other pertinent variables for evaluating fire-related characteristics. The use of PCA has been effective in summarizing temporal behavior and exploring potential connections in the evolution of fire features [19]. Furthermore, PCA is beneficial for characterizing fires by simplifying intricate datasets, identifying key factors, uncovering dominant trends, assisting in visualization, and establishing a foundation for more efficient and accurate analyses [20,21]. In recent years, climate change has frequently increased the susceptibility of certain areas to wildfires, simultaneously escalating the severity of fire incidents [23,25,34,35]. In light of the influence of global warming and extreme climate changes, PCA has found widespread application in the analysis of fire characteristics and the examination of spatiotemporal trends in fires [19,20,35,36]. Within the realm of machine learning methods such as PCA and FA, random forest (RF) stands out as a robust algorithm known for its strong performance with default settings [7,37,38]. RFs offer the benefit of estimating predictor importance through the permutation of out-of-bag (OOB) predictor observations across the ensemble of trees [39,40]. The OOB predictor refers to a method used for estimating the prediction error of a model trained with bootstrap aggregation (bagging) [41]. This involves computing the increase in OOB errors resulting from randomly permuting the observations of predictor variables in the OOB sample for each tree. The averaged value over all trees indicates the importance of each variable within the RF. The higher the importance measure, the greater the influence of the variable in predicting the response [42].
In this study, we analyze the contributing factors of fire incidents and combine the spatial distribution of fires with factors such as elderly population, population density, and building age to identify potential areas for strengthening preventive measures. By exploring the various factors associated with fires, we aim to provide insights for enhancing fire prevention strategies in the future. Human-caused fires, stemming from activities such as negligence, arson, electrical malfunctions, or industrial accidents, are a significant concern requiring in-depth analysis for effective prevention and risk assessment. This article presents an innovative approach to analyzing human-caused fires in Keelung city, Taiwan, utilizing GIS-based dimensionality reduction techniques. Given the substantial risks associated with these fires, comprehending their characteristics and influencing factors is paramount. The proposed method involves an examination of multiple factors, including fire incident density, population density, the proportion of elderly individuals, the proportion of old buildings, the proportion of old non-reinforced concrete (RC) buildings, and the economic contributions of the secondary and tertiary sectors. This comprehensive analysis aims to provide valuable insights that can enhance strategies for fire prevention and risk assessment. Implementing a multi-factorial perspective, the algorithm employs dimensionality reduction techniques including the PCA, FA, and OOB predictor importance to identify key components that explain the majority of the variance in the dataset. This approach facilitates a thorough understanding of human-caused fires by considering their various dimensions. The proposed model’s effectiveness is validated using historical fire incident data.
2. Materials and Methods
2.1. Study Area and Dataset
The study area is Keelung City, located in the northeastern part of Taiwan. It has a land area of approximately 132.8 km2. The majority of the city’s land is covered by slopes, accounting for about 94% of the total land area, while flat terrain comprises only around 5%. The remaining areas mainly consist of rivers and lakes, with the Keelung River being one of the most significant rivers in the city, running through the entire area and flowing into Keelung Port. Keelung City is divided into seven districts, namely Renai District, Xinyi District, Zhongzheng District, Zhongshan District, Anle District, Nuannuan District, and Qidu District, as shown in Figure 1a. The city has a total of 157 villages. Keelung City has a total of 156,056 households. The population of Keelung City is nearly 370,000 people [43]. GIS spatial analysis was employed to generate a village unit GIS-based model encompassing 157 villages within the study area. This study utilized ArcGIS 10.8, which is developed by the Environmental Systems Research Institute (ESRI) and renowned as one of the most extensively employed GIS software (https://www.esri.com/en-us/home, accessed on 1 March 2023) products globally [44,45]. ArcGIS provides a broad spectrum of tools for mapping, spatial analysis, data management, and visualization. The comprehensive procedure involves the utilization of the GIS, where geographical information, specifically the Taiwan Datum 1997 (TWD97) coordinate system, pertaining to the study area, is digitized and incorporated into the GIS as layers, along with various attribute data.
Data regarding the location, frequency, and types of fires occurring in Keelung City over the past decade have been collected from the Keelung City Fire Bureau [16]. By analyzing this historical data, we can identify potential fire hotspots that may be linked to specific geographical conditions or human activities. Following these steps, the fire incident hotspots in Keelung City are depicted in Figure 1b, facilitating the formulation of response measures to minimize losses and safeguard communities.
2.2. Geospatial Data Preparation
To investigate human-caused fires using GIS-based dimensionality reduction techniques in Keelung City, Taiwan, this study organizes geospatial data. Firstly, fire incident data spanning the last decade [16] is collected from the Keelung City Fire Bureau. This dataset comprises eleven varied factors, encompassing fire incident density, population-related, building-related, and economy-related attributes. Table 1 outlines all eleven factors, where Factor 1 denotes fire density per unit area, Factor 2 to Factor 11 represent factors pertinent to fire incidents: Factors 2 to 5 correspond to population-related attributes, Factors 6 to 8 pertain to building-related characteristics, and Factors 9 to 11 relate to economic factors.
The raw data for the eleven factors used in this study are sourced from various departments of the Keelung City Government [16,43,46,47,48]. This study focuses on inventorying the factors associated with fire disasters and utilizing the GIS as an analytical tool. The various attribute data are digitized and input into GIS software, facilitating the analysis of the data and their spatial applications. To integrate point data for each factor listed in Table 1, which already contains location information, into village units within a GIS framework, we initially import the point data representing specific locations into the GIS software. This dataset may include information on incidents, landmarks, or other relevant point-based data associated with village units. Subsequently, we import village boundary data to delineate the geographic boundaries and extent of each village unit. We subsequently employ spatial analysis tools within the GIS software to perform a spatial join between the point data and the village boundary data, enabling the analysis of the spatial distribution of point data within the village boundaries. This procedure links each point with the respective village unit it pertains to. Upon completion of the spatial join, attributes from the point data can be transferred to the corresponding village units, enabling the aggregation and analysis of point-based information at the village level. Through the implementation of these specified steps, the integration of point data with village units in a GIS environment is achieved, facilitating the utilization of spatial analysis techniques to extract valuable insights from geographic datasets.
Figure 2 illustrates the various fire incident factors. The aim of this study is to investigate which factors, from Factor 2 to Factor 11, are correlated with Factor 1 (fire density per unit area) to find the factors highly associated with high fire incident density. The following section provides an introduction and explanation of the definitions for factors from Factor 1 to Factor 11.
2.2.1. Fire Density over the Past 10 Years
The historical fire data used in this study span from 2012 to 2021 and are sourced from the Keelung City Fire Bureau. Over the past 10 years, there have been approximately 1095 fire incidents recorded by the Fire Bureau [16]. In this study, the focus is on analyzing indoor fire disasters, excluding non-building-related fires. Within the 10-year period, there were 811 incidents of indoor fire disasters. Detailed information on the frequency and spatial distribution of fire incidents in Keelung City can be found in Figure 2a where the fire density in Keelung City over the past 10 years is depicted. The definition of the fire incident density over the past 10 years is as in Equation (1).
where denotes the fire density over the past 10 years, denotes the number of fire incidents in each village, and denotes the area of each village (measured in square meters).
2.2.2. Population Density
In this study, population density is determined by dividing the total population of the village by its land area, establishing it as a crucial factor for calculating the population density, defined as Equation (2).
where denotes the population density, and Npd denotes the number of people in each village. The spatial distribution of population density in Keelung City is presented in Figure 2b.
2.2.3. Proportion of Elderly Population
According to the World Health Organization (WHO), individuals aged 65 and above are considered elderly [49]. In this study, Equation (3) defines the proportion of the elderly population.
2.2.4. Proportion of Elderly Living Alone Population
According to the Department of Social Affairs, Keelung City Government [46], elderly individuals living alone are defined as those aged 65 and above who are registered as living alone, and whose children do not actually reside in Keelung or lack the ability to provide care. The proportion of the elderly living alone population is evaluated by Equation (4).
where denotes the proportion of elderly people living alone, and Npe denotes the number of elderly individuals living alone in each village. Figure 2d illustrates the proportion of elderly living alone population.
2.2.5. Proportion of Young Age Population
According to the Ministry of the Interior [17], individuals aged 0–14 are considered part of the young age population. The proportion of young age population is evaluated by Equation (5).
where denotes the proportion of young population, and Npy denotes the number of young population in each village. Figure 2e illustrates the proportion of young age population.
2.2.6. Building Density
The building density refers to the ratio of the total built-up area within a specific village to the total land area of that village, defined as Equation (6).
where denotes the proportion of buildings, and denotes the number of buildings in each village. Figure 2f illustrates the proportion of buildings.
2.2.7. Proportion of Buildings over 40 Years Old
The aging of building structures introduces potential safety concerns, including aged wiring and material deterioration, which may escalate the likelihood of a fire. The proportion of buildings over 40 years old is defined as Equation (7).
where denotes the proportion of buildings over 40 years old, and denotes the number of buildings aged 40 years and above in each village. Figure 2g illustrates the proportion of buildings aged 40 years and above.
2.2.8. Proportion of Non-Reinforced Concrete (RC) Buildings
Non-RC buildings refers to structures constructed with unreinforced concrete, lacking the addition of steel bars or mesh. In construction, reinforcement is commonly integrated into concrete structures to augment their strength and longevity. It signifies that the mentioned buildings do not possess this supplementary reinforcement and have been in existence for four decades. In this study, non-RC buildings are considered one of the factors influencing fire, with its formula expressed as Equation (8).
where denotes the proportion of buildings, and denotes the number of non-RC buildings in each village. Figure 2h presents the ratio of non-RC buildings in Keelung City.
2.2.9. Proportion of First, Secondary, and Tertiary Sectors of the Economy
According to the Department of Economic Affairs, Keelung City Government [48], industries in Keelung City are classified into three levels: primary industry, secondary industry, and tertiary industry. The primary industry includes forestry, agriculture, animal husbandry, and fishing. The secondary industry comprises industrial activities, while the tertiary industry encompasses service-related sectors such as food and beverage, accommodation, and more. The proportion of the first, secondary, and tertiary sectors of the economy is evaluated by Equation (9).
where , , and F11 denote the proportion of first, secondary and tertiary sectors of the economy, and , , and denote the number of first, secondary, and tertiary sectors of the economy in each village. Figure 2i–k illustrates the proportion of first, secondary, and tertiary sectors of the economy.
3. Dimensionality Reduction Techniques
Dimensionality reduction methods in machine learning are employed to decrease the number of features or variables in a dataset while retaining essential information. The objective is to simplify the dataset by removing redundant or irrelevant information, thereby addressing the dimensionality reduction [22,34]. In this study, we implemented dimensionality reduction to enhance data interpretability. While these techniques serve diverse purposes in machine learning, PCA, FA, and OOB predictor importance are interconnected with dimensionality reduction for feature extraction [41,42], as utilized in this study. Additionally, OOB predictor importance was employed to identify influential predictors among the eleven variables and was compared to results obtained from PCA and FA.
3.1. Principal Component Analysis
The primary goal of PCA is to transform the original variables into a new set of uncorrelated variables or principal components that capture the maximum variance in the data. In PCA, it assumes that all the variance in the variables is due to the underlying structure captured by the principal components [19,20]. These components are linear combinations of the original variables. The principal components are linear combinations of the original variables, and each component is a weighted sum of all variables [21,22]. These components capture the maximum variance in the data, allowing for the reduction of dimensions while preserving most of the information.
PCA was used for feature extraction among the eleven variables, and it helps identify the directions in which the data varies the most. The principal components are linear combinations of the original features. It seeks to summarize or approximate the data using fewer dimensions. The interpretation of these components in terms of the original variables might not be straightforward. Principal components are orthogonal to each other, ensuring that they capture different aspects of variance [34,35].
3.2. Factor Analysis
Similar to PCA, FA is a technique for dimensionality reduction. However, FA assumes that observed variables are influenced by underlying latent factors, and it aims to identify these factors among the eleven variables. The purpose of FA is to identify latent factors that underlie the observed correlations among variables. These latent factors are assumed to influence the observed variables, and FA aims to uncover them from the dataset. The objective of FA is to provide an explanatory model for the observed data by identifying and describing the underlying structure of the variables. Through dimensionality reduction and the identification of latent factors, FA helps in understanding the relationships and patterns present in the dataset, thus facilitating insights into the underlying mechanisms driving the observed correlations among variables [36]. FA posits that the observed variables are influenced by both latent factors and unique factors. The latent factors are not directly observed but are inferred from the correlations among the variables. The latent factors are interpreted as underlying constructs that contribute to the observed correlations among variables. These factors are often given meaningful labels based on the variables with which they are associated. Latent factors can be correlated, allowing for a more flexible representation of the underlying structure [50].
3.3. Out-of-Bag Predictor Importance
OOB predictor importance in the context of RFs is a crucial aspect for understanding the contribution of each predictor variable to the model’s predictive performance. This approach provides a robust and internal measure of feature importance [39,40]. OOB predictor importance measures the contribution of each predictor or feature in the RF model [41]. It is often computed by permuting the values of a predictor in the OOB samples and observing the resulting increase in prediction error. The higher the increase, the more important the predictor is considered [42].
Although PCA, FA, and OOB predictor importance serve different purposes, integrating them can form a comprehensive approach for managing high-dimensional data. To elaborate, PCA and FA are utilized for feature extraction by means of dimensionality reduction. Drawing an analogy between the contribution of each original feature to the captured variance in a principal component and predictor importance in an RF, we incorporated OOB predictor importance to pinpoint influential predictors within the specific model being utilized.
Figure 3 depicts the schematic flowchart diagram illustrating the process of this study. This study began with data preparation, followed by GIS spatial analysis, specifically utilizing the spatial join tool to merge the point data with village boundary data, facilitating the examination of relationships between point features and their spatial context within villages. Subsequently, eleven factors were established, and dimensionality reduction techniques, including PCA, FA, and OOB predictor importance, were applied. In this study, the PCA, FA, and OOB predictor importance were implemented using MATLAB R2023a by the MathWorks [51]. In particular, PCA and FA were employed to achieve dimensionality reduction and identify latent variables. These methods, while effective, rely on linear combinations of variables. Consequently, they may exhibit limitations when dealing with nonlinear or complex relationships between variables. In response to such scenarios, the study introduced the OOB predictor importance in the context of RFs. This nonlinear approach provides valuable insights into the relationships between variables, particularly in situations where linearity is not sufficient. Finally, the identification of factors contributing to human-caused fires was conducted. The ensuing sections will delve into a comparison and discussion of the obtained results.
4. Results
This study combines a GIS with dimensionality reduction methods to explore potential factors contributing to human-caused fires in Keelung City, Taiwan. Eleven datasets related to potential fire factors are amalgamated in this study. The coordinate system used is TWD97. The subsequent sections focus on the identification of factors contributing to human-caused fires and the implications of the identified components.
4.1. Identification of Factors Contributing to Human-Caused Fires
By employing PCA and correlation coefficient matrices, we gained insights into the relationship between each factor and fire incidents. The correlation coefficients of potential fire factors with fire are depicted in Figure 4. As shown, Factor 1 denotes the fire density over the past 10 years and displays positive correlations with other factors. Notably, the highest correlation, reaching 0.77, is observed between Factor 7 (proportion of buildings over 40 years old) and Factor 1 (fire density over the past 10 years). The positive correlations observed between fire density over the past 10 years and other factors, such as the high correlation of 0.77 between Factor 7 (proportion of buildings over 40 years old) and Factor 1 (fire density over the past 10 years), suggest potential relationships between these variables. One hypothesis could be that older buildings are more susceptible to fires due to aging infrastructure, outdated electrical systems, or other factors associated with older constructions. As buildings age, they may become more prone to fire incidents, leading to higher fire densities in areas with a greater proportion of older structures [52,53]. This hypothesis implies that the age and condition of buildings play a significant role in determining the frequency of fire incidents, which could inform urban planning, building maintenance, and fire prevention strategies [54].
Based on the PCA findings in this study, it is found that a heightened proportion of buildings aged over 40 years per unit area may contribute to an increased risk of fire incidents. This is primarily due to various factors associated with aging structures. Older buildings often showcase outdated electrical systems, deteriorating wiring, and structural materials, making them more vulnerable to faults and potential fire hazards. Moreover, the absence of modern fire-resistant materials and technologies in these structures reduces their ability to withstand or mitigate fire events. The accumulation of these contributing factors within a defined area, indicated by a higher proportion of older buildings, amplifies the overall risk of fire incidents in the specified geographical space.
Additionally, noteworthy correlations with an increased frequency of fire incidents were observed for Factor 11 (proportion of tertiary sectors of the economy) and Factor 3 (proportion of elderly population) at 0.73 and 0.70, respectively. The results indicate that the “proportion of tertiary sector of the economy“ and the “proportion of elderly population“ may also contribute to an elevated risk of fire incidents for distinct reasons [12,13,14].
Moreover, it appears that the positive correlations observed between fire density over the past 10 years and factors such as Factor 2 (population density), Factor 6 (building density), and Factor 10 (proportion of the secondary sector of the economy) can be attributed to several potential factors. Areas with higher population densities often experience increased human activity, which may lead to a higher likelihood of fire incidents due to factors such as cooking, heating, and electrical usage [29]. Higher building densities can result in a higher concentration of potential fire hazards, such as electrical systems, heating appliances, and combustible materials, increasing the risk of fire incidents [55]. The secondary sector, which includes manufacturing and industrial activities, may contribute to fire risk due to the presence of industrial processes, machinery, and chemicals that can pose fire hazards [56]. These factors collectively contribute to the positive correlations observed between fire density and the mentioned variables, indicating that areas with higher population and building densities, as well as a larger proportion of industrial activities, are more susceptible to fire incidents.
Figure 5 illustrates the correlation coefficients between each factor. The findings of this study indicate potential correlations among population, economic, and building-related variables. The results reveal that population density (Factor 2) exhibits a strong correlation of 0.95 with the proportion of the population aged 65 and above (Factor 3), suggesting a higher proportion of elderly residents in Keelung City. Furthermore, population density (Factor 2) shows a notable correlation of 0.73 with the proportion of buildings over 40 years (Factor 7), implying that a majority of Keelung residents reside in aged buildings. Additionally, the proportion of the tertiary sector of the economy is typically associated with buildings over 40 years, with a correlation coefficient of 0.73 between the two variables.
This study subsequently utilizes OOB predictors to investigate variable importance, employing predictor importance estimates by permutation of OOB predictor observations for RF of classification trees. The analysis results are depicted in Figure 6. The findings indicate that, based on the OOB analysis, the permuted predictor importance of Factor 7 is also the highest among the ten analyzed factors, reaching a score of 0.66. Larger values indicate predictors that have a greater influence on predictions. In this case, Factor 7 (proportion of buildings over 40 years old) emerges as the most important predictor, followed by Factor 3 (proportion of elderly population).
If the “proportion of tertiary sector of the economy” increases, it could heighten the likelihood of fire incidents primarily due to a higher concentration of industrial and service-related activities. These activities may introduce additional fire hazards, such as machinery malfunctions, chemical storage, or electrical issues associated with manufacturing and service operations. Furthermore, an increase in the “proportion of elderly population” may contribute to an elevated risk of fire incidents. Areas with a higher proportion of elderly residents may encounter challenges related to fire safety, as this demographic group may have specific vulnerabilities.
By incorporating a multi-factorial approach, our algorithm employs the PCA and OOB analyses to recognize crucial components that account for the majority of the variance in the dataset, facilitating a comprehensive comprehension of human-caused fires.
4.2. Implication of the Identified Components
To examine the weights assigned to each variable in the dataset for each principal component, we delve into the analysis of component loading in PCA. The PCA component displays the component loading values, as depicted in Figure 7a. A total of 157 village datasets are represented by blue dots, with coordinates reflecting the score of each observation for the two principal components. All eleven variables are represented by red lines, with the direction and length of each line indicating the contribution of that variable to the two principal components.
The primary principal component, aligned along the horizontal axis, demonstrates positive coefficients for all nine variables, explaining why the vectors representing these variables point towards the right half of the plot. Notably, Factors 1, 3, 7, and 11 exhibit the most substantial coefficients in the first principal component, approximately greater than 0.3, while the component loadings for other factors are less than 0.3. On the vertical axis, the second principal component showcases positive coefficients for variables such as Factors 1, 6, 9, 10, and 11, along with negative coefficients for the remaining variables. In this study, the first principal component (PC1) accounts for 58% of the variance, while the second principal component (PC2) accounts for 13% of the variance. Together, PC1 and PC2 explain 71% of the total variance. This means that these two components capture 71% of the original variability present in the dataset.
This study further explores the correlation of these factors using FA. The FA results, as shown in Figure 7b, reveal the predicted factor scores obtained through FA. Results obtained demonstrate that population-related factors are positioned near the second-factor axis, while building-related factors are closely aligned with the first axis. This enhances the interpretation of these rotated factors as “quantitative ability” and “qualitative ability”. Instead of plotting the variables on different sets of rotated axes, an alternative approach is to overlay the rotated axes onto an unrotated biplot (as depicted in Figure 7b) to gain a clearer understanding of the relationship between the rotated and unrotated solutions.
The FA results suggest that villages with higher fire density tend to concentrate in areas with a higher proportion of tertiary sectors of the economy (first quadrants). In summary, while both PCA and FA are utilized for dimensionality reduction, PCA primarily focuses on summarizing variance, and its components may lack clear interpretations. On the other hand, FA aims to provide an explanatory model for observed correlations by identifying underlying latent factors with meaningful interpretations.
Subsequently, this study performs FA to explore the characteristics of these fire-related factors. A biplot of the eleven variables on the rotated factors demonstrates the effect of varimax rotation, as illustrated in Figure 8. Figure 8a indicates that Factors 2 to 5 are positioned closest to the first factor axis, while Factors 9 to 11 are nearest to the second axis. These two rotated factors are likely best interpreted as “population-related features” and “economic-related features”. Figure 8b,c yield similar results, demonstrating the advantages of FA, which introduces the concept of latent factors. The connection between latent factors is based on their shared objective of decreasing the number of variables while preserving significant information.
5. Discussion
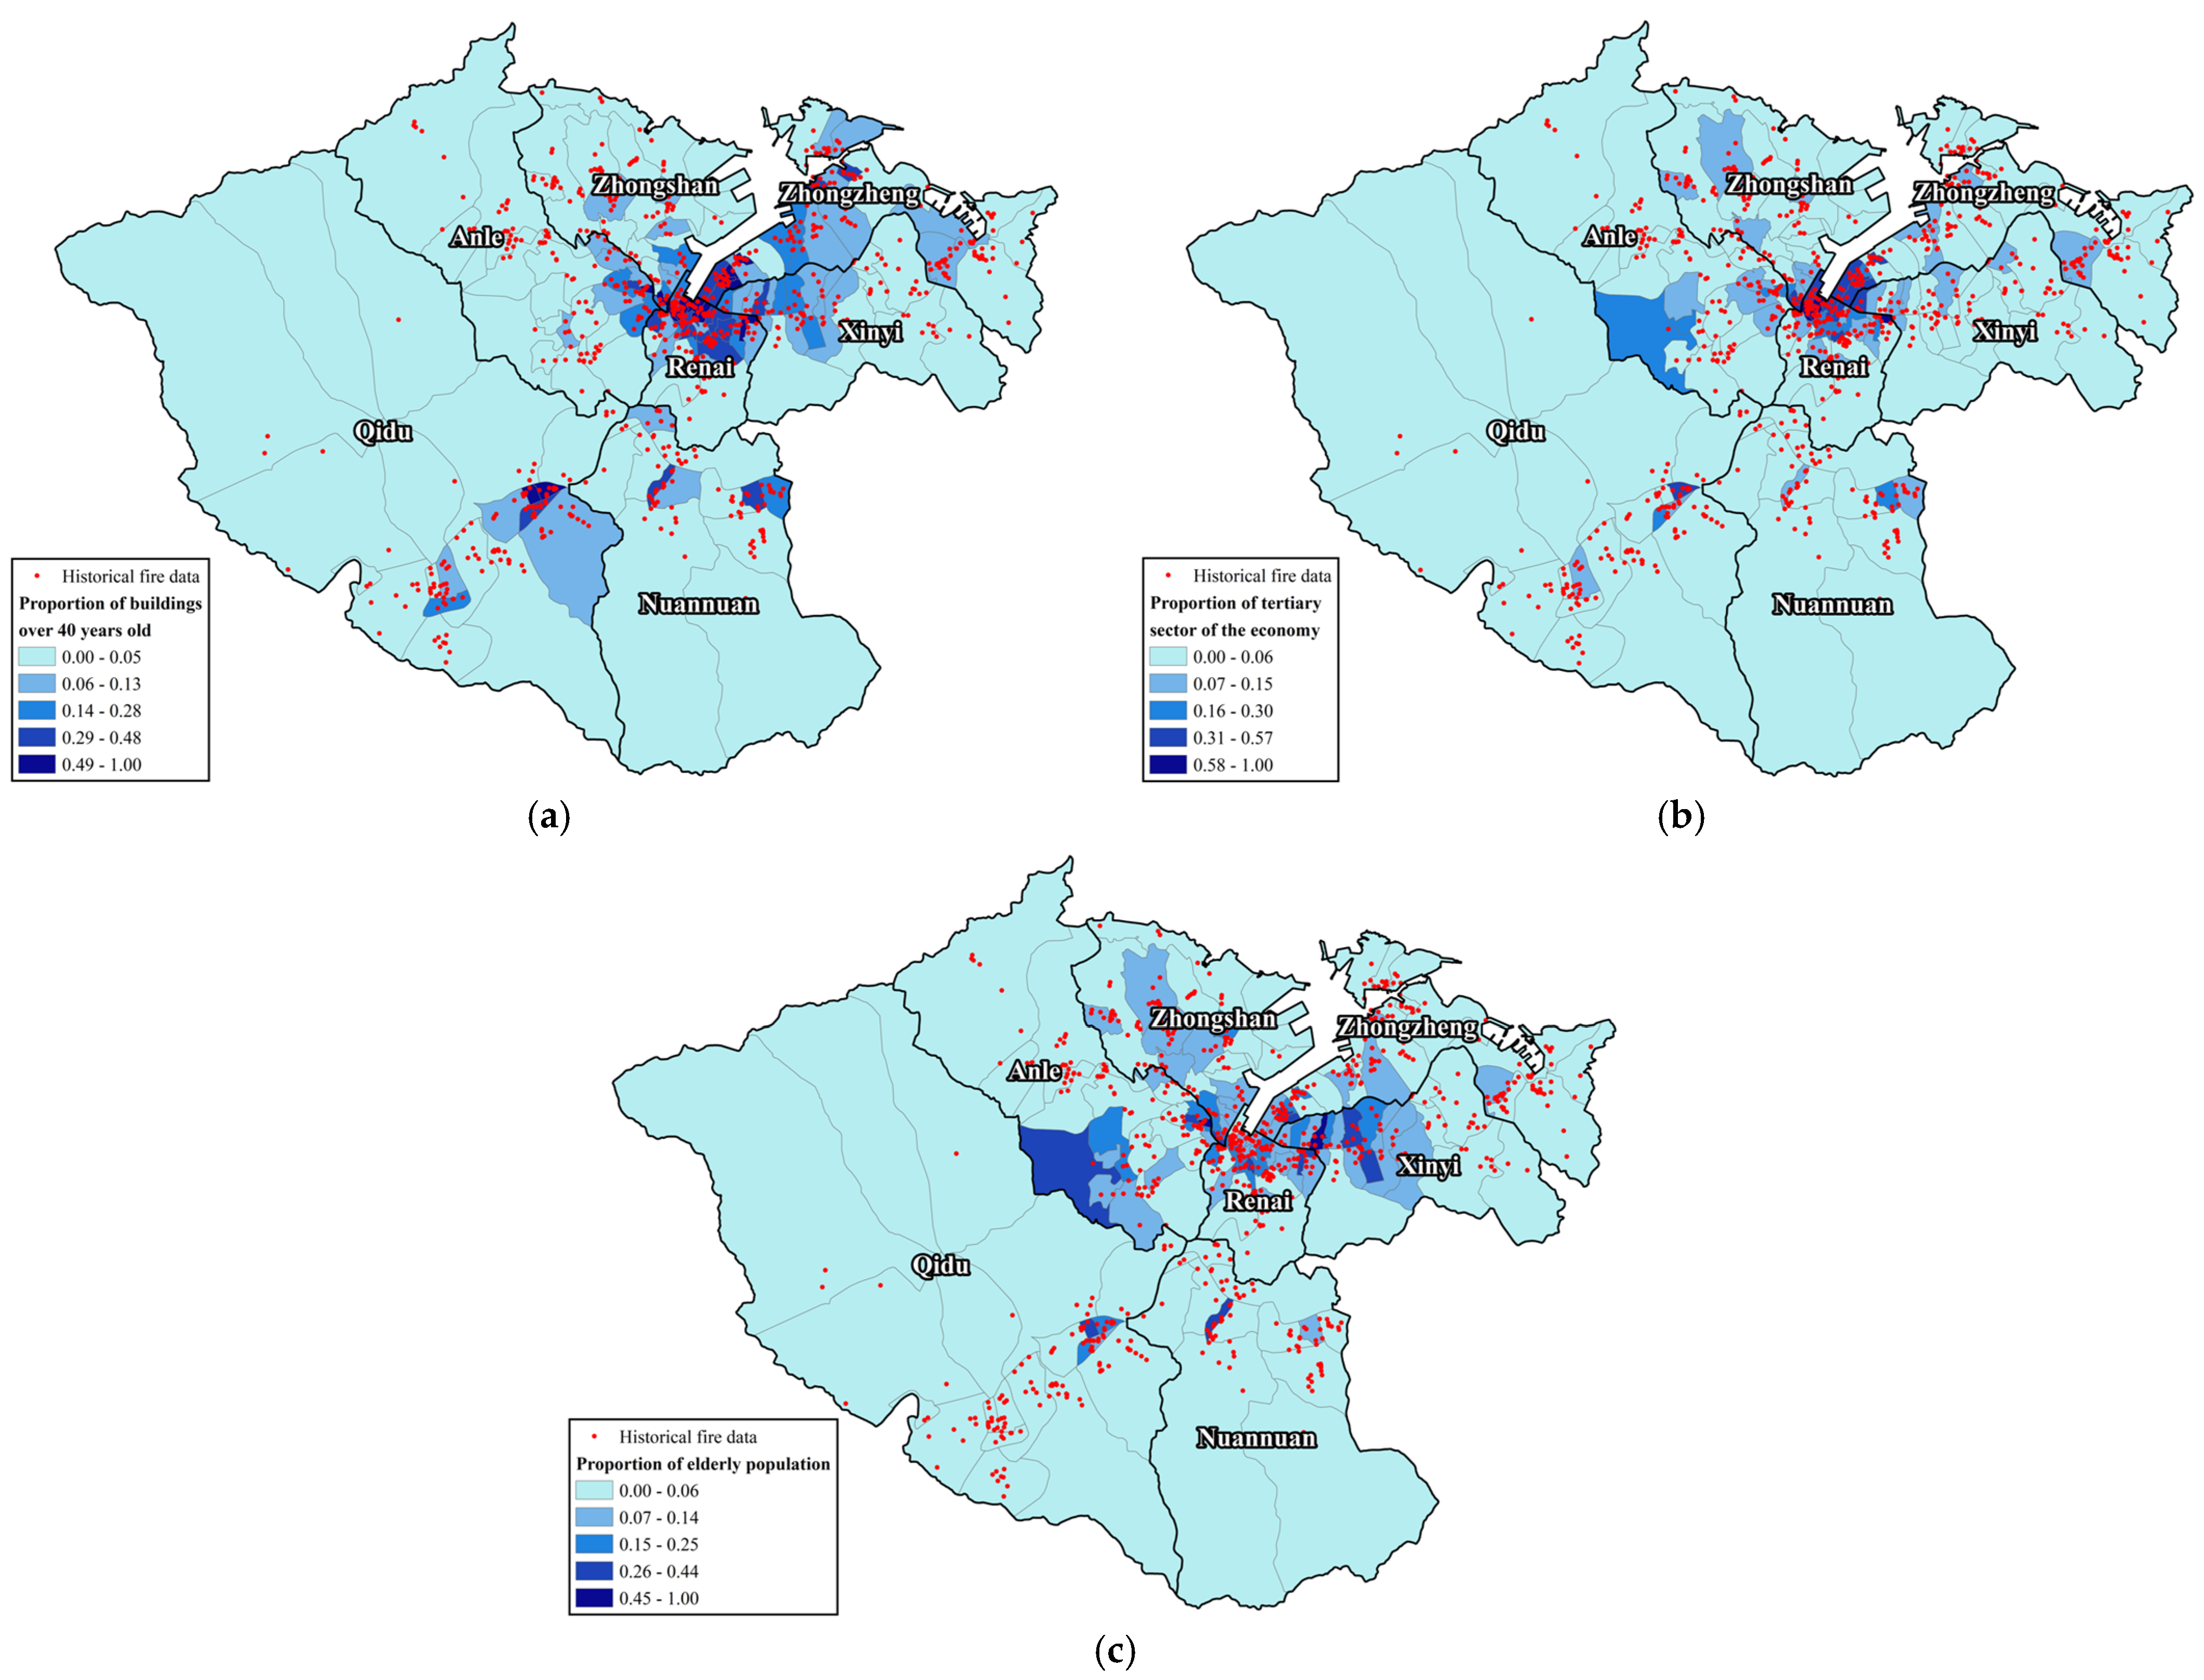
This study employs dimensionality reduction techniques including PCA, FA, and OOB predictor importance. Based on the findings of our study, a notable correlation is evident between human-caused fires in Keelung City and regions characterized by a greater prevalence of buildings aged over 40 years. After normalization, Factors 7 (proportion of buildings over 40 years old), 11 (proportion of tertiary sector of the economy), and 3 (proportion of elderly population), which are highly correlated with fires, are overlaid with the coordinates of historical fire disaster events, as illustrated in Figure 9.
From Figure 9, it is found that these three factors highly correlated with fires show a positive correlation with historical fire disaster events. Based on the findings of this study, the following strategies can be recommended to reduce the frequency of fire incidents, particularly in areas with the highest fire frequency:
- (1)
- Building Safety Upgrades: It is advisable to implement safety upgrade initiatives in areas characterized by densely populated and aging structures. This involves renovating electrical systems and maintaining older structures to enhance their fire resistance [57]. Additionally, prioritizing the inspection of older buildings is essential. Moreover, utilizing multi-sensor and information fusion technology for early detection and alarm systems in building fires can also help reduce the risk of fires [58]. Strengthening the monitoring and inspection of older buildings is crucial to ensure compliance with current fire safety standards and to encourage necessary renovations and enhancements.
- (2)
- Industrial Oversight: Several research findings indicate that effective fire safety measures encompass fire-related training, fire evacuation drills, functional fire alarms, establishment of fire emergency exits and escape plans, and knowledge of fire hazards [59,60,61]. In areas with a high density of tertiary sector activities, it is recommended to enforce stricter industrial regulations. This involves ensuring that businesses in these zones comply with fire prevention and emergency response regulations, thereby mitigating the risk of fires.
- (3)
- Elderly Population Safety: Risk factors such as reduced mobility, impaired cognitive ability, mental disorders, and smoking were observed among the elderly [62]. It is advisable to focus efforts on villages with a higher concentration of elderly residents. This includes raising awareness of fire safety, engaging in advocacy initiatives, and enhancing fire prevention measures in the living environments of the elderly.
This study recommends the implementation of the three aforementioned strategies, which may contribute to reducing the frequency of fire incidents and enhancing the overall fire resilience of the community. In this comprehensive exploration of factors influencing fire safety, our study addresses crucial elements such as the aging population, buildings exceeding 40 years, and the role of the tertiary sector in the economy. Building upon the findings of Karemaker et al. [12], we emphasize the heightened risk that the elderly population faces concerning domestic fires, highlighting the urgent need for targeted interventions to mitigate such risks in their homes. As underscored by Laban et al. [13], the age of the dwelling emerges as a critical factor amplifying the susceptibility to fire hazards. Their research signals that as houses age, the risk of fire incidents escalates, shedding light on a nuanced aspect of fire safety that demands attention.
Furthermore, our study delves into the socioeconomic dimension of fire safety, acknowledging the significance of socioeconomic factors as prominent predictors of fire rates at the neighborhood level [14]. Recognizing the impact of socioeconomic conditions on fire risks aligns with a growing body of literature emphasizing the complex interplay between economic factors and safety outcomes [12,13,14]. By incorporating these insights, our research aims to contribute to a more holistic understanding of the multifaceted determinants shaping fire safety outcomes within communities.
Through a synthesis of these factors and insights from the existing literature, our study seeks to provide a nuanced and comprehensive perspective on the interconnections between demographic shifts, structural aging, economic dynamics, and fire safety. The synthesis of these findings not only adds depth to our understanding of fire safety but also informs targeted strategies and policies aimed at reducing the incidence and impact of fires, ultimately fostering safer and more resilient communities.
6. Conclusions
In this article, we propose a novel approach for the analysis of human-caused fires using dimensionality reduction techniques including PCA, FA, and OOB predictor importance in Keelung city, Taiwan. By analyzing various aspects, valuable insights can be gained to enhance fire prevention and risk assessment strategies. Key findings are summarized as follows:
The multifaceted process that incorporates the application of a GIS includes geographical information about the area for various attribute data, which are digitized and input into the GIS as layers. We gathered historical fire data from the past 10 years, including the location, frequency, and type of fires. To investigate human-caused fires using PCA, FA, and OOB in Keelung City, Taiwan, this study collected ten potential influencing factors related to fire incidents. These factors encompass considerations such as building density, aging structures, aging population, and industrial patterns. The results of this study suggest a strong correlation between human-caused fires in Keelung City and areas characterized by a high proportion of buildings over 40 years old. Furthermore, significant correlations are observed, indicating an increased occurrence of fire incidents associated with the proportion of the tertiary sector of the economy and the proportion of the elderly population.
Based on the findings of this study, the following strategies are recommended to reduce the frequency of fire incidents, particularly in areas with the highest fire frequency: building safety upgrades, industrial oversight, and elderly population safety. It is hoped that the analytical results of this study can serve as a reference for relevant departments in effectively reducing fire incidents in the future.
Author Contributions
Design and composing the initial draft, C.-Y.K.; data curation and investigation, H.-C.L.; visualization, Y.-T.T.; methodology, writing and editing, C.-Y.L. All authors have read and agreed to the published version of the manuscript.
Funding
This study received no external funding.
Institutional Review Board Statement
Not applicable.
Informed Consent Statement
Not applicable.
Data Availability Statement
Relevant data related to this study can be obtained by contacting the corresponding author (C.-Y.L.) upon request. The data are not publicly available due to privacy.
Conflicts of Interest
All authors of this article declare no conflicts of interest.
References
- Duarte, L.; Teodoro, A.C. An easy, accurate and efficient procedure to create Forest Fire Risk Maps using Modeler (SEXTANTE plugin). J. For. Res. 2016, 27, 1361–1372. [Google Scholar] [CrossRef]
- Jiménez-Ruano, A.; Rodrigues Mimbrero, M.; de la Riva Fernández, J. Exploring spatial–temporal dynamics of fire regime features in mainland Spain. Nat. Hazards Earth Syst. Sci. 2017, 17, 1697–1711. [Google Scholar] [CrossRef]
- Himoto, K. Comparative analysis of post-earthquake fires in Japan from 1995 to 2017. Fire Technol. 2019, 55, 935–961. [Google Scholar] [CrossRef]
- Lee, C.A.; Sung, Y.C.; Lin, Y.S.; Hsiao GL, K. Evaluating the severity of building fires with the analytical hierarchy process, big data analysis, and remote sensing. Nat. Hazards 2020, 103, 1843–1856. [Google Scholar] [CrossRef]
- Sakellariou, S.; Parisien, M.A.; Flannigan, M.; Wang, X.; de Groot, B.; Tampekis, S.; Christopoulou, O. Spatial planning of fire-agency stations as a function of wildfire likelihood in Thasos, Greece. Sci. Total Environ. 2020, 729, 139004. [Google Scholar] [CrossRef] [PubMed]
- Fernandez-Anez, N.; Krasovskiy, A.; Müller, M.; Vacik, H.; Baetens, J.; Hukić, E.; Solomun, M.K.; Atanassova, I.; Glushkova, M.; Bogunović, I.; et al. Current wildland fire patterns and challenges in Europe: A synthesis of national perspectives. Air Soil Water Res. 2021, 14, 11786221211028185. [Google Scholar] [CrossRef]
- McDonough, L.K.; Treble, P.C.; Baker, A.; Borsato, A.; Frisia, S.; Nagra, G.; Paterson, D. Past fires and post-fire impacts reconstructed from a southwest Australian stalagmite. Geochim. Cosmochim. Acta 2022, 325, 258–277. [Google Scholar] [CrossRef]
- Huang, H.; Lin, C.; Wang, S.; Su, C.; Chen, L. Stack effects in tall building fires: A case study of Taiwan old apartment fire. Sci. Rep. 2022, 12, 8963. [Google Scholar] [CrossRef]
- Chang, R.H.; Tso, Y.E.; Lin, C.H.; Kwesell, A. Challenges to the Fire Service–Centric Emergency Management System. Nat. Hazards Rev. 2022, 23, 05021017. [Google Scholar] [CrossRef]
- Pivello, V.R.; Vieira, I.; Christianini, A.V.; Ribeiro, D.B.; da Silva Menezes, L.; Berlinck, C.N.; Overbeck, G.E. Understanding Brazil’s catastrophic fires: Causes, consequences and policy needed to prevent future tragedies. Perspect. Ecol. Conserv. 2021, 19, 233–255. [Google Scholar] [CrossRef]
- Cassidy, P.; McConnell, N.; Boyce, K. The older adult: Associated fire risks and current challenges for the development of future fire safety intervention strategies. Fire Mater. 2021, 45, 553–563. [Google Scholar] [CrossRef]
- Karemaker, M.; Ten Hoor, G.A.; Hagen, R.R.; van Schie, C.H.; Boersma, K.; Ruiter, R.A. Elderly about home fire safety: A qualitative study into home fire safety knowledge and behaviour. Fire Saf. J. 2021, 124, 103391. [Google Scholar] [CrossRef]
- Laban, M.; Milanko, V.; Kočetov Mišulić, T.; Draganić, S. Fire statistics and risk analysis in wooden building structures in Serbia. Int. Wood Prod. J. 2017, 8, 62–70. [Google Scholar] [CrossRef]
- Federal Emergency Management Agency. Socioeconomic Factors and the Incidence of Fire; Federal Emergency Management Agency: Washington, DC, USA, 1997. [Google Scholar]
- National Fire Agency, Ministry of the Interior, Taiwan. Analysis of National Fire Statistics for the Year; Ministry of the Interior: New Taipei City, Taiwan, 2021. [Google Scholar]
- Keelung City Fire Bureau. Overview of Fire Statistical Analysis in Keelung City for the Year; Keelung City Fire Bureau: Keelung City, Taiwan, 2021. [Google Scholar]
- National Fire Agency, Ministry of the Interior. Available online: https://www.nfa.gov.tw/cht/index.php?code=list&ids=220 (accessed on 1 November 2023). (In Chinese)
- Keelung City Fire Bureau. Available online: https://www.klfd.klcg.gov.tw/en/klfd2 (accessed on 1 November 2023). (In Chinese)
- Zhao, X.; Guo, J.; Nie, F.; Chen, L.; Li, Z.; Zhang, H. Joint principal component and discriminant analysis for dimensionality reduction. IEEE Trans. Neural Netw. Learn. Syst. 2019, 31, 433–444. [Google Scholar] [CrossRef] [PubMed]
- Tsutsumida, N.; Murakami, D.; Yoshida, T.; Nakaya, T.; Lu, B.; Harris, P. Geographically Weighted Non-negative Principal Components Analysis for Exploring Spatial Variation in Multidimensional Composite Index. GeoComputation 2019, 2019. [Google Scholar]
- Acal, C.; Aguilera, A.M.; Escabias, M. New modeling approaches based on varimax rotation of functional principal components. Mathematics 2020, 8, 2085. [Google Scholar] [CrossRef]
- Hasan BM, S.; Abdulazeez, A.M. A review of principal component analysis algorithm for dimensionality reduction. J. Soft Comput. Data Min. 2021, 2, 20–30. [Google Scholar]
- Jiménez-Ruano, A.; Mimbrero, M.R.; de la Riva Fernández, J. Understanding wildfires in mainland Spain. A comprehensive analysis of fire regime features in a climate-human context. Appl. Geogr. 2017, 89, 100–111. [Google Scholar] [CrossRef]
- San-Miguel, I.; Coops, N.C.; Chavardès, R.D.; Andison, D.W.; Pickell, P.D. What controls fire spatial patterns? Predictability of fire characteristics in the Canadian boreal plains ecozone. Ecosphere 2020, 11, e02985. [Google Scholar] [CrossRef]
- Daşdemir, İ.; Aydın, F.; Ertuğrul, M. Factors affecting the behavior of large forest fires in Turkey. Environ. Manag. 2021, 67, 162–175. [Google Scholar] [CrossRef] [PubMed]
- Fréjaville, T.; Curt, T. Spatiotemporal patterns of changes in fire regime and climate: Defining the pyroclimates of south-eastern France (Mediterranean Basin). Clim. Chang. 2015, 129, 239–251. [Google Scholar] [CrossRef]
- Zerbe, K.; Polit, C.; McClain, S.; Cook, T. Optimized hot spot and directional distribution analyses characterize the spatiotemporal variation of large wildfires in Washington, USA, 1970–2020. Int. J. Disaster Risk Sci. 2022, 13, 139–150. [Google Scholar] [CrossRef]
- Kaufman, M.M.; Rosencrants, T. GIS method for characterizing fire flow capacity. Fire Saf. J. 2015, 72, 25–32. [Google Scholar] [CrossRef]
- Nyimbili, P.H.; Erden, T. GIS-based fuzzy multi-criteria approach for optimal site selection of fire stations in Istanbul, Turkey. Soc.-Econ. Plan. Sci. 2020, 71, 100860. [Google Scholar] [CrossRef]
- Truong, T.X.; Nhu, V.H.; Phuong DT, N.; Nghi, L.T.; Hung, N.N.; Hoa, P.V.; Bui, D.T. A New Approach Based on TensorFlow Deep Neural Networks with ADAM Optimizer and GIS for Spatial Prediction of Forest Fire Danger in Tropical Areas. Remote Sens. 2023, 15, 3458. [Google Scholar] [CrossRef]
- Elhag, M.; Yimaz, N.; Bahrawi, J.; Boteva, S. Evaluation of optical remote sensing data in burned areas mapping of Thasos Island, Greece. Earth Syst. Environ. 2020, 4, 813–826. [Google Scholar] [CrossRef]
- Annas, S.; Kanai, T.; Koyama, S. Principal component analysis and self-organizing map for visualizing and classifying fire risks in forest regions. Agric. Inf. Res. 2007, 16, 44–51. [Google Scholar] [CrossRef]
- Marinho AA, R.; de Gois, G.; de Oliveira-Júnior, J.F.; Correia Filho WL, F.; de Barros Santiago, D.; da Silva Junior, C.A.; Rogério, J.P. Temporal record and spatial distribution of fire foci in State of Minas Gerais, Brazil. J. Environ. Manag. 2021, 280, 111707. [Google Scholar] [CrossRef] [PubMed]
- Rodrigues, M.; Jiménez-Ruano, A.; de la Riva, J. Fire regime dynamics in mainland Spain. Part, 1: Drivers of change. Sci. Total Environ. 2020, 721, 135841. [Google Scholar] [CrossRef]
- Van Pham, T.; Do TA, T.; Tran, H.D.; Do AN, T. Assessing the impact of ecological security and forest fire susceptibility on carbon stocks in Bo Trach district, Quang Binh province, Vietnam. Ecol. Inform. 2023, 74, 101962. [Google Scholar] [CrossRef]
- Fatricia, R.S.; Daryanto, A.; Sutanto, J. Developing and validating a scale for anxiety over land and forest fire. Int. J. Disaster Risk Reduct. 2023, 95, 103850. [Google Scholar] [CrossRef]
- Khan, Z.; Gul, N.; Faiz, N.; Gul, A.; Adler, W.; Lausen, B. Optimal trees selection for classification via out-of-bag assessment and sub-bagging. IEEE Access 2021, 9, 28591–28607. [Google Scholar] [CrossRef]
- Goretzko, D.; Ruscio, J. The comparison data forest: A new comparison data approach to determine the number of factors in exploratory factor analysis. Behav. Res. Methods 2023, 1–14. [Google Scholar] [CrossRef] [PubMed]
- Hindle, B.J.; Rees, M.; Sheppard, A.W.; Quintana-Ascencio, P.F.; Menges, E.S.; Childs, D.Z. Exploring population responses to environmental change when there is never enough data: A factor analytic approach. Methods Ecol. Evol. 2018, 9, 2283–2293. [Google Scholar] [CrossRef]
- Genuer, R.; Poggi, J.M.; Tuleau-Malot, C.; Villa-Vialaneix, N. Random forests for big data. Big Data Res. 2017, 9, 28–46. [Google Scholar] [CrossRef]
- Gale, M.G.; Cary, G.J.; Van Dijk, A.I.; Yebra, M. Untangling fuel, weather and management effects on fire severity: Insights from large-sample LiDAR remote sensing analysis of conditions preceding the 2019–2020 Australian wildfires. J. Environ. Manag. 2023, 348, 119474. [Google Scholar] [CrossRef]
- Wall, W.A.; Hohmann, M.G.; Just, M.G.; Hoffmann, W.A. Characterizing past fire occurrence in longleaf pine ecosystems with the Mid-Infrared Burn Index and a Random Forest classifier. For. Ecol. Manag. 2021, 500, 119635. [Google Scholar] [CrossRef]
- Department of Civil Affairs, Keelung City Government. Available online: https://www.klcg.gov.tw/tw/civil (accessed on 1 November 2023). (In Chinese)
- Nowak, M.M.; Dziób, K.; Ludwisiak, Ł.; Chmiel, J. Mobile GIS applications for environmental field surveys: A state of the art. Glob. Ecol. Conserv. 2020, 23, e01089. [Google Scholar] [CrossRef]
- Oyinna, B.; Okedu, K.E.; Diemuodeke, O.E.; David, L.E.; Negedu, I.O.; Osemudiamen, E.A.; Kalam, A. Assessing small hydropower sites in Nigeria for sustainable development using ArcGIS. Energy Rep. 2023, 10, 2889–2898. [Google Scholar] [CrossRef]
- Department of Social Affairs, Keelung City Government. Available online: https://www.klcg.gov.tw/tw/social (accessed on 1 November 2023). (In Chinese)
- Department of Urban Development, Keelung City Government. Available online: https://www.klcg.gov.tw/tw/urban (accessed on 1 November 2023). (In Chinese)
- Department of Economic Affairs, Keelung City Government. Available online: https://www.klcg.gov.tw/en/klcg2/3285-128527.html (accessed on 1 November 2023). (In Chinese)
- World Health Organization. World Report on Ageing and Health; World Health Organization: Geneva, Switzerland, 2015. [Google Scholar]
- Mutmainnah, W.; Bowo, L.P.; Nurwahyudy, A.; Prasetyo, F.A.; Furusho, M. Causative factor analysis of passenger ship accident (Fire/Explosion) in Indonesia. In IOP Conference Series: Earth and Environmental Science; IOP Publishing: Bristol, UK, 2020; Volume 1, p. 012037. [Google Scholar]
- Moler, C.; Little, J. A history of MATLAB (Matrix Laboratory). In Proceedings of the ACM on Programming Languages, 4(HOPL); Association for Computing Machinery: New York, NY, USA, 2020; pp. 1–67. [Google Scholar]
- Ahmadi, M.T.; Aghakouchak, A.A.; Mirghaderi, R.; Tahouni, S.; Garivani, S.; Shahmari, A.; Epackachi, S. Collapse of the 16-story Plasco building in Tehran due to fire. Fire Technol. 2020, 56, 769–799. [Google Scholar] [CrossRef]
- Farinha, J.; Cunha, L.; Dimuccio, L.A. Exploratory Spatial Analysis of Social Vulnerability and Forest Fire Risk in the Pinhal Interior Sul (Central Portugal). Sustainability 2022, 14, 3010. [Google Scholar] [CrossRef]
- Garcia-Castillo, E.; Paya-Zaforteza, I.; Hospitaler, A. Fire in heritage and historic buildings, a major challenge for the 21st century. Dev. Built Environ. 2023, 13, 100102. [Google Scholar] [CrossRef]
- Gupta, V.; Hidalgo, J.P.; Lange, D.; Cowlard, A.; Abecassis-Empis, C.; Torero, J.L. A review and analysis of the thermal exposure in large compartment fire experiments. Int. J. High-Rise Build. 2021, 10, 345–364. [Google Scholar]
- Chen, C.; Reniers, G.; Khakzad, N. A thorough classification and discussion of approaches for modeling and managing domino effects in the process industries. Saf. Sci. 2020, 125, 104618. [Google Scholar] [CrossRef]
- Rush, D.; Bankoff, G.; Cooper-Knock, S.J.; Gibson, L.; Hirst, L.; Jordan, S.; Walls, R.S. Fire risk reduction on the margins of an urbanizing world. Disaster Prev. Manag. Int. J. 2020, 29, 747–760. [Google Scholar] [CrossRef]
- Ren, X.; Li, C.; Ma, X.; Chen, F.; Wang, H.; Sharma, A.; Masud, M. Design of multi-information fusion based intelligent electrical fire detection system for green buildings. Sustainability 2021, 13, 3405. [Google Scholar] [CrossRef]
- Kurata, Y.B.; Ong AK, S.; Prasetyo, Y.T.; Dizon, R.M.; Persada, S.F.; Nadlifatin, R. Determining factors affecting perceived effectiveness among filipinos for fire prevention preparedness in the national capital region, Philippines: Integrating protection motivation theory and extended theory of planned behavior. Int. J. Disaster Risk Reduct. 2023, 85, 103497. [Google Scholar] [CrossRef]
- Ding, L.; Khan, F.; Ji, J. Risk-based safety measure allocation to prevent and mitigate storage fire hazards. Process Saf. Environ. Prot. 2020, 135, 282–293. [Google Scholar] [CrossRef]
- Wunder, S.; Calkin, D.E.; Charlton, V.; Feder, S.; de Arano, I.M.; Moore, P.; Vega-García, C. Resilient landscapes to prevent catastrophic forest fires: Socioeconomic insights towards a new paradigm. For. Policy Econ. 2021, 128, 102458. [Google Scholar] [CrossRef]
- Steen-Hansen, A.; Storesund, K.; Sesseng, C. Learning from fire investigations and research–A Norwegian perspective on moving from a reactive to a proactive fire safety management. Fire Saf. J. 2021, 120, 103047. [Google Scholar] [CrossRef]
Figure 1.
Location of study area and fire incidents over the past decade: (a) Location of Keelung City; (b) Location of fire incidents over the past decade in Keelung City.
Figure 1.
Location of study area and fire incidents over the past decade: (a) Location of Keelung City; (b) Location of fire incidents over the past decade in Keelung City.
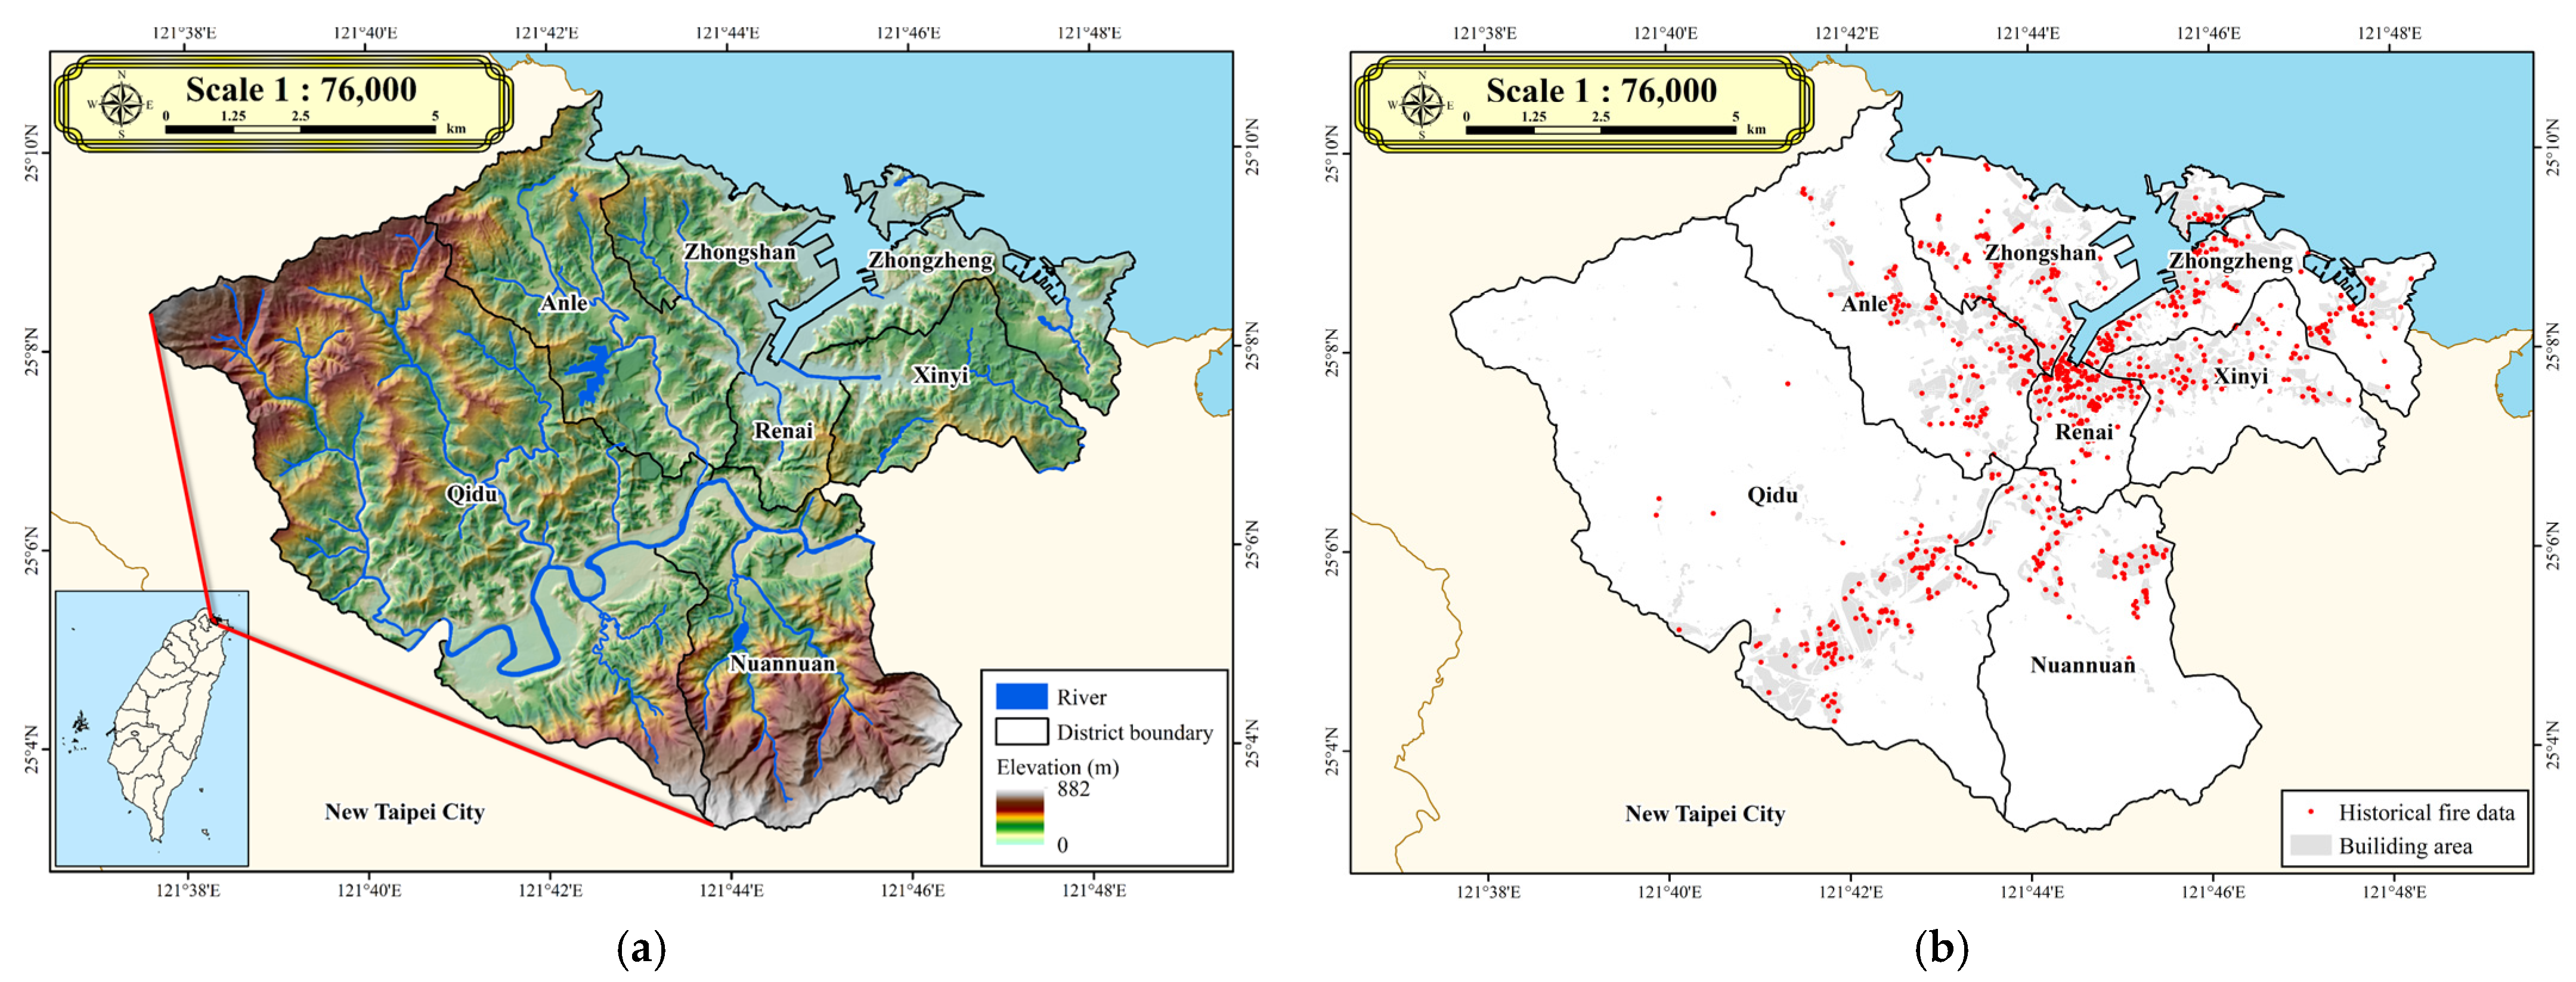
Figure 2.
GIS variables for various fire incident factors. (a) Fire density (number of fires/m2); (b) Population density (number of population/m2); (c) Proportion of elderly population (number of elderly/m2); (d) Proportion of elderly living alone population (number of elderly living alone/m2); (e) Proportion of young age population (number of young people/m2); (f) Building density (number of buildings/m2); (g) Proportion of buildings over 40 years old (number of buildings over 40 years old/m2); (h) Proportion of non-RC buildings (number of non-RC buildings/m2); (i) Proportion of first sector of the economy (number of first sector of the economy/m2); (j) Proportion of secondary sector of the economy (number of secondary sector of the economy/m2); (k) Proportion of tertiary sector of the economy (number of tertiary sector of the economy/m2).
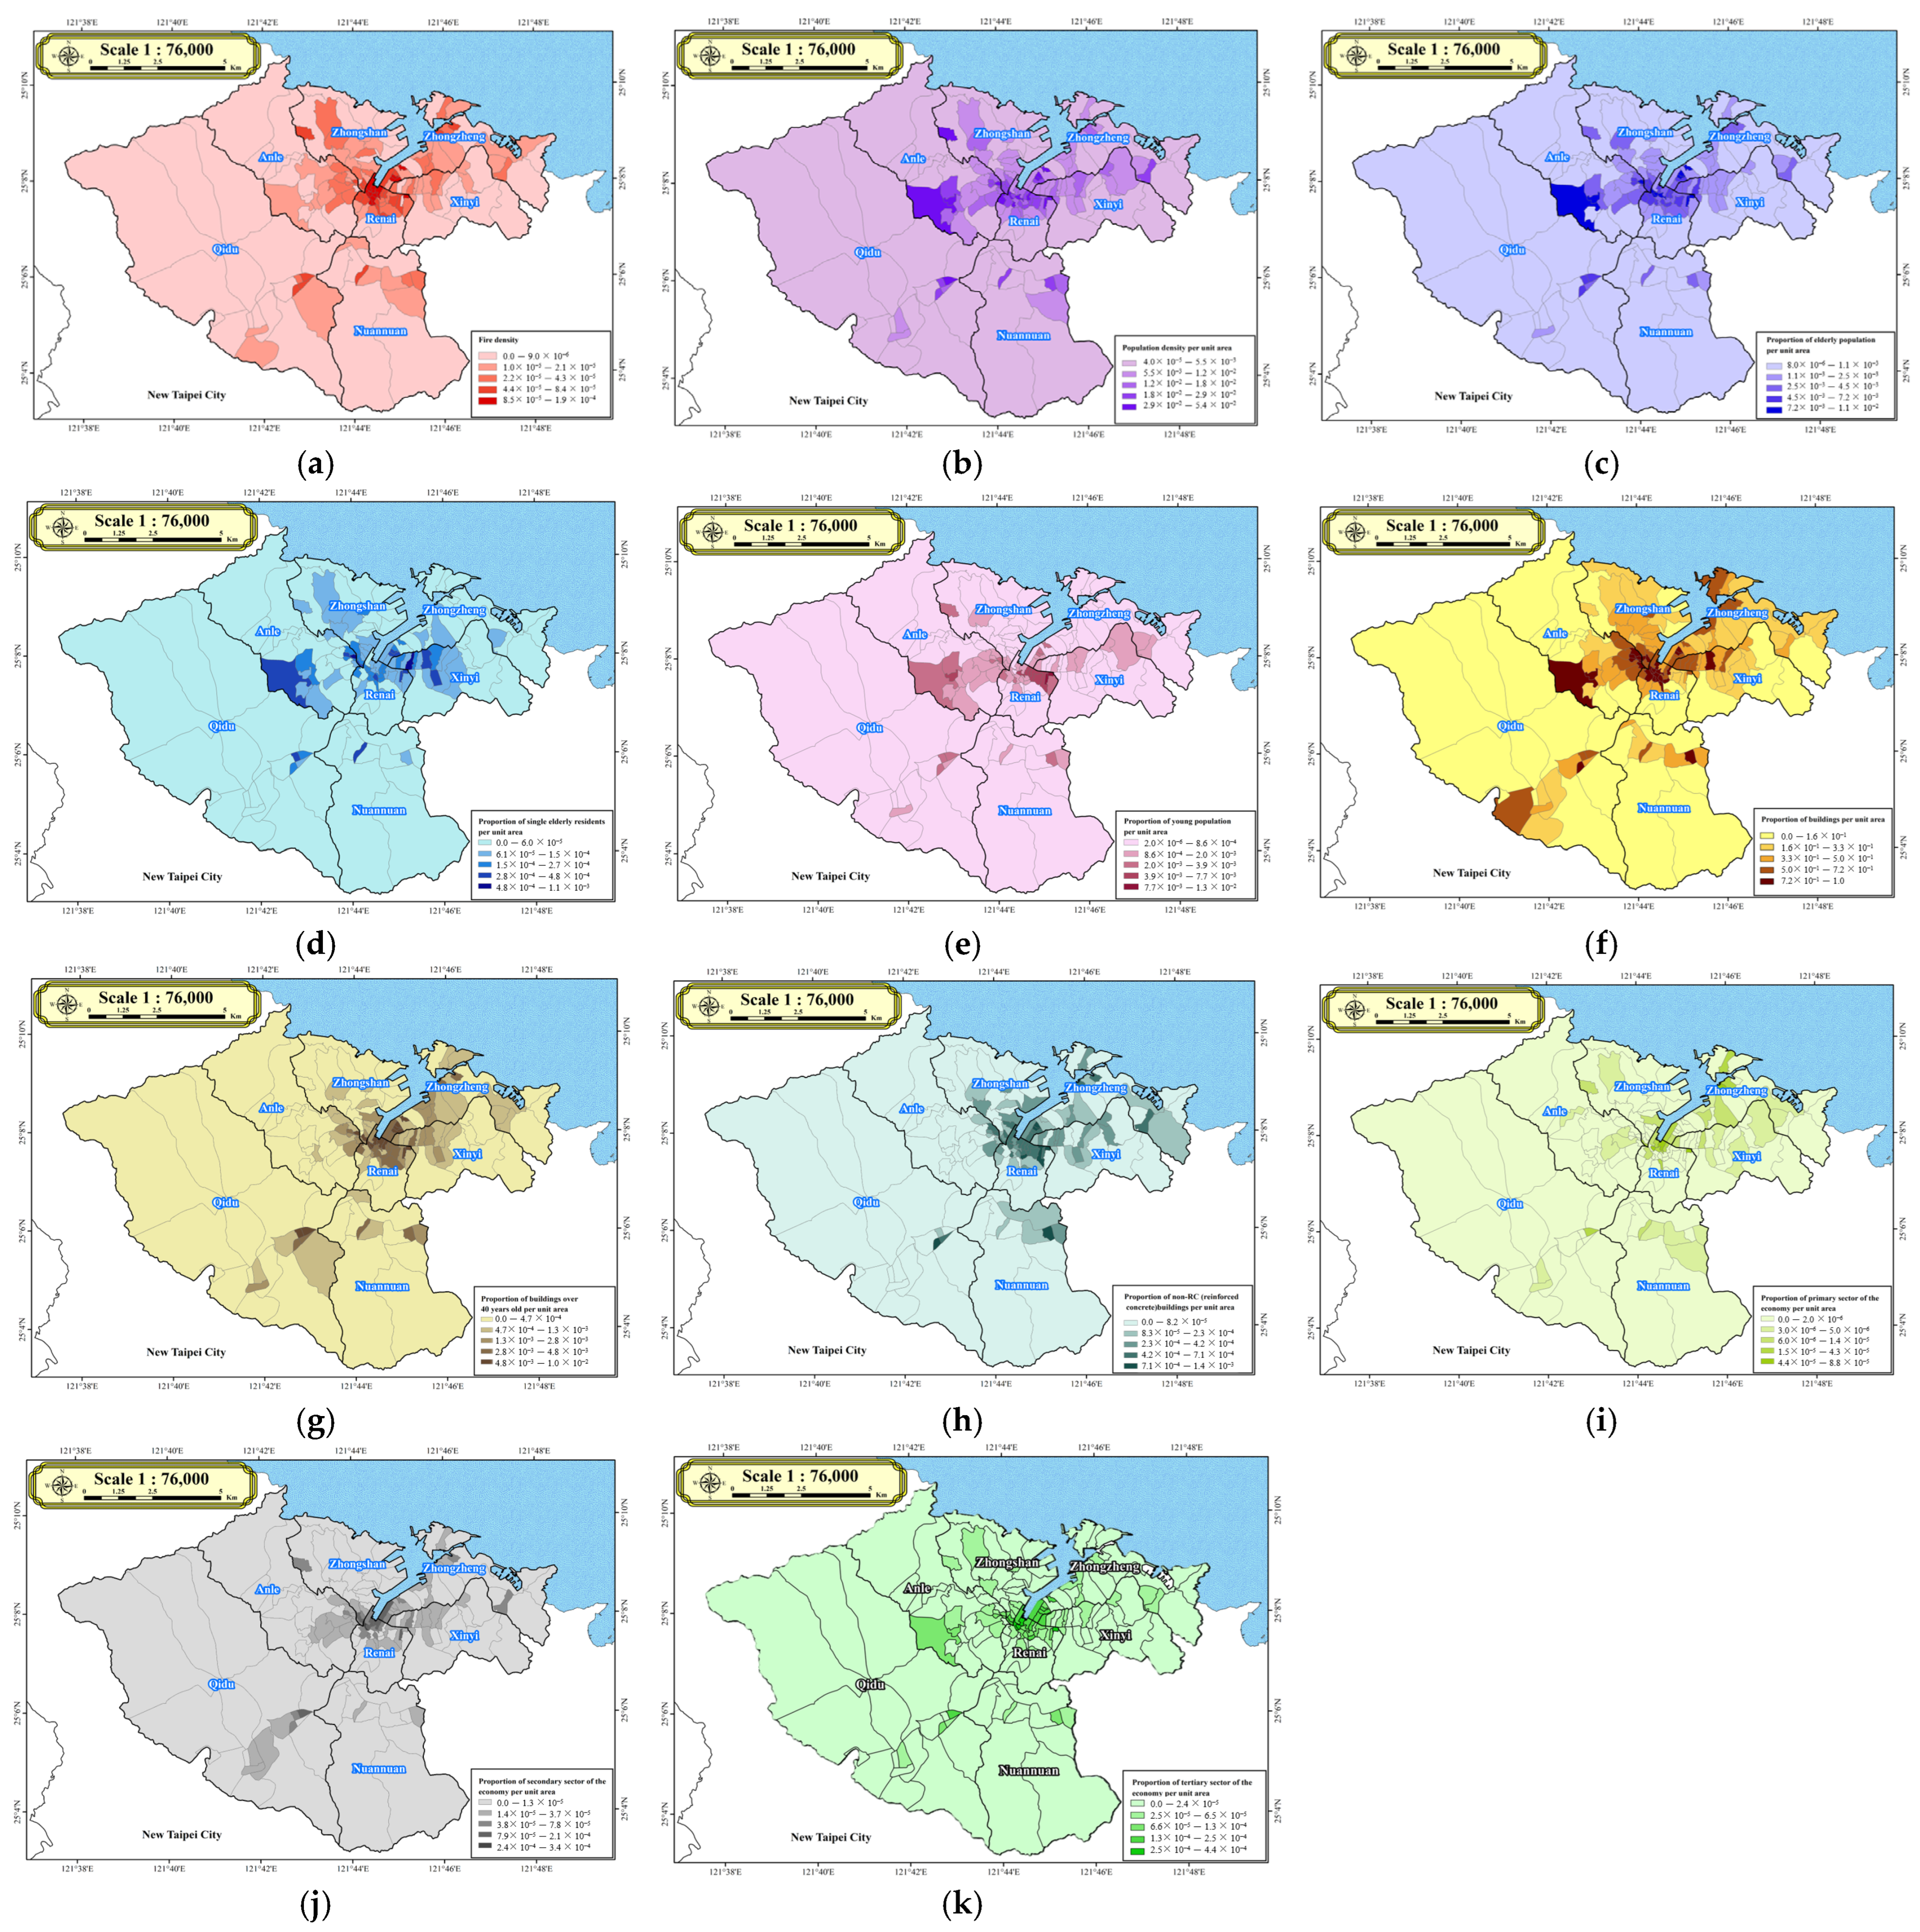
Figure 3.
The schematic flowchart diagram illustrating the process of this study.
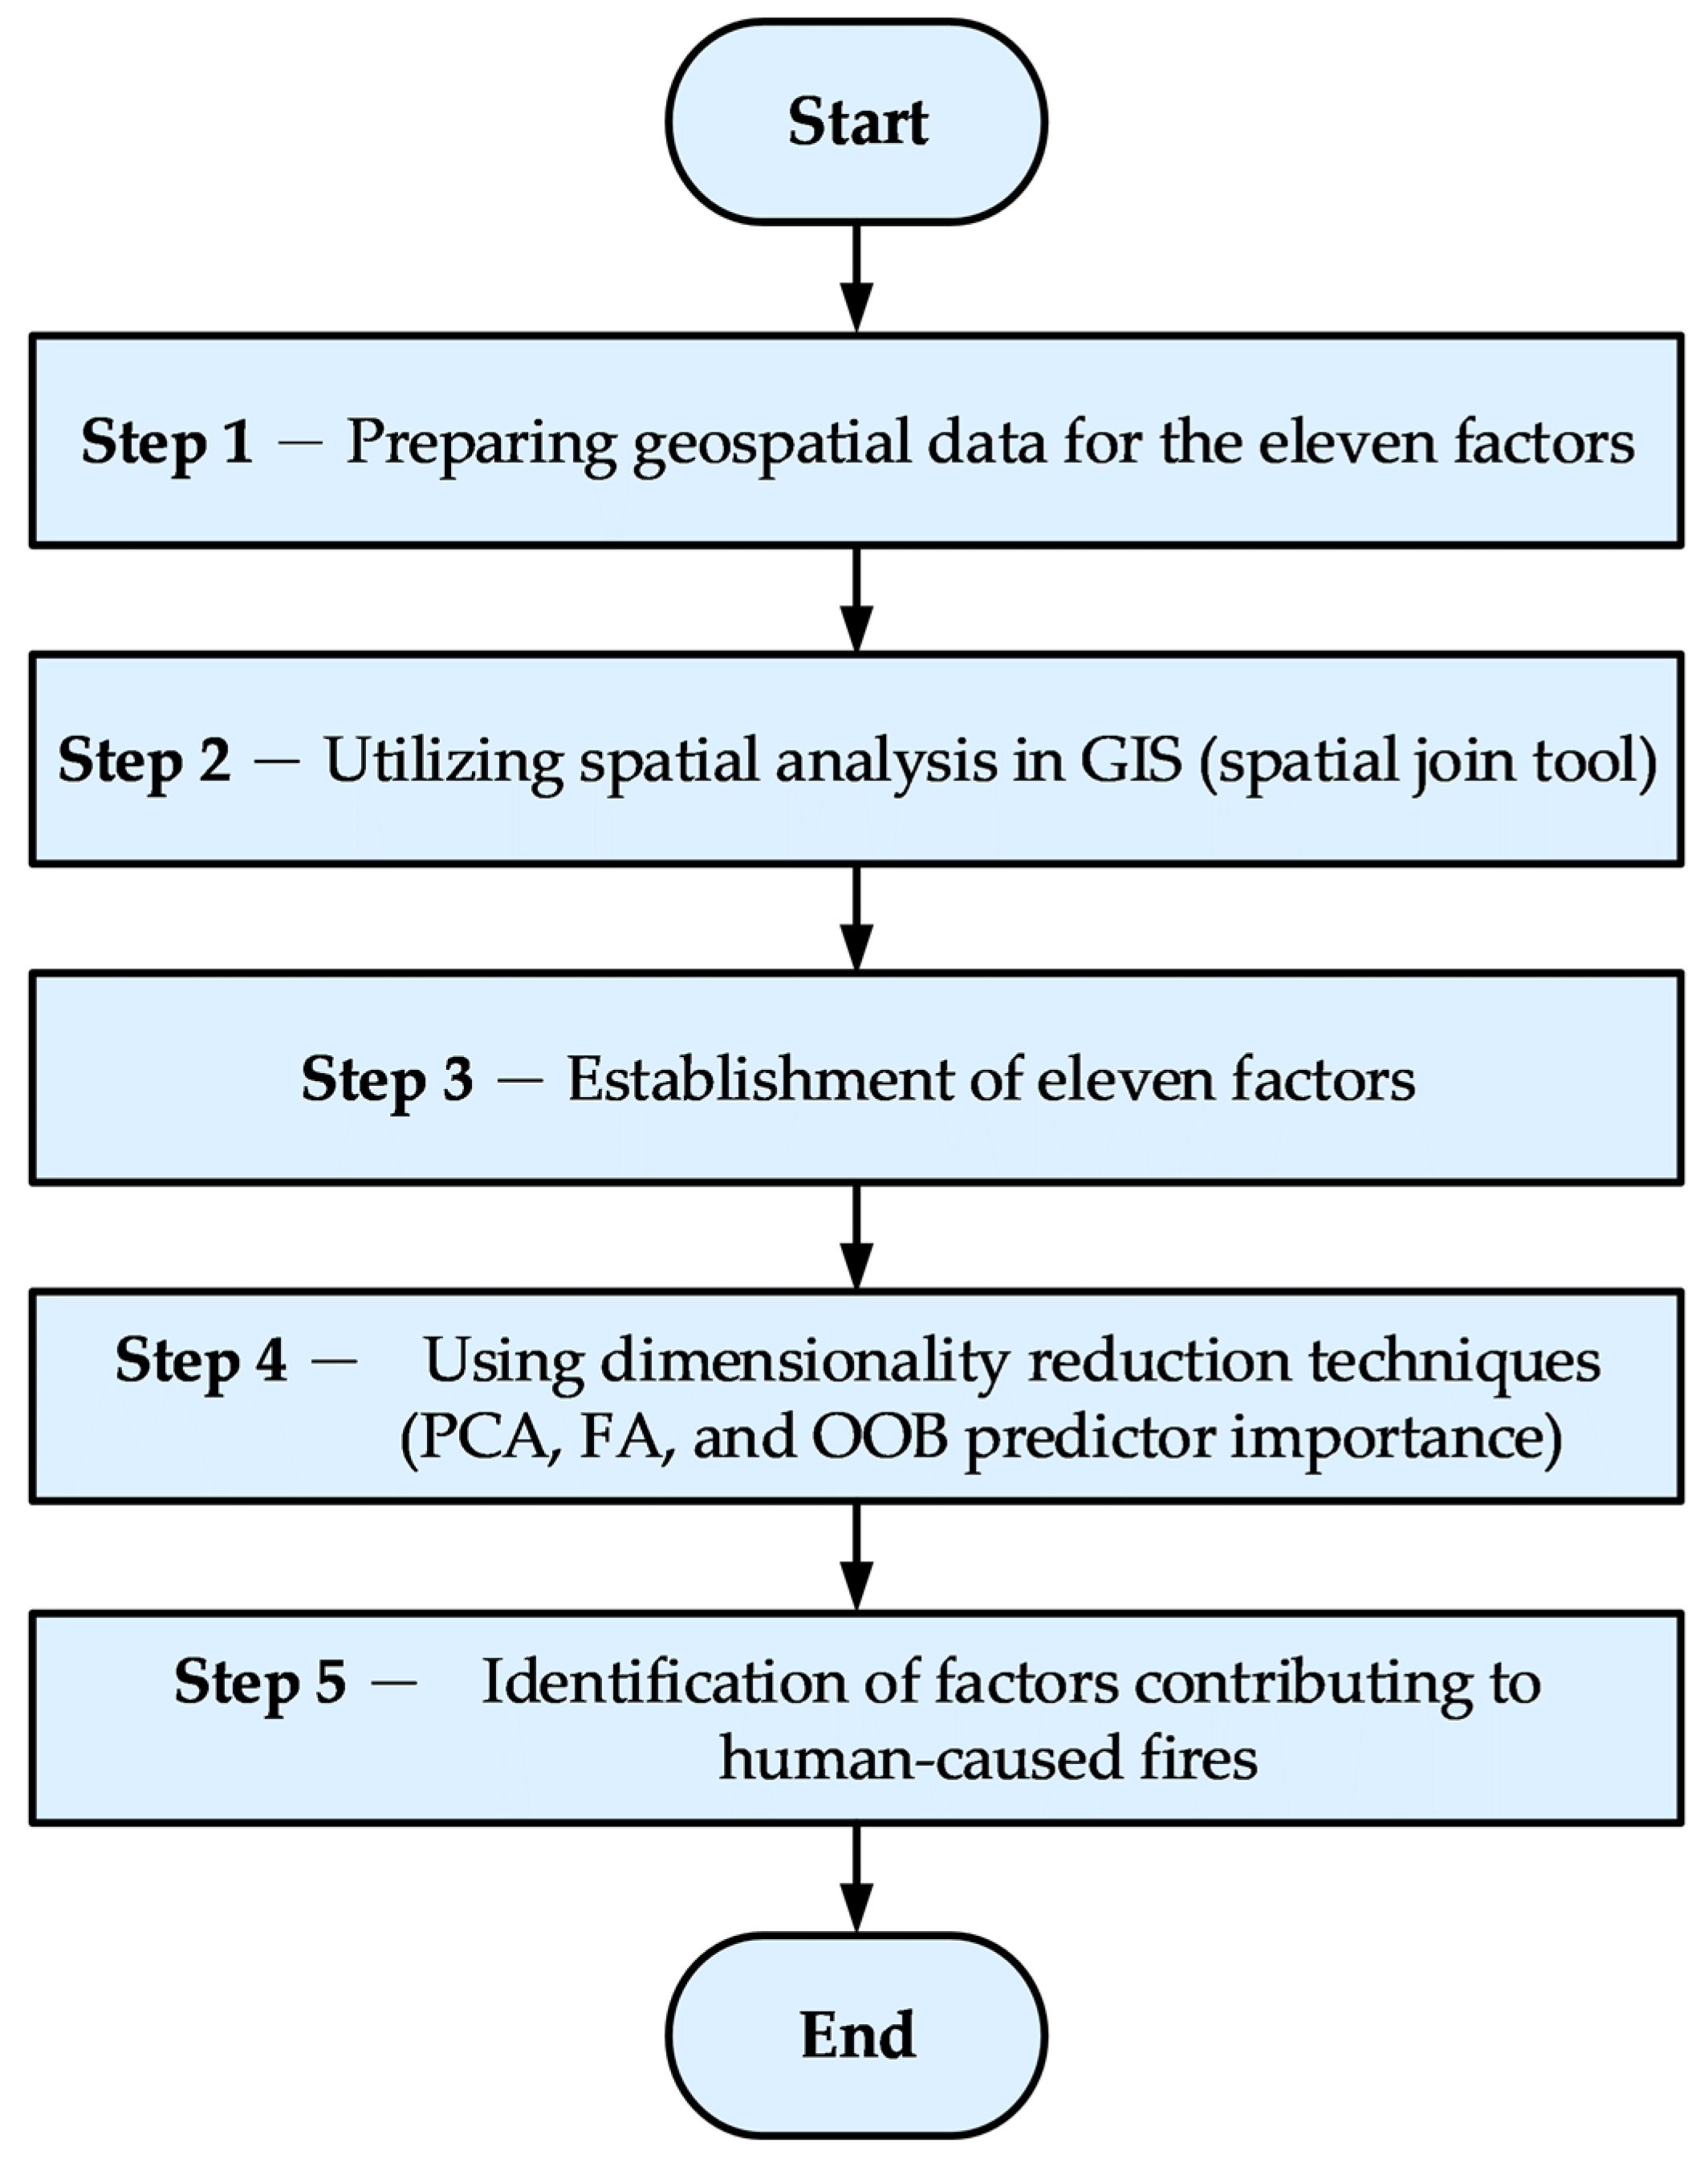
Figure 4.
Correlation coefficients of potential fire factors with fire (red color represents correlation coefficients greater than 0.7, gray color represents correlation coefficient less than 0.7).
Figure 4.
Correlation coefficients of potential fire factors with fire (red color represents correlation coefficients greater than 0.7, gray color represents correlation coefficient less than 0.7).
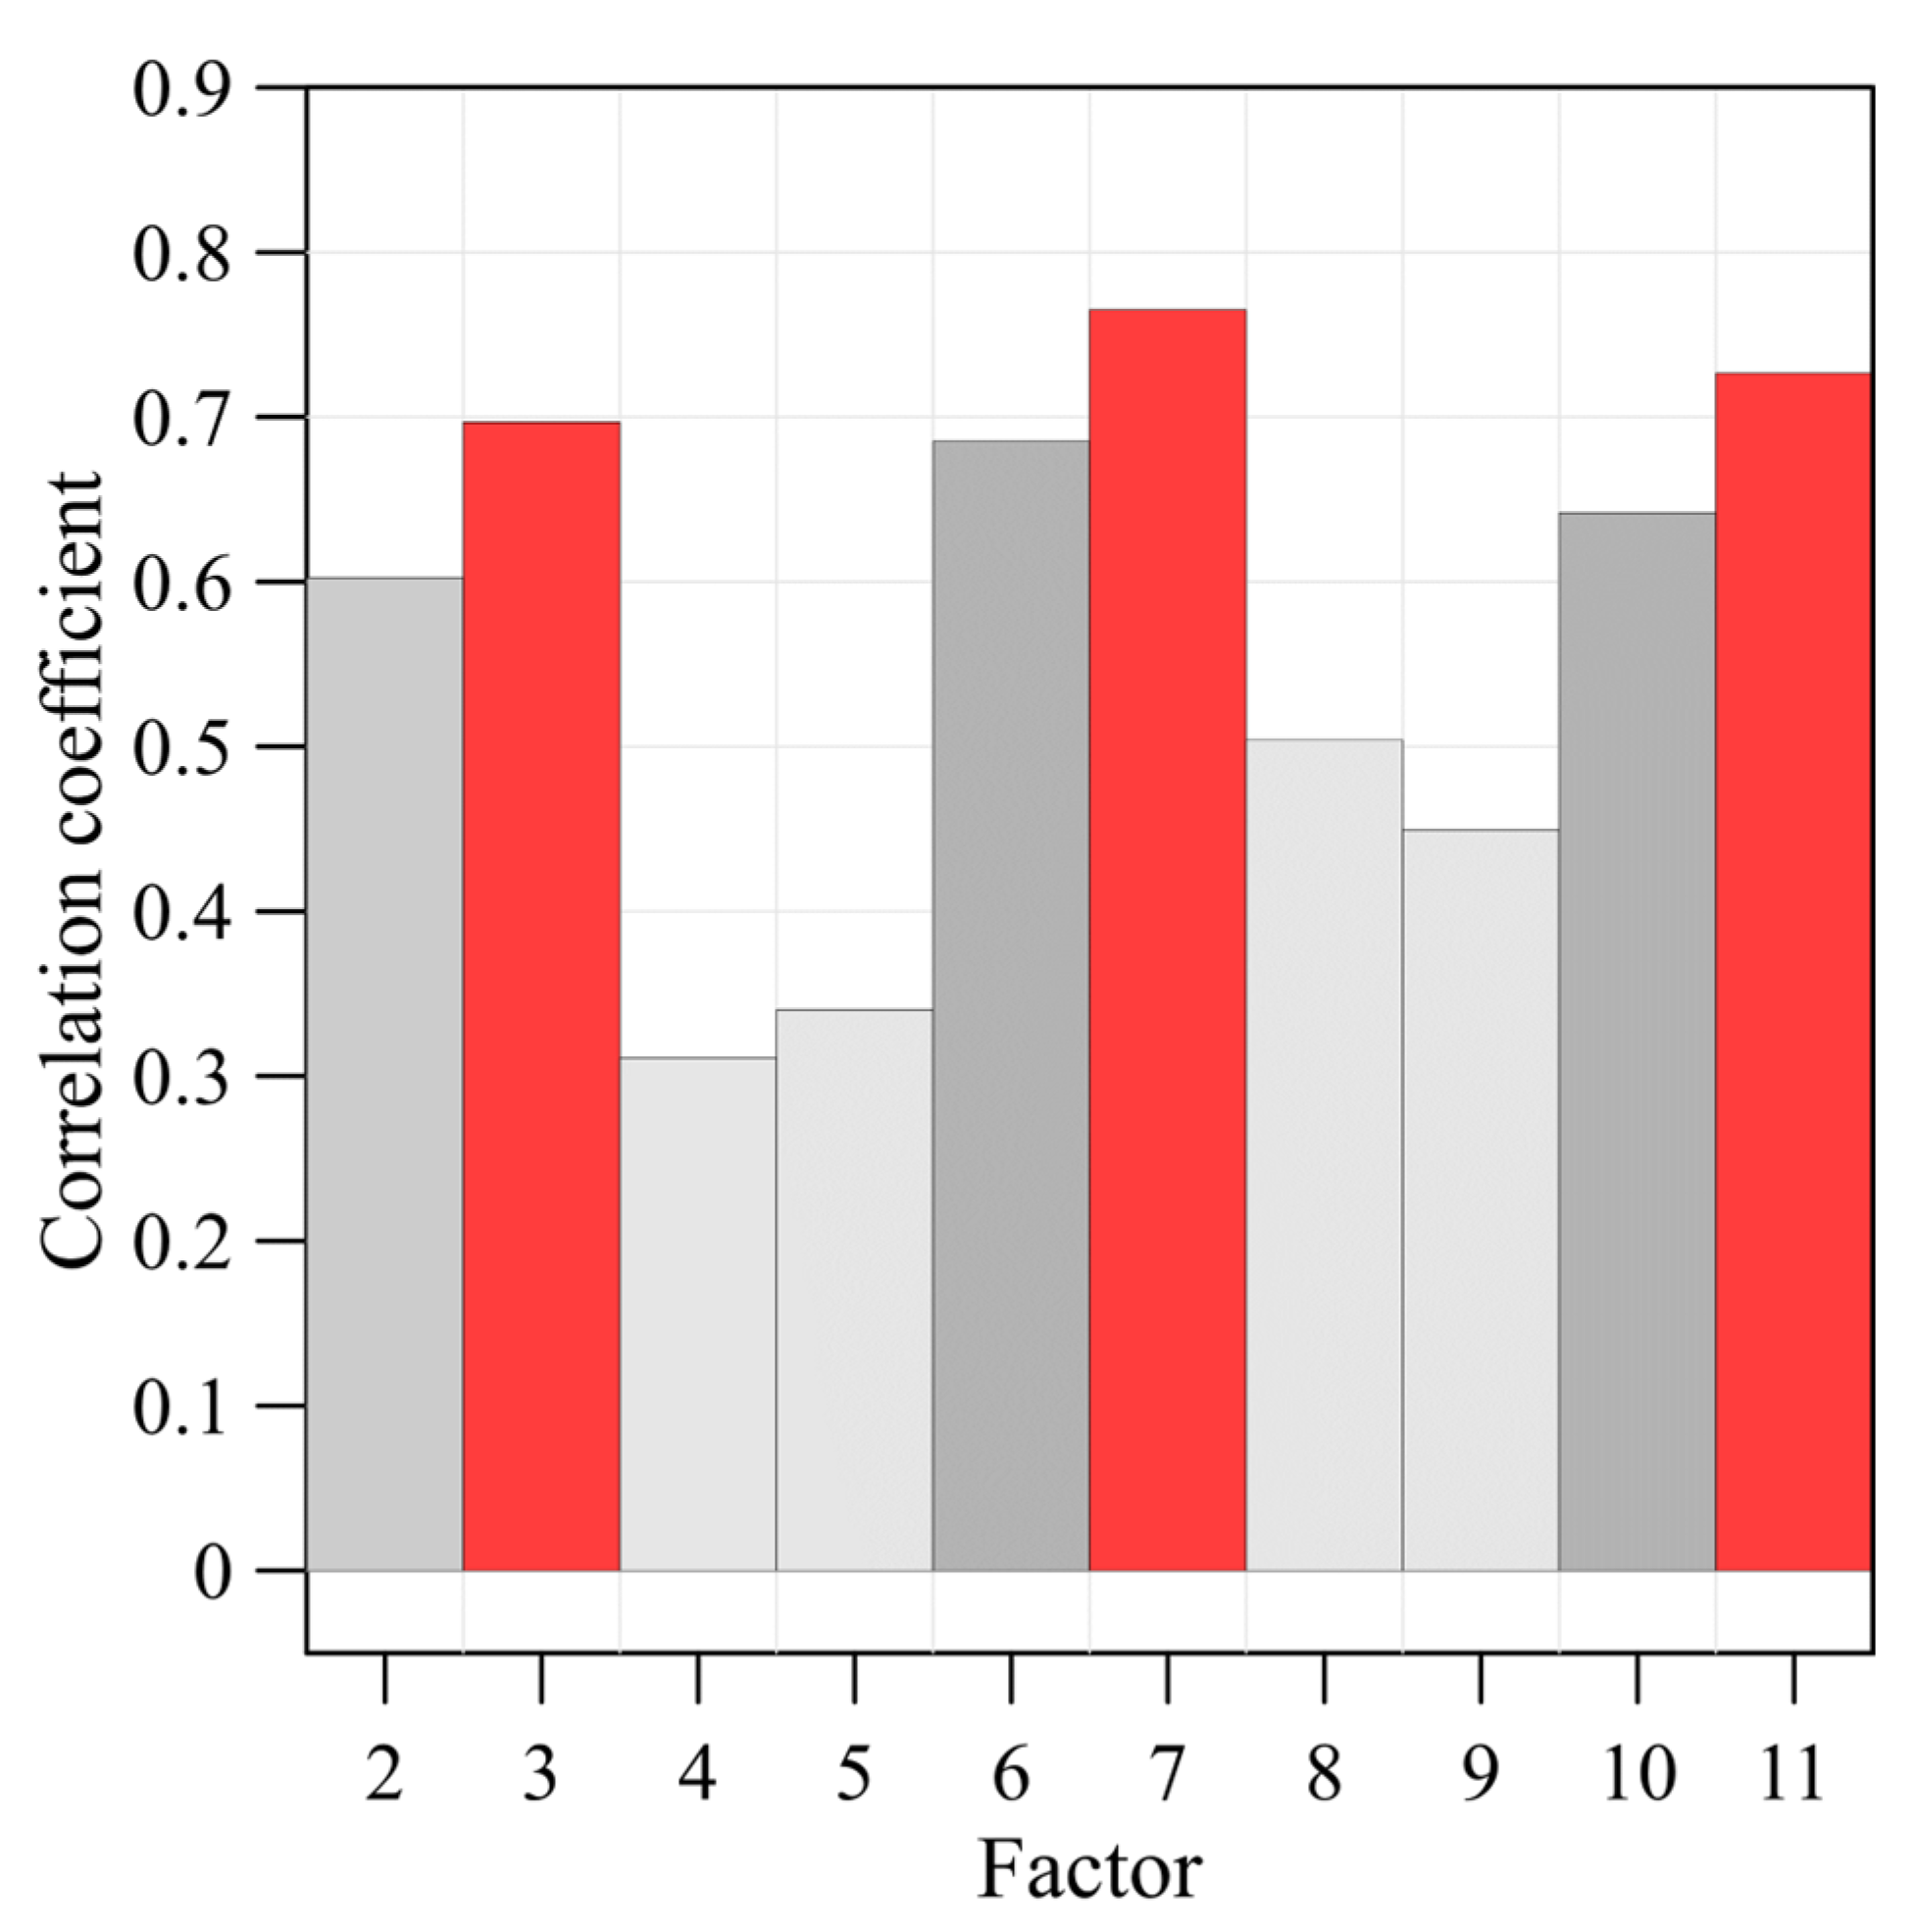
Figure 5.
Correlation coefficients between each factor.
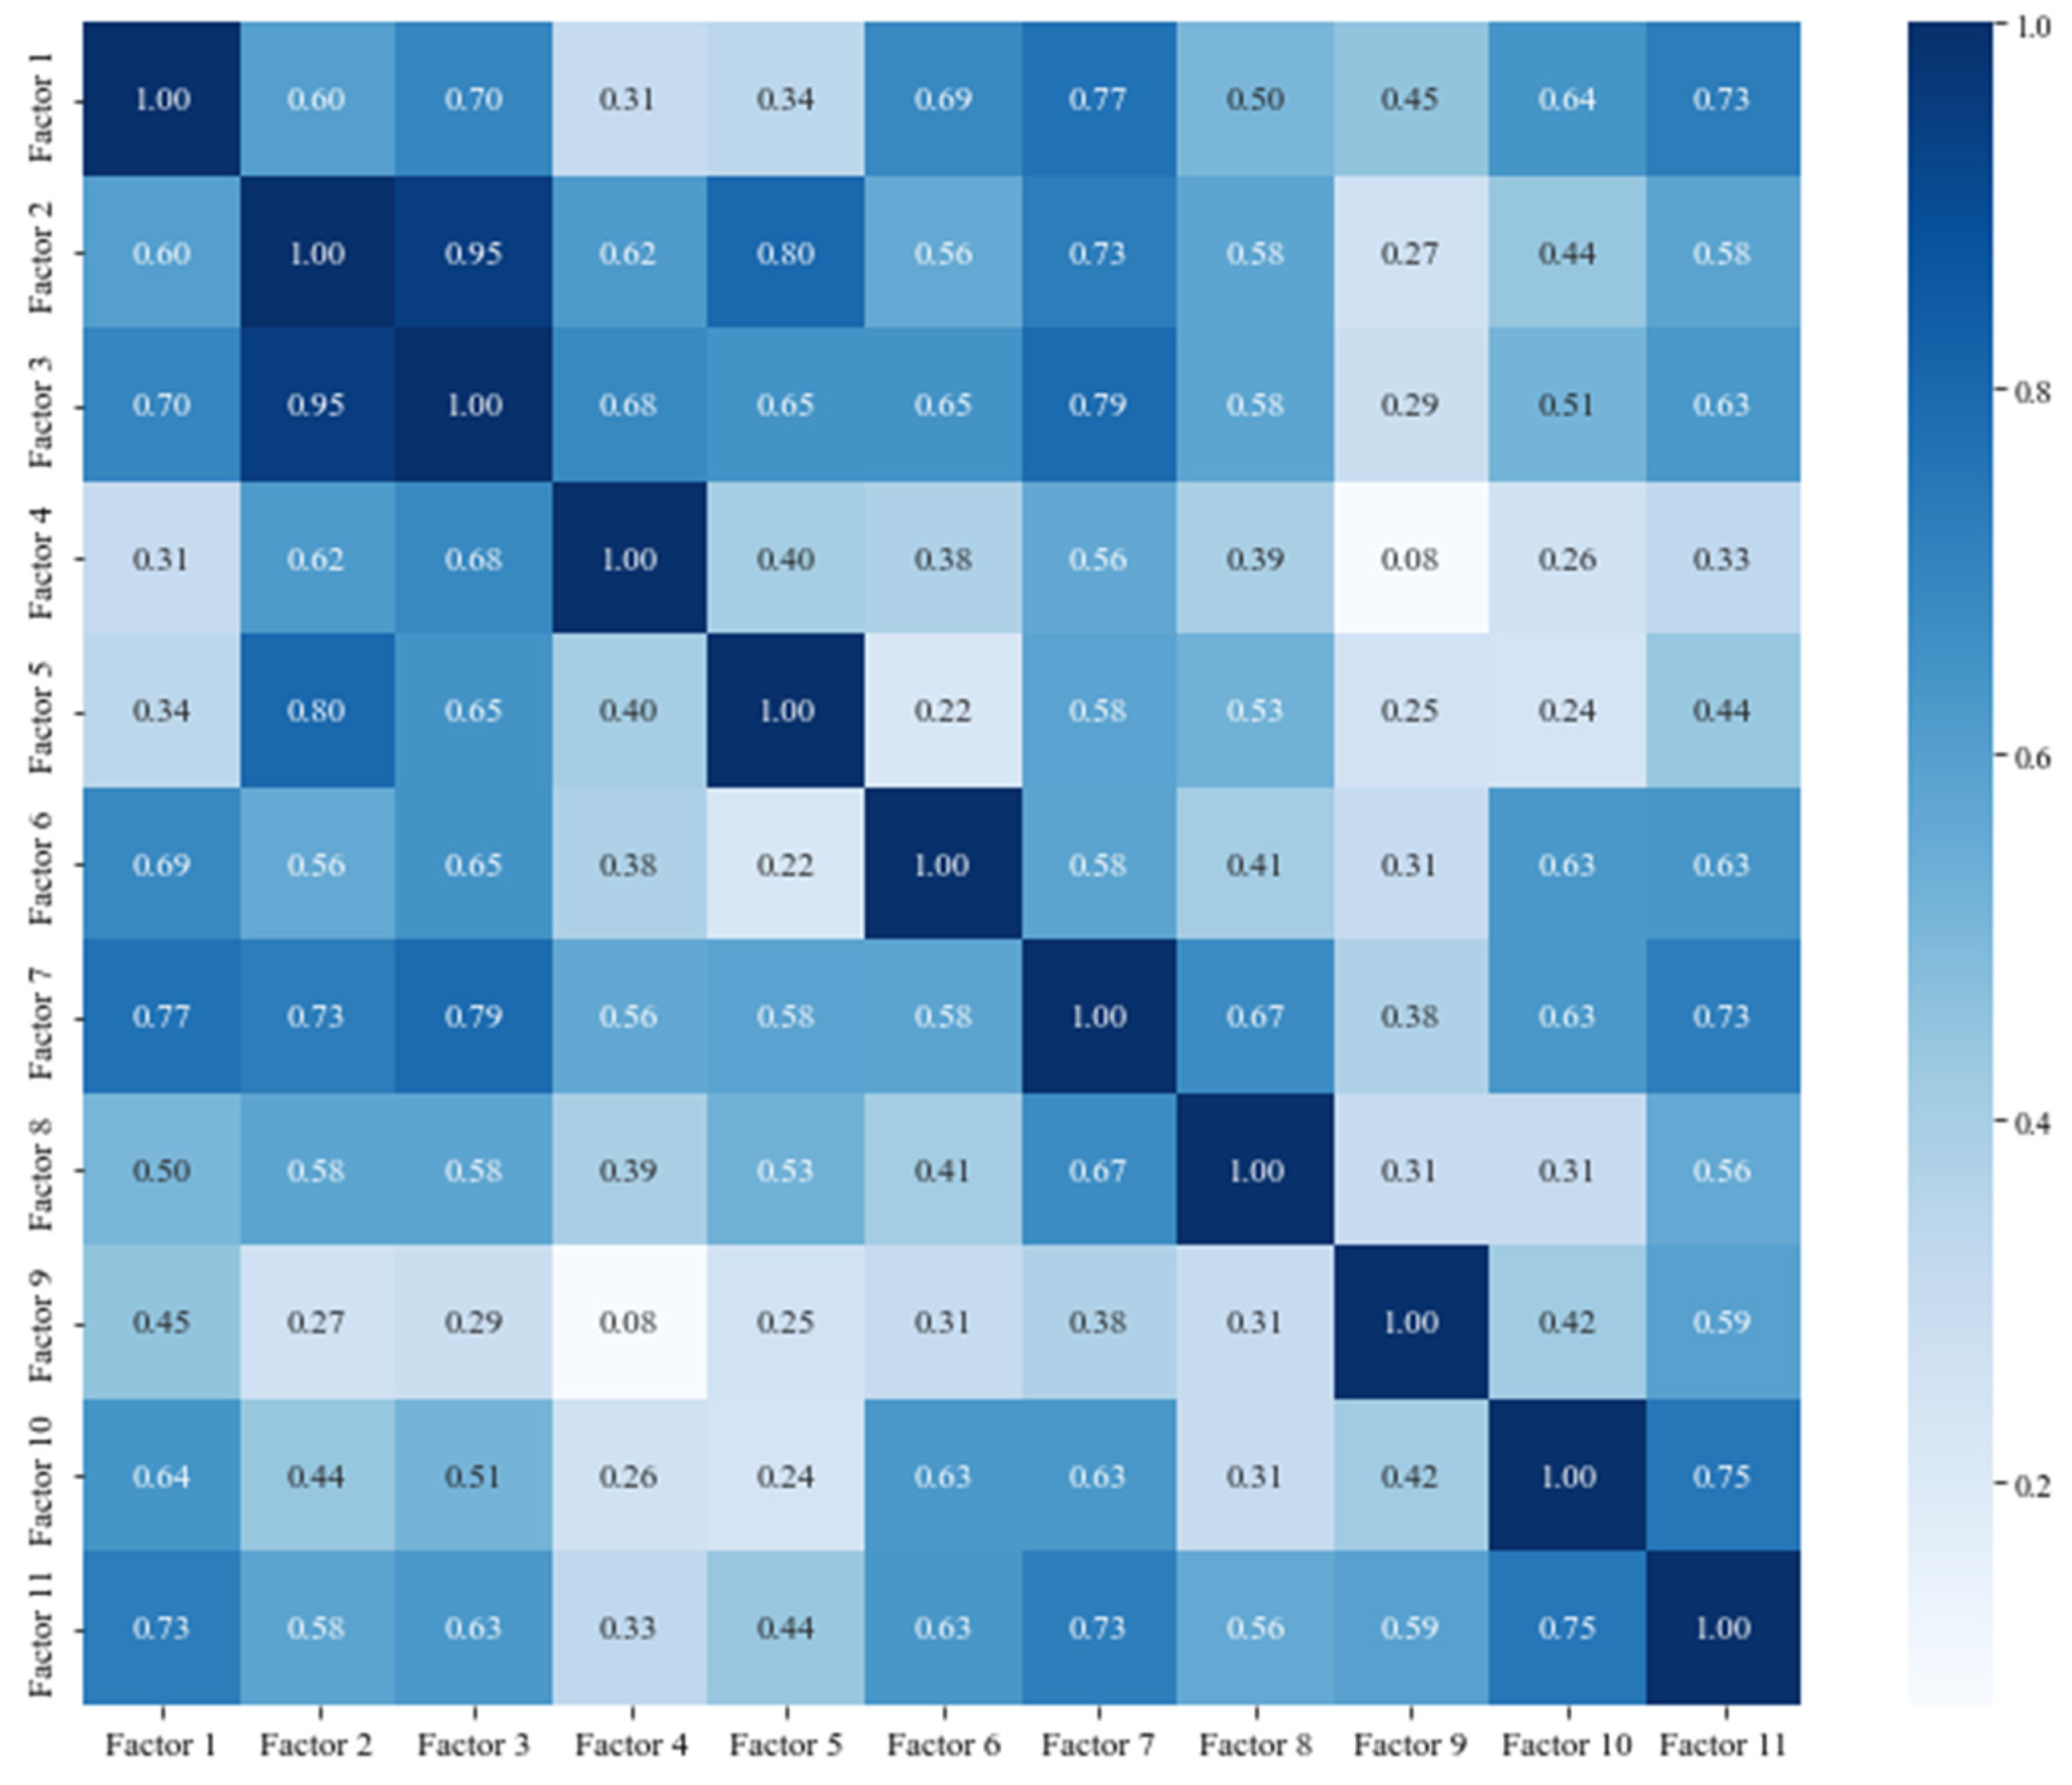
Figure 6.
Variable importance plot using the OOB predictor (red color represents correlation coefficients greater than 0.7, gray color represents correlation coefficient less than 0.7).
Figure 6.
Variable importance plot using the OOB predictor (red color represents correlation coefficients greater than 0.7, gray color represents correlation coefficient less than 0.7).

Figure 7.
Biplots: (a) PCA; (b) FA. (blue dots represent the original variables, while red lines represent the directions and magnitudes of the principal components).
Figure 7.
Biplots: (a) PCA; (b) FA. (blue dots represent the original variables, while red lines represent the directions and magnitudes of the principal components).
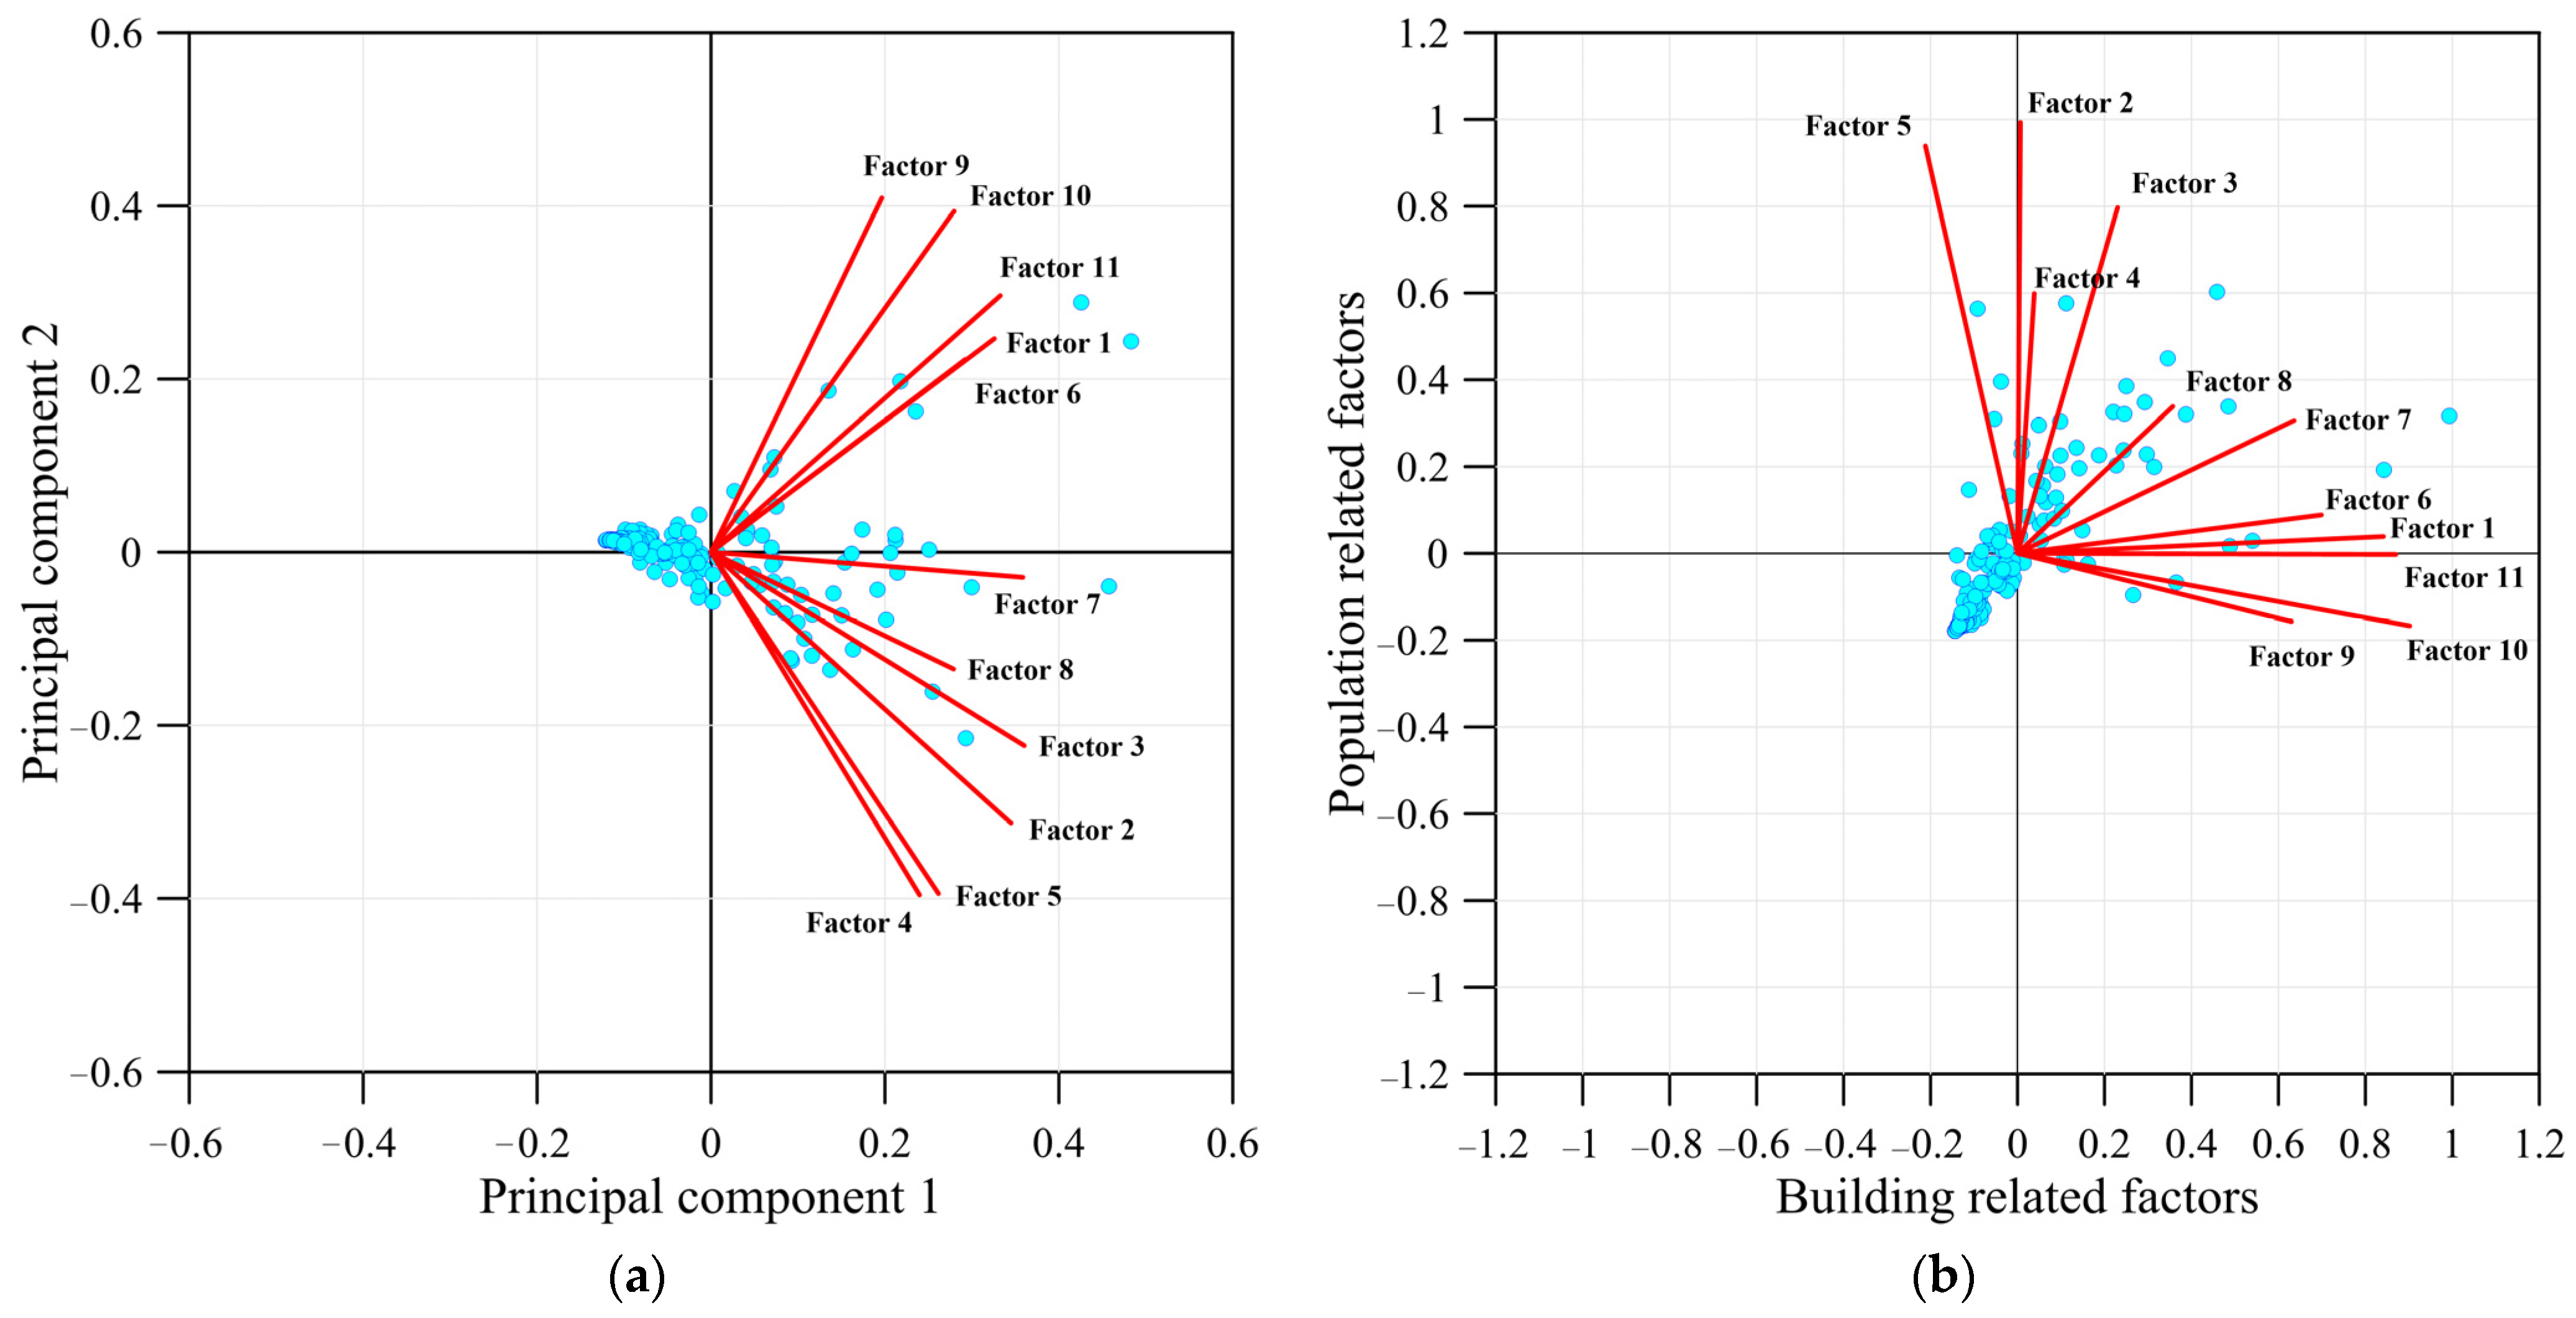
Figure 8.
Biplots of the population, building and economic-related features on the rotated factors: (a) population and economic-related features; (b) economic and building-related features; (c) building and population-related features. (blue dots represent the original variables, while red lines represent the directions and magnitudes of the factors).

Figure 9.
Normalized factors highly correlated with fire incidents: (a) proportion of buildings over 40 years old; (b) proportion of tertiary sector of the economy; (c) proportion of elderly population.
Figure 9.
Normalized factors highly correlated with fire incidents: (a) proportion of buildings over 40 years old; (b) proportion of tertiary sector of the economy; (c) proportion of elderly population.

Table 1.
Factors from fire datasets in this study.
| Factor Description | Aquired Time | Source Data | |
|---|---|---|---|
| Factor 1 | Fire density over the past 10 years | 2021 | Keelung City Fire Bureau [16] |
| Factor 2 | Population density | 2021 | Household Registration Division, Department of Civil Affairs, Keelung City Government [43] |
| Factor 3 | Proportion of elderly population | 2021 | Household Registration Division, Department of Civil Affairs, Keelung City Government [43] |
| Factor 4 | Proportion of elderly living alone population | 2021 | Department of Social Affairs, Keelung City Government [46] |
| Factor 5 | Proportion of young age population | 2021 | Household Registration Division, Department of Civil Affairs, Keelung City Government [43] |
| Factor 6 | Building density | 2021 | Department of Urban Development, Keelung City Government [47] |
| Factor 7 | Proportion of buildings over 40 years old | 2021 | Department of Urban Development, Keelung City Government [47] |
| Factor 8 | Proportion of non-reinforced concrete (RC) buildings | 2021 | Department of Social Affairs, Keelung City Government [46] |
| Factor 9 | Proportion of first sector of the economy | 2021 | Department of Economic Affairs, Keelung City Government [48] |
| Factor 10 | Proportion of secondary sector of the economy | 2021 | Department of Economic Affairs, Keelung City Government [48] |
| Factor 11 | Proportion of tertiary sector of the economy | 2021 | Department of Economic Affairs, Keelung City Government [48] |
Disclaimer/Publisher’s Note: The statements, opinions and data contained in all publications are solely those of the individual author(s) and contributor(s) and not of MDPI and/or the editor(s). MDPI and/or the editor(s) disclaim responsibility for any injury to people or property resulting from any ideas, methods, instructions or products referred to in the content. |
© 2024 by the authors. Licensee MDPI, Basel, Switzerland. This article is an open access article distributed under the terms and conditions of the Creative Commons Attribution (CC BY) license (https://creativecommons.org/licenses/by/4.0/).
Share and Cite
MDPI and ACS Style
Ku, C.-Y.; Lu, H.-C.; Tu, Y.-T.; Liu, C.-Y. Charactering Human-Caused Fires Using GIS-Based Dimensionality Reduction Techniques in Keelung City, Taiwan. Appl. Sci. 2024, 14, 1930. https://doi.org/10.3390/app14051930
AMA Style
Ku C-Y, Lu H-C, Tu Y-T, Liu C-Y. Charactering Human-Caused Fires Using GIS-Based Dimensionality Reduction Techniques in Keelung City, Taiwan. Applied Sciences. 2024; 14(5):1930. https://doi.org/10.3390/app14051930
Chicago/Turabian StyleKu, Cheng-Yu, Hsueh-Chuan Lu, Yi-Tse Tu, and Chih-Yu Liu. 2024. "Charactering Human-Caused Fires Using GIS-Based Dimensionality Reduction Techniques in Keelung City, Taiwan" Applied Sciences 14, no. 5: 1930. https://doi.org/10.3390/app14051930
Note that from the first issue of 2016, this journal uses article numbers instead of page numbers. See further details here.