Article

Study on the Synergistic Effect of Primary Support and Surrounding Rock of Large Buried Depth Tunnel in Soft and Fractured Strata

1
College of Geosciences and Engeering, North China University of Water Resources and Electric Power, Zhengzhou 450046, China
2
Henan Haihe River Basin Water Resources Affairs Center, Xinxiang 453002, China
3
Henan Water Conservancy Investment Group Co., Ltd., Zhengzhou 450002, China
4
State Key Laboratory of Shield Machine and Boring Technology, Zhengzhou 450001, China
*
Author to whom correspondence should be addressed.
Appl. Sci. 2024, 14(5), 2028; https://doi.org/10.3390/app14052028
Submission received: 8 February 2024 / Revised: 22 February 2024 / Accepted: 23 February 2024 / Published: 29 February 2024

Abstract

:
The soft and fractured strata can cause significant deformation of surrounding rock during tunnel excavation. This study analyzes field monitoring test results and compares numerical simulations from the third bid project of the Dali I section construction within the water diversion project in central Yunnan to address the issue of significant deformation following tunnel excavation in soft and fractured strata. It proposes an optimized support scheme consisting of a densified steel arch and enhanced initial support strength and stiffness. In addition, the research investigates support effectiveness considering varying support strengths and steel arch ring spacing. The study findings indicated the following: (1) The tunnel traverses soft and fractured strata, causing unevenly distributed vertical convergence deformation around the cavern. The maximum settlement occurs at the crown, showing pronounced nonlinearity. (2) The maximum stress in the steel arch is concentrated at the arch crown, measuring −19.02 MPa. The arch remains compressed, with stress decreasing from the crown to the waist. (3) The axial force in the anchor bolt reduces from the crown to the arch’s waist on both sides. As the depth of the rock mass increases, the axial force in each anchor bolt decreases and the tension state is maintained. The maximum axial force reaches 46.57 kN. (4) The maximum displacement decreases from 4.21 to 0.15 cm after the optimized support structure is implemented, demonstrating the optimization scheme’s effectiveness. Future constructions can refer to this scheme and make necessary adjustments based on various terrain conditions to ensure safety.

1. Introduction

Tunnel construction in China has experienced rapid development in recent years. Tunnel boring machines (TBMs) and the full-face excavation method have become increasingly common. However, they encounter numerous challenges due to adverse geological and operating conditions. Despite significant advancements in tunnel construction in China over the past few decades, the instability and failure of surrounding rock during tunnel excavation continue to be major concerns.
Field monitoring tests have proven effective and intuitive for assessing the stability of surrounding rock. These tests accurately determine and predict the rock mass’s stability, thus preventing safety accidents. Numerous researchers have used this approach in their studies. For instance, Lai et al. [1] conducted extensive field tests on the Yinxi High-Speed Railway to examine the deformation of soft and plastic strata and the mechanical characteristics of support structures. Yin [2] explored the measurement principle of the hydrostatic leveling system (HLS) and summarized the settlement regularities of shield tunnel. Fabian Buchmayer et al. [3] presented a tunnel monitoring approach based on distributed fiber optic sensing and compared traditional monitoring methods. Li et al. [4] investigated the Xinhua Exit Tunnel of the Zhengwu High-Speed Railway in Hubei Province and analyzed stress displacement characteristics through field monitoring. Chen et al. [5] used field monitoring to explore the Yuanbaizi Tunnel’s stability in the Pingkan to Hanzhong section of the Bao-Han Expressway, focusing on rock mass stability. Zheng et al. [6] analyzed the Xiamen Xiang’an Subsea Tunnel, focusing on the mechanical characteristics of the initial support structure components. Tan et al. [7] examined the large-section loess tunnel project of the Zhengzhou-Xi’an Railway Passenger Line and analyzed anchor rod stress distribution through onsite comparative tests. Lai et al. [8] explored the Qingtuxian Tunnel’s stress–strain laws through field monitoring. W N MacPherson et al. [9] evaluated the stress–strain laws using field monitoring. Huang et al. [10] monitored the TBM construction in the Wulidian-Shanyanggou Reservoir section of Chongqing Rail Transit Line 6’s Phase 1 to study the urban environment surrounding rock stability. Lastly, Yun Hae-Bum et al. [11] proposed an application to evaluate the effects of new tunnels on existing tunnels, which is designed for onsite monitoring. Martin Slabej et al. [12] introduced GPR measurement technology and used it to monitor road settlement on the runway of Žilina airport, proving that this technology can be applied to other engineering monitoring. M Kavvadas [13] proposed a warning system for surface damage after tunnel excavation by analyzing common types of surface deformation monitoring. P Oreste et al. [14] proposed an analysis method for reverse engineering reliable rock mass parameters under probabilistic background. H Khelalfa et al. [15] conducted a study on monitoring the deformation of surrounding rock during the temporary support stage after tunnel excavation through a case study.
Other researchers have compared and validated monitoring experiments through numerical simulation methods. For instance, Hong et al. [16] conducted a study on the rationality of the freezing-sealing pipe-roof method through numerical simulation. Xu et al. [17] examined the biased pressure section of the Shazitang Tunnel exit and analyzed the interaction between the section’s surrounding rock and support structures using field monitoring and numerical simulations. Chen et al. [18] conducted model experiments on the surrounding rock and lining structure to simulate the entire tunnel construction process. Wang et al. [19] monitored and analyzed stress in the steel arches of the Ka Shuang (KS) Tunnel in the Beijing Water Supply Project’s second phase, establishing criteria and safety levels for steel arch stability. Guo et al. [20] introduced measurement equipment for monitoring the deformation of element joints in immersed tunnel based on the immersed tunnel of Hong Kong-Zhuhai-Macao Bridge. Zhu et al. [21] conducted a numerical simulation of the tunnel construction process for a specific project and compared their findings with monitoring results. Xu [22] investigated a large-section tunnel in the Kunshi Expressway in Yunnan through monitoring and analysis. Lai et al. [23] developed a finite element model using numerical simulations to determine the influence of the displacement and stress of surrounding rock after tunnel excavation. D Martinelli et al. [24] demonstrated the applicability of the tunnel model under different stress conditions through the discrete element method. Zhang et al. [25] proposed a fusion deep neural network (FDNN) model to evaluate the most important influencing factors on tunnel deformation. Li et al. [26] simulated the impact of super-large-diameter shield tunnel on the displacement of existing tunnel.
Accordingly, field monitoring tests serve as the most intuitive research method for evaluating the stability of surrounding rock. These tests enable the effective collection and analysis of the stress–strain patterns and the effect range of the rock mass and support system. This study focuses on the construction of Section 3 of the central Yunnan Water Diversion Project and employs both field monitoring tests and numerical simulation methods to examine variations in the internal forces of the support system in fractured soft rock formations. It aims to refine the support structure and address significant deformations during the excavation of fractured and soft surrounding rock in tunnels.

2. Study Area and Methods

2.1. Investigation

The construction of Section 3 of the central Yunnan Water Diversion Project is located in Songgui Town, Heqing County, Dali Prefecture. The section spans approximately 26.542 km in length. The depth of the TBM excavation section varies between 450 and 1400 m, and a significant segment, approximately 20.4 km, exceeds 600 m in depth. The excavation profile for the TBM section is circular, with a diameter of 9.8 m. Initial support incorporates steel mesh sprayed concrete and steel arches, while the secondary lining consists of cast-in-place C30 reinforced concrete enveloping the tunnel’s entire circumference.
The TBM excavation predominantly comprises basalt, limestone, dolomitic limestone, and dolomite. In sections with basalt under high in situ stress, rockburst risks emerge. The tunnel traverses weak rock formations, such as mudstone and shale, susceptible to significant deformations due to groundwater’s softening impact. There are many bad geological holes involved in this bid section, among which the V category accounts for more than 57.6%. The internal construction of the tunnel is shown in Figure 1.
The mechanical parameters of the rock mass derive from those of Class V surrounding rock in the numerical simulations. Steel arches are represented as cable elements, spaced at 1 m intervals. The reinforcement and sprayed concrete layer are abstracted as shell elements and paired with the steel arches to shape the support structure. Table 1 lists specific parameters.

2.2. Monitoring Scheme

Field monitoring is conducted using surface strain gauges, pressure cells, and electrical measurement anchor bolts to address the deformations in the soft and fractured formations of the Xianglushan Tunnel in the central Yunnan Water Diversion Project. The monitored stress characteristics encompass the strain of the steel arches, the contact stress of the steel arches (often termed rock pressure), and the axial force of the anchor rods. Based on a detailed longitudinal section from the tunnel’s geological survey, monitoring sections are selected in areas where the soft and fractured formations are prevalent near the Heqing-Eryuan active fault (F12). The goal is to observe the stress–strain variations in the support structure within these soft and fractured rock formations.

2.2.1. Monitoring Point Arrangement

Considering the extent of rock fragmentation along the monitoring section, 14 measurement points are arranged, as depicted in Figure 2. The monitoring sensors include vibrating steel anchor bolt dynamometers, vibrating steel strain gauges for steel reinforcement, and vibrating wire earth-pressure cells.
The frequency receiver is equipped with three batteries inside, and the battery level can keep the frequency receiver working normally for 10 days. All sensors are connected to a frequency receiver through wires to achieve automatic data collection. The frequency receiver continuously collects data every day. Data are downloaded every 2 to 3 days during tunneling. Afterward, the accumulated data are sorted, categorized, and analyzed until displacement achieves a stable state.

2.2.2. Monitoring Methodology

In order to measure the pressure from the tunnel’s surrounding rock on the steel reinforcement, earth-pressure cells are positioned between the steel reinforcement and the steel arches, directly touching the steel reinforcement. These cables are fastened along the support lines of the steel arches during earth-pressure cells installation to ensure the monitoring cables remain intact during secondary lining pouring. Figure 3 displays a schematic representation of this arrangement.
Five monitoring points are strategically placed along the tunnel monitoring section to observe anchor bolt axial forces. These points are located at the crown, left and right spring lines, and left and right haunches of the arch. Each point utilizes a vibrating steel anchor bolt dynamometer approximately 3 m in length. This load cell consists of three vibrating steel strain gauges connected in sequence, as illustrated in Figure 4. Installation involves creating anchor rod drill holes and using cement grouting to affix the load cells securely.
Four monitoring points are positioned along the tunnel monitoring section to assess the steel arches’ stress. These points are at the crown, the right side at a 60° angle, the right spring line, and the right haunch of the arch. Every monitoring point is outfitted with a vibrating steel strain gauge for the steel reinforcement of the arches. The installation diagram of the steel strain gauge is provided in Figure 5.

2.3. Modeling

The finite element software FLAC3D 6.0 is employed for simulating the actual construction conditions to comprehend the stress–strain shifts in the surrounding rock post-tunnel excavation and to validate and supplement the monitoring outcomes. This simulation illustrates the stress–strain characteristics of the support structure post-tunnel excavation.
The model should contain a range of at least 3–5 times the tunnel diameter to avoid boundary effects. The excavation diameter of the Xianglushan Tunnel TBM section measures 9.8 m. Based on this principle, the distance from the tunnel axis to the model’s bottom boundary is established at 85 m, while the distances from the model’s left and right boundaries are determined to be 60 m each. The designated excavation direction measures 100 m, but the actual excavation distance is 60 m. The tunnel axis lies approximately 1050 m from the shallowest point and 1333 m from the deepest point relative to the ground surface. The upper 1140 m of the rock mass is simplified as uniformly distributed loads applied to the model’s top surface. The tunnel axis is situated 35 m from the model’s top surface. The model’s overall dimensions are 120 × 120 × 100 m (height × length × width). The Mohr–Coulomb constitutive model is chosen to simulate the surrounding rock formations. The model is divided into two layers: the upper layer represents fractured mudstone, and the lower layer signifies limestone. The tunnel does not penetrate the model’s lower soil layer. The anchor load cells in the actual field monitoring process serve only a monitoring function and do not offer support; they are omitted as distinct elements in the simulation. Monitoring occurs exclusively at the sensor locations for simplification.
A full-face excavation approach is adopted with an excavation length of 1 m in alignment with the actual construction procedure. Following each excavation cycle, the excavated area is supported and a null model is designated to represent the excavation process. This excavation and support sequence is executed 60 times. The section at y = 40 m is chosen as the monitoring section to evaluate the stress–strain behavior post-excavation in the monitoring section and reduce the influence of boundary effects. This study focuses on analyzing the distribution of tunnel stresses and the range of vertical displacements. Boundary constraints are applied to the model’s five sides, excluding the top surface. Given that the construction zone is marginally impacted by groundwater, only the surrounding rock’s self-weight is considered.

3. Monitoring and Verification

3.1. Simulation Analysis

A slice analysis can be conducted on the stress and displacement contours of the monitoring section to examine the stress–strain characteristics of the surrounding rock post-tunnel excavation upon completion of the simulation.

3.1.1. Stress Field Analysis

Stress contour maps are acquired by slicing along the tunnel’s longitudinal section and excavation direction to comprehend the stress field alterations and distributions post-simulation of tunnel excavation and support. Figure 6 depicts the stress distribution from a cross-sectional perspective.
Figure 6 shows that the principal stresses on the tunnel excavation face are symmetrical on both the left and right sides. The crown and bottom demonstrate a lenticular distribution, while the arch ribs display a semi-circular distribution on both sides. Stress concentration zones are evident at the crown and arch ribs. The contour map indicates that the stress values at the arch ribs on both sides are comparable and reach a maximum relative to other areas, with values of −23.22 and −20.89 MPa for the left and right sides, respectively. It is also evident from Figure 6 that as tunnel excavation progresses, the stress values around the tunnel cavity remain relatively high, gradually decreasing and spreading outwards. The area behind the tunnel face experiences excavation disturbance, leading to a distinct stress concentration zone with a stress value of −15.66 MPa. Thus, during the excavation process, the stress concentration zone behind the tunnel face requires careful consideration, and implementing appropriate advance support measures becomes imperative.

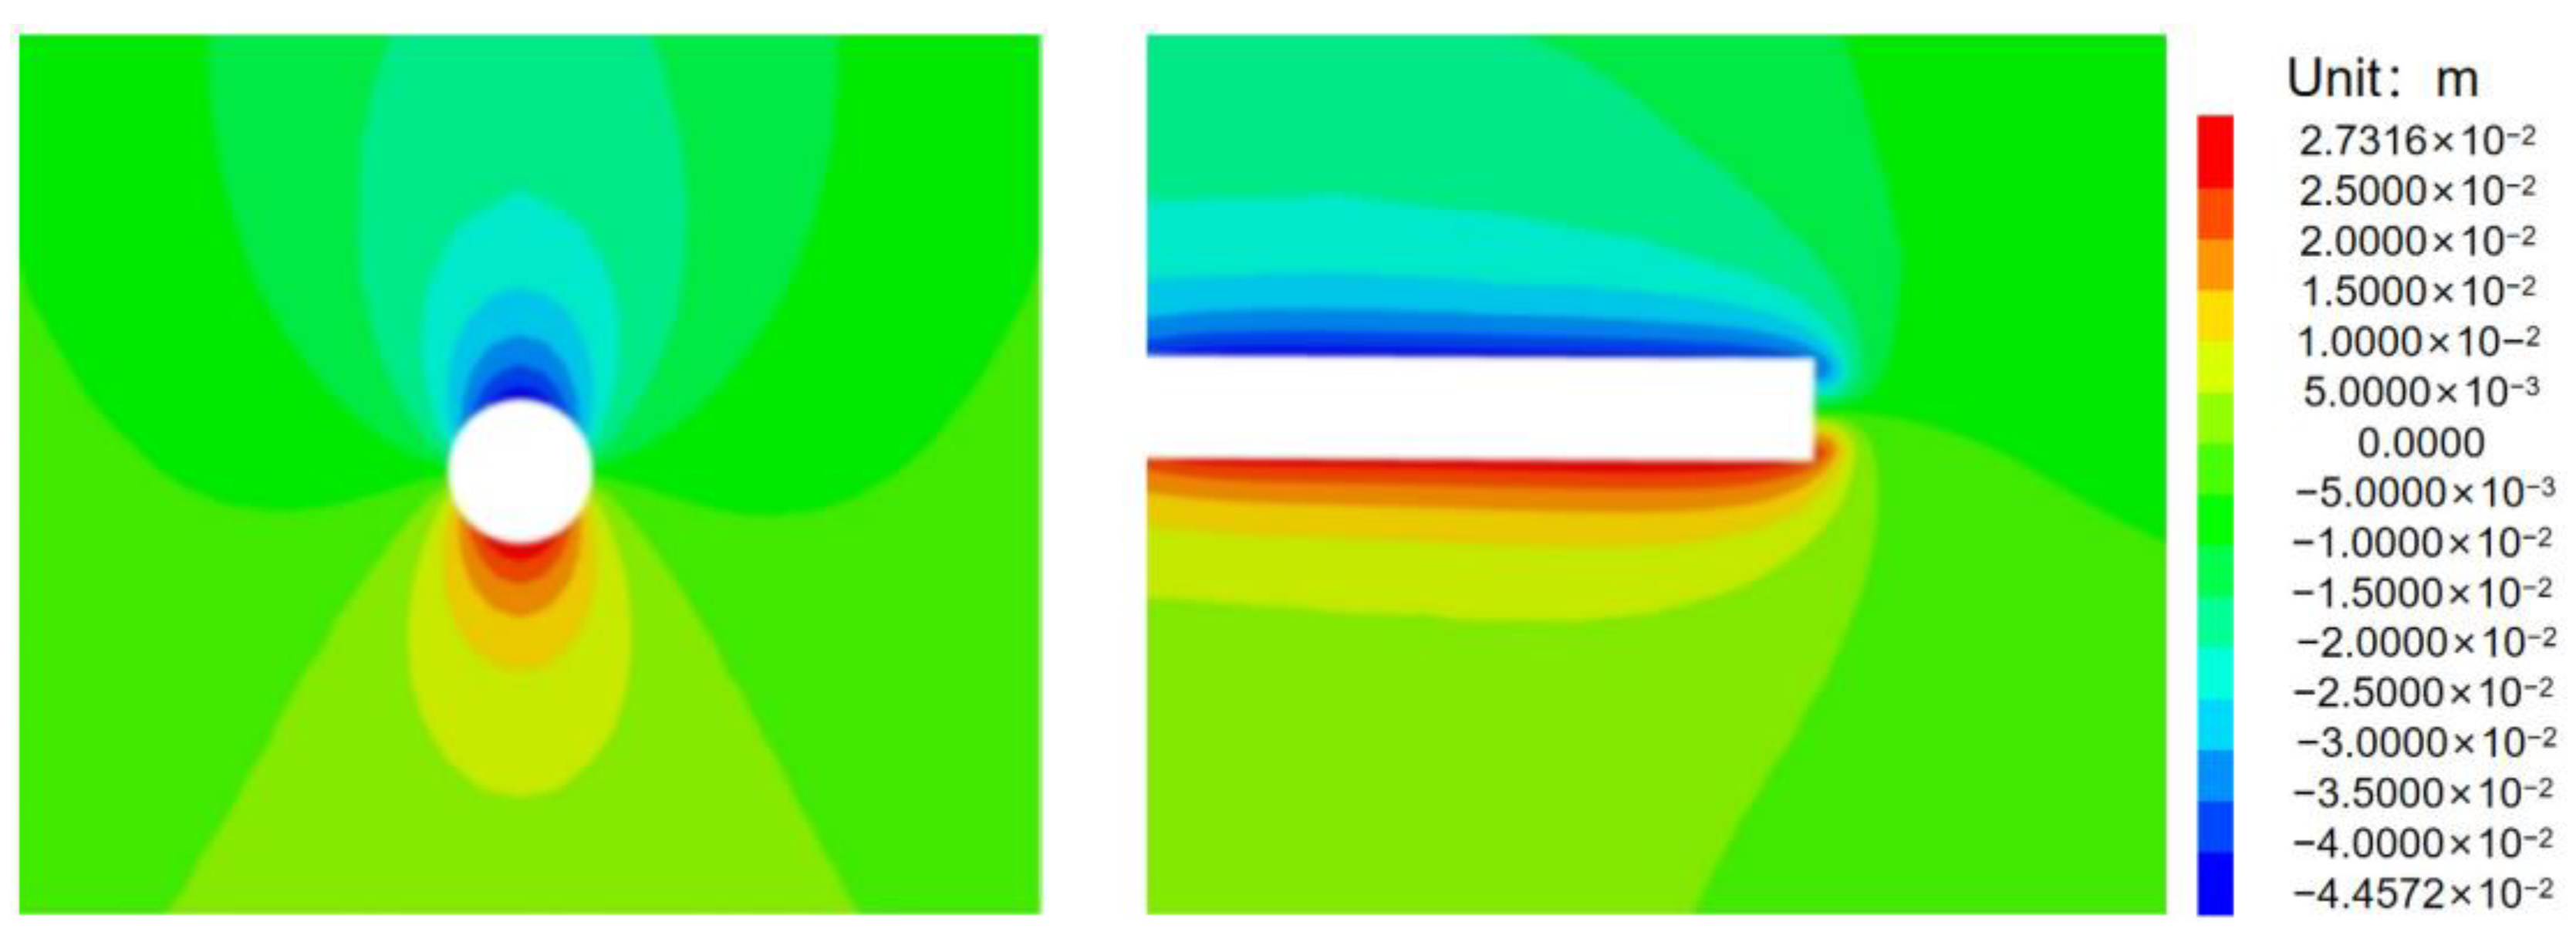
3.1.2. Displacement Field Analysis

The displacement contour maps can be obtained by sectioning slices along the tunnel’s longitudinal axis and excavation direction to comprehend the extent of displacement changes after simulating tunnel excavation and support. Figure 7 depicts the vertical displacement contour on a cross-sectional view.
Figure 7 exhibits that during the tunnel excavation process, the tunnel crown undergoes a settlement of approximately 4.5 cm, while the surrounding rock at the bottom experiences an uplift of about 2.8 cm. Relative to other areas, deformations are most pronounced at the crown and bottom. The vertical displacement of the surrounding rock on both sides of the arch rib measures 0.46 cm, which is within the safe range. In areas farther from the tunnel face, the slope of the displacement contour map becomes gentle. The steepest slope is apparent near the tunnel face, suggesting that as tunnel excavation progresses, vertical displacement continually increases. However, the rate of increase decelerates as one moves further from the tunnel face. This observation indicates that the impact of subsequent excavation on previously excavated sections decreases as the distance from the tunnel face expands.

3.2. Comparative Analysis of Monitoring and Simulation

The section’s stress-–strain variations can be analyzed by comparing the numerical simulation results and monitoring tests.

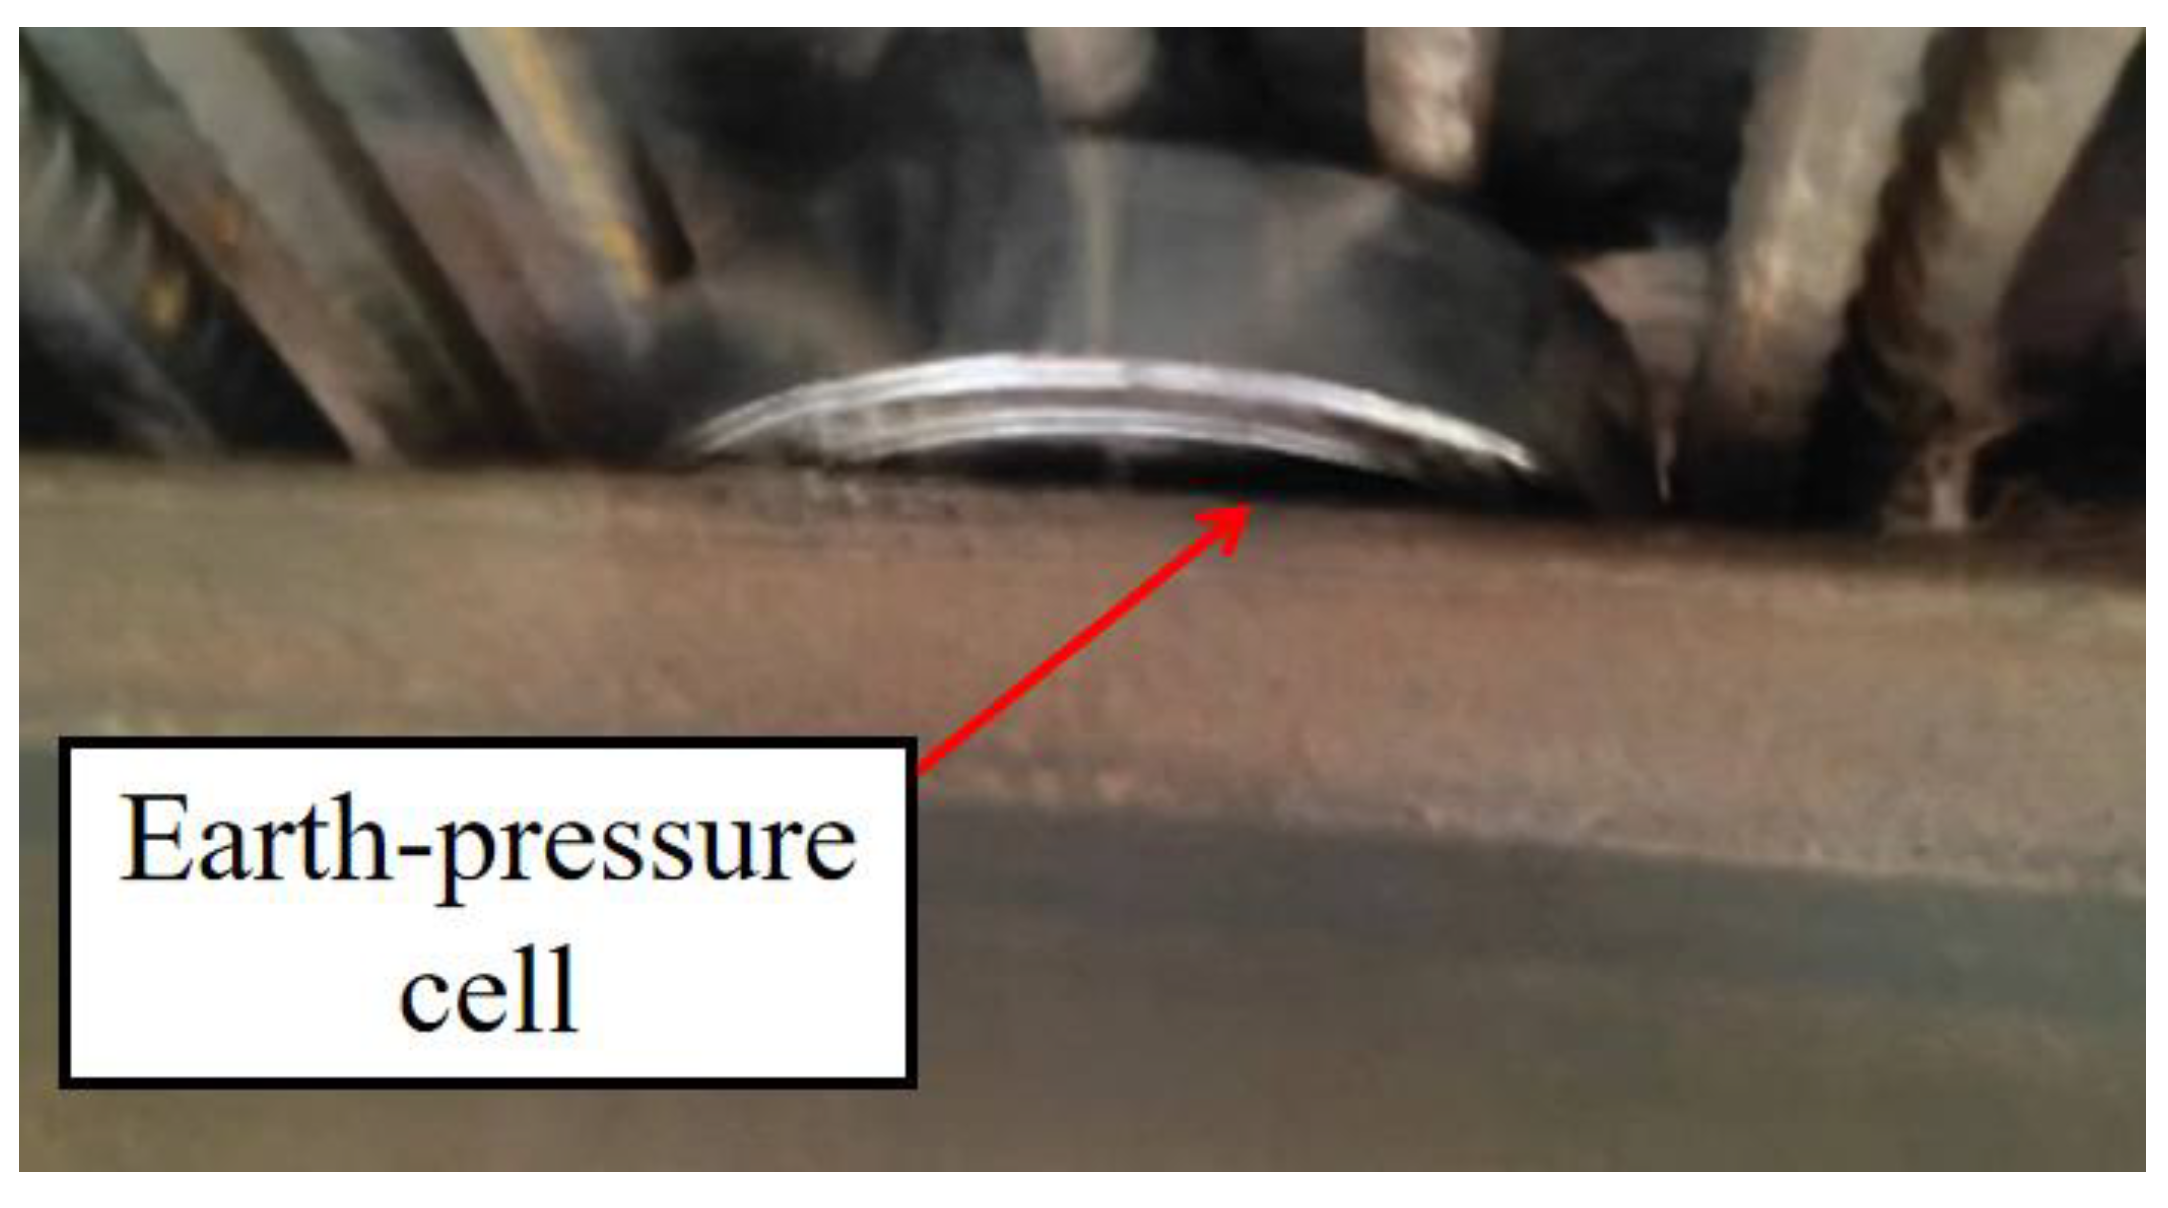
3.2.1. Comparative Analysis of Earth Pressure Cell

The stress characteristics of the steel arch support in the monitoring section are identified by examining the field monitoring test data and numerical simulation results as follows:
(1)
Figure 8 demonstrates that the stress values at each monitoring point of the steel arch support exhibit a rapid increase in the first 8 m of excavation, followed by a slower and converging change over the subsequent 12 m. This phenomenon results from the stress redistribution in the surrounding rock post-tunnel excavation, transferring stress to the steel arch supports. In later stages, the stress in the surrounding rock stabilizes, and the pressure on the steel arch supports also reaches a steady state.
(2)
When comparing the field monitoring data to the numerical simulation results, both sets of results exhibit a consistent trend. However, the simulation results tend to be slightly higher than the monitoring ones. The observed stress values range from −5.86 to −18.92 MPa, whereas the simulated stress values fluctuate between −6.07 and −23.33 MPa. The maximum pressure on the steel arch supports is noted at the arch ribs on both sides, with decreased pressure at the arch shoulders. The minimum pressure is experienced at the crown of the steel arch supports. The left arch rib endures marginally more pressure than its right counterpart. This analysis infers that the surrounding rock at the crown position undergoes some relaxation and possesses a diminished load-bearing capacity. Consequently, the surrounding rock at the arch rib location exerts the maximum resistance force on the steel arch supports. This force is followed in magnitude by the force at the arch shoulder position, with the crown position experiencing the least pressure.
A comparison of the actual monitoring results with the simulation ones revealed strong agreement, suggesting that both the numerical simulation model and the selected parameters for the surrounding rock lining are accurate. However, optimizing the existing support structures is essential due to the challenging geological conditions characterized by soft and fractured surrounding rock and resultant high-stress values. This optimization ensures the surrounding rock’s stability and the project’s overall safety.

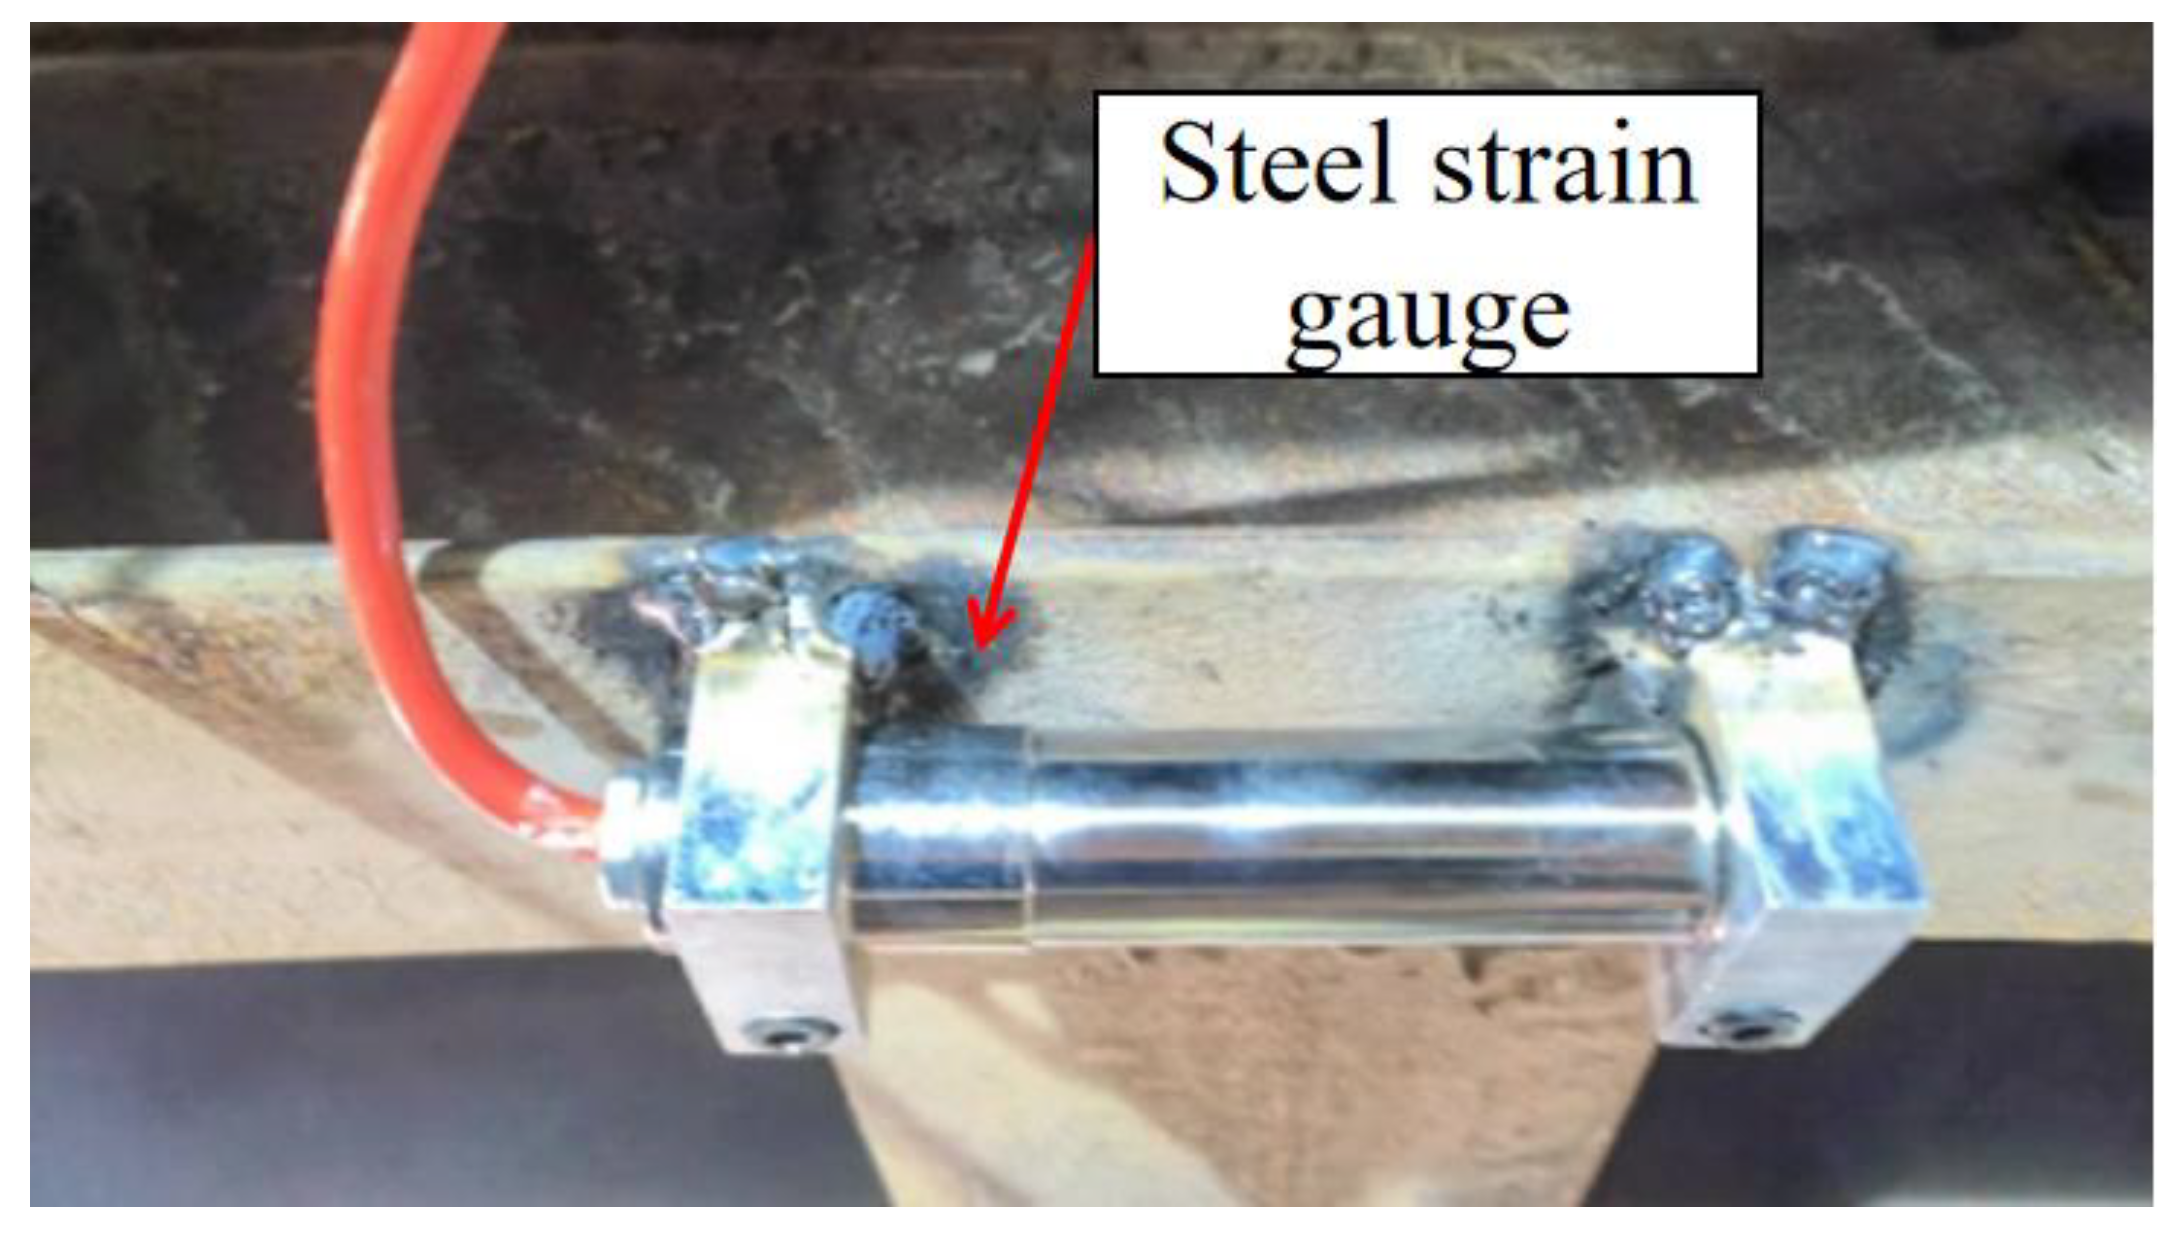
3.2.2. Comparative Analysis of Steel Strain Gauge

Based on an analysis of field monitoring test data and numerical simulation results, the changing characteristics of the monitoring section are described below:
(1)
The curve trends derived from field monitoring tests and numerical simulations (Figure 9) indicate that the strain values of the steel arch support diminish progressively from the crown to the arch rib monitoring points. The peak deformation value registers at 4.19 cm at the crown, and the stable deformation measure approximates 4.08 cm. The data reveal that the strain at the crown surpasses the strain at the 60° position on the right side. This value exceeds the strain at the arch’s shoulder and rib. The monitoring values at each point initially surge then gradually decrease in their rate of increase until achieving stability.
(2)
When comparing the field monitoring data to the numerical simulation results, both sets of results exhibit a consistent trend. However, the highest stable value derived from the numerical simulation slightly exceeds the monitoring test results, implying that the steel arch supports undergo elevated pressure and more significant displacements during the actual support process.

3.2.3. Comparative Analysis of Bolt Dynamometer

Based on the analysis of field monitoring test data and numerical simulation results (Figure 10), the stress characteristics of the monitoring section are as follows:
(1)
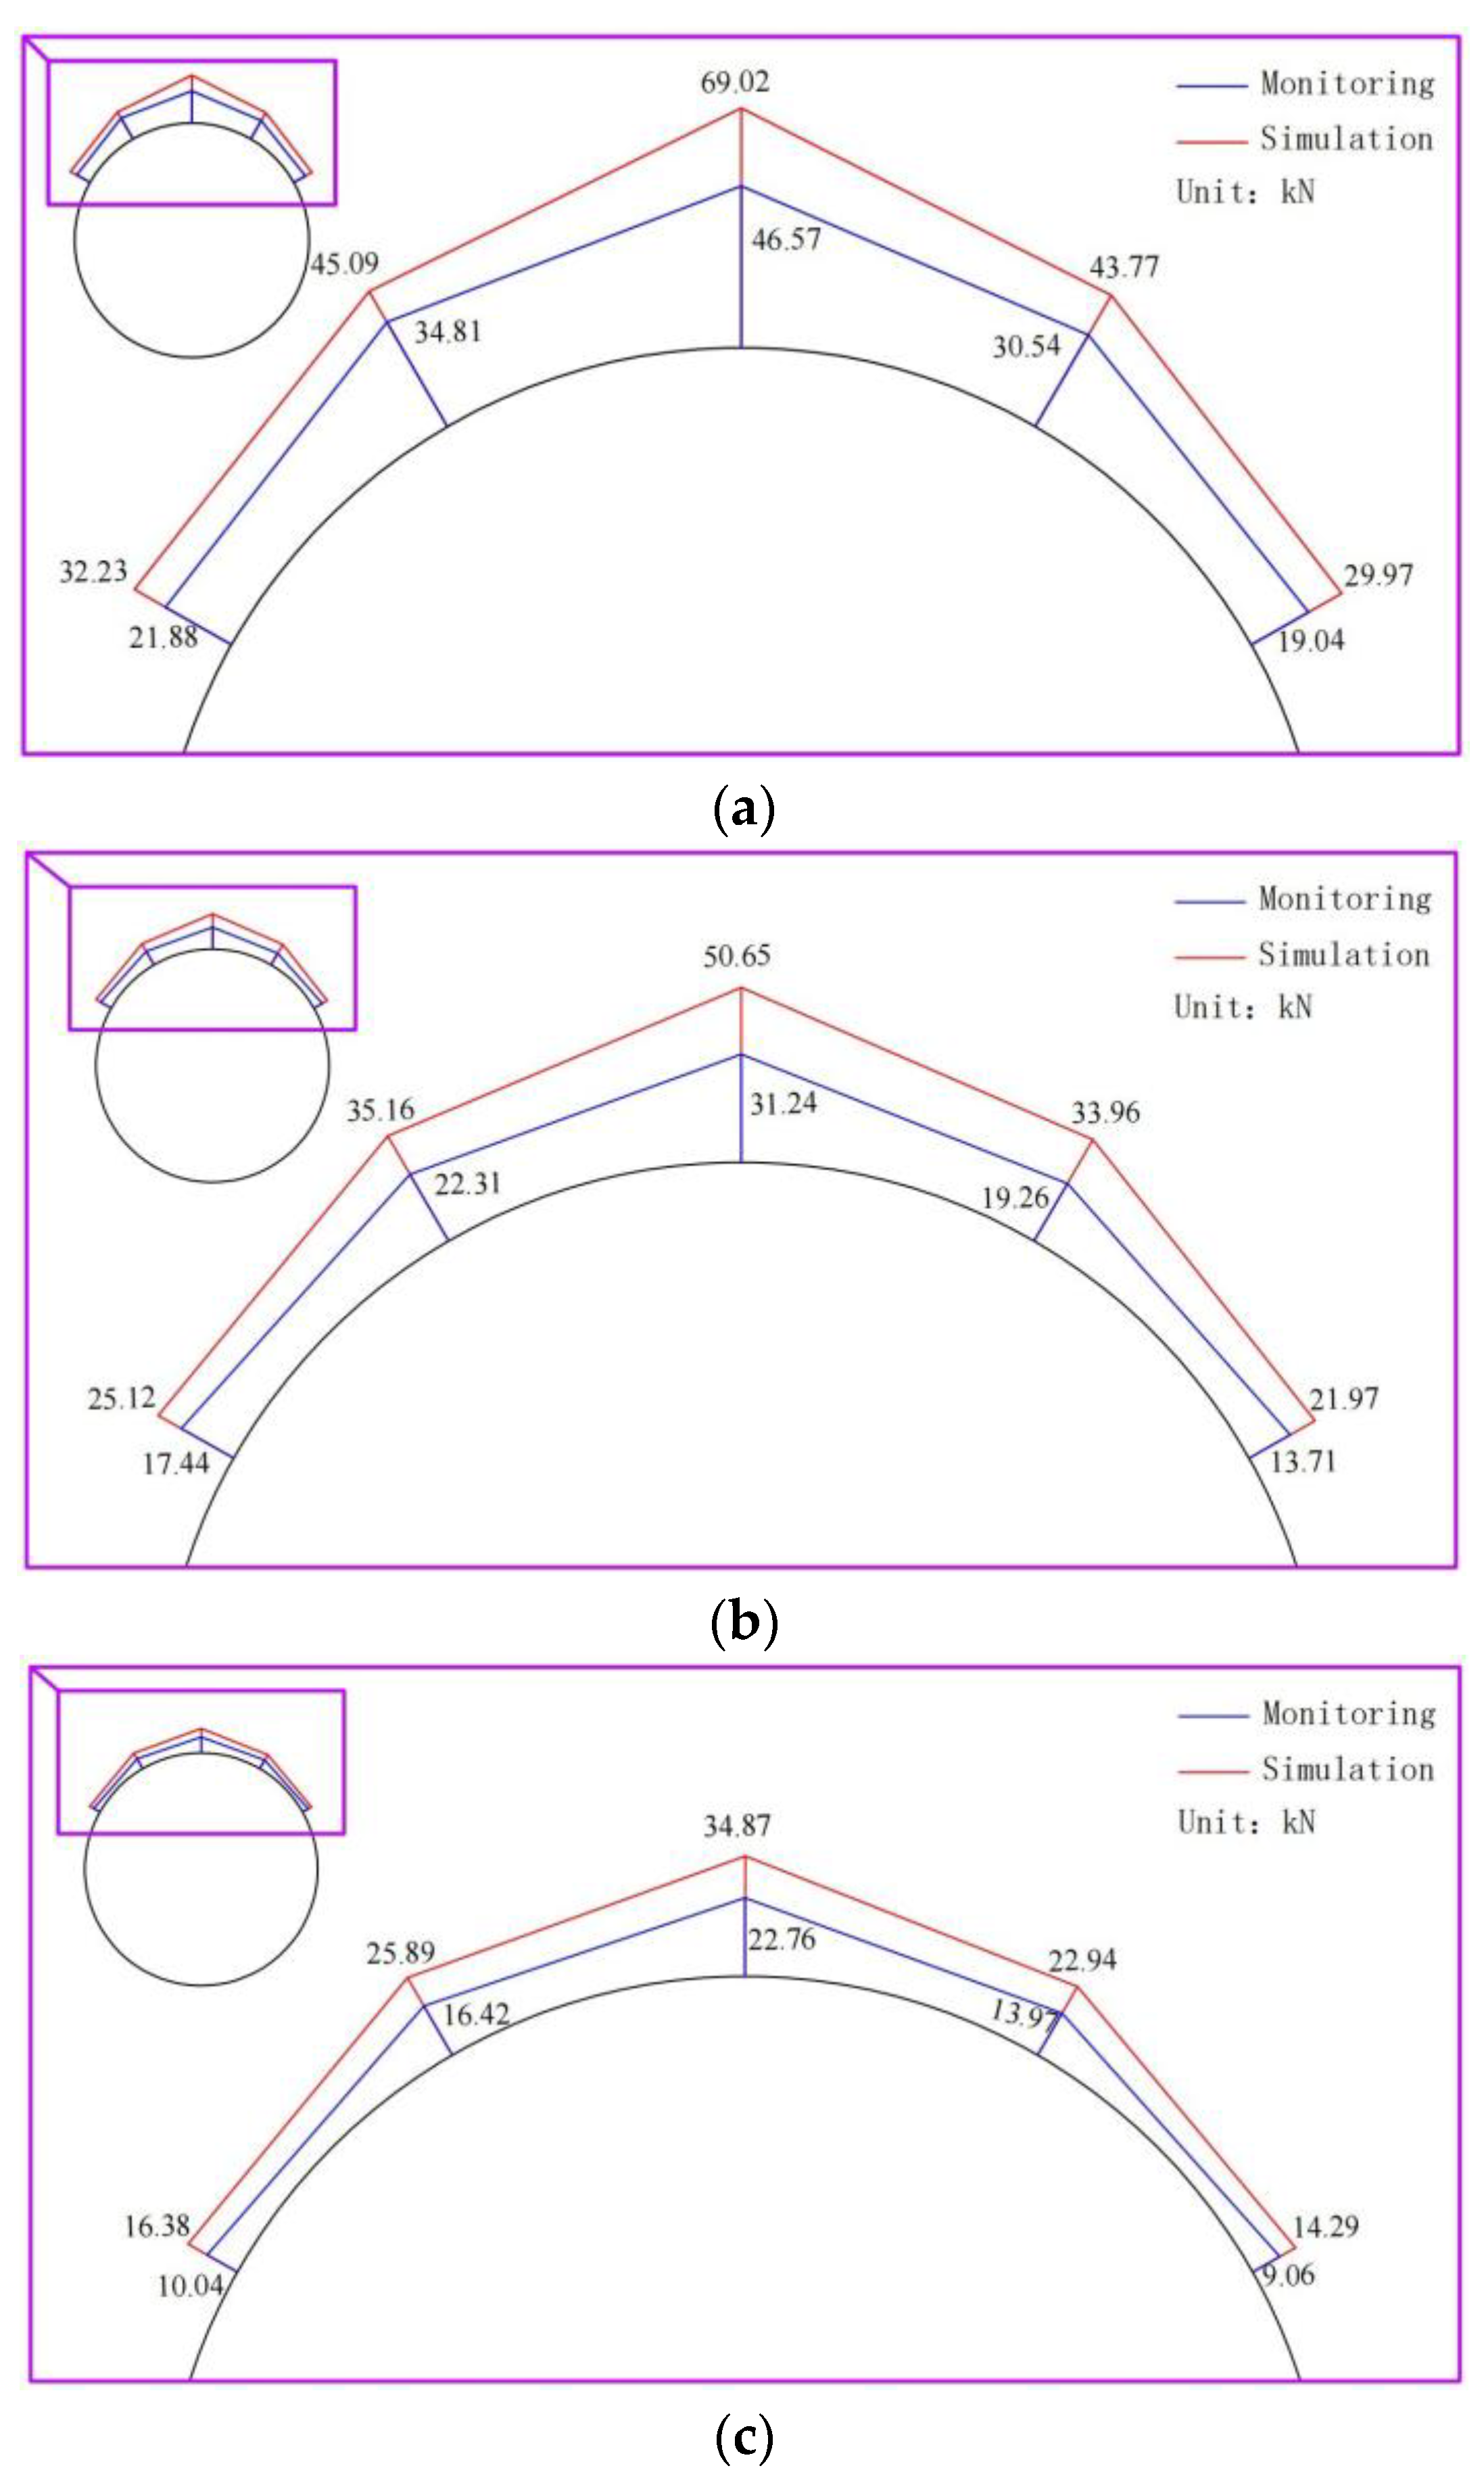
The axial forces measured at various positions of the steel arch supports are positive, indicating a tensile state. At the same monitoring point, the sensors at deeper depths register smaller anchor rod axial forces. Compared to sensors at greater depths at the same monitoring point, those near the crown record the highest values. For instance, at a depth of 0.5 m from the crown, the axial force is 69.02 kN; at 1.5 m, it is 50.65 kN, and at 2.5 m, it is 34.87 kN. This suggests a trend in which the axial force at 0.5 m is greater than that at 1.5 m, which is greater than that at 2.5 m. In addition, as the monitoring point transitions from the crown to the arch’s rib, the consistent values of the anchor rod axial forces on the same side exhibit a descending trend: the crown axial force surpasses the arch shoulder axial force, which exceeds the arch rib axial force.
(2)
A comparison of field monitoring data with numerical simulation results indicated that, at the same depth of 0.5 m, the observed axial forces predominantly range from 19.04 to 46.57 kN. The patterns in both datasets are broadly similar, though the actual monitoring outcomes are marginally lower than the simulated values. This suggests that the numerical simulation model and the chosen parameters for the surrounding rock lining are appropriate.

3.3. Performances as Built

A comparative analysis of numerical simulation and field monitoring test data determined that there are noticeable deformations while the results align closely. To rectify this, a strategy of “increased density of steel arch supports + augmented initial support strength and stiffness” is recommended. Based on the feasibility verification of this strategy under the current geological conditions, a preliminary support test will be undertaken in the weaker geological layers. Table 2 contains the specific details of the optimization strategy.
The optimized support scheme for the monitoring section was simulated using the finite element software FLAC3D.
Figure 11 indicates that the maximum deformation post-optimization is located at the crown, diminishing from 4.08 to 0.16 cm, signifying a decrease of roughly 96%. This reduction is substantial when compared to the original scheme. Hence, the optimized approach yields satisfactory results. In order to ascertain the effectiveness of the support method under similar geological settings, modifications were made to the geological parameters to affirm the suitability of this optimization strategy in more intricate and weaker geological contexts.
Figure 12 demonstrates that significant displacements occur at both the crown and the bottom of the structure under more complex and weaker geological conditions. The displacements at the crown and bottom decreased from 4.08 and 2.8 to 0.52 and 0.41 cm, respectively, representing approximately 87% and 84% reductions. This support scheme effectively provides safe support, indicating that this method is suitable for application in other engineering projects under similar geological conditions.

4. Conclusions

The soft and fractured strata can cause significant deformation of surrounding rock during tunnel excavation. This study uses Dali Section I of the central Yunnan Water Diversion Project, Construction Section 3, as its research background. Researchers adopted the field monitoring test method for the monitoring section. To further verify the accuracy of the field monitoring test, numerical simulation simulated the stress–strain changes in the surrounding rock during the excavation process of the monitoring section. The results of the field monitoring experiment were compared and verified with the results of numerical simulation, and the original support scheme was optimized to address the issue of significant deformation in fractured and soft rock layers during tunnel excavation. The primary conclusions are as follows:
(1)
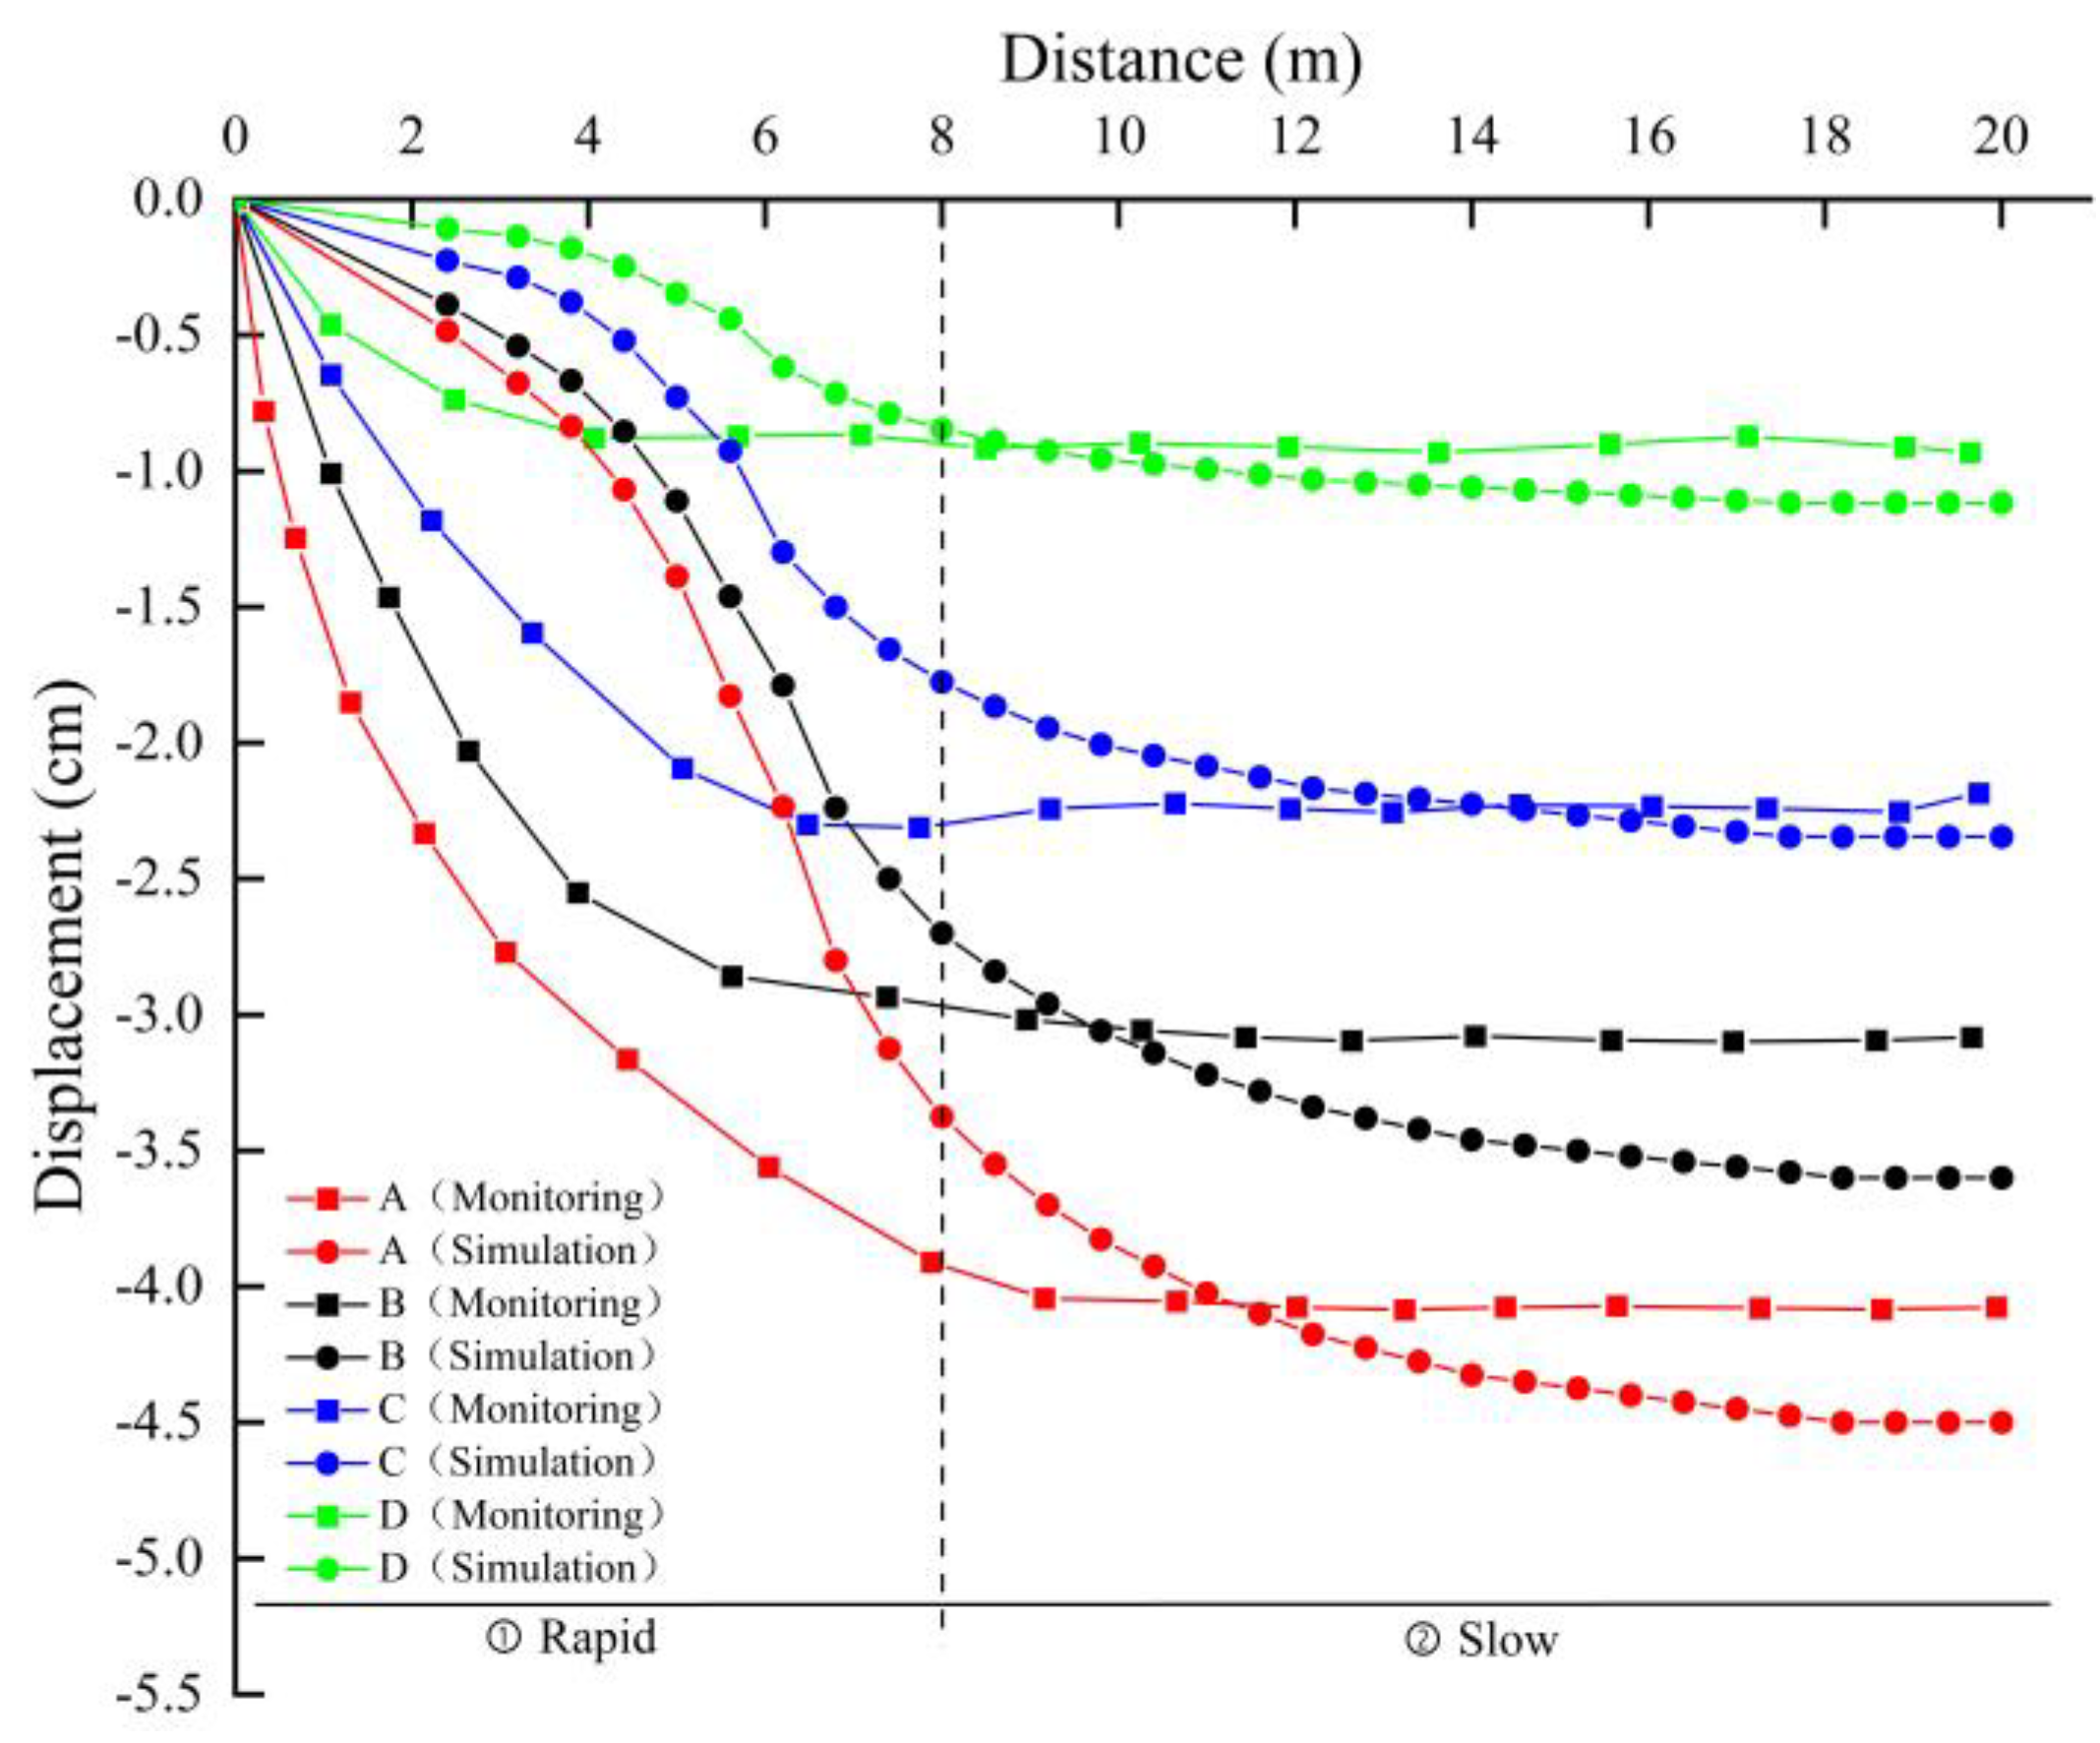
The stress variations in the monitoring test exhibited a pattern of a steep increase, followed by a gradual decrease with continuous excavation. In the first 8 m of excavation, there was a pronounced increase in stress, succeeded by a decelerated growth rate in the subsequent 12 m, ultimately stabilizing. This pattern suggests that the initial stress changes rapidly due to the stress release from tunnel excavation. As time progresses, the stress redistributes and gradually stabilizes.
(2)
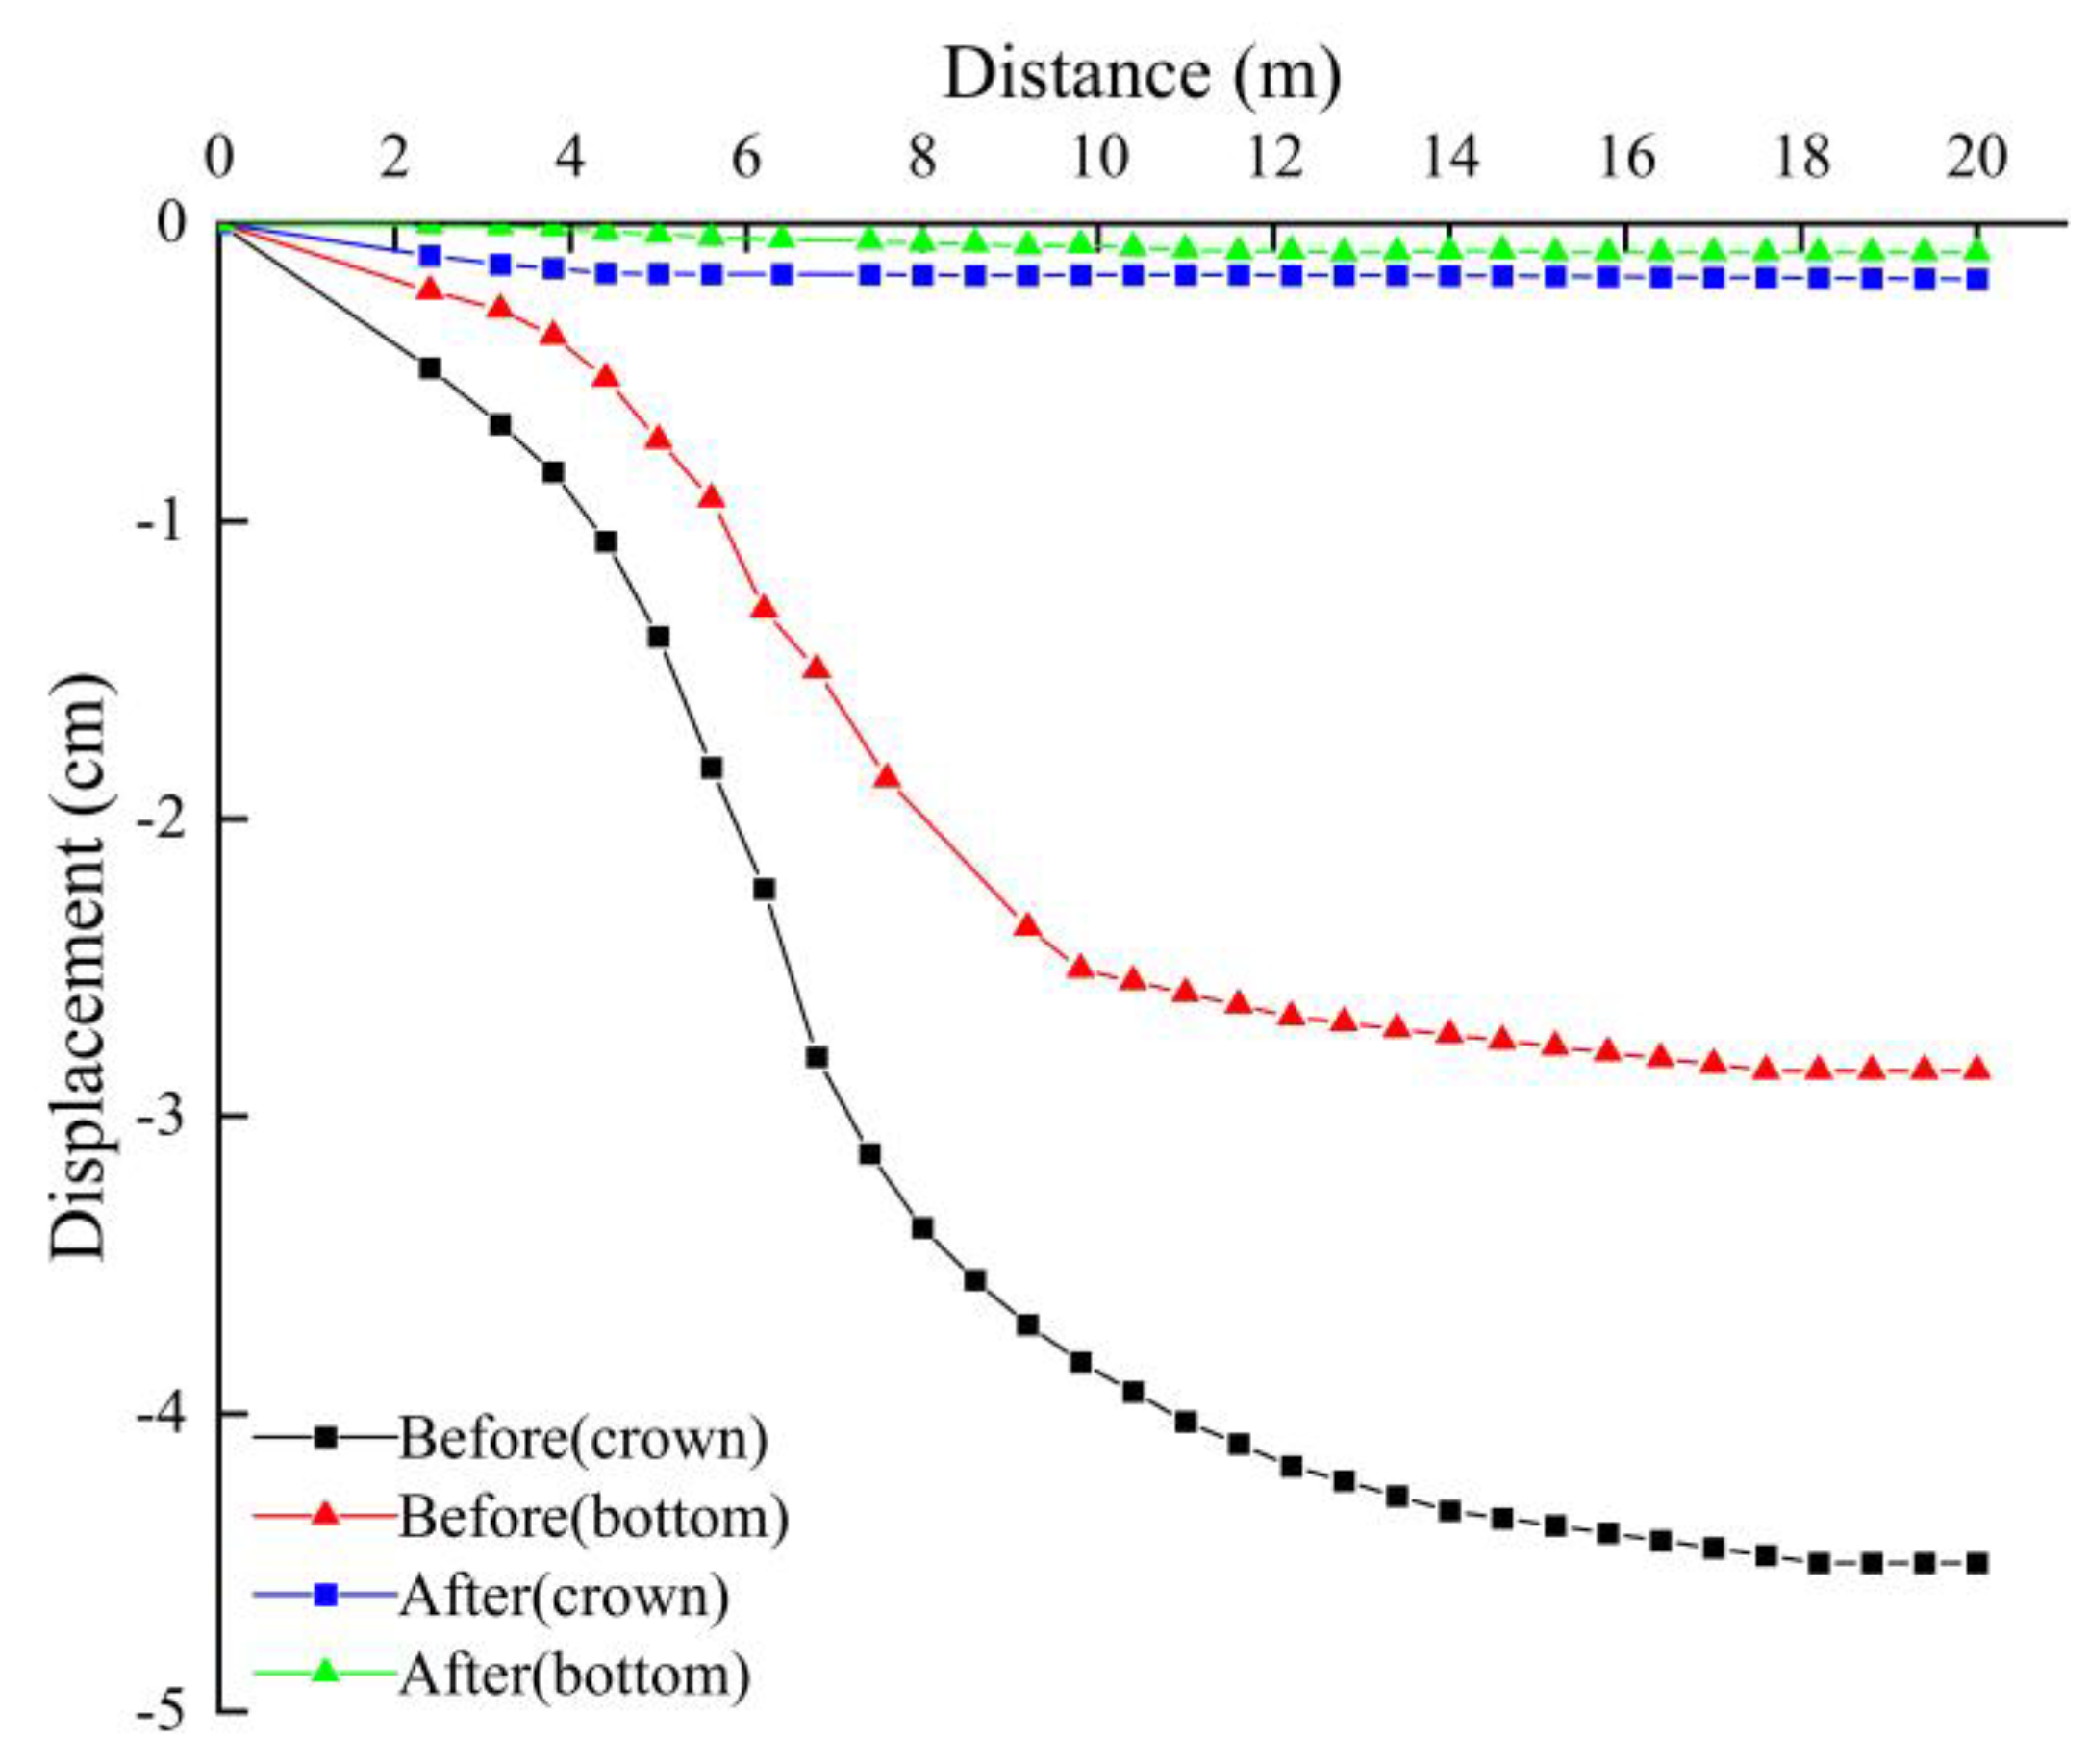
The deformation of the surrounding rock post-tunnel excavation was suboptimal. However, through the analysis of optimized support conditions, the simulated crown displacement was decreased to 0.16 cm, achieving a reduction of 96% relative to the original scheme. In softer and more intricate geological layers, the displacement was minimized to 0.52 cm, reflecting a reduction of 87%. This optimization scheme can enhance construction safety. Regarding the existing support system, the peak stress on the monitored steel arch was −18.92 MPa, suggesting compression. The optimization thus involved reinforcing the support with H150 steel arches in a closer arrangement. Since shotcrete support was not utilized during construction, monitoring and numerical simulation indicated that the axial force at the crown could attain 69.02 kN. Hence, in actual construction scenarios, anchor rods should be integrated promptly post-initial support, followed by shotcrete application to establish a comprehensive shotcrete support system.
The deformation of the surrounding rock is pivotal for tunnel construction safety. Field monitoring tests remain the most direct method to assess the stability of the surrounding rock. When paired with numerical simulation for comparative analysis, effective solutions to the problem of extensive deformation in the surrounding rock can be proposed. This dual-method approach offers protection and guidance for the safe construction of this tunnel and other analogous tunnels.

Author Contributions

Conceptualization, T.W. and H.L.; methodology, M.K.; software, B.Z.; validation, T.W., H.L. and J.S.; formal analysis, Y.L.; investigation, T.W.; resources, H.L.; data curation, T.W. and Y.Y.; writing—original draft preparation, T.W.; writing—review and editing, H.L.; visualization, T.W.; supervision, H.L.; project administration, M.K.; funding acquisition, M.K. All authors have read and agreed to the published version of the manuscript.

Funding

This research was funded by the Postgraduate Education Reform and Quality Improvement Project of Henan Province, grant numbers YJS2022JD02 and YJS2022AL006.

Institutional Review Board Statement

Not applicable.

Informed Consent Statement

Not applicable.

Data Availability Statement

The raw data supporting the conclusions of this article will be made available by the authors on request.

Conflicts of Interest

Authors Jixian Shen and Yingchun Li were employed by the company Henan Water Conservancy Investment Group Co., Ltd. The remaining authors declare that the research was conducted in the absence of any commercial or financial relationships that could be construed as a potential conflict of interest.

References

  1. Lai, H.P.; Zhao, M.K.; Liu, Y.Y.; Hong, Q.Y.; Huang, Z.P.; Shen, P.X. Dynamic mechanism of surrounding rock and support of large-section tunnel passing through soft-plastic loess layer based on measured date. J. Traffic Transp. Eng. 2023, 23, 115–131. (In Chinese) [Google Scholar]
  2. Yin, Z.Z. Application of Hydrostatic Leveling System in Metro Monitoring for Construction Deep Excavation above Shield Tunnel. Appl. Mech. Mate 2013, 333–335, 1509–1513. [Google Scholar] [CrossRef]
  3. Buchmayer, F.; Monsberger, C.M.; Lienhart, W. Advantages of tunnel monitoring using distributed fibre optic sensing. J. Appl. Geod. 2021, 15, 1–12. [Google Scholar] [CrossRef]
  4. Li, K.; Jia, C.; Di, S.T.; Zhang, J.P.; Yu, W.J. Monitoring Analysis on the Mechanical Properties for Tunnel Support System under Full Section Excavation. Chin. J. Undergr. Space Eng. 2018, 14, 860–868. (In Chinese) [Google Scholar]
  5. Chen, X.N.; Xiong, X.Y.; Liu, J.L.; Wang, J.C. Stability Analyses of Yuanbazi Tunnel Surrounding Rocks Based on Field Monitoring. Sci. Technol. Eng. 2017, 17, 311–314. (In Chinese) [Google Scholar]
  6. Zheng, Z.P.; Lei, Y. Structural Monitoring Techniques for the Largest Excavation Section Subsea Tunnel: Xiamen Xiang’an Subsea Tunnel. J. Aerosp. Eng. 2016, 30, B4016002. [Google Scholar] [CrossRef]
  7. Tan, Z.S.; Yu, Y.; Wang, M.N.; Yang, J.M. Experimental Research on Bolt Anchorage effect on Large-Section Deep-Buried Tunnel in Loess. Chin. J. Rock Mech. Eng. 2008, 08, 1618–1625. (In Chinese) [Google Scholar]
  8. Lai, H.P.; Xie, Y.L.; Yang, X.H. Mechanical characteristic of highway tunnel in loess. J. Chang. Univ. (Nat. Sci. Ed.) 2005, 6, 53–56. (In Chinese) [Google Scholar]
  9. MacPherson, W.N.; Silva-Lopez, M.; Barton, J.S.; Moore, A.J.; Jones, J.D.C.; Zhao, D.; Zhang, L.; Bennion, I.; Metje, N.; Chapman, D.N.; et al. Tunnel monitoring using multicore fibre displacement sensor. Meas. Sci. Technol. 2006, 17, 1180–1185. [Google Scholar] [CrossRef]
  10. Huang, M.L.; Xu, F.; Wu, Z.Y. Monitoring and Analysis of Influence of TBM Construction on Surrounding Rock Stability Under Urban Environment and Supporting Parameters Optimization. Chin. J. Rock Mech. Eng. 2012, 31, 1325–1333. (In Chinese) [Google Scholar]
  11. Yun, H.B.; Park, S.H.; Mehdawi, N.; Mokhtari, S.; Chopra, M.N.; Reddi, L.N.; Park, K. Monitoring for close proximity tunneling effects on an existing tunnel using principal component analysis technique with limited sensor data. Tunn. Undergr. Space Technol. 2014, 43, 398–412. [Google Scholar] [CrossRef]
  12. Slabej, M.; Grinč, M.; Kováč, M.; Decký, M.; Šedivý, S. Non-invasive diagnostic methods for investigating the quality of Žilina airport’s runway. Contrib. Geophys. Geod. 2015, 45, 237–254. [Google Scholar] [CrossRef]
  13. Kavvadas, M. Monitoring ground deformation in tunnelling: Current practice in transportation tunnels. Eng. Geol. 2005, 79, 93–113. [Google Scholar] [CrossRef]
  14. Oreste, P.; Oggeri, C. Tunnel static behavior assessed by a probabilistic approach to the back-analysis. Am. J. Appl. Sci. 2012, 9, 1137–1144. [Google Scholar]
  15. Khelalfa, H.; Aykan, B.; Boulmaali, H. Monitoring of tunnel rock mass deformations during provisional support stage: A case study. Rev. Min.–Min. Rev. 2022, 28, 1–23. [Google Scholar] [CrossRef]
  16. Hong, Z.Q.; Zhang, J.; Han, L.; Wu, Y.H. Numerical Study on Water Sealing Effect of Freeze-Sealing Pipe-Roof Method Applied in Underwater Shallow-Buried Tunnel. Front. Phys. 2022, 9, 794374. [Google Scholar] [CrossRef]
  17. Xu, J.B.; Jiang, P.; Zhu, S.Y.; Fan, R.; Zhou, Q.L.; Hu, J. Analysis of initial support effect of tunnel based on on-site monitoring and numerical simulation Method. Sci. Technol. Eng. 2020, 20, 2061–2069. (In Chinese) [Google Scholar]
  18. Chen, D.X.; Wang, L.G.; Sun, C.; Jia, C.Z.; Zheng, L.X. Investigation of the support constraint effect and failure instability law of tunnels constructed using the New Austrian tunneling method. Sci. Rep. 2022, 12, 5811. [Google Scholar] [CrossRef]
  19. Wang, L.M.; Li, F.Y.; Zhang, B.; Wen, B.; Yang, G. Mechanical property and stability of tunnel boring machine tunnel steel arch support field test. Sci. Technol. Eng. 2020, 20, 14223–14228. (In Chinese) [Google Scholar]
  20. Guo, H.Y.; Yan, Y.; Ding, H.; Liu, X.R.; Yang, M. Development and application of automatic monitoring equipment for differential deformation of element joint in immersed tunnel. Front. Phys. 2023, 11, 1134431. [Google Scholar] [CrossRef]
  21. Zhu, D.; Zhu, Z.D.; Zhang, C.; Dai, L.; Wang, B.T. Numerical simulation and field monitoring analysis for tunnel construction based on FLAC3D. Comput. Model. Eng. Sci. 2024, 138, 2445–2470. [Google Scholar]
  22. Xu, L.S. Numerical Simulation of Surrounding Rock Deformation and Grouting Reinforcement of Cross-Fault Tunnel under Different Excavation Methods. J. Chongqing Jiaotong Univ. (Nat. Sci.) 2009, 28, 528–530. (In Chinese) [Google Scholar]
  23. Lai, H.P.; Xie, Y.L.; Yang, X.H. Numerical Simulation for Soft-Weak Surrounding Rocks Tunnel Construction Mechanical Characteristics of Different Stress Field. Highway 2009, 10, 239–244. (In Chinese) [Google Scholar]
  24. Martinelli, D.; Insana, A. Application of a Finite-Discrete Element Method Code for Modelling Rock Spalling in Tunnels: The Case of the Lyon-Turin Base Tunnel. Appl. Sci. 2024, 14, 591. [Google Scholar] [CrossRef]
  25. Zhang, J.; Mei, M.; Wang, J.; Shang, G.; Hu, X.; Yan, J.; Fang, Q. The Construction and Application of a Deep Learning-Based Primary Support Deformation Prediction Model for Large Cross-Section Tunnels. Appl. Sci. 2024, 14, 912. [Google Scholar] [CrossRef]
  26. Li, Y.; Zou, Z. Numerical Investigation on the Influence of Super-Large-Diameter Shield Tunneling on Nearby Existing Metro Tunnels and the Protection Scheme. Appl. Sci. 2023, 13, 13179. [Google Scholar] [CrossRef]
Figure 1. Internal construction diagram of tunnel.
Applsci 14 02028 g001
Figure 2. Layout diagram of three types of sensors at different monitoring points.
Applsci 14 02028 g002
Figure 3. Diagram of installing earth-pressure box between arch and surrounding rock.
Applsci 14 02028 g003
Figure 4. Arrangement of anchor axial force measuring points along the depth (three sensors are inserted into the surrounding rock at depths of 0.5 m, 1.5 m, and 2.5 m).
Applsci 14 02028 g004
Figure 5. Installation diagram of a steel strain gauge welded on the inner side of the arch.
Applsci 14 02028 g005
Figure 6. ZZ direction stress cloud of section and excavation.
Applsci 14 02028 g006
Figure 7. Vertical displacement cloud of section and excavation.
Applsci 14 02028 g007
Figure 8. Comparison of simulation and monitoring curves during the process from sensor installation to 20 m excavation (earth-pressure cell).
Applsci 14 02028 g008
Figure 9. Comparison of simulation and monitoring curves during the process from sensor installation to 20 m excavation (steel strain gauge).
Applsci 14 02028 g009
Figure 10. Axial force distribution diagram of steel arch frame; (a) 0.5 m axial force distribution diagram; (b) 1.5 m axial force distribution diagram; (c) 2.5 m axial force distribution diagram.
Applsci 14 02028 g010
Figure 11. Displacement comparison of an optimized support scheme.
Applsci 14 02028 g011
Figure 12. Displacement comparison of complex weak stratum.
Applsci 14 02028 g012
Table 1. Physical and mechanical parameters of surrounding rock.
Media TypeDensity
(kg/m3)
Young’s Modulus
(Pa)
PoissonFriction
(°)
Cohesion
(MPa)
Upper mud shale22005 × 1090.35180.12
Lower limestone26601.5 × 10100.32250.3
Table 2. Comparison of support schemes.
Steel Arch TypeConcrete TypeThe Spacing of the Steel Arch
BeforeH125C25, 20 cm1 m
AfterH150C30, 35 cm0.5 m
Disclaimer/Publisher’s Note: The statements, opinions and data contained in all publications are solely those of the individual author(s) and contributor(s) and not of MDPI and/or the editor(s). MDPI and/or the editor(s) disclaim responsibility for any injury to people or property resulting from any ideas, methods, instructions or products referred to in the content.

