3. Methodology and Database
The selection and implementation of the relevant methodology for this research is critical for constructing the GIS spatial analysis model. The application of this methodology implies the integration of spatial datasets into detailed sub-models and overarching models for territorial analysis. The foremost aim is to execute a comprehensive examination of the territory, aligned with the defined objective.
The current study has formulated a unique research methodology that involves managing spatial databases and integrating them into various sub-models of spatial analysis. This methodology involves incorporating these databases into various spatial analysis sub-models, each distinct in its approach, including network analysis models and decision-making integration models. When analyzed in correlation, these sub-models reveal and suggest a complex spatial analysis model, specifically designed to identify areas with a high risk of road accidents.
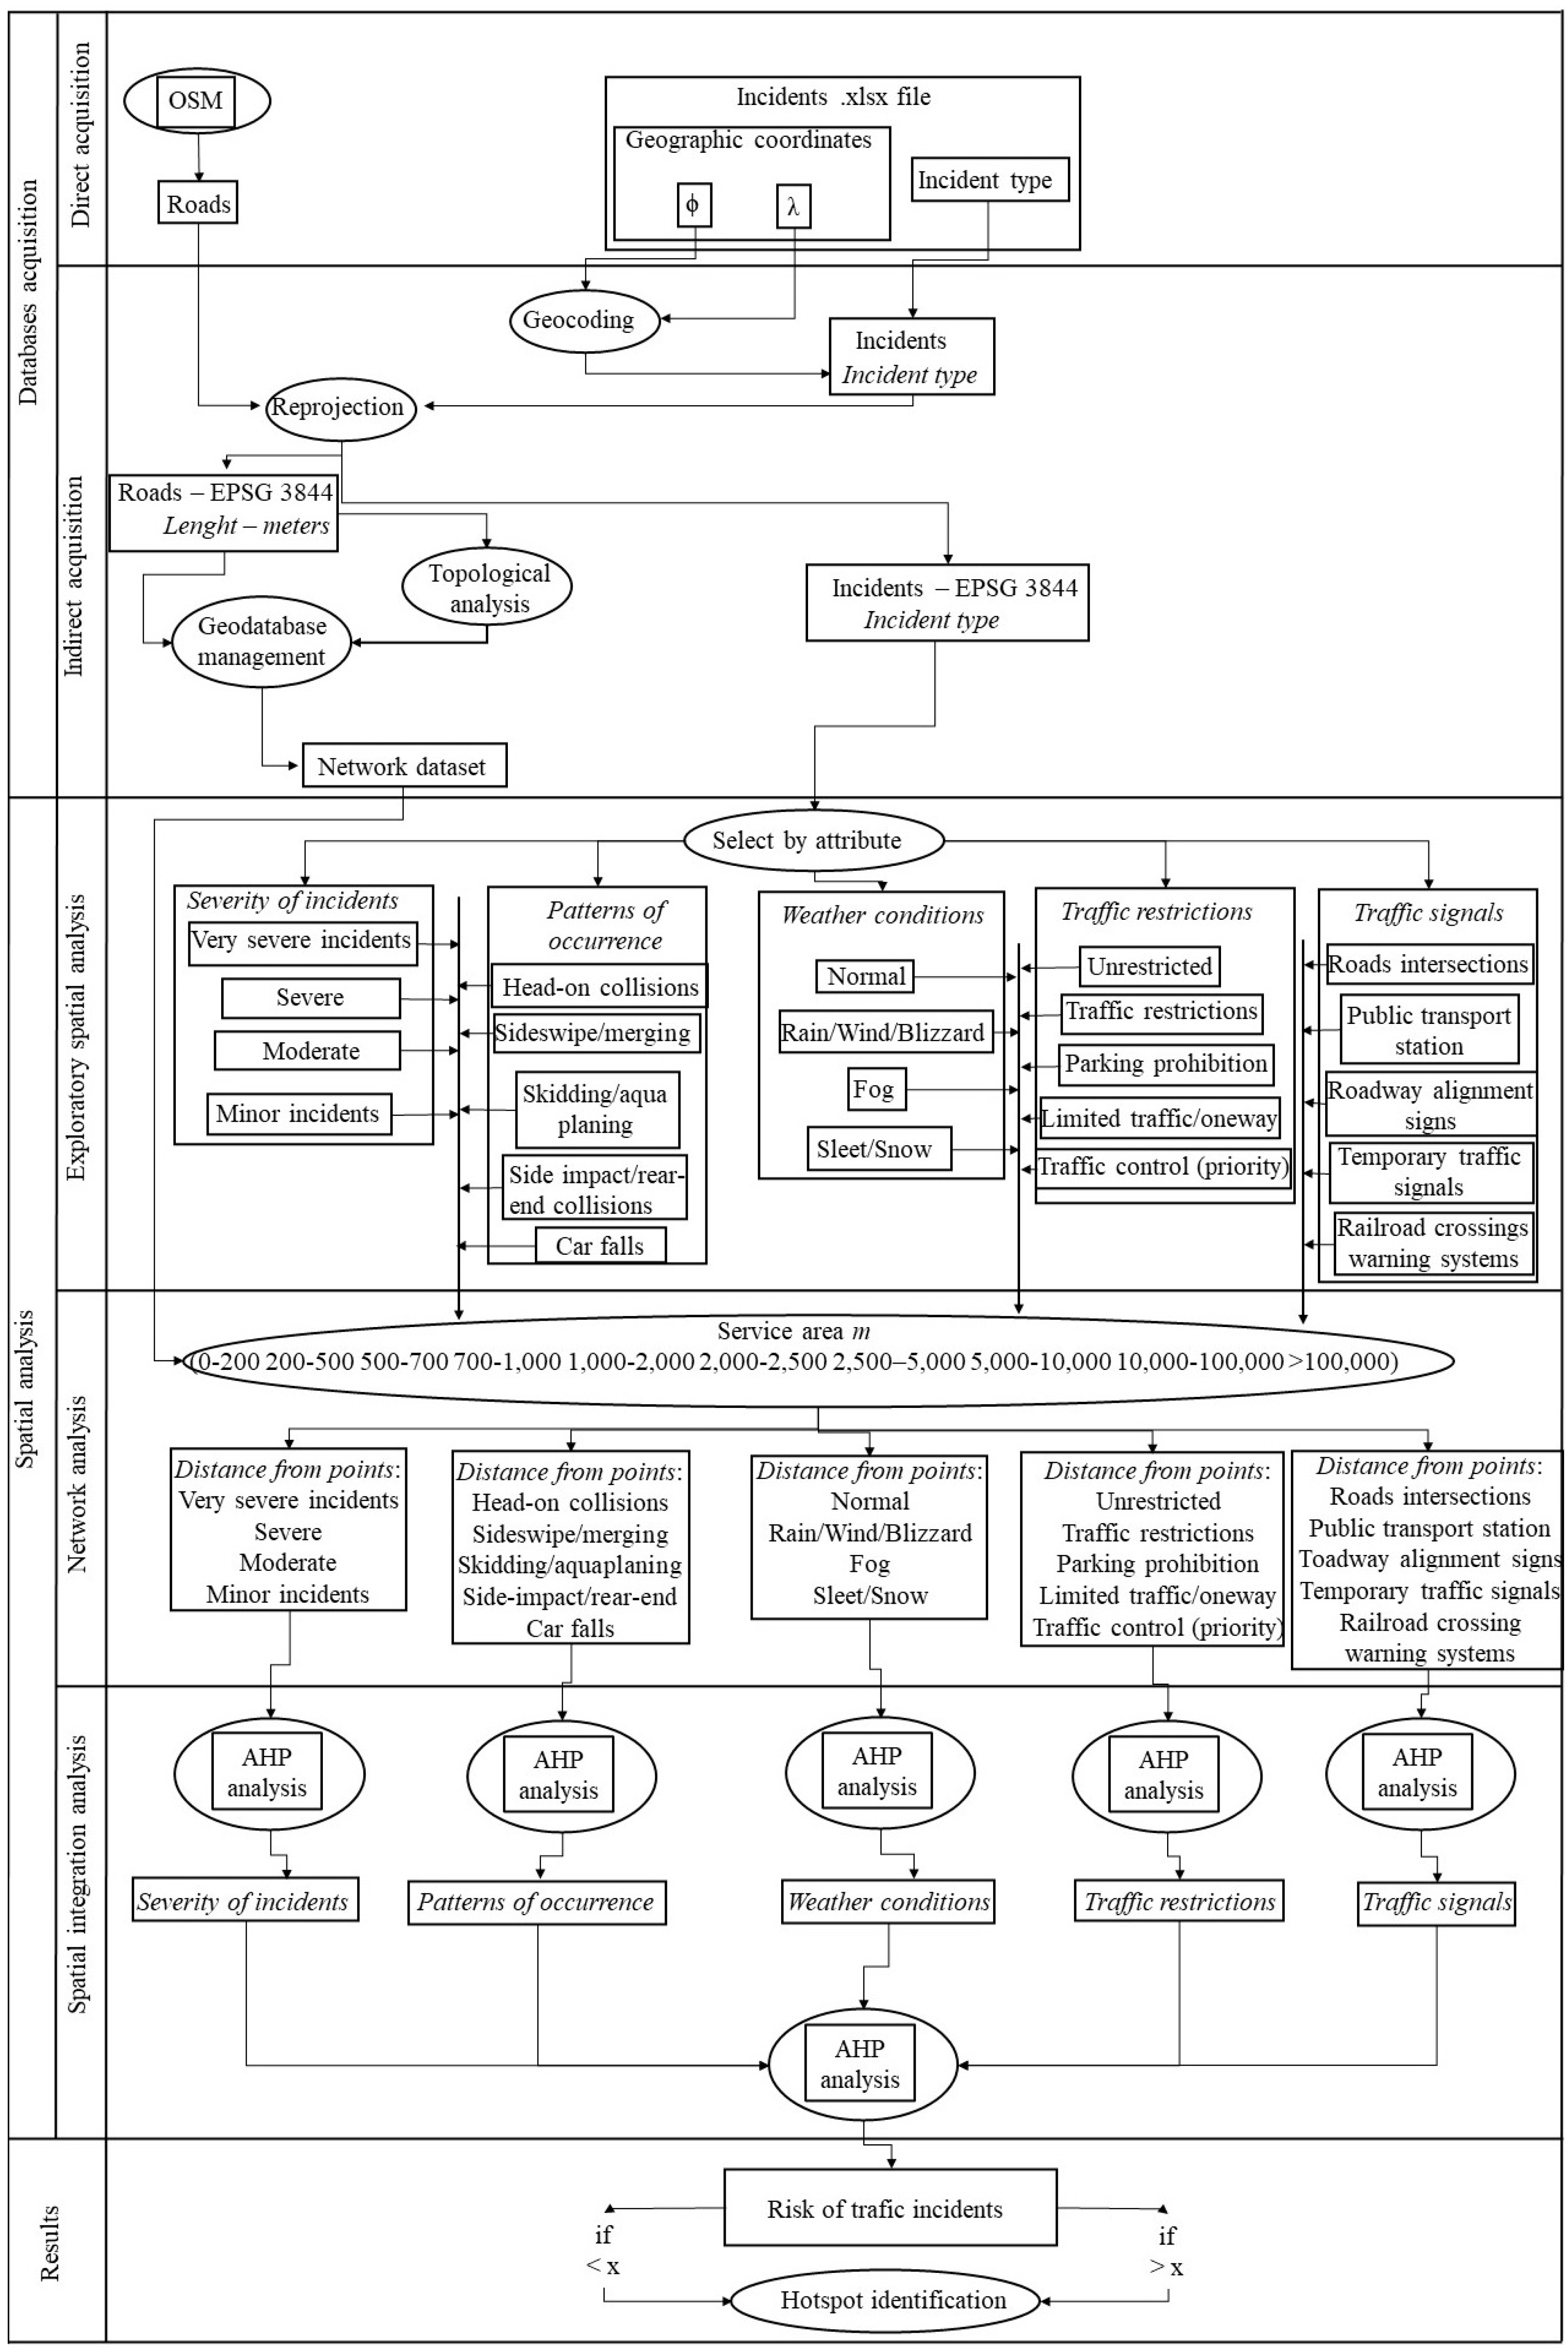
The proposed methodology is structured in three principal phases, as illustrated in
Figure 1. Initially, the first phase is dedicated to the acquisition of spatial databases for the creation of a spatial analysis model. The subsequent phase centers on the development of cohesive GIS spatial analysis models, which are then integrated with statistical models within the GIS framework, aiming to achieve a systematically validated outcome. Finally, the third phase is concerned with the presentation and examination of the results, with a focus on identifying territorial hotspots linked to road accidents. This involves differentiating areas based on their impact and risk levels, categorizing them as either high impact, high risk or low impact, low risk zones.
Each phase of the proposed methodological framework can be examined either as a standalone unit or as part of an integrated process within that stage, as well as in conjunction with successive stages. In this structure, each stage is designed to highlight and facilitate the development of the subsequent phase.
The initial phase of the methodology focuses on establishing the spatial databases, which are essential for the development of the entire model. This phase can be characterized by two primary methods of data acquisition: direct and indirect. In direct acquisition, raw databases are collected, including spatial databases like the national road network, which is directly downloaded from the OSM server, and alphanumeric databases sourced from Traffic Police Directorate of Romanian Police. These alphanumeric databases are typically in table format and contain detailed information on the geographical location of each incident, as well as the type of incident recorded. These data are crucial in completing the spatial database, serving not only for the spatial localization of traffic incidents but also for their systematic structuring and classification according to the model’s needs.
The construction of spatial databases, critical for the modeling process, occurs in the indirect acquisition phase. This phase is characterized by the integrated management of databases, leveraging the functionalities of geoinformation software (ArcGIS Pro 3.2.2). The geocoding process is employed to determine the spatial location of each incident (261,821 incidents between 2011–2022), using their geographical coordinates. This leads to the creation of a digital spatial database with point geometry in the WGS 1984 projection. Considering both the national road network and the incident point locations are in WGS 1984 projection, and the spatial analysis targets Romanian territory, it was decided to reproject these databases into the Romania-specific Stereographic 1970 projection system (code 3844). This reprojection is necessary due to the investigation’s focus on measuring risk in relation to the distance from incidents, with the metric scale of the Stereographic 1970 projection enabling more efficient integration into the network analysis database structures.
The key goal of the indirect acquisition phase is to develop a sophisticated Network Dataset structure. After confirming the topology of the road network, this structure merges the vector database with linear geometry (representing Romania’s road network) and the attribute database (detailing the length of each road segment in meters). Such integration establishes the essential spatial database that is vital for the formulation of the spatial analysis model.
The stage of spatial analysis represents the most elaborate segment of the methodology, offering a variety of techniques for territorial investigation. These techniques are integrated in a manner that accentuates the unique aspects and impacts of each factor analyzed in determining the final estimated potential risk of road accidents. The spatial analysis process is structured into three distinct sub-stages: Exploratory Analysis, Network Analysis, and Integration Analysis. The outcomes from these sub-stages, beyond providing spatial representations of the analyzed issues, also serve as databases for the subsequent sub-stage, thereby contributing to the refinement of the proposed model.
At the core of the spatial analysis is the determination of the distance to each type of traffic incident identified in the field. To enhance the understanding of each incident’s impact in the risk assessment process, an exploratory analysis of the traffic incident database was conducted. This involved consultations with representatives from traffic safety institutions (such as Traffic Police Directorate, local police, and others), leading to the classification of traffic incidents into five principal categories. These categories consider factors like the severity of incidents, their patterns of occurrence, weather conditions, traffic restrictions in the incident area, and the existing traffic signal system. This classification aims for a more precise integration into the model (
Figure 1).
The exploratory analysis involves conducting a basic spatial analysis, which includes querying the attribute table to generate point vector spatial databases for each type of incident. This results in 23 point vector structures, which then become the primary database for the next substage.
The network analysis leverages spatial databases obtained both indirectly and through exploratory spatial analysis to pinpoint areas within the territory that are significantly affected by traffic incidents. The methodology adopted for quantifying impact involves analyzing the distance to the incident site, with a greater distance indicating a lower impact and a shorter distance indicating a higher impact. This network analysis was conducted using ArcGIS Pro, specifically employing the Network Analyst module and the Service Area function.
The primary input databases for the Service Area spatial analysis consisted of the Network Dataset and the 23 point vector structures representing different types of traffic incidents. To assess the territorial impact, distance intervals were established as follows: 0–200 m, 200–500 m, 500–700 m, 700–1000 m, 1000–2000 m, 2000–2500 m, 2500–5000 m, 5000–10,000 m, 10,000–100,000 m, and over 100,000 m. These intervals were selected based on the specific characteristics and layout of Romania’s road network.
The integration of databases resulting from network analysis forms the core of the proposed methodology. This integration relies on applying Multi Criteria Decision Analysis (MCDA) techniques, which are designed to address spatial analysis challenges by weighting various contributing factors (in this case, the impact of different types of road incidents). Among the MCDA methods, the Analytic Hierarchy Process (AHP) was selected for implementation within a GIS environment. This is facilitated through the extAhp 2.0 extension within ArcGIS 10.8. AHP, a semi-quantitative method introduced by Saaty [
64], is utilized for weighting the analysis of databases.
The use of AHP simplifies the complexity of decision analysis into the formulation of a matrix. This matrix allows for the comparative analysis of pairs of spatial databases, each representing the influence of a singular parameter in the field. The objective is to collectively assess the integrated influence of all parameters, considering the significance of each within the analysis process. The hierarchy of parameter influence within the matrix is established based on predefined numerical values, as outlined in
Table 1 [
65]. This structured approach provides a systematic way to evaluate the combined impact of different factors influencing road incident outcomes.
Utilizing the Analytic Hierarchy Process (AHP) method can diminish the subjectivity involved in interpreting comparisons among databases used in the spatial analysis. This is achieved through the application of the Consistency Index (CI) and the Consistency Ratio (CR), as defined in Equations (1) and (2) [
65]. These metrics provide a structured framework to ensure more objective assessments in the comparative analysis of the databases.
where λ
max—maximum eigenvalue, n—position of the database in the row/column of the matrix, RI—random index [
65] (
Table 2).
The validation of the AHP matrix is determined by the Consistency Ratio (CR) index value. If the CR index for the matrix under analysis exceeds 0.1, it indicates a need to reassess the significance of the factors (spatial databases) within the matrix. Conversely, if the CR value is less than 0.1, the matrix is considered validated and can be utilized in spatial analysis. A CR value of exactly 0 indicates an ideal comparison of the databases within the matrix.
The implementation of the Analytic Hierarchy Process (AHP) in this study is divided into two principal components, each structured to minimize subjectivity and reduce potential errors in the spatial analysis process. The first component involves the spatial integration of databases, which represent distances to traffic incidents. This integration is based on AHP and reflects the categorization established during the exploratory analysis phase. The spatial databases are integrated according to their assigned importance in the initial classification, resulting in the creation of 5 distinct spatial databases: ‘Severity’ (very severe incidents, severe, moderate, and minor incidents), ‘Incident occurrence pattern’ (head-on collisions, sideswipe/merging, skidding/aquaplaning, side-impact/rear-end collisions, car falls), ‘Weather conditions’ (normal, rain/wind/blizzard, fog, sleet/snow), ‘Road Restrictions’ (unrestricted, traffic restrictions, parking prohibition, limited traffic/one-way systems, traffic control (priority)), and ‘Traffic signal system’ (intersections, public transport stations, roadway alignment signs (turn, sharp curve, or curve), temporary traffic signals (roadworks, detour), and railroad crossing warning systems).
The integrated geographical analysis phase concludes with the implementation of an Analytic Hierarchy Process (AHP) model, which assesses the 5 spatial datasets to determine the comprehensive risk of traffic incidents. Using a matrix that contains a restricted set of factors facilitates the task of assessing their relative significance. This approach not only reduces the probability of errors in the spatial analysis process but also improves the accuracy of the final output.
4. Results and Discussion
The spatial consolidation of databases, achieved through network analysis implementation, enables the assessment of road traffic incident risks. This is based on the integration of individual factors, such as the impact of incident types in relation to distance. These factors collectively contribute to defining the risk, while considering their varying levels of influence and significance in the broader context of understanding road traffic incidents.
To analyze the datasets, the Multi Criteria Decision Analysis (MCDA) technique, specifically the Analytic Hierarchy Process (AHP) method, was selected. Given the substantial number of databases involved in the analysis, totaling 23, and the need to eliminate subjectivity and redundancy, a decision was made to integrate these databases in two primary steps. The initial step requires conducting an integration analysis using the AHP method on databases with distinct characteristics, leading to the development of a spatial database that delineates the impact they generate. These databases were categorized into five major groups based on their characteristics: severity, mode of occurrence, weather conditions, traffic restrictions, and the influence of traffic signs on incident occurrences. This analysis involves implementing and examining the statistical coefficients of the matrices to determine the specific weights and importance of each factor. Subsequently, these weights are applied in the GIS environment for spatialization, resulting in five consolidated and unified outcomes.
The analysis of the spatial impact related to the severity of traffic incidents was conducted by implementing a matrix (
Table 3), which is structured around various factors: very severe incidents, severe incidents, incidents of moderate severity, and minor incidents.
The results from applying the matrix show two main findings. First, the matrix’s consistency is established at 6%, suggesting that the determination of factor importance is accurately executed. Second, the substantial influence of ‘very severe’ and ‘severe’ incidents is evident, constituting approximately 62% for the former and 22% for the latter in the overall result. In contrast, ‘moderate severity’ and ‘minor’ incidents hold a smaller role in assessing the spatial impact, together accounting for about 16%. This reduced significance inversely correlates with the prevalence of these incident types in Romania.
The spatial pattern of the cumulative impact of road traffic incidents (
Figure 2), based on their severity, predominantly aligns with European roads and the areas immediately surrounding urban centers adjacent to these road categories. A notable absence of major impact is observed on most national roads, despite them being common sites for traffic incidents. This is attributed to the pronounced influence of very severe and severe incidents in the spatial analysis, which are more frequent on European road categories. Particularly prominent is the E60 European road, especially the Ploiesti-Brașov sector, known for its heavy traffic. Also with high levels are E85 in Eastern Romania, specifically the Râmnicu Sărat-Bacău sector, and E70 in Western Romania, in the Mehadia-Timișoara sector, both characterized by high levels of vehicle traffic, with the latter noted for a significant presence of heavy traffic vehicles. The study also identifies high-impact areas in terms of severity around most large urban centers in Romania. This includes small and medium-sized urban centers and their peripheries along certain European road segments, such as the E68 sector from Sibiu to the Western border and the E60 from Cluj-Napoca to the Western border.
In relation to Romania’s total land area, the prominent proportion of regions falling within the impact category greater than 20,000 m, approximately 92.3%, is noteworthy. This is followed by the 5000–10,000 m category at about 5.8%, and the 1000–5000 m category at roughly 1.70%. The 200–1000 and 10,000–20,000 m categories constitute a smaller fraction, representing 0.07% and 0.03%, respectively, of Romania’s total surface area. These proportions underscore the limited spatial extent of areas with high impact, a phenomenon attributable to the geographic location of incidents. Often occurring on European roads and near major urban centers, these incidents are concentrated in areas that are relatively sparse compared to the overall study area.
The impact of different incident occurrence pattern of traffic incidents was examined based on the findings from the implementation of the AHP matrix. This analysis considered five factors: collisions, cars crossing, skidding/aquaplaning, crashes, and falls. The primary objective was to determine the significance of these factors in the spatial integration process (
Table 4). This approach helps in understanding the spatial distribution and relative weight of different types of traffic incidents across the study area.
During the assessment of the significance of factors contributing to the spatial identification of territorial impact based on the patterns of incidents (
Figure 3), collisions emerge as the most influential, accounting for 51%. They are followed by incidents involving vehicle rollovers and other types of collisions, which have weights of 27.4% and 10.8%, respectively. The lesser contributing factors are additional forms of collisions at 6.5%, and incidents resulting from falls at 4.3%. The pronounced importance of collisions and crashes significantly shapes the final analysis. Spatially, this is reflected in the relatively large proportion of impact areas within the 1000 to 10,000 m range, comprising 28.27% of the total.
Conversely, the proportion of impact areas exceeding 20,000 m sees a reduction to 47.69%, while the 200 to 1000 m range experiences a slight increase of about 1.27% compared to the preceding category. This distribution shift is attributed to the greater spatial dispersion of incidents within this category across Romania. Such incidents are recorded on a wide variety of road types, leading to a more dispersed spatial impact throughout the country.
The spatial analysis of impact categories distinctly reveals a high impact in most major urban centers such as Bucharest, Cluj-Napoca, Brasov, Iasi, Timisoara, Arad, Oradea, and Constanta. This is partly due to the dense local vehicle traffic that these cities generate daily. Additionally, the significant number of transit vehicles contributes to this impact, as these large urban centers are situated at the juncture of main traffic arteries and are frequently traversed by these routes (
Figure 3).
Regionally, the South Development Region and the Bucharest-Ilfov Region are significant for the high impact of traffic incidents recorded on the DN 1 and its immediate surroundings, coupled with the relatively high density of national roads in these areas. Similarly, the center of the Centre Region, specifically Alba County, and the western part of the North-West Region, are marked by a high density of roads and serve as key nodes within the national traffic network.
The study also examines incidents influenced by weather-related traffic conditions at the time of occurrence. The importance of weather factors was categorized into four groups: normal weather, rain/wind/blizzard, fog, and sleet/snow. To determine the significance of these weather conditions in the spatial integration process, an AHP matrix was developed. This matrix facilitates a direct comparison of the importance of these weather-related factors in influencing traffic incidents (
Table 5).
Discussions with traffic safety institution representatives led to the conclusion that the construction of the matrix for weather-related traffic incidents should prioritize the frequency and severity of accidents. Based on this principle, it became apparent that incidents occurring under normal weather conditions are most significant in this context. Incidents happening under specific weather conditions typically result in less severe damage and occur less frequently, hence their relative importance is lower compared to other incident types. The matrix analysis clearly reflects these insights: traffic incidents in normal conditions carry a very high importance of 62.8%, while those under rain/wind/blizzard conditions account for 22.1%. Incidents in fog and sleet/snow conditions have a considerably lower share, under 20%. The matrix’s 4% consistency further validates the relevance of the parameter comparisons, making it suitable for use in the analysis.
Spatially (
Figure 4), the impact intervals between 1000–10,000 m are prominent, with a cumulative weight of 23.25% and an approximately equal distribution among them. The interval with the smallest spatial extent, yet the highest importance, has a weight of 1.39%, indicating a relatively minor cumulative high impact at the national level in Romania.
Examining the spatial distribution (in
Figure 4) of the high-importance range of 200–1000 m, a significant feature is its presence primarily in large urban centers and along certain sections of European roads. Particularly, this includes the E60 segment between Cluj-Napoca and Oradea, the E85 segment from Buzău to Suceava, and the E70 segment spanning Caransebeș, Lugoj, and Timișoara. Additionally, there is a singular extension along the E60 segment between Bucharest, Ploiești, and Câmpina, all areas known for high levels of vehicle traffic.
Moreover, the first two impact intervals are found extensively on national roads. These include the DN15C segment from Praxia to Târgu-Neamț to Piatra-Neamț, the DN15B segment from Pipirig to Târgu-Neamț to Moțca, the DN15 segment between Piatra-Neamț and Bacău, the DN71 segment from Tărtășești to Pucioasa, and the DN18 segment from Borșa to Sighetu Marmației. These roads experience significant traffic due to their roles as connectors to European roads, motorways, or points along the country’s western border.
The comprehensive assessment of the impact of factors within the road restrictions category was conducted using a matrix comprising five elements: unrestricted, traffic restrictions, parking prohibition, limited traffic/one-way systems, traffic control (priority). After determining the influence values for each factor and applying the relevant calculation formulas, the matrix achieved a consistency rate of 7%. This rate is within the acceptable margin for analysis, permitting the use of the weighted results of these factors in the spatial analysis (
Table 6).
In the spatial analysis model, the assigned weights emphasize a significant weight, approximately 55.6%, for the factor representing accidents on road sections with unrestricted traffic. This weighting lends substantial representativeness to the matrix, whereas the combined weight of the other four factors totals less than 50%. When these calculated weights for each factor are integrated into the spatial analysis using the AHP matrix, a notable observation in terms of impact, as measured by spatial extent across Romania, is the prominence of the 1000–5000 and 5000–10,000 m impact intervals, which carry a weight of 9.75%. This is followed by the 10,000–20,000 m interval, with a spatial extent weight of about 33.73%. Conversely, the 200–1000 m impact interval has a very low weight of approximately 0.74%, underscoring the relatively minor importance of factors related to traffic restrictions (
Figure 5).
Regarding the spatial distribution of impact ranges, a significant impact is observed predominantly in large urban centers and county seats. Additionally, there is an extension of these impact ranges along certain major national roads. These particularly include roads that connect to European roads or heavily trafficked national roads, such as DN12 (Gheorgheni-Miercurea Ciuc-Cosmeni), DN15 (Piatra Neamt-Buhuși), and DN16 (Apahida-Reghin). Moreover, the high-importance impact intervals are distinctly prominent along the E60, especially in the section between Bucharest and Brasov. On other European roads, impact is mainly confined to hotspots, primarily within the inner areas of the localities they pass through.
The cumulative assessment of the impact of factors in the category of traffic signal systems necessitated the development of an AHP matrix. This matrix is based on the significance of five key factors: intersections, public transport stations, roadway alignment signs, temporary traffic signals (roadworks, detours), and railroad crossing. Notably, the intersection factor emerges as highly significant, accounting for 55.7% of the impact, followed by public transport stations and road curves with impacts of 20.8% and 12.2%, respectively (
Table 7).
Accidents taking place on road sections marked with signs for a road curve or railway level crossing contribute to a relatively low impact of 6.7% and 4.6%, respectively. This is also correlated with the lower number of accidents that occur on these specific roads (
Figure 6).
The spatial distribution of impact at the territorial level predominantly highlights major urban centers, as well as certain national and county roads. Remarkable among the national roads are the DN76 sector from Deva to Brad to Vârfurile to Oradea, the DN1C sector from Baia Mare to Livada, and the DN18 sector from Sighetu Marmației to Baia Mare. Additionally, the county road DJ186 from Săcel to Vadu Izei is ranked in the high impact category.
The second phase of the spatial analysis concentrates on modeling the cumulative impact of the five factor categories analyzed earlier: severity, mode of occurrence of traffic incidents, weather conditions, traffic restrictions, and the regulations induced by traffic signs. This analysis builds upon the aggregation of these factors, weighted according to their significance as determined by the implementation of the AHP matrix (
Table 8). The application of the final AHP matrix and its incorporation into the spatial analysis model enables the determination of the overall aggregated impact of traffic incidents recorded in Romania. This approach also facilitates the identification of risks they induce in the territory.
The matrix implementation underscores the significant contribution of incident severity, accounting for approximately 55.7%, which is notably higher compared to all other factors in the final analysis. Other factors like the mode of accident occurrence and meteorological conditions also hold substantial importance, with shares of 20.7% and 13.2%, respectively. This emphasizes their significant role both in the direct assessment of road accident casualties and in the economic repercussions of accident occurrences. Incidents arising from non-compliance with traffic restrictions and actions related to traffic signs hold less influence in the spatial analysis, contributing 6.6% and 4.8%, respectively.
The quantitative assessment of the spatial distribution of cumulative impact was focused primarily on the medium-high to very high impact categories because the other two categories, while covering extensive areas, do not present a significant risk to the territory, largely due to the spatial configuration of Romania’s road network. In this context, the medium-high impact category is particularly prominent, representing 61.6% of the total areas analyzed, followed by the high impact category at 37.7% and the very high impact category with a minimal percentage of 0.7%. Collectively, these percentages indicate a medium to high level of vulnerability across Romanian territory to road accidents.
However, the relatively small percentage of the very high impact class should not be neglected. Despite its limited spatial coverage, this category represents a very high vulnerability and potential risk, as it is primarily identified within inner-village areas and as hotspots on main routes or sections with intense and congested traffic. Therefore, its influence in the overall assessment of the risk posed by traffic accidents in Romania is extremely significant and carries a high potential for adverse effects.
In analyzing the spatial arrangement of the impact categories (
Figure 7), the medium, high, and very high categories are notably prominent. These categories are significantly extended along the E60 sector between Ploiești and Brasov, Cluj-Napoca to Oradea, and along the E81 sector between Pitești-Căciulata and Balota-Boița. The spatial analysis results indicate that the E85 sector from Râmnicu Sărat to Bacău and the E70 sector Orșova-Caransebeș-Lugoj are classified within the medium-high to very high impact categories.
Due to heavy traffic and their role as connector roads between major traffic arteries, certain sections of national roads also fall into the high territorial vulnerability categories. Notably, the DN15C sector from Buhuși to Târgu Neamț is highlighted. This road serves as a key access route from the cities of Piatra Neamț and Târgu Neamț to the E85 European road, thereby generating high traffic volumes. Additionally, the DN11 sector between Brașov and Târgu Secuiesc is significant, as it provides a crucial link between southern Transylvania and Moldova, further underlining the importance of these roads in terms of territorial impact and vulnerability.
The territorial analysis across Romania emphasizes the significance of motorways in determining vulnerability and risk related to traffic incidents. Notably, the positive effects of motorways such as the A3 Bucharest-Ploiesti, A1 Bucharest-Pitesti, and A2 Bucharest-Constanța are evident. These motorways handle a substantial volume of traffic moving from the Romanian capital towards the East, North, and South-East, thus improving travel conditions and reducing road incidents in their areas of influence. A similar beneficial impact is observed in the Transylvania region’s motorway sectors, including the A1 motorway sectors Boița-Holdea and Margina, the Western part of the country, A10 Sebeș-Câmpia Turzii, and A3 Târgu Mureș-Chețani and Câmpia Turzii-Nădășelu.
The spatial arrangement of traffic accident locations indicates a lower density of accidents near motorways, suggesting direct validation of the spatial analysis model in terms of both the methodology developed for this research and the accuracy of the AHP influence matrices for individual factors and their integration into the comprehensive spatial analysis model.
Further development of large road infrastructure and expansion of the motorway network in Romania could alter the current model’s configuration. This would likely lead to reduced traffic congestion and changes in the territorial vulnerability pattern, including a decrease in large vulnerability classes and spatial reconfiguration. For instance, ongoing work on the A3 motorway, particularly its extension on the Ploiesti-Brașov sector, is expected to reduce traffic incidents on the E60 European road in this sector, currently classified in the high to very high impact category. Likewise, continued construction of the A1 motorway, connecting Boița and Pitești, could reclassify the E81 Pitești-Căciulata and Balota-Boița sector into a lower cumulative impact class.
The planned network of motorways in Romania, aimed at extending westward and connecting to the European network, includes the A3 motorway extension to the Romanian border. This would likely divert traffic from the E60 road in the Cluj-Napoca-Oradea sector, reducing traffic incidents and their territorial impact. The A7 motorway, spanning Ploiesti-Bacău-Pașcani-Siret, would also significantly impact the spatial arrangement of impact classes and traffic incident density. Its construction would alleviate traffic on the high-impact E85 European road sectors. This beneficial effect is already observable in Bacau, where a completed section of the A7 motorway acts as a bypass, resulting in a modeled small to very small cumulative impact in the area, further validating the research approach.
The vulnerability associated with cumulative impact underscores problem areas in traffic incidents, inducing various risk categories/classes in the territory. The assessment and spatial identification of risks posed by traffic incidents, based on territorial vulnerability, are categorized into two major groups: high risk and very high risk.
Across the whole of Romania, 191 high-risk hotspots (with a cumulative impact of less than 1000 m) have been identified, predominantly along major European roadways that experience heavy traffic, both for personal travel and particularly for freight transportation. Furthermore, 44 very-high-risk hotspots (with a cumulative impact of less than 500 m) are geographically concentrated primarily in and around large cities or at the periphery of major urban centers. These areas are characterized as transit zones or traffic conglomerates, typically found on the outskirts of urban areas (
Figure 8).
Since the research methodology focuses on analyzing areas with a certain degree of impact, risk identification is based on a conditional query analysis of cumulative impact and territorial vulnerability. Within this framework, two specific conditioning formulas were devised, tailored to each risk category:
For identifying the final areas of high risk, the criteria stipulate that the cumulative impact must fall within the very high vulnerability category, and the surface area of the identified region should not exceed 1 km2. Conversely, for areas classified as very high risk, the approach involves reducing the impact area by half while maintaining its surface area. This decision aligns with Romanian road legislation, which defines road sectors prone to frequent accidents as 1 km sections where numerous accidents have occurred over successive years.
Following the application of these specifically developed equations to the underlying data, a total of 17 spatial areas across Romania were identified as falling into the high-risk category. Additionally, three areas with spatial extensions were categorized as very high risk.
The largest concentration of high-risk areas was found within the Bucharest municipality and its surrounding regions. The remaining high-risk areas are predominantly situated along European or national roads, with the more extensive areas located to the south of Focșani and south of Adjud (
Figure 9).
The very-high-risk category comprises a smaller number of areas, owing to the stricter criteria applied in the analysis. This category is notably characterized by three areas, which are situated within the urban boundaries of Bucharest and Brasov (
Figure 10).
The spatial analysis undertaken to assess the impact, vulnerability, and risk associated with traffic incidents underscores the territorial challenges primarily caused by the structure, density, and layout of Romania’s road networks. Additionally, these challenges are exacerbated by driver behavior in areas of high traffic volume, especially on European roads and on national or county roads that serve as connectors to major traffic arteries.
The methodology presented, through the development of the implemented model, requires a spatial database that can be readily obtained from open and freely available data sources. This includes spatial databases provided by international and national organizations, as well as alphanumeric databases accessible from governmental, non-governmental organizations, or public institutions. These sources are crucial for the decision-making process, such as determining factor importance in the AHP matrix, or for acquiring detailed information like the geolocation of traffic incidents. Given these considerations, the model demonstrates its applicability and effectiveness for spatial analysis in other similar case studies, returning highly validated results.
The study particularly emphasizes the significant cumulative impact of traffic incidents around large and medium-sized urban areas lacking bypasses or urban expressways, where general traffic is concentrated on main national and county roads, often exceeding their transport capacity.
Sections of European and national roads, as well as other routes near urban centers that are supplemented by motorways, tend to exhibit low impact along their lengths. This finding reinforces the need for further development of Romania’s motorway network and the prompt implementation of TNT CORE and TNT comprehensive requirements. Such advancements would lead to a decrease in accident numbers, a reduction in the severity of accidents, and improved traffic flow through increased transport capacity.


