
Research on a Highway Passenger Volume Prediction Model Based on a Multilayer Perceptron Neural Network

1
School of Energy Science and Engineering, Henan Polytechnic University, Jiaozuo 454003, China
2
Jiaozuo Engineering Research Center of Road Traffic and Transportation, Henan Polytechnic University, Jiaozuo 454003, China
*
Author to whom correspondence should be addressed.
Appl. Sci. 2024, 14(8), 3438; https://doi.org/10.3390/app14083438
Submission received: 18 March 2024
/
Revised: 7 April 2024
/
Accepted: 16 April 2024
/
Published: 18 April 2024
(This article belongs to the Section Transportation and Future Mobility)
Abstract
:The accurate prediction of highway passenger volume is very important for China’s transportation planning and economic development. Based on a neural network, this paper establishes a prediction model by using historical road passenger traffic and related influencing factor data, aiming to provide an accurate road passenger traffic prediction. Firstly, the historical highway passenger volume data and the factor data affecting passenger volume are collected. Then, a multilayer perceptron neural network is established by using SPSS software (PASW Statistics 18) to analyze the significant relationship between highway passenger volume and influencing factors. Then, through the training and verification of the model by MATLAB software (R2021a), the reliability of the prediction model is proved. Finally, the model is used to predict the passenger traffic volume in 2020–2022, and the actual passenger traffic volume is compared and analyzed. It is concluded that the highway passenger traffic volume decreased significantly in 2020–2022 due to various factors such as the epidemic situation and policies, which have had an impact on China’s economic development.
1. Introduction
With the continuous opening of high-speed rail and aircraft, the passenger capacity of many local highway buses has fallen off a cliff. Some of the bus load rates are less than 20%, some passenger lines have been forced to reduce multiple shifts, and there is a clear surplus of capacity. The opening of high-speed rail and aircraft is currently the biggest factor affecting highway passenger traffic.
Since the epidemic’s outbreak in 2019, it has had a huge impact on China’s highway passenger traffic. Therefore, it is necessary to analyze the reasons for the significant decline in highway passenger traffic in 2020. Accurate prediction of highway passenger traffic is the premise for analyzing the causes. The impact of the epidemic on China’s highway passenger traffic can be obtained by comparing and analyzing the predicted results.
In some countries around the world, railway lines are denser than highway lines, while in China, the density of the highway network is much higher than that of the railway network. Therefore, this paper selects highways as the research object. The reason for the significant reduction in highway passenger traffic in 2020 in China is not only the rapid development of high-speed rail and aircraft and the impact of the epidemic, but also a variety of other reasons. This paper will study the results predicted by the neural network model to find out what caused the significant reduction in highway passenger traffic in China.
The basic data of traffic scientific management are highway passenger volumes, and the output of highway transportation can be reflected by them. Their significance lies in improving the level of highway traffic management and establishing a smooth and efficient highway transportation system [1]. In recent years, the application of neural networks in the field of regression analysis and prediction has been paid more and more attention. Neural networks have strong predictive abilities, including nonlinear mapping and self-learning abilities and can deal with complex and nonlinear time series data, so they have significant advantages for passenger volume prediction. Highway passenger volume prediction methods mainly include the exponential smoothing method, elastic coefficient method, regression analysis method, gray prediction method, support vector machine, time series method, Markov prediction method, and so on [2]. For dealing with the problem of highway passenger volume prediction, these models can effectively mine the hidden rules in the data and improve the prediction accuracy. It is of great practical significance to predict the highway passenger volume scientifically and accurately, grasp the trend, characteristics, laws, and quantity of highway passenger transport development, and make full preparations for the developmental planning of highway networks, transportation development strategy, industry management, and decision-making [3].
The primary problem of highway passenger volume prediction is to extract the relevant influencing factors and establish a suitable model. Multiple influencing factors related to highway passenger volume jointly determine the absolute value and spatial distribution of highway passenger volume, such as population, gross domestic product, private car ownership, railway passenger volume, and air passenger volume. Therefore, extracting significant influencing factors and further analyzing their relationship with highway passenger volume is the premise of accurately predicting passenger volume. Secondly, in previous studies, other scholars have evaluated the performance of different models. Based on historical road passenger volume data, some commonly used models have been developed, including the binary logit model, multilayer perceptron, time series model, and BP neural network model. However, the prediction accuracy of existing models is largely affected by the size of historical traffic data sets. Therefore, if the model lacks sufficient data, it is impossible to make accurate predictions using historical data.
Highway passenger volume forecast is divided into two parts: (1) extracting significant influencing factors; (2) developing a BP neural network to realize the prediction. Therefore, it is feasible to develop a method based on a neural network to predict highway passenger traffic. Since highways have always been an important mode of transportation, this study takes the highway as the research object. In the first stage, the correlation analysis was carried out, and a multilayer perceptron algorithm was developed to extract the significant influencing factors of highway passenger volume. In the second stage, a BP neural network was developed to predict road passenger traffic. In order to overcome the limitations of existing road passenger volume prediction, the main contributions of this paper are as follows:
A total of 30 years of data from 1990 to 2019 were selected from the China Statistical Yearbook, providing a macro data set to predict road passenger traffic and overcome traditional limitations.
- (1)
- Taking population and GDP as positive influencing factors, and taking private car ownership, railway passenger volume, and air passenger volume as negative influencing factors, the significance analysis is carried out to obtain the main influencing factors and improve the prediction accuracy.
- (2)
- A BP neural network method for predicting highway passenger traffic volume is developed. This method is more accurate than the time series method, which can optimize the traffic structure and reduce the waste of traffic resources to provide more reliable information.
The rest of the content of this paper is arranged as follows: Section 2 reviews the relevant literature. Section 3 introduces the data source and collects and gives the influencing factors of highway passenger traffic. Section 4 introduces the basic principles of multilayer perceptron and BP neural network. Section 5 introduces the process of extracting significant influencing factors. In Section 6, a BP neural network is developed to predict the road passenger volume from 2020 to 2022. Finally, Section 7 concludes and analyzes the results.
2. Literature Review
Highway passenger volume was predicted by Zhang et al. [4] using a system dynamics model. The results show that the prediction accuracy of the SD model is lower than that of the LV-SD model. Xu and Cui [5] proposed a prediction method for a double hidden layer BP neural network based on the Softplus activation function, which improved the accuracy of the prediction model. While predicting the highway passenger volume in Gansu Province, Xu [6] compared it with the multiple linear regression prediction model. The results show that the BP neural network model is more accurate than the multiple linear regression model. Bao and Chen [7] verified the accuracy and convenience of the BP neural network prediction system and improved the accuracy of highway passenger freight prediction. Wang [8] studied the BP neural network model and concluded that the model had high accuracy. Based on the multilayer perceptron neural network and multiple regression fitting algorithm, Liu et al. [9] established a MLP model, linear regression model, and nonlinear regression model, respectively, for predicting PWV. The results show that the MLP model has better accuracy and adaptability in southern China. Yuan and Zhao [10] constructed the multilayer perceptron neural network prediction model for the connotation quality of inpatient medical records. The results show that the prediction efficiency of the multilayer perceptron neural network connotation quality prediction model is better, which can provide a theoretical reference for the connotation quality management of inpatient medical records. Xie et al. [11] used the multilayer perceptron neural network regression method to establish the weighted average temperature in Southwest China. The results show that the accuracy and stability of the MLP model in different elevations, latitudes, and seasons in Southwest China are better than those of the Bevis model and the GPT3 model. Tian and Wu [12] used discriminant analysis and multilayer perceptron neural network analysis method to establish models for personal credit and compare and evaluate them. The results show that the classification results of multilayer perceptron are better than those of discriminant analysis. Ma and Lu [13] proposed a fast classification method for multi-spectral images based on integrated fully connected multilayer perceptron. Comparing the classification results of each classifier for Landsat8 multi-spectral images, it is found that the integrated classifier is better. Tang and Mo [14] used SPSS and MATLAB software to establish multiple regression and BP neural network prediction models, respectively. The results show that the multiple linear regression prediction model is better than the BP neural network prediction model. Wang and Guo [15] used a PCA-BP neural network model to predict highway passenger traffic, and the analysis results prove the effectiveness of the improved PCA-BP neural network model for highway passenger traffic prediction. Aiming at the problem of highway passenger volume prediction, Ma et al. [16] proposed a BP neural network combined prediction model. Given the fuzzy and unpredictable characteristics of urban highway passenger traffic volume, Ma et al. [17] adopted an adaptive neural network model to analyze the relationship between urban highway passenger volume, population, and GDP. Based on the gray prediction, Hang et al. [18] introduced the BP neural network model to establish the GM (1,1) and BP neural network combination model. The research results of the above selected parts of the literature are summarized in a table, as shown in Table 1.
In summary, most of the above scholars use the neural network model to analyze and predict the highway passenger volume. The results show that the prediction effect of the neural network is still good. Therefore, this paper also uses a neural network to predict the highway passenger volume in China. Before forecasting, SPSS software is used to analyze the five relevant influencing factors of China’s passenger traffic volume: GDP, population, private car ownership, railway passenger traffic volume, and air passenger traffic volume based on multilayer perceptron, to improve the prediction accuracy. Finally, MATLAB is used to predict the road passenger traffic volume from 2020 to 2022 based on the passenger traffic volume data of China from 1990 to 2019, and then these are compared with the actual road passenger traffic volume from 2020 to 2022, and the reasons are obtained.
3. Data Source
3.1. Data Collection
This study collected highway passenger volume data from 1990 to 2022 in cities across the country from the China Statistical Yearbook and obtained a series of factor data that may affect passenger volume, including urban population, GDP, private car ownership, air passenger volume, and railway passenger volume. Considering the possible complex correlation between the influencing factors of highway passenger volume, it is necessary to select the appropriate influencing factors to facilitate data processing. The principles of data collection in this paper are as follows: (1) The collected influencing factors are all related to the highway passenger volume and have a significant impact. (2) Comparable and quantifiable influencing factors are collected. (3) It is required to easily collect the selected influencing factors from the China Statistical Yearbook. Most importantly, some non-quantifiable factors can be compared by converting them into quantifiable factors. In addition, subjective judgment and personal preference are non-quantifiable factors, so errors cannot be avoided. Therefore, this paper only selects quantifiable influencing factors to study the prediction of highway passenger traffic volume.
To improve the performance of the prediction model, this study performed feature selection, that is, selecting the most relevant features from all possible influencing factors, and collecting data as shown in Table 2.
Since the data in the statistical yearbook is aggregated from the entire district or city, the administrative region is used as the basic unit of data collection. The results showed that 3444 samples were collected from 280 administrative regions, including the 5 influencing factors and highway passenger volume. The record date is from 1990 to 2022, covering 33 years. Among them, the highway passenger volume is the only dependent variable, and the five influencing factors are the independent variables for predicting the highway passenger volume.
Figure 1 shows that the highway passenger volume peaked in 2012 and then declined. There are four reasons for this phenomenon:
- (1)
- Between 2008 and 2012, with the rapid development of information technology, people had a greater curiosity about the outside world. The logistics industry was also growing exponentially. However, since 2013, the popularity of motor vehicles and aircraft has gradually increased, and people’s curiosity about the outside world has declined.
- (2)
- Motor vehicles and aircraft have become the first choice for long-distance travel, reducing the number of transfers, and thus affecting the highway passenger traffic.
- (3)
- Relatively capable people were more willing to choose travel modes that take them further, such as high-speed rail and aircraft.
- (4)
- In 2008, the statistical standard of highway passenger traffic volume was changed to be measured annually, while the statistical caliber of highway passenger traffic in 2013 was more refined, taking into account more factors such as passenger vehicle type, passenger flow density, etc. The intelligent technology in the transportation industry could also count and analyze road passenger traffic data more accurately. With the improvement of people’s economic level, more and more families chose to buy private cars, which reduced the demand for road passenger transport.
3.2. Method
After the data collection is completed, the multilayer perceptron neural network method is first used to analyze the significance of the five influencing factors. Then, the data are filtered according to the significance results. Finally, the BP neural network method is used to predict the highway passenger volume based on the filtered data.
4. Neural Network Analysis
Firstly, data sets such as road passenger flow and influencing factors are collected. Then, a multilayer perceptron is developed to analyze the significance of influencing factors. Finally, a BP neural network is developed to predict road passenger flow. All prediction models are evaluated by calculation errors, including goodness of fit (R2), mean absolute error (MAE), mean relative error (MBE), and root mean square error (RMSE).
4.1. Multilayer Perception
Multilayer perceptron (MLP) is a classical artificial neural network model. It consists of multiple neuron layers, each of which is completely connected to the previous layer. The input layer of MLP accepts the input data, then performs information processing and feature extraction through a series of hidden layers, and finally generates the corresponding results in the output layer. Each neuron has a set of weights and biases, and the input is weighted and summed by a nonlinear activation function to produce the output. Since MLP has a multilayer structure and a nonlinear activation function, it can learn and represent complex nonlinear relationships. Therefore, MLP is widely used in predictive analysis, regression, classification, and other issues. Training MLP usually uses a back propagation algorithm, which adjusts the weights and biases in the network by minimizing the loss function, so that the network can approximate the expected output of the sample [19,20].
In summary, multilayer perceptron is a model based on an artificial neural network, which performs information processing and feature extraction through multiple neuron layers, and is suitable for a variety of machine learning and data analysis tasks. The most basic artificial neural network and deep learning models are based on feedforward neural networks, which contain multilayer perceptron. It consists of an input layer, several hidden layers and an output layer. The information is transmitted from the input layer to the output layer after the hidden layer processing, and the information can only flow in one direction.
In the feedforward neural network, each neuron takes the output values of all neurons in the previous layer as input values, and the weighted sum of these input values is nonlinearly transformed by an activation function. The neuron connection weights between the layers are automatically learned during the training process. Feedforward neural network is widely used in classification, regression, image recognition, speech recognition, and other fields. Its training and reasoning are based on existing data.
4.2. BP Neural Network
The BP neural network is composed of an input layer, hidden layer, and output layer. It is a multilayer neural network with error back propagation [4,5]. BP neural network can learn the mapping relationship between input and output because it uses the back propagation algorithm to train the network. In the training process, the input data are first transmitted to the input layer of the network, and then the output value is obtained by feedforward calculation. The network output is compared with the expected output, and the error is calculated. Then, the error is back-propagating from the output layer to the input layer, and the connection weights in the network are adjusted to minimize the error. This process of adjusting weights uses a gradient descent algorithm to update the weights by calculating the partial derivatives of each layer of neurons.
After the training of the BP neural network is completed, it can be used to predict or classify new input data. It can be applied to fields such as pattern recognition, data mining, artificial intelligence, and so on. It should be noted that the BP neural network may be plagued by over-fitting problems, and appropriate network structure design and regularization methods are needed to avoid over-fitting and achieve better generalization performance.
The specific process is as follows: The data information is transmitted to the neural network, and a processing method is selected from the input layer and the result is transmitted to the hidden layer. The number of hidden layers can be one or more. If the input problem is different, the hidden layer is also different. The information processed by the input layer is then transmitted to the hidden layer. By processing the information of the hidden layer, the obtained information is transmitted to the output layer, and finally the output layer processes and outputs the results. If there is a deviation between the output result and the expected output, the error is propagated backward from the output layer, and the network connection weights and thresholds of the output layer, the hidden layer, and the input layer are updated. The forward propagation is repeated to calculate the output and adjust the reverse error until the output value meets the desired output [21,22].
In Figure 2, are the input values of the BP neural network, are the predicted values of the BP neural network, and are the weights of the BP neural network. The BP neural network can be regarded as a nonlinear function. The input value is the independent variable of the function, and the output value is the dependent variable of the function. When the number of input nodes is and the number of output nodes is , the BP neural network expresses the function mapping relationship from variables to variables. The BP neural network can make the network have associative memory and predictive ability only by training the network first. The training steps of BP neural network are as follows:
- (1)
- Network initialization. According to the input sequence , the number of network input layer nodes , the number of hidden layer nodes , and the number of output layer nodes are determined. The connection weights and between the input layer, the hidden layer, and the output layer neurons are initialized. The hidden layer threshold and the output layer threshold are initialized, and the learning rate and neuron activation function are given.
- (2)
- Hidden layer output calculation. According to the input vector , the connection weight between the input layer, the hidden layer, and the hidden layer threshold , the hidden layer output is calculated.In Equation (1), is the number of hidden layer nodes, and is the hidden layer activation function. This function has a variety of expressions. The function selected in this paper is sigmoid:
- (3)
- Output layer input calculation. According to the hidden layer output , the connection weight and the threshold , the BP neural network prediction output is calculated.
- (4)
- Error calculation. According to the network prediction output and the expected output , the network prediction error is calculated.
- (5)
- Weight update. According to the network prediction error , the network connection weights and are updated:In the formula, is the learning rate.
- (6)
- Threshold update. The network node threshold is updated according to the network prediction error .
- (7)
- It is determined whether the algorithm iteration ends, if not, then the function returns to step (2).
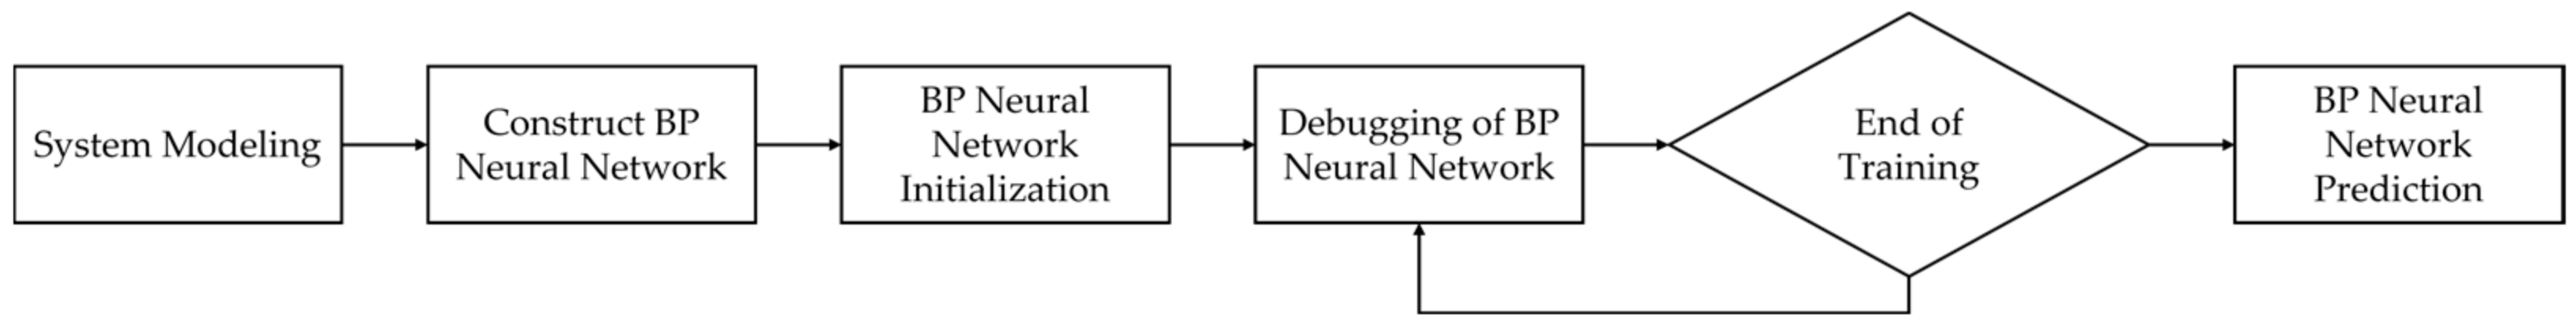
Based on the above steps, the algorithm of BP neural network is obtained, as shown in Figure 3.
4.3. Evaluation Index
In order to better evaluate the bias of the prediction results and evaluate the performance of the prediction methods, this study calculated four and indicators. They are defined by Equations (9)–(12), respectively.
Among them, and represent the predicted road passenger volume and the actual road passenger volume, respectively, represents the mean value of all actual values, is the number of predicted samples. is the coefficient of determination. Both and represent the degree of deviation between the actual road passenger volume and the predicted road passenger volume. has great advantages in evaluating the performance of the regression model, because it is very sensitive to large errors and can reflect the overall error of the model prediction well.
5. Multilayer Perceptron Saliency Analysis
In this paper, the multilayer perceptron neural network model is used to analyze the significance of highway passenger traffic. The fitting ability and generalization ability of the model are improved by adjusting the network structure and parameters. The historical data is used to train and verify the model, and the saliency analysis performance of the multilayer perceptron is evaluated. The experimental results show that the model can be well applied to the significance analysis of highway passenger traffic [23,24,25,26]. The architecture of the SPSS model is set as a hidden layer. The minimum number of neurons in the hidden layer is 1, and the maximum is 50. The model performs countless iterations, and the operation result is always the least important railway passenger volume. Finally, this paper selects the operation results when the hidden layer neuron is 4, because the importance gap between the influencing factors in this case is obvious, and the importance value of railway passenger volume is the smallest.
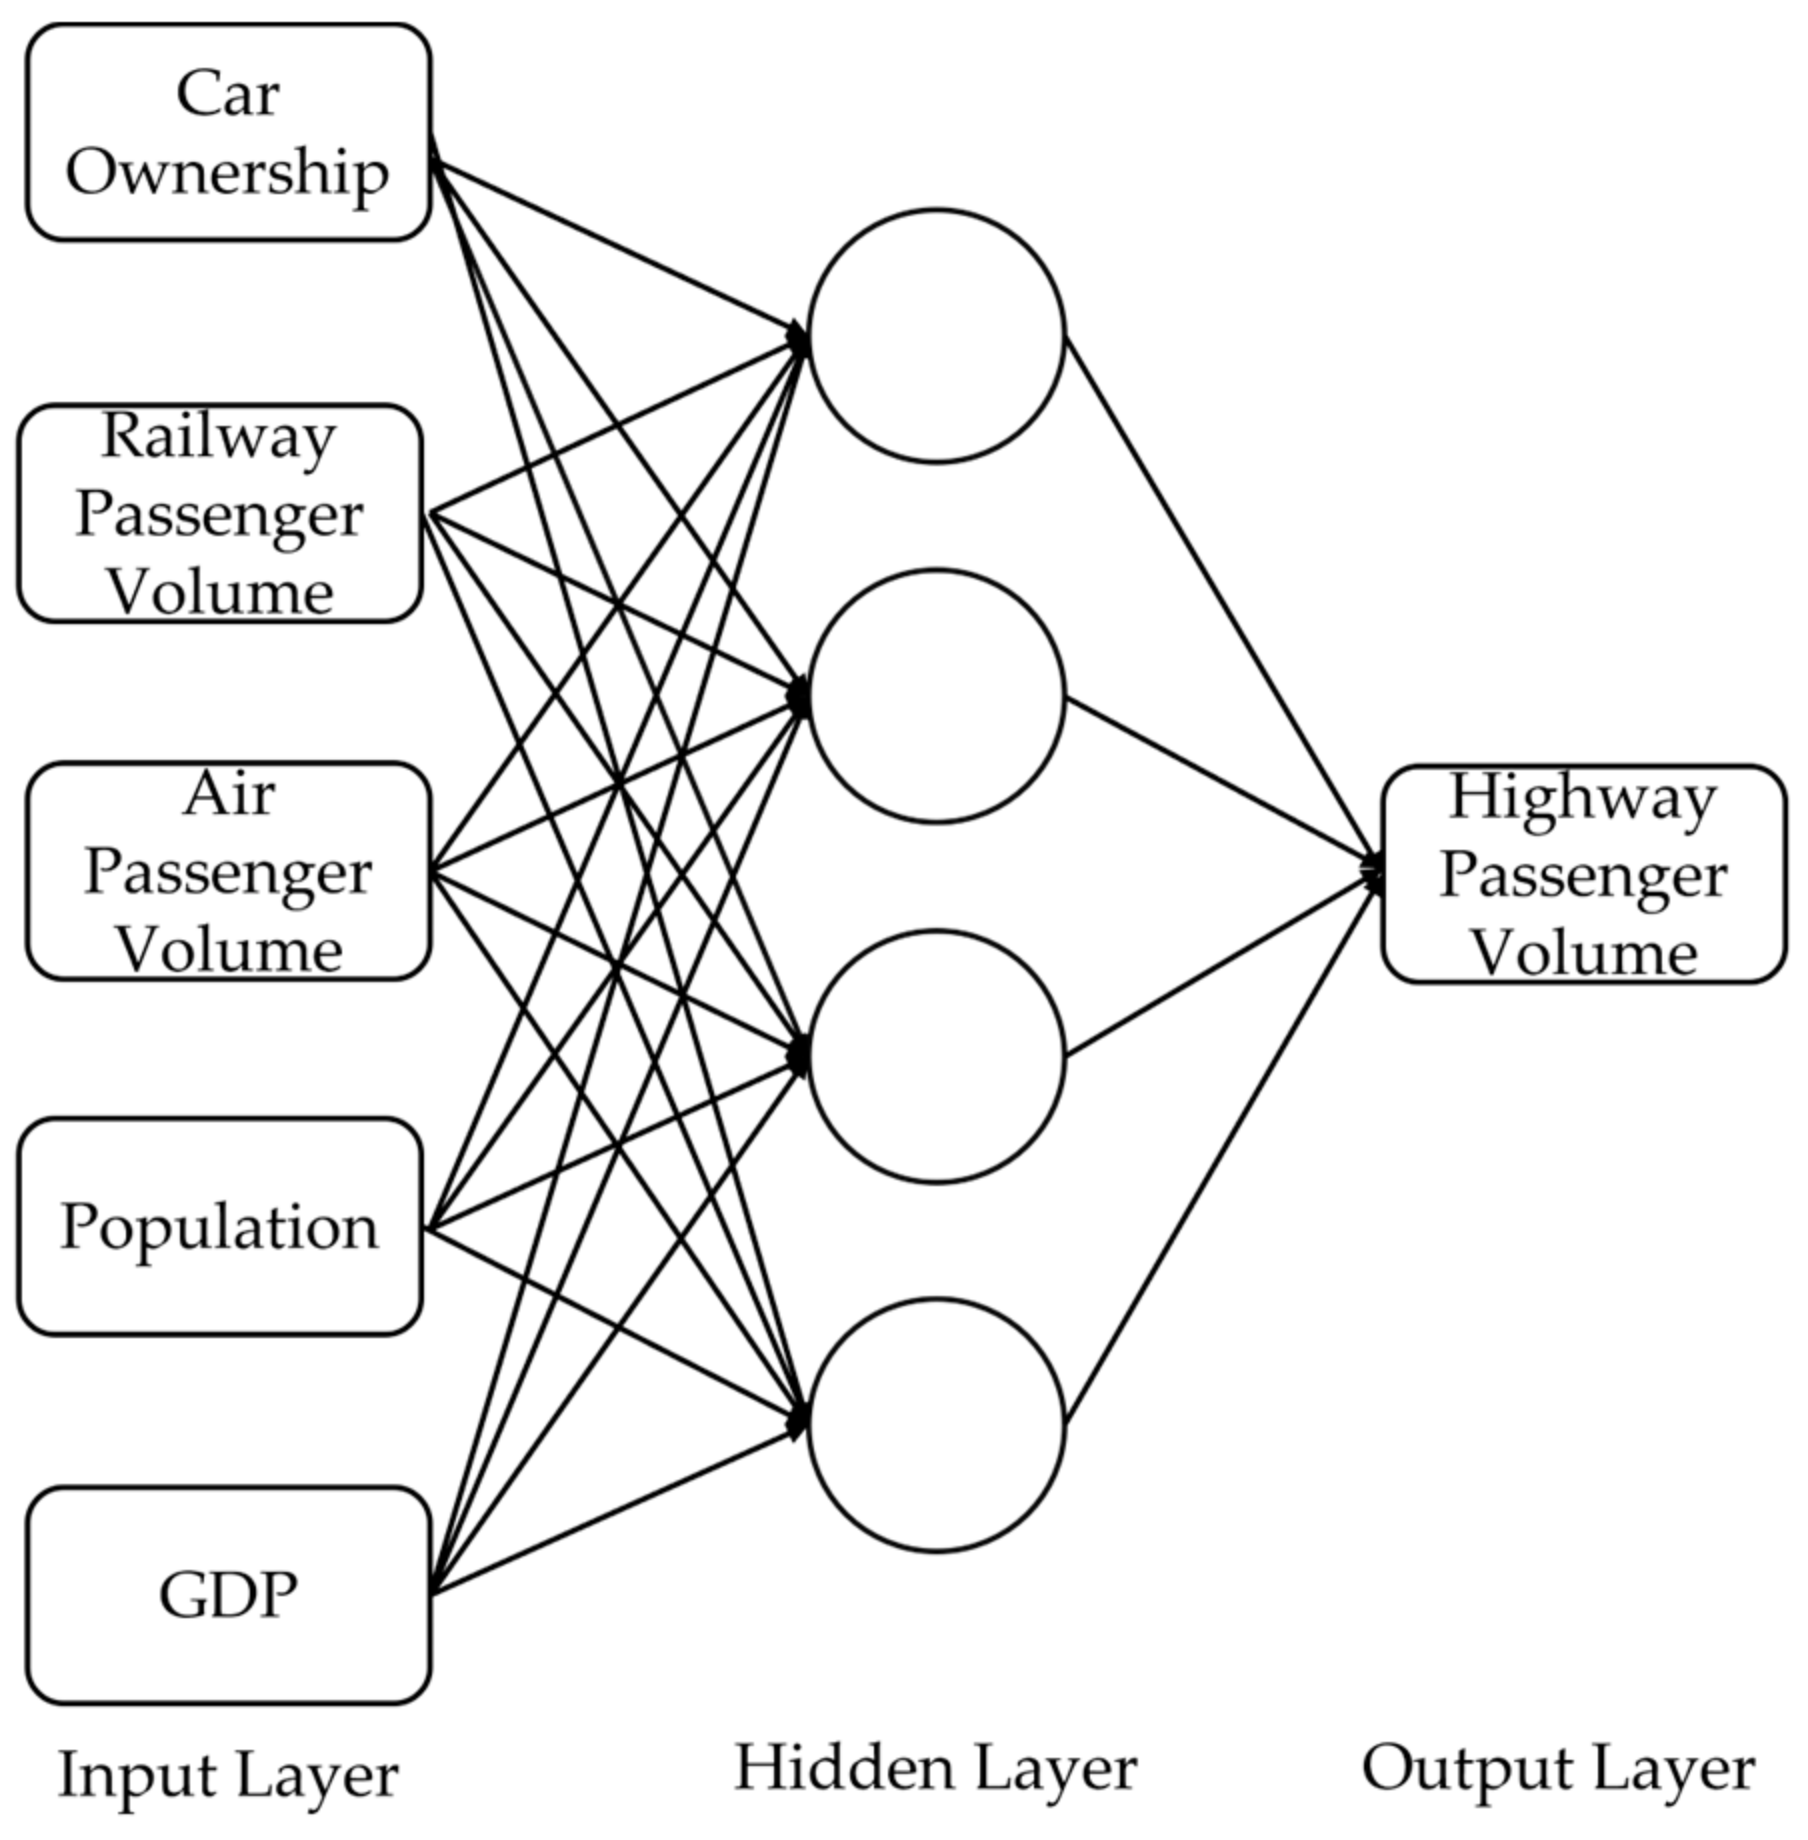
The multilayer perceptron consists of an input layer, a hidden layer, and an output layer. The input layer has five neurons, the hidden layer has four neurons, and the output layer has one neuron. The input layer neuron is the independent variable, that is, the five influencing factors, and the output layer neuron is the dependent variable, that is, the highway passenger volume, as shown in Figure 4.
The SPSS software is opened to import the collected data, find the multilayer perceptron in the neural network from the analysis operation bar, and then the road passenger volume is set as the dependent variable, and the private car ownership, GDP, population, railway passenger volume, and air passenger volume are set as covariates. The rescaling method of covariates and dependent variables is standardized, and the weights of training and verification are set to 70% and 30%, respectively [27,28,29,30]. The reason for this setting is that in the era of small data volume in the development of machine learning, the common practice is to divide all data into a training set consisting of 70% of the data and a test set consisting of 30%. If the validation set is explicitly established, it can also be divided into the following proportions: 60% training set, 20% validation set, and 20% test set. However, the method used is the best practice method, generally recognized in the field of machine learning in the past few years. Because the amount of data in this paper is small, the data are divided into two parts, comprising 70% training set and 30% test set. The hidden layer activation function selects the hyperbolic tangent function, and the output layer activation function selects the identity function [31].
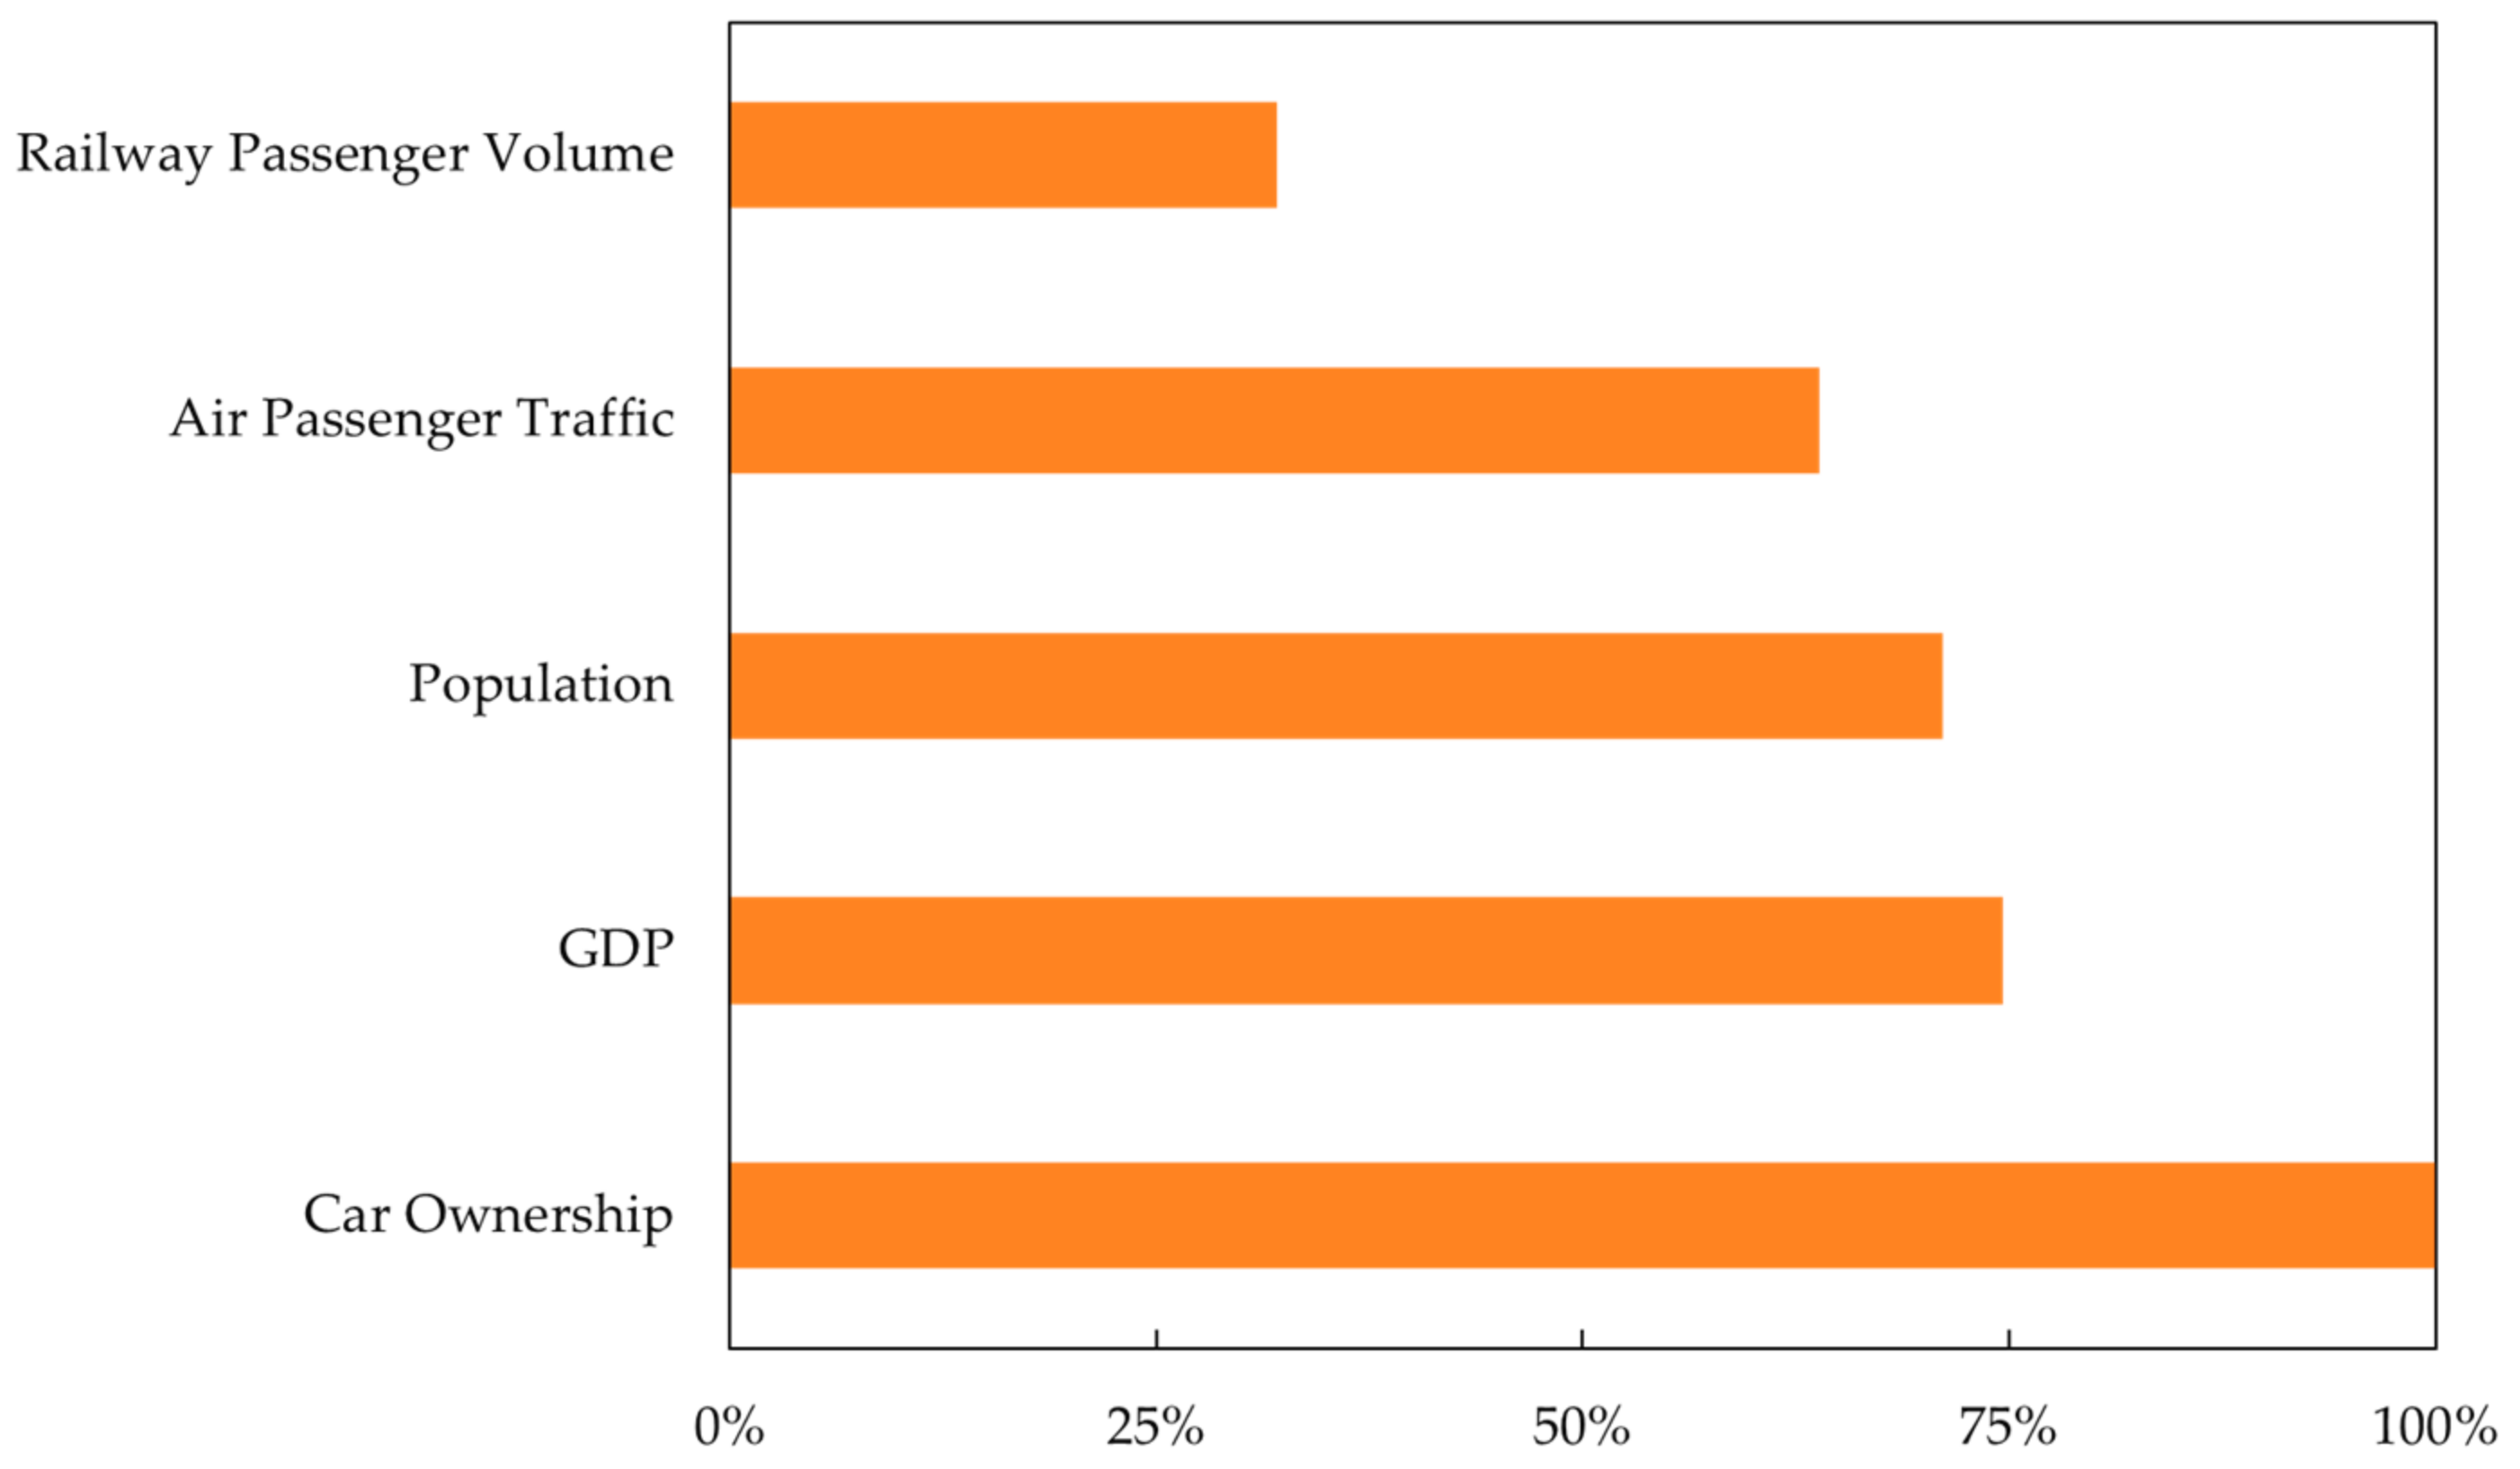
From Table 3, it can be seen that the five indicators have a significant impact on the highway passenger volume. The importance of private car ownership, GDP, population, air passenger volume, and railway passenger volume standardization is 100%, 74.6%, 71.1%, 63.9%, and 32.1%, respectively. Figure 5 shows that private car ownership has the highest impact on road passenger traffic. The impact of GDP on the highway passenger volume is second only to private car ownership. The air passenger volume and population have a general impact on the highway passenger volume. The railway passenger volume has the least impact on the highway passenger volume, which is much different from the other four influencing factors. Therefore, the influencing factors of railway passenger volume are removed, and then, the four significant influencing factors of GDP, private car ownership, population, and air passenger volume are used to predict the highway passenger volume.
6. BP Neural Network Prediction
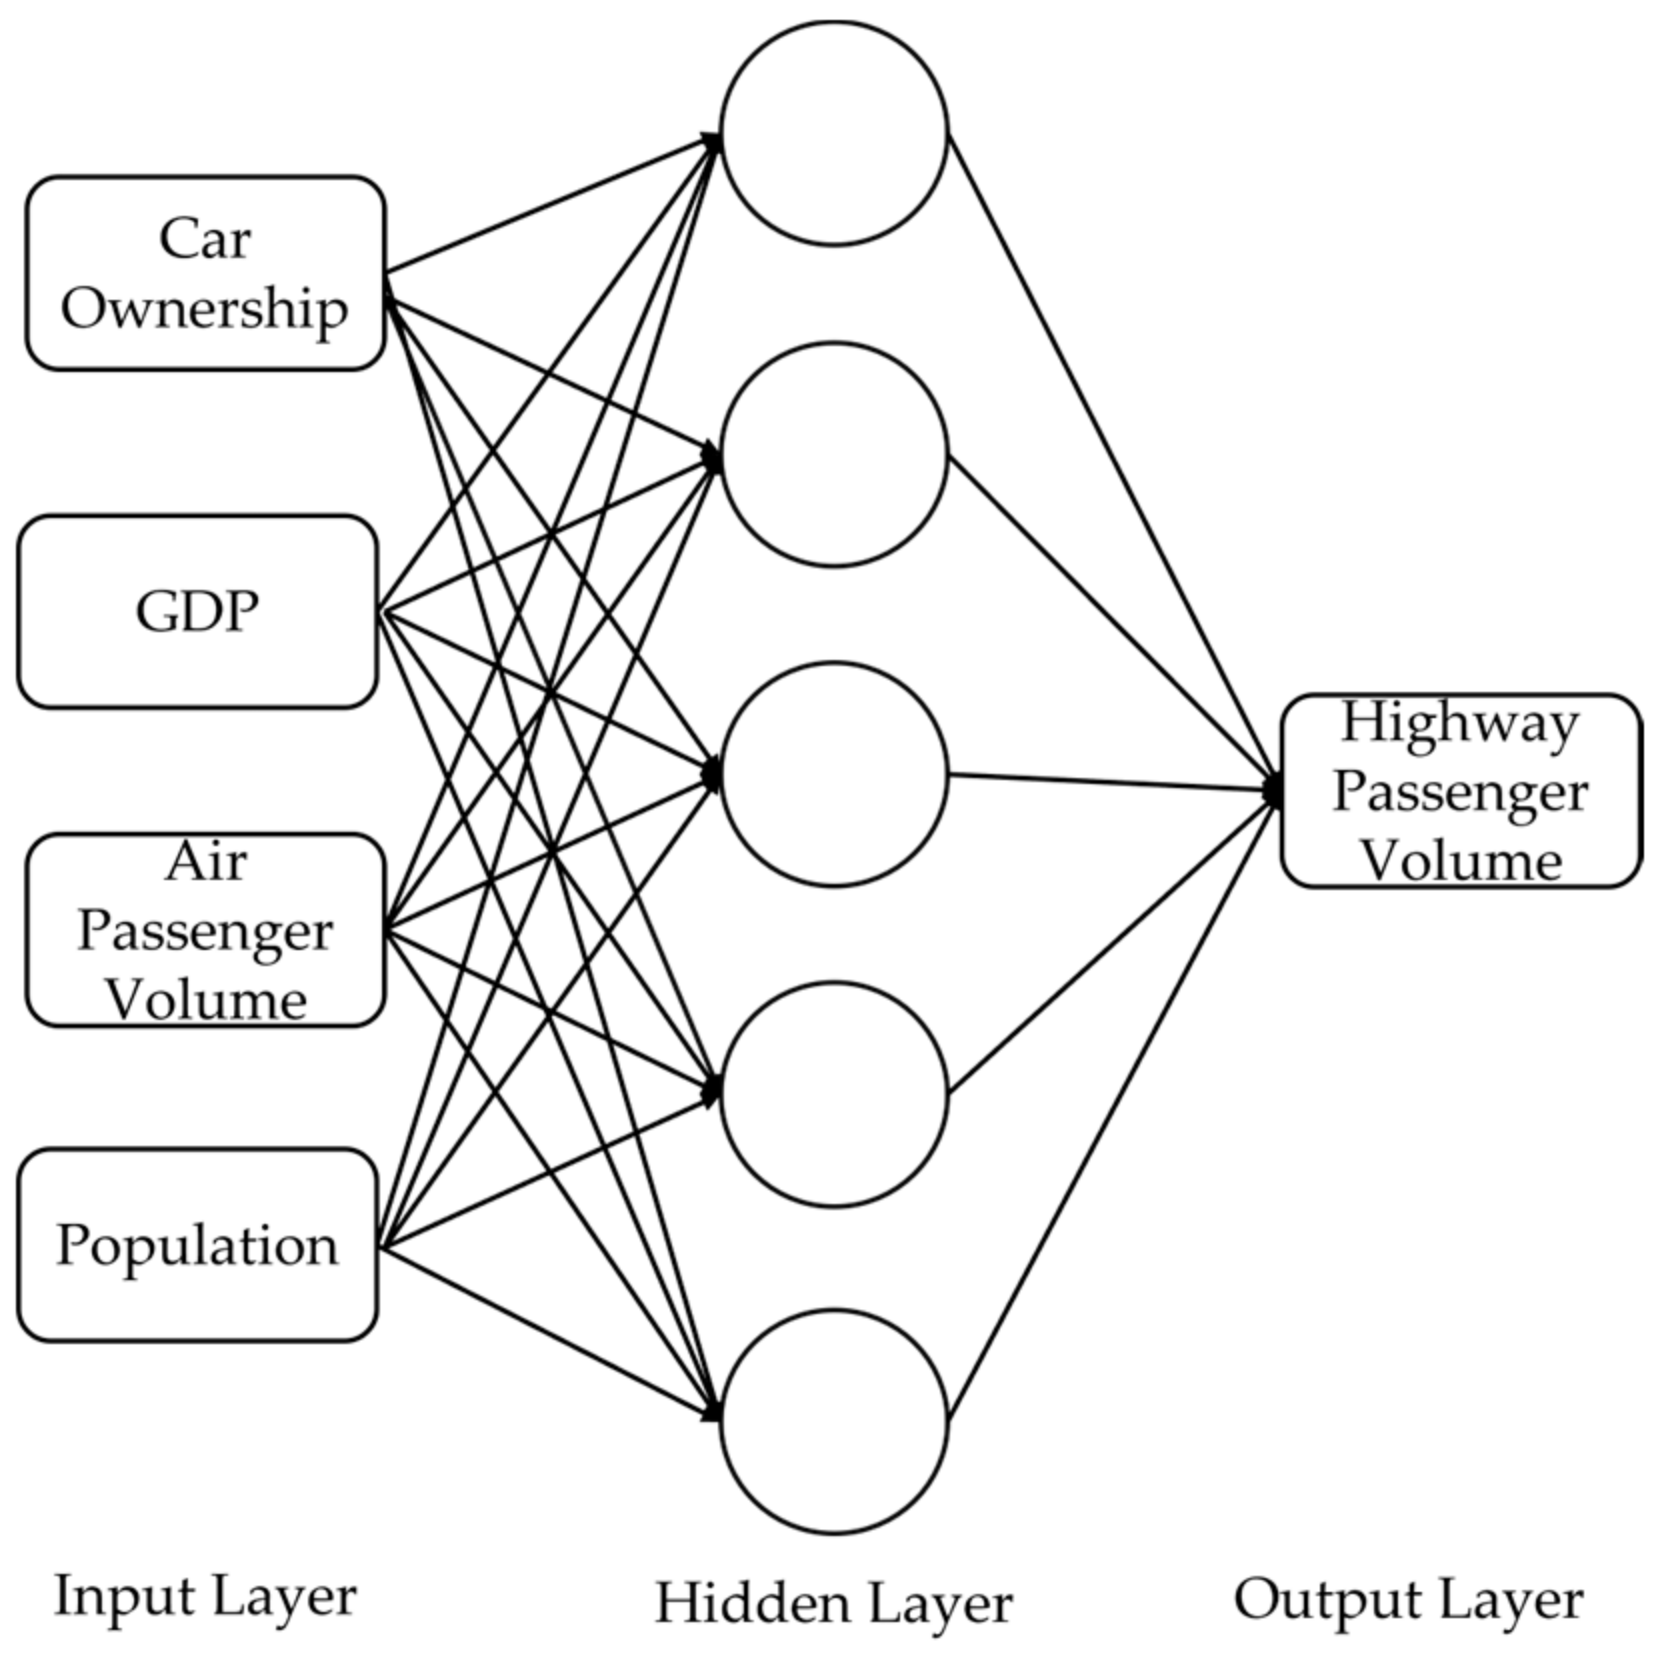
The BP neural network consists of an input layer, a hidden layer, and an output layer. The input layer has four neurons, the hidden layer has five neurons, and the output layer has one neuron. The input layer neuron is the independent variable, that is, the four influencing factors, and the output layer neuron is the dependent variable, that is, the highway passenger volume. The neural network divides all the data into 26 randomly arranged arrays. The first 20 sets of data are used for training, and the last 6 sets of data are used for testing, as shown in Figure 6.
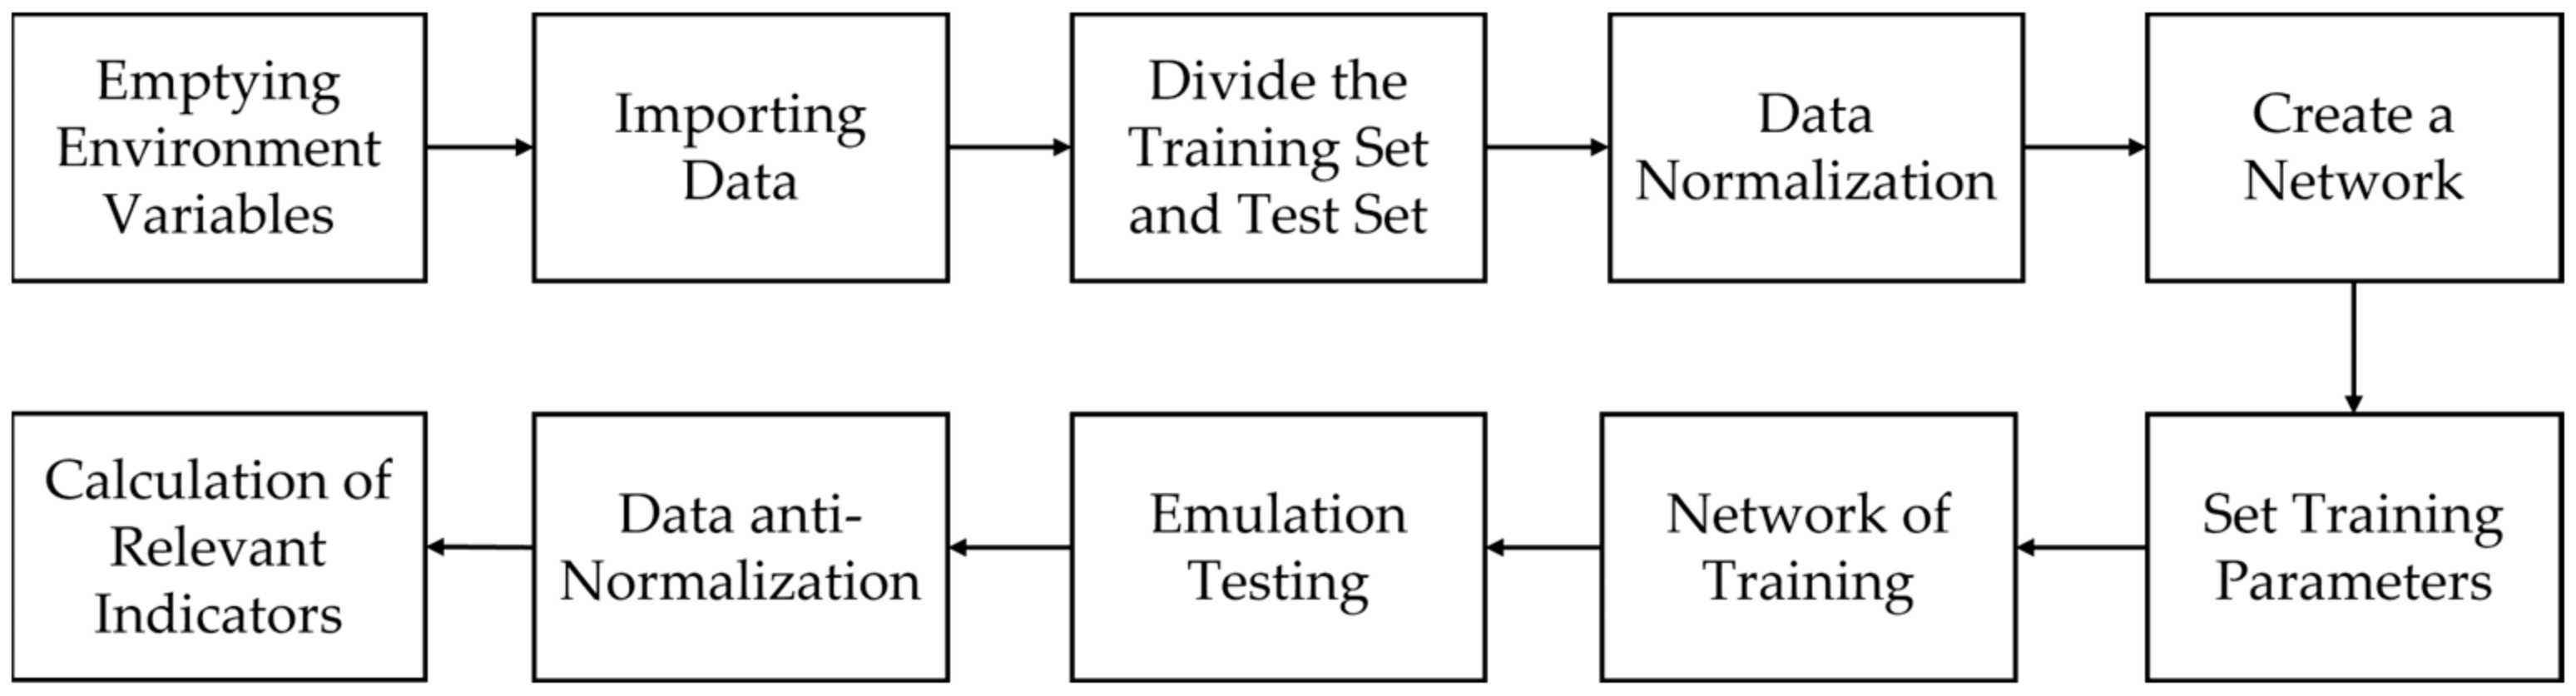
The MATLAB programming software is used to process the collected highway passenger volume from 1990 to 2022 and its related influencing factors. The prediction process is shown in Figure 7 [32]. First, the environmental variables are emptied, and then the collected data are imported. Part of the data are divided into a training set, the rest of the data are divided into a test set, and then all the data are normalized. Then, the neural network environment is created and the training parameters are set to train the network. Finally, the simulation test is carried out. The data are denormalized and the related indicators are calculated.
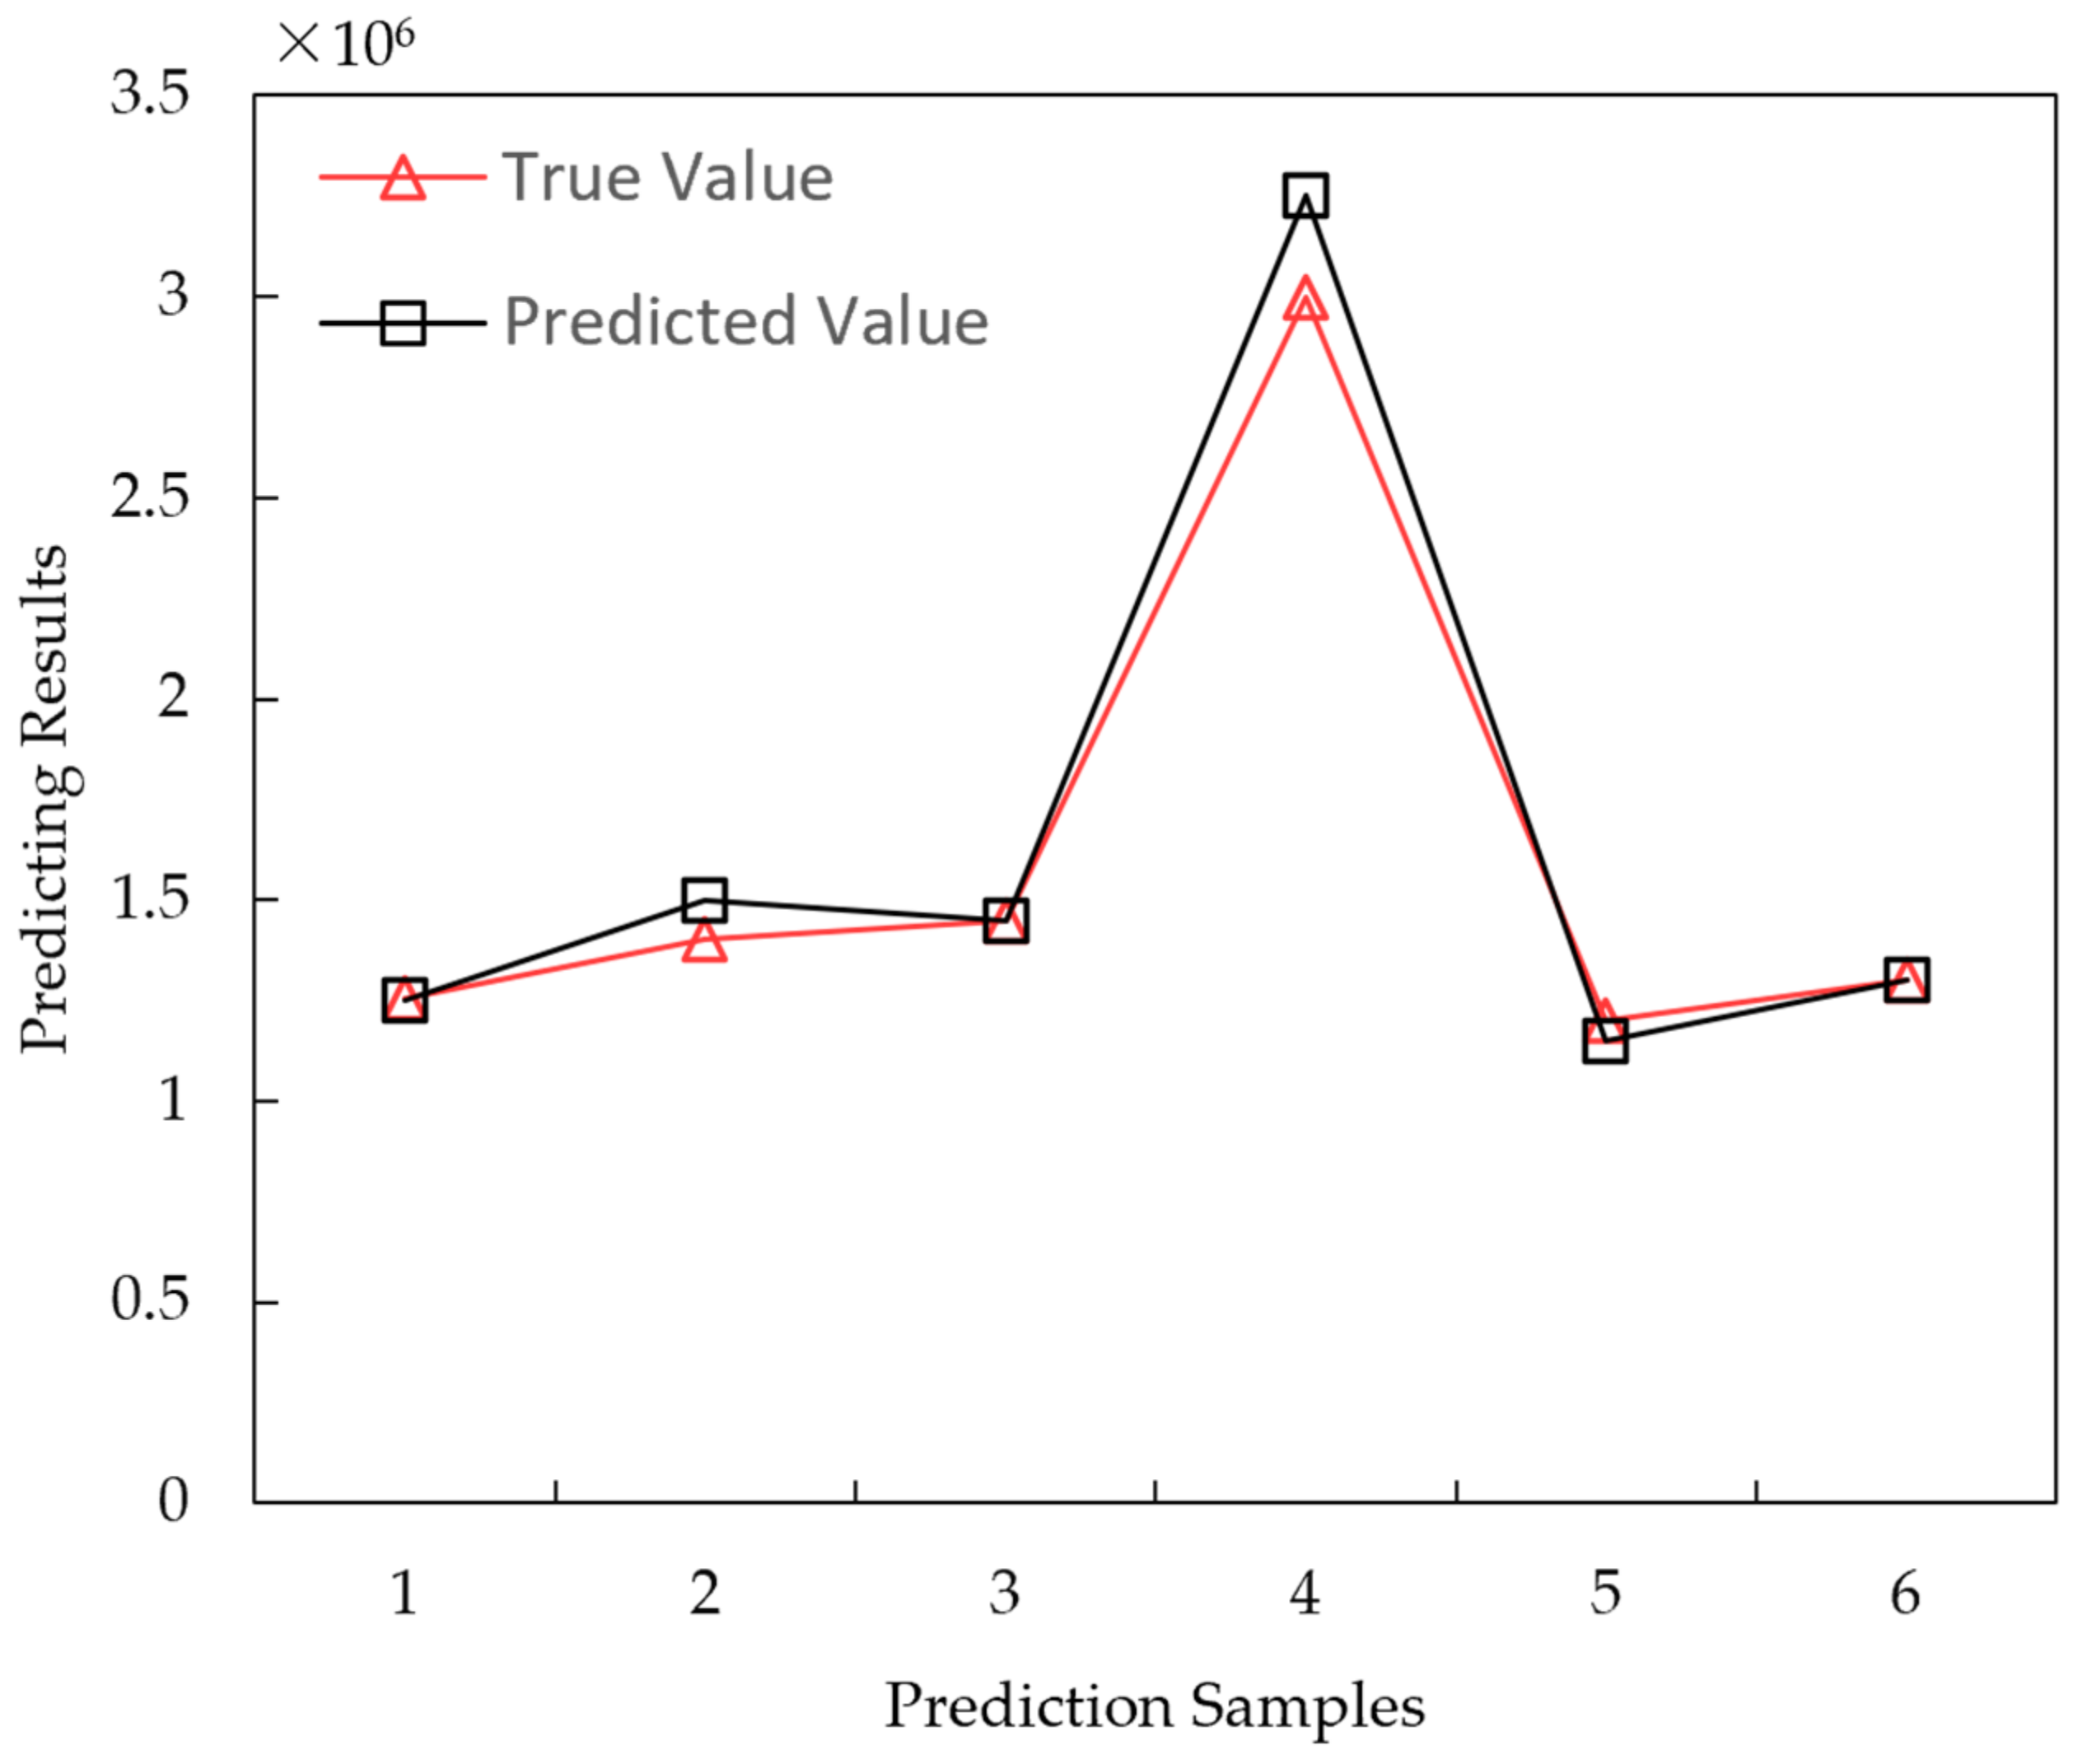
The goodness of fit (R2) in Table 4 is closer to 1, indicating the higher prediction accuracy of the model [33,34,35,36]. It can be seen that the goodness of fit of the training set and the test set is above 95%. The comparison with the other literature shows that the fitting results are reliable. The smaller the values of mean absolute error (MAE), mean relative error (MBE), and root mean square error (RMSE), the closer the predicted value of the model to the actual value, the better the prediction performance of the model, and the more accurate the predicted results. After calculation, the error values are all less than 5%. In practical applications, the performance of regression models is often evaluated by root mean square error (RMSE), which can reflect the overall error of model prediction well. Therefore, this paper takes the root mean square error (RMSE) as the index and shows the comparison between the predicted value and the real value of the test set of the predicted sample, as shown in Figure 8. From the figure, it can be seen that the lines of the predicted value and the real value almost coincide. In summary, the prediction results of the model are reliable.
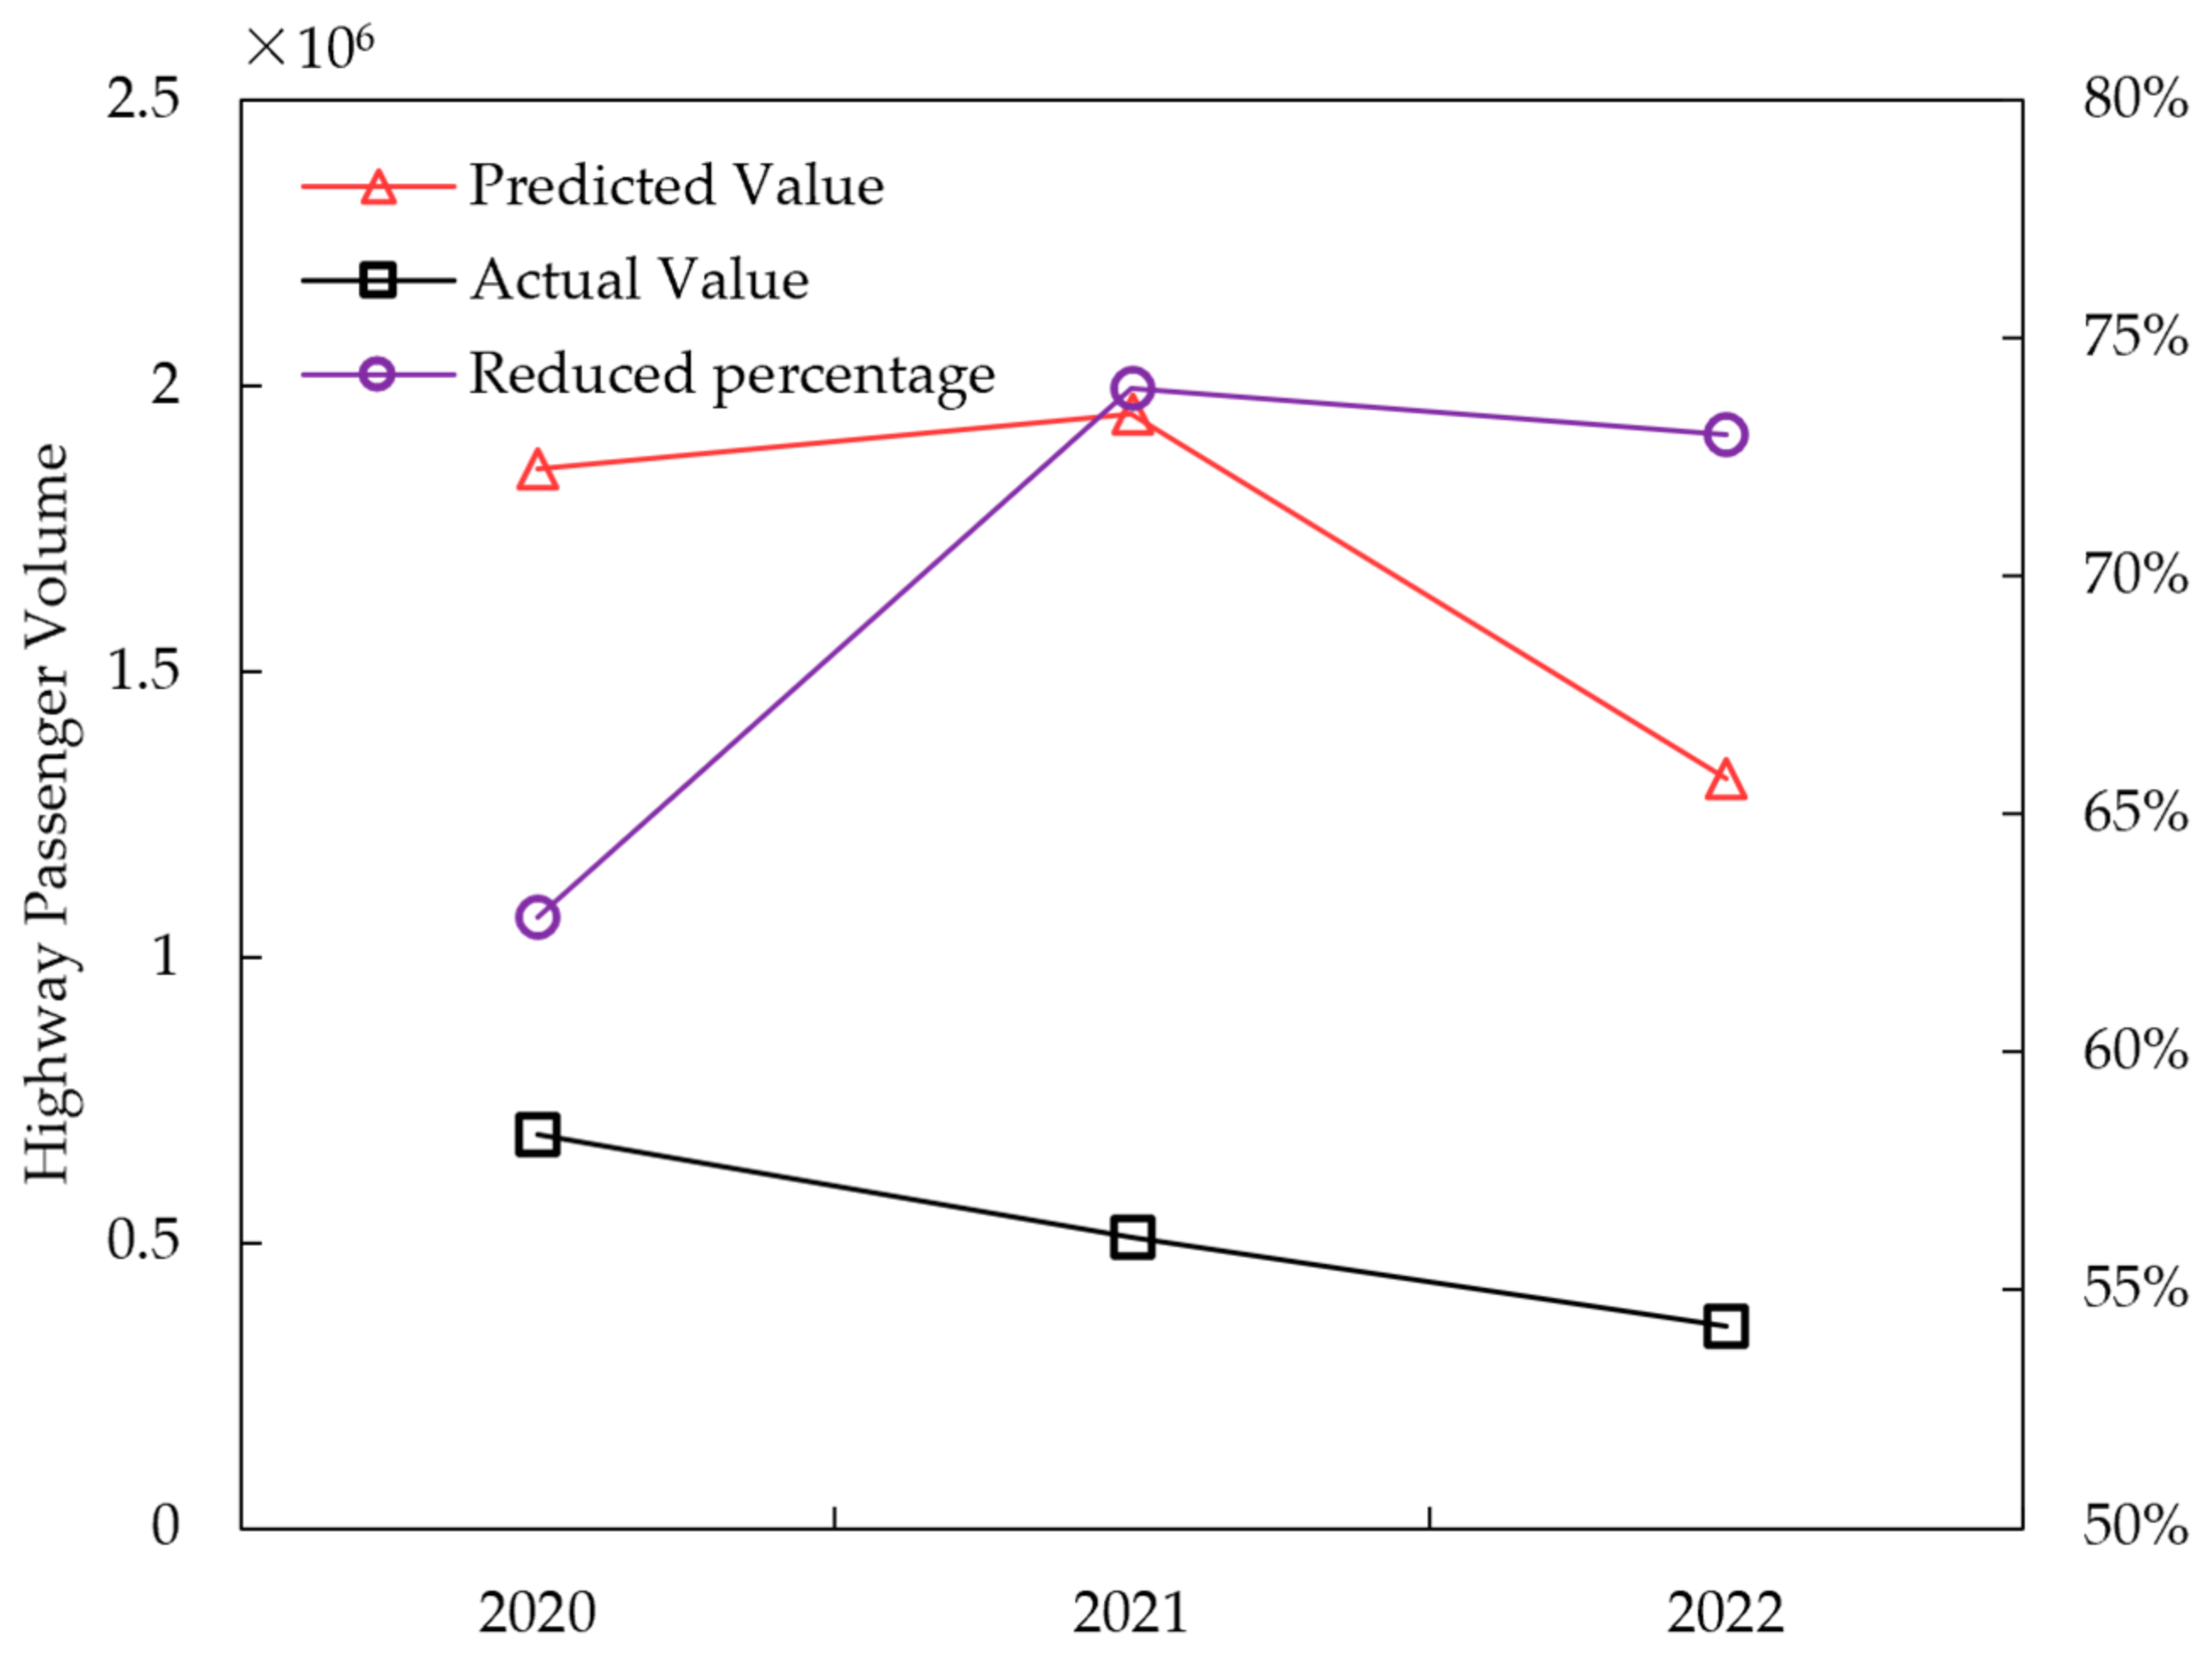
Substituting the data into the prediction model, it is predicted that the highway passenger volume in 2020–2022 will be 1,854,378 million, 1,951,751 million, and 1,312,062 million, while the actual data will be 689,425 million, 508,693 million, and 354,643 million, with a decrease of 62.82%, 73.94%, and 72.97%. The comparison of actual and predicted highway passenger volume is shown in Figure 9. It shows that the actual highway passenger volume is very different from the predicted results. The reason is that the sudden outbreak of the epidemic in China in 2019 seriously affected China’s road passenger volume, which in turn, had a certain impact on China’s economy. The medium- and long-term railway network plans to reach 120,000 km of national railway business mileage by 2020, establish a railway rapid passenger transport channel between provincial capitals and large- and medium-sized cities, and form a railway high-speed passenger-dedicated line with ‘four vertical and four horizontal’ as the main line, also seriously affected China’s road passenger volume. The overall mileage of the proposed development is 16,000 km, and three intercity rapid passenger transport systems will be built. According to the “14th Five-Year Plan for Civil Aviation Development” issued by the Civil Aviation Administration, it is expected that by 2025, the number of annual flights per capita of Chinese residents will increase from 0.47 in 2019 to 0.67, and the growth potential of China’s aviation market is still huge.
7. Conclusions
The limitations of existing research on highway passenger volume prediction are overcome in this paper. The main conclusions of this paper are as follows:
- (1)
- A two-stage method is proposed. In the first stage, the significant influencing factors are extracted. In the second stage, the BP neural network model is developed to realize the prediction, and the data set of the past 30 years is used to predict the highway passenger volume.
- (2)
- In the first stage, a data set including the four important influencing factors of GDP, population, private car ownership, and air passenger volume is extracted by using a multilayer perceptron, which proves that they are the significant influencing factors of road passenger volume.
- (3)
- In the second stage, the BP neural network is developed, and the percentage of the predicted road passenger volume is 62.82%, 73.94%, and 72.97% lower than the actual road passenger volume. The results show that there are many reasons for this phenomenon, but the most important one is the impact of the outbreak of China’s epidemic in 2019 on China’s road passenger traffic.
To sum up, the research on highway passenger traffic volume based on neural network regression analysis and prediction provides an accurate and reliable prediction tool for traffic management decision making. Through the use of previous data and related influencing factors, establishing a suitable prediction model can provide a reference for traffic planning and resource management, and improve the efficiency and safety of highway passenger traffic. Therefore, this research has important application value and significance in practice. Because some industries in the statistical yearbook only publish annual statistical data, the highway passenger volume of each quarter or several months cannot be analyzed in detail. In addition to this, the data mutation caused by the change of statistical standards in the statistical yearbook affects the accuracy of the prediction. Therefore, in order to conduct a more accurate analysis in the future, we can consider introducing other new data sets in the study.
8. Discussion
By consulting the relevant literature, it is known that the accuracy of the multilayer perceptron model is better than that of the Bevis model and the GPT3 model, but if the radial basis-multilayer perceptron neural network and other joint models are established, the accuracy will be higher. Through comparing the BP neural network prediction model with the multiple linear regression prediction model, it is found that the BP neural network model has higher accuracy. However, if prediction methods such as the BP neural network prediction and the gray prediction method are combined, the model will have the advantages of both models and enhance the adaptability of prediction. The example proves that the prediction accuracy of the combined model is higher than that of a single prediction model, as shown in Table 5.
This paper uses a separate multilayer perceptron neural network model and BP neural network model. The prediction accuracy of the neural network model is not worse than that of other separate prediction models. Therefore, this paper adopts the neural network model. However, the shortcomings of this paper are as follows:
- (1)
- The neural network prediction model can be combined with other models to improve prediction accuracy.
- (2)
- The original data in this paper are limited, and the prediction accuracy can be improved if the original data are increased.
- (3)
- This paper selects five influencing factors related to highway passenger traffic volume, which can increase the number of influencing factors to improve the prediction accuracy.
It is recommended that scholars can continue to optimize the neural network model in subsequent studies, such as replacing the activation function, increasing the number of hidden layers, and using other neural network models. In this paper, based on multilayer perception and BP neural network model, the highway passenger volume is predicted. In the future, the passenger volume and freight volume of railway, aviation, and waterways can be predicted.
Author Contributions
Methodology, Z.Z.; software, W.G.; writing—original draft preparation, H.L.; writing—review and editing, B.G. All authors have read and agreed to the published version of the manuscript.
Funding
This study did not receive any external funding.
Institutional Review Board Statement
Not applicable.
Informed Consent Statement
Not applicable.
Data Availability Statement
Data available in a publicly accessible repository that does not issue DOIs. Publicy available datasets were analyzed in this study. This data can be found here: https://www.stats.gov.cn/sj/ndsj/, accessed on 15 April 2024.
Conflicts of Interest
The authors declare no conflict of interest.
References
- Xiang, Y.; Chen, J.X.; Wu, R.; Liu, B.; Wang, B.J.; Li, Z.B. A Two-Phase Approach for predicting Highway Passenger Volume. Appl. Sci. 2021, 11, 6248. [Google Scholar] [CrossRef]
- Shen, Y.B.; Xu, W.C.; Zhang, X.H.; Wang, Y.Y.; Xu, X.; Luo, Y.Z. Deflection Control of an Active Beam String Structure Using a Hybrid Genetic Algorithm and Back-Propagation Neural Network. J. Struct. Eng. 2024, 150, 04024011. [Google Scholar] [CrossRef]
- Brattin, R.L.; Sexton, R.S.; Austin, R.E.; Guo, X.; Scarmeas, E.M.; Hulett, M.J. Analyzing Destination Country Risk Profiles in Business Study Abroad Programs: A Neural Network Approach. J. Int. Educ. Bus. 2024, 17, 133–147. [Google Scholar] [CrossRef]
- Zhang, B.; Zhou, D.D.; Zhou, X.; Zhang, M.Y.; Zhong, M. Forecast of Highway Passenger Volume Based on Improved System Dynamics Model. J. Chang. Univ. (Nat. Sci. Ed.) 2023, 43, 111–119. [Google Scholar]
- Xu, S.; Cui, S.W. Highway Passenger Traffic Forecast Based on Double Implicit Layer BP Neural Network Based on Softplus Function. J. Univ. S. China (Sci. Technol.) 2020, 34, 88–92. [Google Scholar]
- Xu, S. Prediction Method of Highway Passenger Transportation Volume Based on BP Neural Network in Gansu Province. Traffic Transp. 2019, 35, 28–31. [Google Scholar]
- Bao, Y.; Chen, Y.X. Research on Prediction Method of Highway Passenger Volume and Freight Volume Based on BP Neural Network. Softw. Guide 2016, 15, 129–131. [Google Scholar]
- Wang, D. Prediction Method of Highway Passenger Transportation Volume Based on BP Neural Network. Comput. Technol. Dev. 2017, 27, 187–190. [Google Scholar]
- Liu, J.W.; Xie, S.F.; Zhong, Y.Q.; Zeng, Y.; Zhang, J.H.; Liao, F.S. A Multi-Factor PWV Prediction Model Based on MLP Neural Network for Southern China. China Sci. 2024, 19, 99–107+122. [Google Scholar]
- Yuan, X.Q.; Zhao, Y.Y. Study on the Connotation Quality Prediction Model of Inpatient Medical Record Based on Multi-Layer Perceptron Neural Network. J. Med. Inform. 2023, 44, 35–40. [Google Scholar]
- Xie, S.F.; Zeng, Y.; Zhang, J.H.; Zhang, Y.B.; Xiong, S. Atmospheric Weighted Mean Temperature Model Based on MLP Neural Network. J. Geod. Geodyn. 2022, 42, 1105–1110. [Google Scholar]
- Tian, Q.Q.; Wu, H.Z. Research on Big Data Evaluation Model Based on Discriminant Analysis and Multilayer Perceptron Neural Network. J. Huaihua Univ. 2022, 41, 42–47. [Google Scholar]
- Ma, Z.Y.; Lu, X.P. Fast Multispectral Remote Sensing Image Classification Method Based on Integrated Multilayer Perceptron. Geospat. Inf. 2022, 20, 74–78. [Google Scholar]
- Tang, L.T.; Mo, Y.H. Highway Passenger Volume Prediction Base on Multiple Regression and BP Neural Network. Transp. Sci. Technol. 2017, 5, 123–126. [Google Scholar]
- Wang, H.; Guo, R.J. Forecasting of Highway Passenger Transportation Volume based on Improved PCA-BP Neural Network Model. J. Dalian Jiaotong Univ. 2016, 37, 1–5. [Google Scholar]
- Ma, R.K.; Zhang, K.; Zhang, Y. Neural Network Combination Model of Highway Passenger Traffic Volume Forecast. Transp. Comput. 2007, 6, 41–44. [Google Scholar]
- Ma, H.Q.; Qin, B.; Zhang, L.J. Application of Adaptive Neural Network in Highway Passenger Volume Forecast Shandong. Transp. Sci. Technol. 2006, 3, 53–55. [Google Scholar]
- Hang, L.; Han, Z.; Du, Y.W. Application of BP Neural Network and GM (1,1) Gray Model in Road Passenger Traffic Estimation. Technol. Highw. Transp. 2006, 2, 110–113. [Google Scholar]
- Doush, A.I.; Ahmed, B.; Awadallah, A.M.; Albetar, A.M.; Alawad, A.N. Improving Multilayer Perceptron Neural Network Using Two Enhanced Moth-Flame Optimizers to Forecast Iron Ore Prices. J. Intell. Syst. 2024, 33, 20230068. [Google Scholar]
- Moungnuto, I.M.; Koumi, S.N.; Jacques, J.R.M.; Felix, B.K.N.; Raphael, O.; Dzonde, R.S.N.; Gaston, J.T.; Mohit, B.; Milkias, B. A Multilayer Perceptron Neural Network Approach for Optimizing Solar Irradiance Forecasting in Central Africa with Meteorological Insights. Sci. Rep. 2024, 14, 3572, Erratum in Sci. Rep. 2024, 14, 5334. [Google Scholar]
- Mahato, S.; Gurao, P.N.; Biswas, K. Accelerated Prediction of Stacking Fault Energy in FCC Medium Entropy Alloys Using Multilayer Perceptron Neural Networks: Correlation and Feature Analysis. Model. Simul. Mater. Sci. Eng. 2024, 32, 035021. [Google Scholar] [CrossRef]
- Guan, S.P.Y.; Xing, C.; Wang, S.J.; Sun, C.Y.; Yang, D.Q. Multi-layer Perception Neural Network Soft-sensor Modeling of Grinding Process Based on Swarm Intelligent Optimization Algorithms. Eng. Lett. 2024, 32, 463. [Google Scholar]
- Crnjanski, V.J.; Teofilović, I.; Krstić, M.M.; Gvozdic, M.D. Application of a Reconfigurable All-Optical Activation unit Based on Optical Injection into a Bistable Fabry-Perot Laser in Multilayer Perceptron Neural Networks. Opt. Lett. 2024, 49, 1153–1156. [Google Scholar] [CrossRef] [PubMed]
- Santos, O.S.D.L.; Lemos, B.J.; Souza, D.V.A.P.; Cerqueira, G.A. Automatic Zero-Phase Wavelet Estimation from Seismic Trace Using a Multilayer Perceptron Neural Network: An Application in a Seismic Well-Tie. J. Appl. Geophys. 2024, 222, 105305. [Google Scholar] [CrossRef]
- Shen, J.X.; Bao, M.Y.; Zhang, J.A.; Zhou, J.H. Chaotic Adaptive African Vulture Optimization Algorithm Trains Multi-Layer Perceptron. Comput. Eng. Des. 2024, 45, 546–552. [Google Scholar]
- Lu, S.X. Based on Multi-Layer Perceptron Neural Network Research on Logging Curve Reconstruction Method. Technol. Mark. 2023, 30, 86–88+92. [Google Scholar]
- Chen, G.; Pu, J.F.; Mei, H.L.; Yu, B.; Zhang, L.; Shi, C.; Tan, P. Prediction of Boiler Reheat Steam Temperature Based on Multi-Layer Perceptron Neural Network. Hunan Electr. Power 2022, 42, 71–75. [Google Scholar]
- Cui, L.Q.; Wang, S.N.; Yuan, H.F.; Li, Z.X.; Li, L.; He, L.Q.; Wu, X.Q. Research on the Prediction of Total Social Electricity Consumption Based on MLP and RBF Algorithm. Power Syst. Big Data 2023, 26, 31–39. [Google Scholar]
- Zhao, H.; Li, K. Online Open Course Learner Satisfaction Prediction Based on MLP and RBF Neural Network Models. Mod. Electron. Tech. 2023, 46, 84–88. [Google Scholar]
- Wang, Q.; Hu, R. Improved Grasshopper Optimizing Multi-Layer Perceptron Neural Network and Its Application on Data Classification. Comput. Eng. Des. 2022, 43, 3443–3452. [Google Scholar]
- Jiang, S.Y.; Sun, P.K.; Zhang, L.; Jia, L.B.; He, T.H.; Xu, H.M.; Ai, B.B.; Zhang, H.F.; Rao, H.W.; Ding, Y. Intelligent identification and characterization of complex lithofacies based on radial basis-multilayer perception neural network joint model. Nat. Gas Ind. 2022, 42, 47–62. [Google Scholar]
- Tang, F.N.; Zhang, K.; Zhu, M.Y.; Yang, C.H.; Zhang, H.; Wang, Y.; Yuan, D.Q. Study on the Assisted Diagnosis Method of SMILE Surgery Based on MLP Neural Network. China Med. Equip. 2022, 19, 1–5. [Google Scholar]
- Huang, Z.K.; Jin, Z.Y.; Zhu, H.Y.; Liu, Y.N.; Tan, P. Modeling of SCR Denitrification System in Coal-Fired Power Station Based on Multilayer Perceptron Neural Network. Hubei Electr. Power 2022, 46, 100–105. [Google Scholar]
- Li, J. Research on Forcasting Method for Passenger Volume of Highway-Node Mode. Ph.D. Thesis, Beijing University of Technology, Beijing, China, 2015. [Google Scholar]
- Lin, Q. The Forcasting Model of Passenger Carrying Capacity in Zhejiang Province Base on Genetic Algorithm Optimizing the Grey Neural Network. Master’s Thesis, Central China Normal University, Wuhan, China, 2013. [Google Scholar]
- Wu, N.N. Research on Induced Ordered Weighted Geometric Average Combination Forecasting Model of Highway Passenger Volume. Master’s Thesis, Harbin University of Technology, Harbin, China, 2012. [Google Scholar]
Figure 1.
Trends of national highway passenger traffic and related influencing factors.

Figure 2.
The neural network topology.

Figure 3.
Algorithm steps.

Figure 4.
Multilayer perceptron neural network topology structure.

Figure 5.
The order of importance of influencing factors.

Figure 6.
BP neural network topology structure.

Figure 7.
Prediction process.

Figure 8.
Prediction results.

Figure 9.
Actual and predicted highway passenger volume.


Table 1.
The research results of some of the literature.
| Method | Literature Serial Number | Research Object | Research Conclusions |
|---|---|---|---|
| Multilayer Perceptron Neural Network | 9 | Precipitable water vapor | The MLP model has good accuracy and adaptability in southern China. |
| 10 | Medical record connotation quality | The multilayer perceptron neural network connotation quality prediction accuracy is high. | |
| 11 | The weighted average temperature in Southwest China | The accuracy and stability of the model in Southwest China are better than those of Bevis model and GPT3 model. | |
| 12 | Personal credit | The classification result of multilayer perceptron is better than that of discriminant analysis. | |
| 13 | Fast classification method of multi-spectral images | The integrated classifier is better. | |
| BP Neural Network | 5 | Highway passenger volume | The softplus double hidden layer neural network effectively reduces the error. |
| 6 | Highway passenger volume of Gansu Province | The prediction results are better than the multiple linear regression model. | |
| 7 | Highway passenger volume and freight volume | The feasibility of neural network prediction is high. | |
| 8 | Highway passenger volume | The minimum relative error is 1.1%, and the average relative error is 2.78%. | |
| 16 | Highway passenger volume | The accuracy of the combined prediction model is better. |
Table 2.
Data on national highway passenger traffic volume and related influencing factors.
| Year | GDP | Population | Private Car Ownership | Railway Passenger Volume | Air Passenger Volume | Highway Passenger Traffic |
|---|---|---|---|---|---|---|
| 1990 | 18,872.9 | 114,333 | 81.62 | 95,712 | 1660 | 648,085 |
| 1991 | 22,005.6 | 115,823 | 96.04 | 95,080 | 2178 | 682,681 |
| 1992 | 27,194.5 | 117,171 | 118.2 | 99,693 | 2886 | 731,774 |
| 1993 | 35,673.2 | 118,517 | 155.77 | 105,458 | 3383 | 860,719 |
| 1990 | 46,759.4 | 119,850 | 205.42 | 108,738 | 4039 | 953,940 |
| 1995 | 58,478.1 | 121,121 | 249.96 | 102,745 | 5117 | 1040810 |
| 1996 | 67,884.6 | 122,389 | 289.67 | 94,797 | 5555 | 1,122,110 |
| 1997 | 74,462.6 | 123,626 | 358.36 | 93,308 | 5630 | 1,204,583 |
| 1998 | 78,345.2 | 124,810 | 423.65 | 95,085 | 5755 | 1,257,332 |
| 1999 | 82,067.5 | 125,909 | 533.88 | 100,164 | 6094 | 1,269,004 |
| 2000 | 89,403.6 | 126,583 | 625.33 | 105,073 | 6722 | 1,347,392 |
| 2001 | 10,9655.2 | 127,627 | 770.78 | 105,155 | 7524 | 1,402,798 |
| 2002 | 120,322.7 | 128,453 | 968.98 | 105,606 | 8594 | 1,475,257 |
| 2003 | 135,822.8 | 129,227 | 1219.23 | 97,260 | 8759 | 1,464,335 |
| 2004 | 159,878.3 | 129,988 | 1481.66 | 111,764 | 12,123 | 1,624,526 |
| 2005 | 184,937.4 | 130,756 | 1848.07 | 115,583 | 13,827 | 1,697,381 |
| 2006 | 216,314.4 | 131,448 | 2333.32 | 125,656 | 15,968 | 1,860,487 |
| 2007 | 265,810.3 | 132,129 | 2876.22 | 135,670 | 18,576 | 2,050,680 |
| 2008 | 314,045.4 | 132,802 | 3501.39 | 146,193 | 19,251 | 2,682,114 |
| 2009 | 340,902.8 | 133,450 | 4574.91 | 152,451 | 23,052 | 2,779,081 |
| 2010 | 401,512.8 | 134,091 | 5938.71 | 167,609 | 26,769 | 3,052,738 |
| 2011 | 473,104 | 134,735 | 7326.79 | 186,226 | 29,317 | 3,286,220 |
| 2012 | 518,942.1 | 135,404 | 8838.6 | 189,337 | 31,936 | 3,557,010 |
| 2013 | 630,009.34 | 136,726 | 10,501.68 | 210,597 | 35,397 | 1,853,463 |
| 2014 | 684,348.42 | 137,646 | 12,339.36 | 230,460 | 39,195 | 1,908,198 |
| 2015 | 722,767.87 | 138,326 | 14,099.1 | 253,484 | 43,618 | 1,619,097 |
| 2016 | 780,069.97 | 139,232 | 16,330.22 | 281,405 | 48,796 | 1,542,759 |
| 2017 | 847,140.1 | 140,011 | 18,515.11 | 308,379 | 55,156 | 1,456,784 |
| 2018 | 914,707.46 | 140,541 | 20,574.93 | 337,495 | 61,174 | 1,367,170 |
| 2019 | 985,333.11 | 141,008 | 22,508.99 | 366,002 | 65,993 | 1,301,173 |
| 2020 | 1,012,415.02 | 141,212 | 24,291.19 | 220,350 | 41,778 | 689,425 |
| 2021 | 1,137,743.4 | 141,260 | 26,152.02 | 261,171 | 44,056 | 508,693 |
| 2022 | 1,203,462.2 | 141,175 | 27,792.11 | 167,296 | 25,171 | 354,643 |
Table 3.
Importance of influencing factors.
| Influencing Factor | Importance | The Standardization of Importance |
|---|---|---|
| Car Ownership | 0.293 | 100.0% |
| GDP | 0.218 | 74.6% |
| Population | 0.208 | 71.1% |
| Air Passenger Traffic | 0.187 | 63.9% |
| Railway Passenger Volume | 0.094 | 32.1% |
Table 4.
BP training and test results.
| Evaluating Indicator | Training Set | Testing Set |
|---|---|---|
| R2 | 0.97 | 0.99 |
| MAE | 78,777.31 | 53,021.78 |
| MBE | −20,045.60 | 25,692.67 |
| RMSE | 136,265.08 | 78,266.65 |
Table 5.
Methods comparison.
| Literature Serial Number | Method | Research Object | Research Conclusions |
|---|---|---|---|
| 20 | Multilayer perceptron model | The weighted average temperature in Southwest China | The accuracy and stability of the model in Southwest China are better than those of Bevis model and GPT3 model. |
| 31 | Joint model of radial basis function-multilayer perceptron neural network | Complicated lithofacies in East 2 area of Sulige gas field | It overcomes the defects of low accuracy and difficult promotion of existing lithofacies identification methods. |
| 6 | BP neural network model | Highway passenger volume of Gansu Province | The prediction results are better than the multiple linear regression model. |
| 18 | BP neural network combination forecasting model | Highway passenger volume | The accuracy of the combined prediction model is better. |
Disclaimer/Publisher’s Note: The statements, opinions and data contained in all publications are solely those of the individual author(s) and contributor(s) and not of MDPI and/or the editor(s). MDPI and/or the editor(s) disclaim responsibility for any injury to people or property resulting from any ideas, methods, instructions or products referred to in the content. |
© 2024 by the authors. Licensee MDPI, Basel, Switzerland. This article is an open access article distributed under the terms and conditions of the Creative Commons Attribution (CC BY) license (https://creativecommons.org/licenses/by/4.0/).
Share and Cite
MDPI and ACS Style
Lu, H.; Guo, B.; Zhang, Z.; Gu, W. Research on a Highway Passenger Volume Prediction Model Based on a Multilayer Perceptron Neural Network. Appl. Sci. 2024, 14, 3438. https://doi.org/10.3390/app14083438
AMA Style
Lu H, Guo B, Zhang Z, Gu W. Research on a Highway Passenger Volume Prediction Model Based on a Multilayer Perceptron Neural Network. Applied Sciences. 2024; 14(8):3438. https://doi.org/10.3390/app14083438
Chicago/Turabian StyleLu, He, Baohua Guo, Zhezhe Zhang, and Weifan Gu. 2024. "Research on a Highway Passenger Volume Prediction Model Based on a Multilayer Perceptron Neural Network" Applied Sciences 14, no. 8: 3438. https://doi.org/10.3390/app14083438
Note that from the first issue of 2016, this journal uses article numbers instead of page numbers. See further details here.