
Research on Factors Influencing Indoor PM2.5 Concentration in Curling Venues Based on CFD Simulation
1
School of Architecture and Design, Beijing Jiaotong University, Beijing 100044, China
2
China Railway First Survey and Design Institute Group Co., Ltd, Xi’an 710054, China
*
Author to whom correspondence should be addressed.
Appl. Sci. 2024, 14(8), 3446; https://doi.org/10.3390/app14083446
Submission received: 27 February 2024
/
Revised: 7 April 2024
/
Accepted: 12 April 2024
/
Published: 19 April 2024
(This article belongs to the Section Environmental Sciences)
Abstract
:This article explores the effects of outdoor PM2.5 concentration, venue airtightness and the distribution of indoor PM2.5 concentration on the curling venue of the National Aquatics Center. Research has found that when the filtration efficiency of the fresh air system is 60%, the outdoor PM2.5 concentration increases by 20 μg/m3, an average increase of 6 μg/m3 in indoor PM2.5 concentration. When the venue air tightness is good, the outdoor air quality has no significant impact on the average indoor PM2.5 concentration. But as the number of infiltration air changes increases, the indoor PM2.5 concentration in each region shows an upward trend. The end of the air conditioning system in the competition area adopts bag air duct supply mode, which can reduce the concentration of PM2.5 in the competition area by 93%, and the moisture content is reduced to 2–2.5 g/kg, better meeting the requirements of curling competitions.
1. Introduction
In recent years, air quality has attracted increasing attention as a critical aspect of modern environmental issues. Air quality is closely related to human health. Relevant studies focused on public buildings, such as classrooms, shopping malls, and stations; however, research on ice sports venues has not been investigated extensively. The Beijing 2022 Winter Olympic Games facilitated the development of ice sports, and an increasing number of people are participating in ice sports. The post-Winter Olympics period has provided opportunities for the development and sustainable construction of ice sports venues. Compared with general sports buildings, ice sports venues have limited indoor natural ventilation to ensure a dry and wet environment on the ice surface and satisfy anticondensation requirements, which further increases the probability of air quality problems. In addition, outdoor air pollution in the Beijing region is unhealthy; in particular, atmospheric particulate matter pollution is relatively unhealthy, and in the absence of effective measures, indoor PM2.5 concentrations increase [1]. The human breathing rate increases during strenuous exercise, and interactions with the air increase [2,3]. The impact of air quality on the human body is significant, which reduces exercising ability and causes respiratory diseases.
Rundell (2003, 2004) [4,5] analysed the concentration of particulate matter in an indoor ice rink and found that the PM1 concentration during the use of the indoor ice rink was 30 times that of the outdoor PM1 concentration, and that unhealthy particulate matter pollution occurred. The author believed that particulate matter pollution is a critical air problem in indoor ice rinks. Stathopouiou (2008) [6] observed that the concentration of various pollutants in the indoor air of sports venues increased with increasing outdoor pollutant concentrations. Sander et al. (2019) [7] examined the temperature, humidity, and CO2 concentration in the arena of a modern Finnish ice rink using measurement and simulation methods. They observed a slight increase in the CO2 concentration higher than 1200 ppm, which exceeded the standard value. Ewa et al. (2020) [8] measured the concentrations of indoor and outdoor bacterial aerosols in indoor skating rinks in Poland, assessed the influence of ventilation systems on bacterial aerosol concentrations, and found that ventilation systems have a good regulating effect on indoor air hygiene conditions. Some Chinese researchers have studied the indoor air environments of basketball, badminton, table tennis, and other ball sports halls and found that owing to competition requirements, indoor wind speed and insufficient ventilation in ball sports halls often lead to high concentrations of CO2 and PM2.5, and pollutant levels are related to personnel activities and form of ventilation [9,10,11,12,13,14,15]. Du et al. (2020, 2022) [16,17] and Zhang et al. (2021) [18] measured PM2.5 and PM10 concentrations and investigated the subjective perception of users in the Ice Cube curling hall of the Winter Olympic Games from 2019 to 2022. They proposed the interactive relationship between the indoor PM2.5 particle concentration and the heat and humidity environment for the first time.
In terms of indoor PM2.5 concentrations, researchers often use computational fluid dynamics (CFD) techniques for the numerical analysis of airflow distribution. Bellache et al. (2002, 2005) [19,20] used the standard K-e model to conduct two-dimensional steady-state simulations of the thermal and humid environments of an ice rink. Their simulation considered radiation, turbulent mixed convection, and vapour diffusion between all internal surfaces, including the building envelope. The simulation results were consistent with the measured heights, thereby verifying the feasibility of the CFD simulation for ice rink buildings. Omri et al. (2016) [21] established a three-dimensional (3D) model applicable to an ice rink based on Bellache et al. (2005) [20] and performed a numerical simulation of an ice sports arena using radiant heaters. This was the first time 3D CFD simulations of airflow and heat transfer were conducted for an indoor ice rink. Palmowska et al. (2017, 2018) [22,23] conducted a comprehensive comparative study of five factors using different dehumidification methods, air supply methods, internal circulation systems, personnel numbers, and ceiling emissivity in ice rinks, using CFD simulation technology in subsequent studies. They described the influence of each factor on the air environment of ice rinks, thereby providing an essential reference for simulating and designing indoor air environments in modern ice sports venues. Kwon et al. (2019) [24] simulated and compared the top mixed ventilation and downward displacement ventilation systems using an indoor ice skating rink built in Yong’an, Republic of Korea. They found that the mixed ventilation method was more effective at eliminating fog generated near the ice surface. CFD simulation technology has been widely applied, and many cases exist in China in which CFD simulation technology was used to examine the indoor air environment of sports venues [25,26]. These studies indicate that CFD simulation technology is an accurate and reliable research method, particularly for tall space buildings, such as sports venues. The use of simulation technology to guide design optimisation can effectively improve building quality and has practical significance.
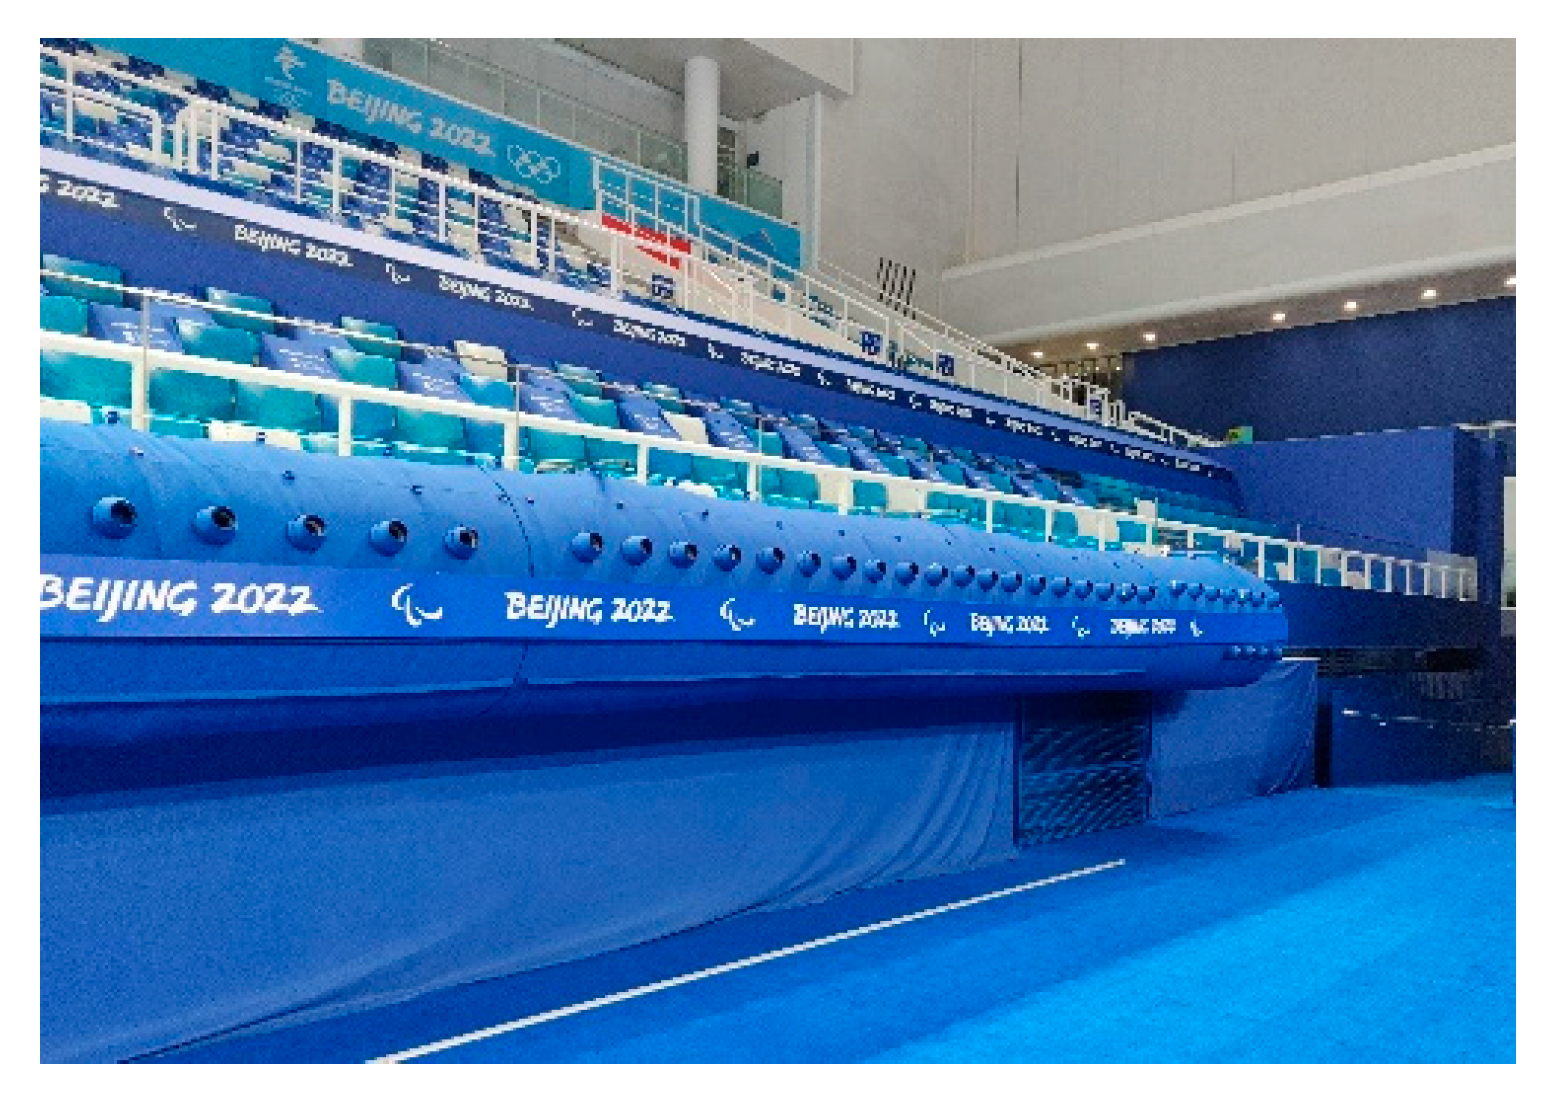
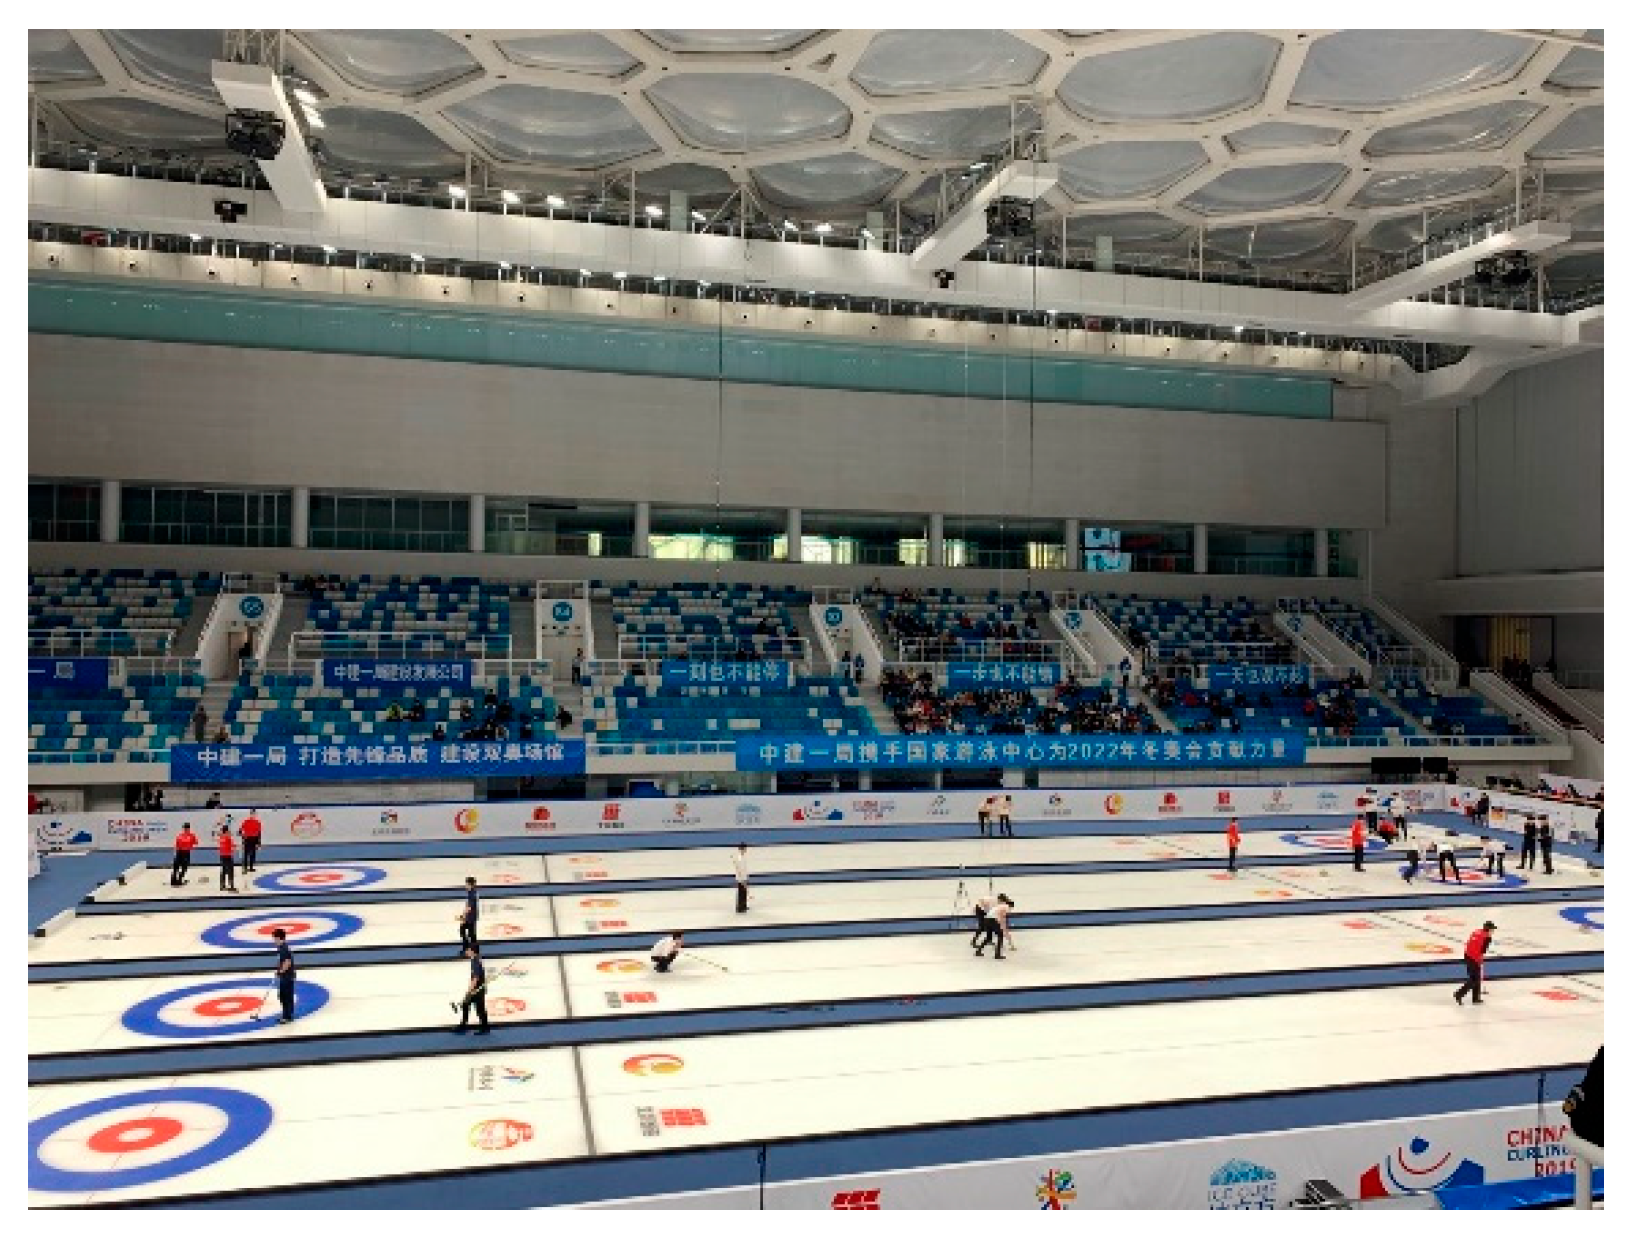
Curling is the most demanding ice sport under hot and wet conditions. Curling venues have large spaces, the largest air seepage in the envelope structure, and a nonuniform heat and humidity indoor environment, which makes the air environment complex and different from those of ordinary living and office spaces. Therefore, the measured data in this study are insufficient to show the complete indoor air quality distribution of the stadium, and it is necessary to supplement the simulation data. During the Winter Olympics, the National Aquatics Center (‘Water Cube’ and ‘Ice Cube’) built a detachable curling track on the swimming pool of the ‘Water Cube’ to achieve ‘water ice conversion’, transforming it into an ‘Ice Cube’ with an internal space of up to 31 m. It hosted male and female curling and wheelchair curling competitions, freely transitioning between ‘ice water’ sports, and became an example of ‘Exemplary post-match utilization of Olympic venues’, as shown in Figure 1. Based on previous field measurements at the curling venue of the National Aquatics Center [16,17,18], the concentration distributions of indoor PM2.5 particles were further simulated and analysed in this study. The purpose of this study is to (1) establish four simulation scenarios based on the measured data from 2019 to 2020 and 2021 to 2022, analyse the simulation results, and calibrate the model to verify the accuracy of the simulation; (2) visualise PM2.5 distribution in curling venues through simulation, assess the influencing factors, and analyse the variations in PM2.5; (3) propose measures to improve the indoor air quality of curling venues and provide references for similar ice venue architectural design and engineering construction.
2. Methodology
2.1. Establishment of Simulation Model
A simulation model was established to simulate the environment of PM2.5 to further examine the air environment in the stadium. SketchUp was used for auxiliary modelling, and ICEM CFD was used for model refinement and mesh division. The number of meshes was approximately two million; 99.9% of the mesh quality ranged between 0.95 and 1, and the mesh quality satisfied the requirements. Standard k-Ɛ turbulence was used to simulate the PM2.5 concentration using Fluent19.0 [27,28]. The indoor particulate matter movement is a quite complex process. In order to simplify the model for simulation, the following assumptions are made to the model:
- (1)
- The indoor supply air volume and return air volume are stable values.
- (2)
- Not considering the indoor PM2.5 reduction rate.
- (3)
- Indoor PM2.5 is uniformly distributed.
- (4)
- Assuming that the indoor PM2.5 emission intensity is constant, and does not change over time.
- (5)
- Neglecting the dust generation in ventilation ducts and the PM2.5 deposition inside the ducts.
Generally speaking, the indoor PM2.5 diffusion in curling venues occurs in turbulent flow fields. Therefore, the indoor pollutants’ convective diffusion law should be based on turbulent diffusion theory, and an accurate numerical simulation of the convective diffusion process should be carried out on this basis. A reasonable turbulence model has a significant impact on the accuracy of the simulation. The commonly used turbulence models can be divided into two categories: One is eddy viscosity models, including zero equation models, one equation model, and two equation models. Another type is second-order moment closure models based on Reynolds stress transport equations, including Reynolds stress models and algebraic stress models. The standard k-epsilon is a dual equation model developed on the basis of the k-equation model that characterizes turbulent pulsation kinetic energy and has wide applicability. Although in terms of accuracy, RNG k-ε The model has more advantages, and many scholars have also achieved good results in using the standard k-ε model to simulate the diffusion of atmospheric pollutants. For example, [27] used the standard k-ε model to simulate natural ventilation and the diffusion and distribution of pollutants in street valleys, and the simulation results were consistent with the actual situation. In [28], the authors used the standard k-epsilon model to simulate the effect of temperature on the three-dimensional block flow field and pollutant diffusion, which showed good consistency with actual measurement data. Compared with on-site detection data, the two were in good agreement, indicating that the standard k-epsilon model can be applied to simulate the diffusion of pollutants in different types of environments. In the standard model, k and ε are two basic unknowns. The corresponding transport equation is as follows [29]:
- (1)
- k equation:
- (2)
- ε equation:
Gk is the term for the generation of turbulent kinetic energy k caused by the average velocity gradient:
Gb is the term for the generation of turbulent kinetic energy k caused by buoyancy:
YM represents the contribution of pulsation expansion in compressible turbulence. Sk and Se are user-defined source items. Cμ = 0.09, σK = 1.0, σε = 1.3, C1 = 1.44, C2 = 1.92.
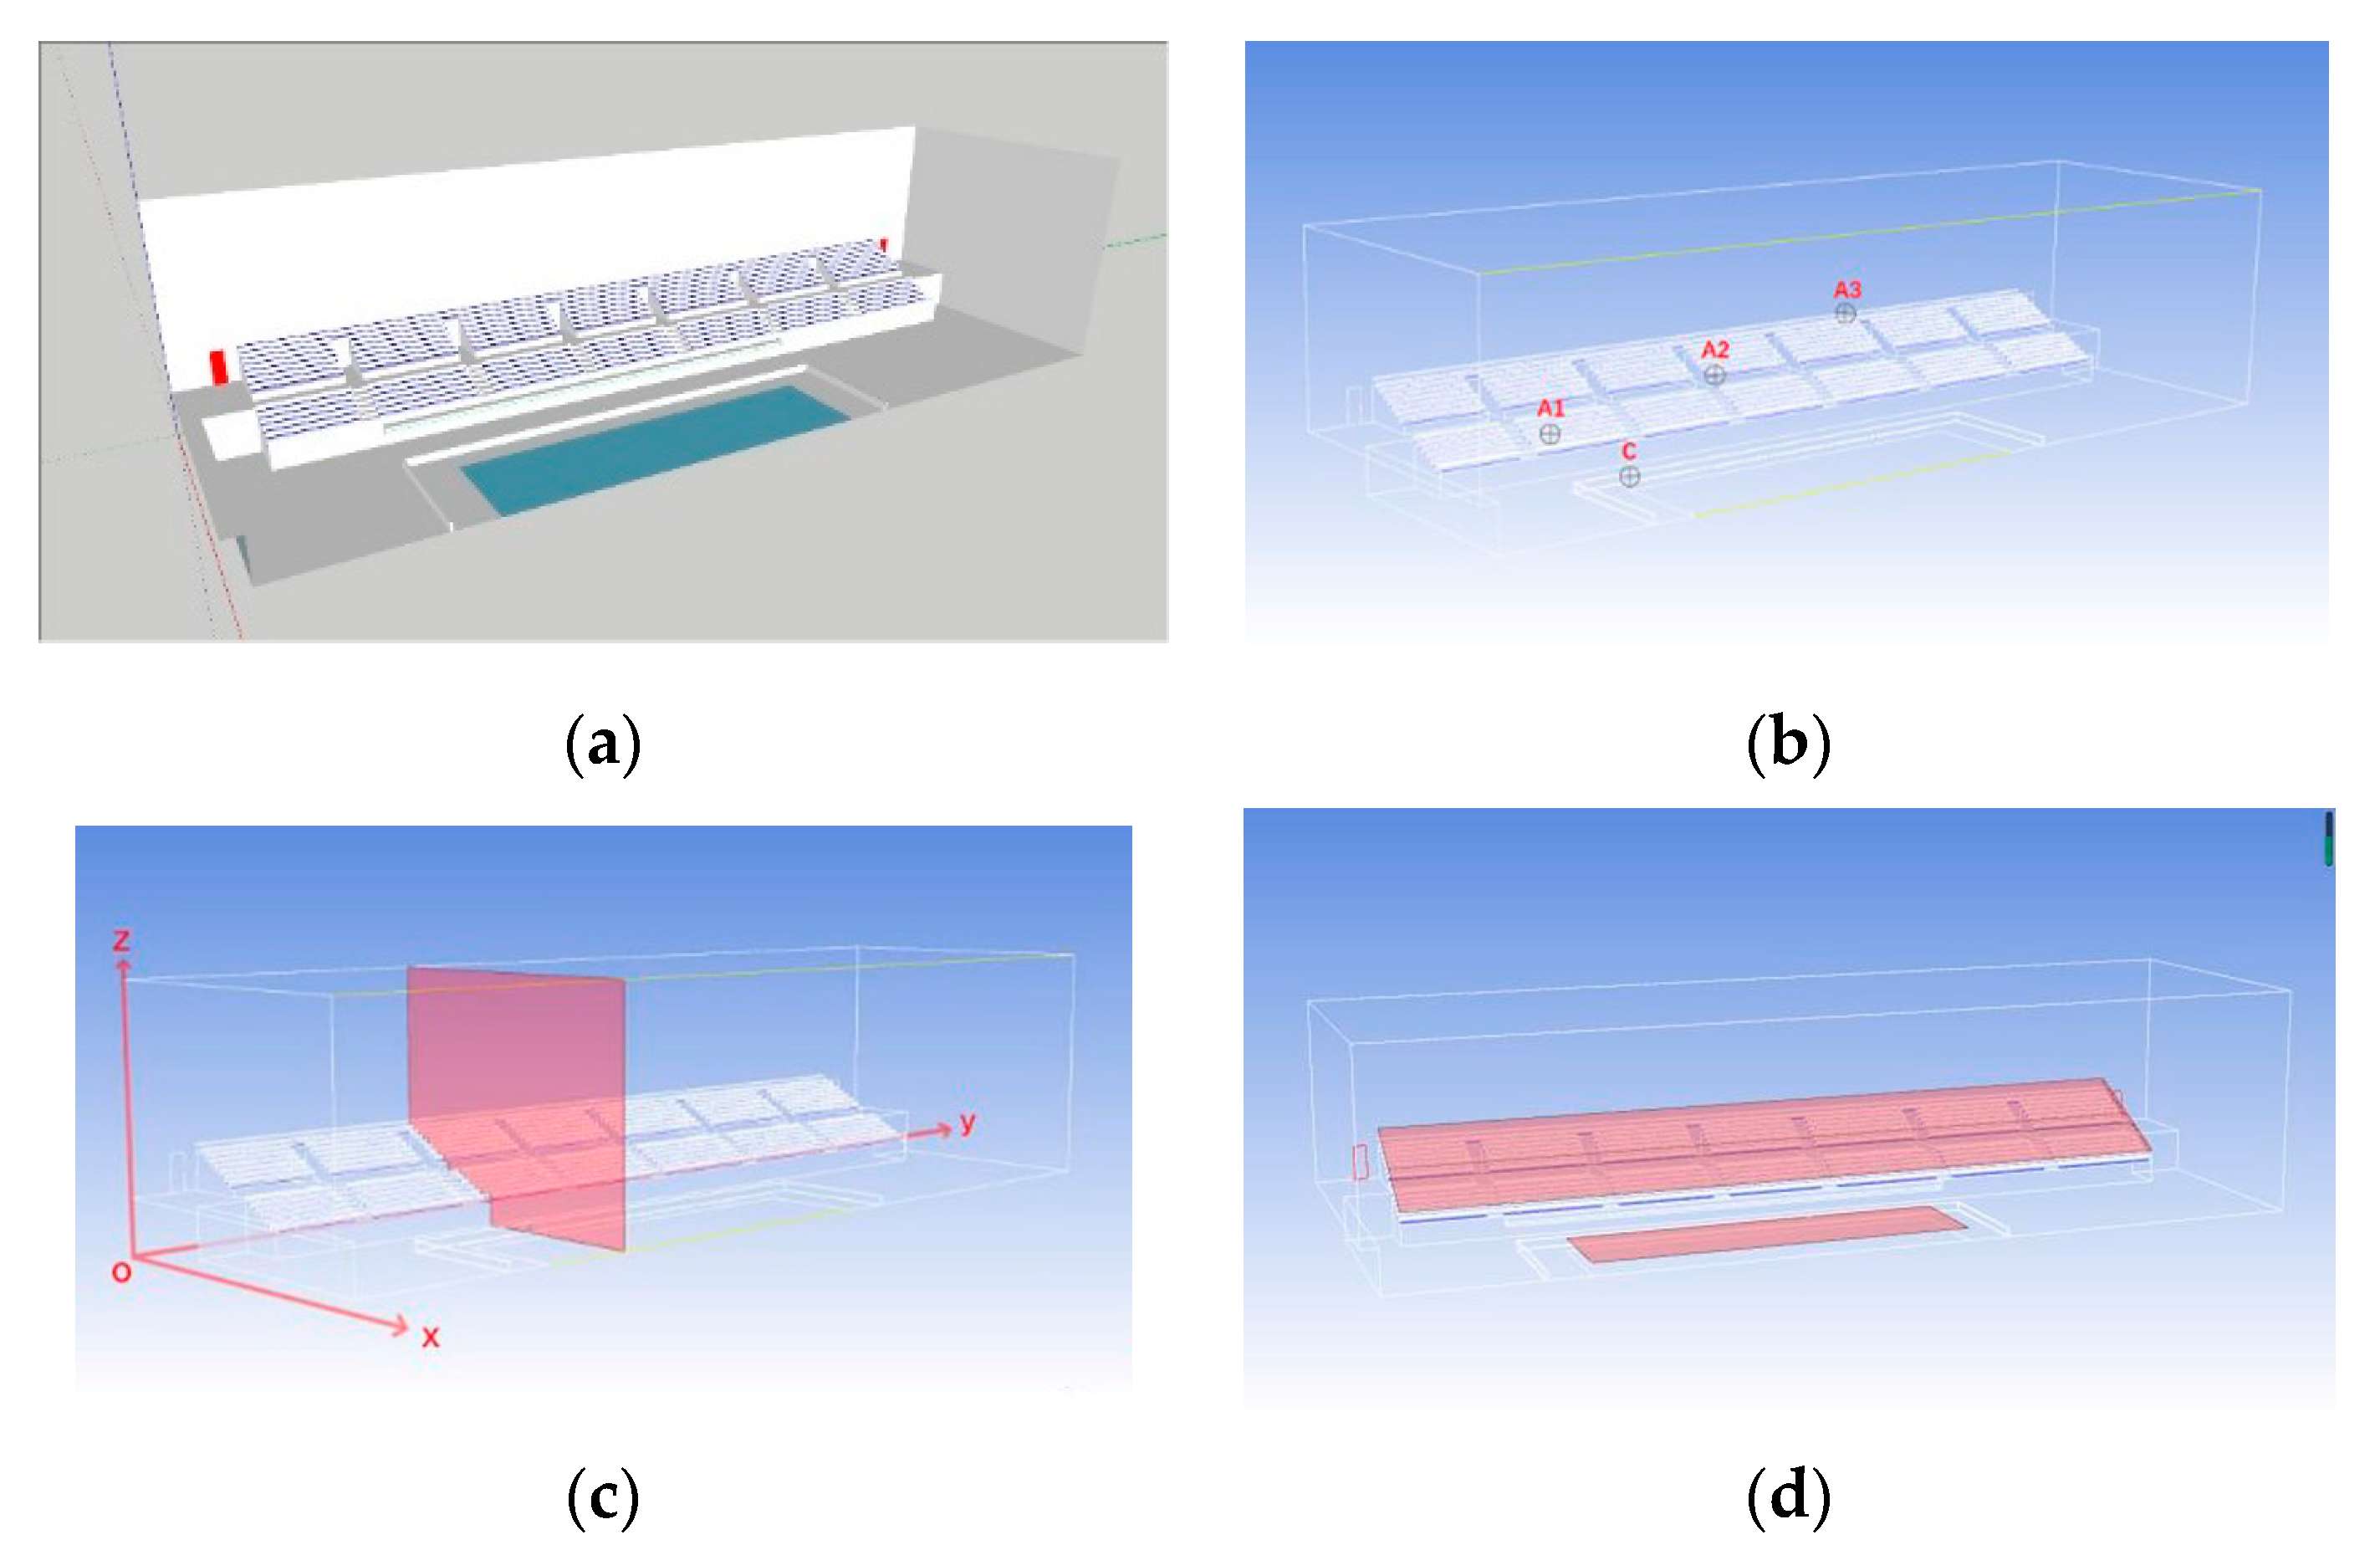
Secondly, a simulation model was established based on the actual state of the venue. Because the curling hall of the National Aquatics Center is symmetrical from north to south, only the northern side of the venue was modelled to improve simulation speed, and the overall condition of the venue was simulated by setting up a symmetrical surface [30,31,32]. Figure 2a illustrates the establishment of the model. Pixel amplification was performed on the Y-axis coordinate values to ensure clarity in the CFD simulation diagram.
The simulation results were compared with the measured results to verify the accuracy of the simulation results, and the corresponding data collection points were established in the model according to field-measured locations [16], as shown in Figure 2b. Points A1, A2, and A3 were located in the lower part of the northern spectator area, middle corridor, and upper part, respectively, representing the air environments at different heights of the spectator area. Point C was located in the competition area, representing the air environment of the competition area. Each collection point was located at a height of 1.5 m from the ground, which was the same height as the measured measurement point. In addition, the bottom floor of the north-west corner of the stadium was adopted as the coordinate origin, the south direction was the positive x-direction, the east direction was the positive y-direction, and the vertical direction was the positive z-direction to establish the coordinate system and reveal the distribution of PM2.5 concentration in the competition and spectator areas of the venue. The section at a distance of 35 m from the origin of the model coordinates in red is called the y = 35 m section. The interface passed through the central area of the ice surface, which displayed the simulation conditions of the spectator and competition areas, as shown in Figure 2c. The World Curling Federation (WCF) proposed a standard for temperature and relative humidity at a height of 1.5 m above the ice surface. Therefore, the 1.5 m section above the ground in the competition area was the simulation interface. The 1.5 m section above the ground on each floor in the spectator area was the simulation interface of the spectator area, as shown in Figure 2d.
Finally, the boundary conditions of the model were set, as shown in Table 1, considering the heat exchange of the ice surface and the effects of heat and humidity on the venue [33,34,35]. The temperature and relative humidity at the ice surface were determined based on relevant guidelines from the WCF. Based on measured analyses [16], the temperature and relative humidity within the stadium influence the PM2.5 particle concentration, whereas exhaled air from human bodies contains high moisture content and temperature, which also influences the relative humidity and temperature of the spectator area. Therefore, the model considers the influence of the ice surface and heat dissipation and respiration from human bodies in an indoor air environment. Because of the large size of the venue model and numerous spectators, modelling the humans within the venue is challenging. Alternative methods were employed in this study to alleviate the computational burden by incorporating air supply ports and heat dissipation surfaces into the audience area to simulate the breathing and cooling effects of the audience members, thereby significantly reducing the complexity of the model construction process while shortening the simulation time. Regarding the boundary parameter settings, the main references include field measurements [16], architectural design drawings and heating, ventilation, and air conditioning (HVAC) design specifications for venues [36], and the literature sources [37].
2.2. Simulated Scenarios
In this study, detailed tests were conducted on the PM2.5 particle concentrations in the indoor air of the stadium from 2019 to 2022. During this period, the outdoor weather conditions and internal facilities of the stadium changed; nonetheless, the measured results provided corresponding conclusions [16]. However, it is difficult to clarify the influence and distribution of PM2.5 concentrations in the stadium using actual measurements. Therefore, in the simulations, four simulation scenarios were first established based on the actual state of the venue (Table 2). The audience was mainly concentrated in the south and north stand areas, which was known as the audience area in the simulation. The west stand was mainly occupied by media reporters, staff, and referees, which was called the referee area in the simulation. The east stand was mainly used by the layout equipment and some staff, and this area is called the temporary area in the simulation.
Scenarios 1 and 2 correspond to the curling venue status from 2019 to 2020, whereas Scenarios 3 and 4 correspond to the curling venue status from 2021 to 2022. The outdoor air quality index (AQI) and outdoor PM2.5 concentration values were obtained from the measured data. The air supply method at the end of air conditioning in the competition area adopted air supplies from ground displacement and a small-hole jet cloth bag duct. The airtightness of the venue was set based on the current situation. Since 2020, further improvements have been made regarding the air conditioning system and indoor airtightness of the curling venue, such as sealing the pores at the top of the competition hall and the north and south walls and sealing the pores connecting the corridors. Therefore, the airtightness of the venue from 2021 to 2022 was better than that from 2019 to 2020.
2.3. Air Quality Standards
According to the World Health Organization Air Quality Guidelines [42], China’s Ambient Air Quality Standards (GB3095. 2012) [43], and Design Standards for Indoor Air Quality Control of Public Buildings (JGJ/T461. 2019) [44], the limit requirements for PM2.5 concentration in China are lower than those specified by the World Health Organization. Because the curling venue investigated in this study was the Winter Olympic competition venue, the 24 h average concentration limit of 25 μg/m3 specified by the World Health Organization was adopted.
3. Data Analysis
3.1. Analysis of Simulation Results for the Four Scenarios
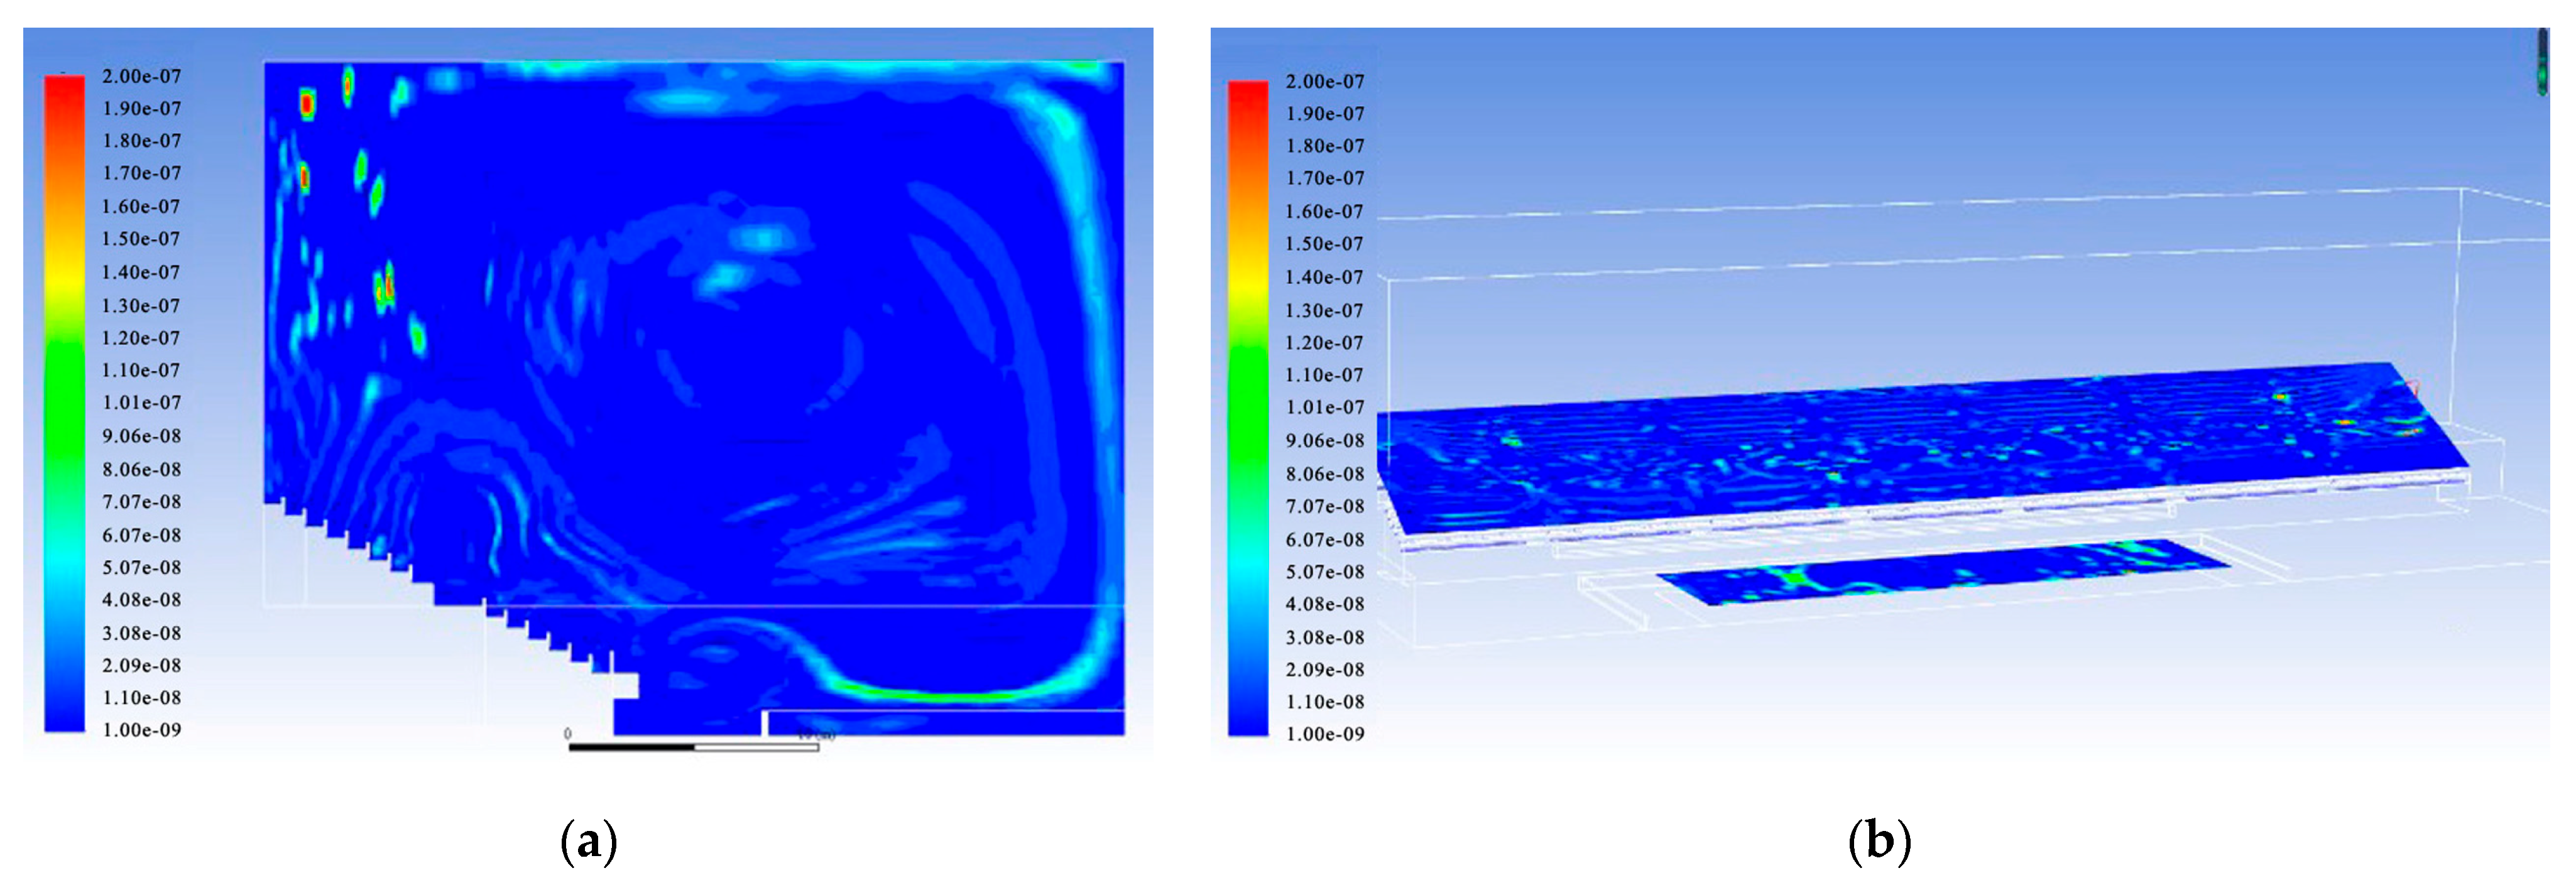
The simulation results for Scenarios 1 and 2 are presented in Figure 3 and Figure 4, respectively. In Scenario 1, the outdoor air quality was good (the PM2.5 concentration was approximately 40 μg/m3), whereas the indoor PM2.5 concentration was generally low. In Scenario 2, the indoor PM2.5 concentration increased significantly. Compared to Scenario 1, the outdoor air quality deteriorated, with the AQI increasing from 66 to 181, and the outdoor PM2.5 particle concentration increasing from 50 to 140 μg/m3 (Table 2). Although the average concentration in the competition area was approximately 12 μg/m3, which satisfied standard requirements, the PM2.5 concentration in the audience area increased significantly, and the average concentration was approximately 65 μg/m3, which exceeded the standard limit. This is because the decrease in outdoor air quality results in an increase in the amount of particulate matter entering through the seat fresh air, and the competition area is less affected by variations in the outdoor PM2.5 concentration, owing to the low amount of fresh air. In Scenario 2, the PM2.5 concentration in the central corridor of the audience area and the upper part of the east and west sides of the audience seats were relatively high (approximately 40 μg/m3). This is because the middle corridor is prone to forming air vortices, which can lead to the accumulation of PM2.5. The east and west sides of the audience area were close to the return air vents, and the wind speed was high, which could easily cause an increase in the PM2.5 concentration.
The simulation results for Scenarios 3 and 4 are presented in Figure 5 and Figure 6. The outdoor air quality deteriorated, with the AQI increasing from 30 to 171, and the outdoor PM2.5 concentration increasing from 4 to 94 μg/m3. The indoor PM2.5 concentration increased significantly, but the average concentration was approximately 10 μg/m3. None exceeded the standard limits, particularly the PM2.5 concentration in the audience area, which was effectively controlled.
Compared with Scenario 2, Scenario 4 also has poor air quality; however, the PM2.5 concentrations in the venues decreased from 8–86 to 1–14 μg/m3. Among them, the improvement was more significant in the spectator area, where the highest PM2.5 concentration decreased from 86 to approximately 10 μg/m3.
3.2. Simulation Accuracy Verification
Because the setting parameters for the four scenarios were derived from actual venues and corresponding measured data exist, the simulation data were validated. In this study, two methods were used to verify the accuracy of the simulation results through an error analysis of the simulated and measured data. Three indicators were selected for error evaluation: mean absolute error (MAE), mean absolute percentage error (MAPE), and root mean square error (RMSE). The MAE is the average of the absolute errors between the simulated and measured data and is used to evaluate the magnitude of the absolute error in simulation experiments. The MAPE is the average value of the percentage error between the simulated and measured data and is used to evaluate the magnitude of the percentage error in simulated experiments. The RMSE is an indicator of the consistency between the trend of the simulated and measured data and is used to evaluate whether the trend of the simulated experiments is consistent with the measured data. The equations are expressed as follows:
MAE:
MAPE:
RMSE:
where xi is the onsite measurement value, yi is the simulation result, and p is the number of sampling points. The lower the MAE, MAPE, and RMSE values, the smaller the error. If MAE and RMSE exceed half of the standard deviation (SD) of the measured data and MAPE is lower than 25%, the simulated data are in good agreement with the measured data [45,46].
Four error evaluation indicators were calculated for two scenarios (Table 3).
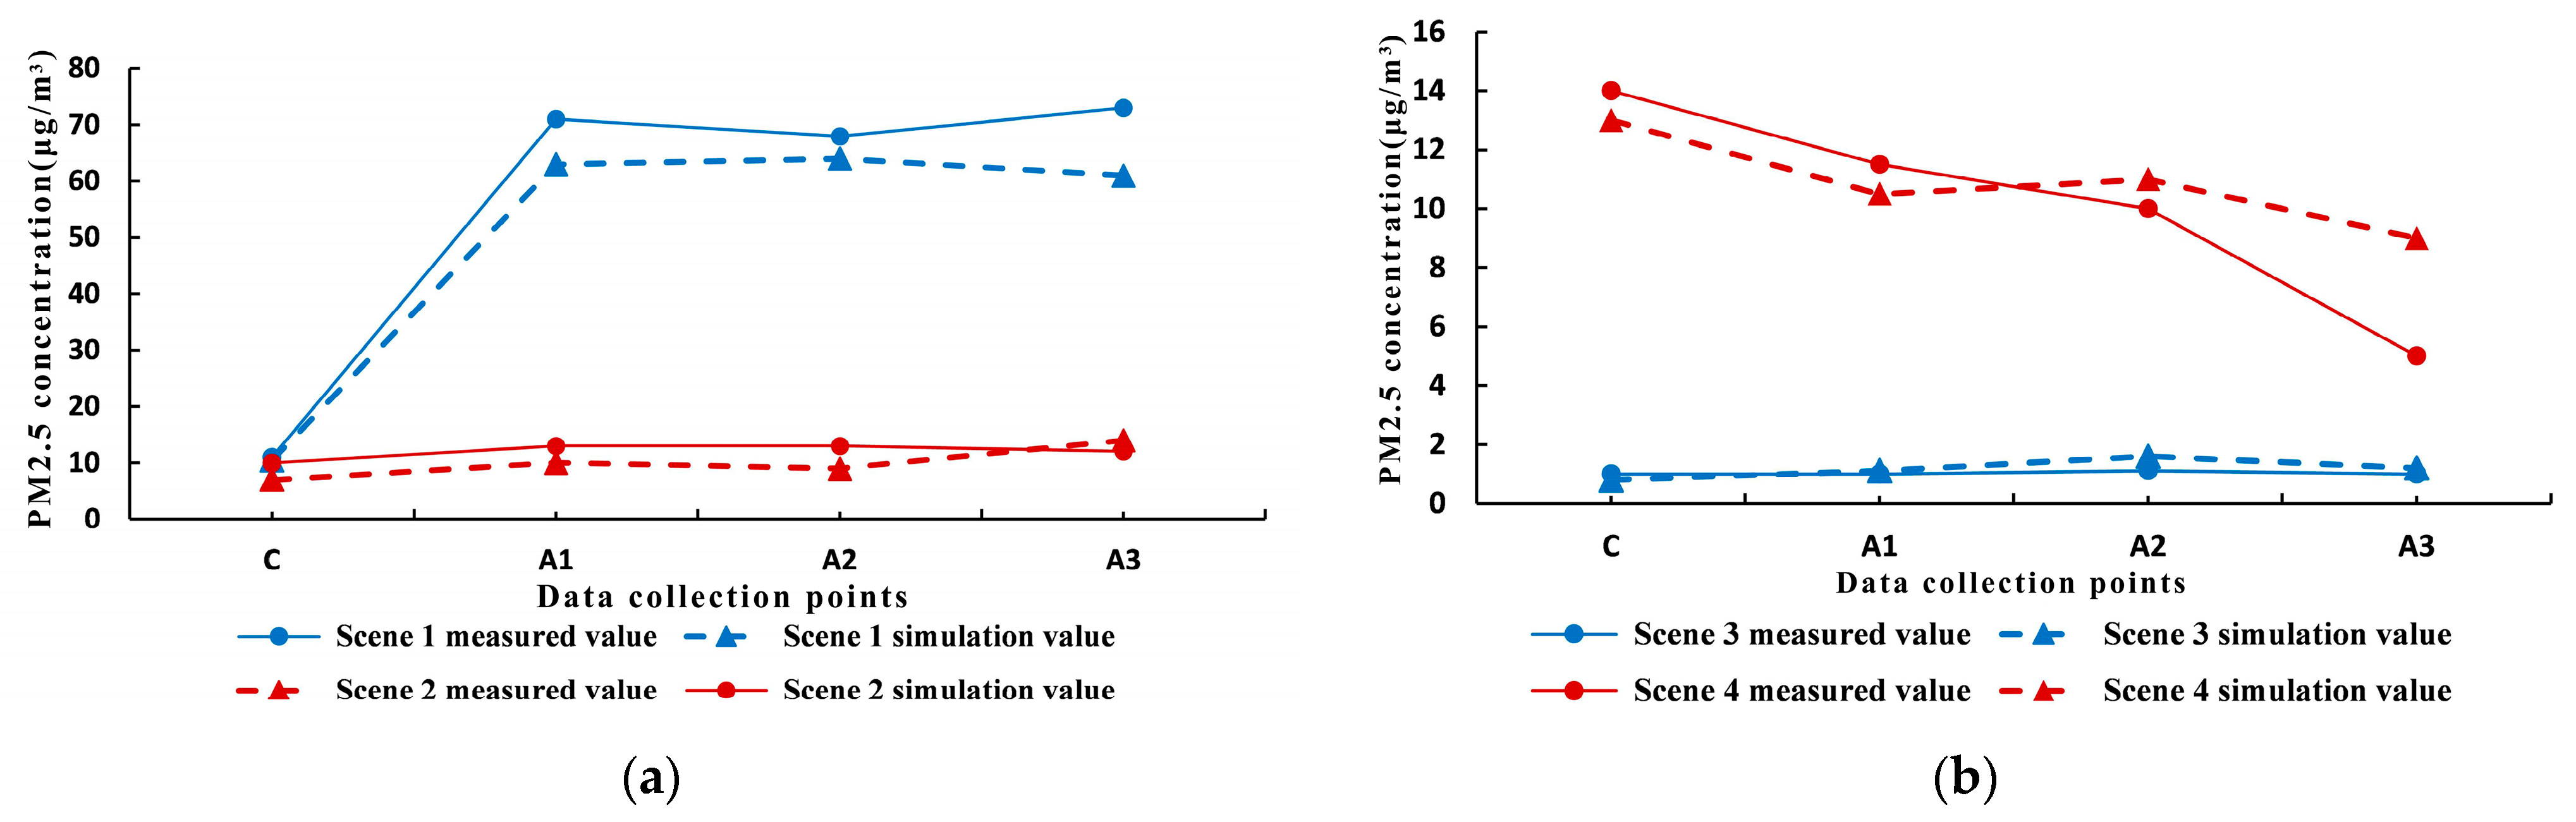
(1) Scenarios 1 and 2 were compared with the measured data, and the MAE between the simulated and measured data for the PM2.5 concentration was 4.4 μg/m3. Both the MAE and RMSE were lower than SD/2, and the MAPE values were lower than 25%, indicating a high degree of consistency between the simulated and measured data. The simulated and measured values of the PM2.5 concentration at each collection point in Scenarios 1 and 2 showed consistent trends (Figure 7a).
(2) Scenarios 3 and 4 were compared with the measured data, and the simulated data for various indicators of the PM2.5 concentration were consistent with the measured data. Both the MAE and RMSE values were lower than SD/2, and the MAPE values were lower than 25%. The simulated and measured values of the PM2.5 concentration at each collection point in Scenarios 3 and 4 showed consistent trends (Figure 7b).
The MAE, MAPE, and RMSE values of the PM2.5 concentration simulation data and measured data satisfied the error requirements, and the data were consistent. The existing models can satisfactorily reflect the actual conditions, providing support for further detailed research.
4. Results and Discussion
Exist in indoor PM2.5 particle concentrations between different scenarios, mainly owing to the outdoor weather conditions, airtightness of the venue, and air supply mode at the end of the air conditioner. In this section, the variables are controlled to analyse the variation characteristics of PM2.5 particle concentrations in venues.
4.1. Influence of Outdoor Weather Conditions
Based on the simulation results in Figure 3, Figure 4 and Figure 5 and the preliminary research literature [16], the outdoor PM2.5 concentration significantly influences the concentration of PM2.5 particles in the stadium. Although the fresh air system somewhat filters the air entering the stadium, the outdoor air easily enters the stadium through various gaps and entrances, thereby affecting the indoor air quality. The outdoor PM2.5 concentration was uniformly valued between 30 and 150 μg/m3 (30, 50, 70, 90, 110, 130, and 150 μg/m3) based on the actual measured situation during simulation to clarify the influence of outdoor PM2.5 concentration on indoor PM2.5 concentration. Variations in the indoor PM2.5 concentration under different values were observed. The values for the fresh air system of the venue were based on the air conditioning system parameters specified by the ASHRAE Handbook of the United States (2019) [47].
Figure 8 shows the average PM2.5 concentration in each venue area under different outdoor air conditions. As the outdoor PM2.5 concentration increased, the indoor PM2.5 concentration showed a gradual upward trend. For every 20 μg/m3 increase in outdoor PM2.5 concentration, the indoor PM2.5 concentration increased by approximately 6 μg/m3. When the outdoor PM2.5 concentration reached 90 μg/m3, the average indoor PM2.5 concentration in the main area of the venue began to exceed the specified value. When the outdoor PM2.5 concentration was 150 μg/m3, the indoor PM2.5 concentration was 5.5 times that of the outdoor PM2.5 concentration at 30 μg/m3.
Table 4 lists the distribution values of the PM2.5 concentration in the stadium when the outdoor PM2.5 concentrations were 30, 70, and 110 μg/m3, respectively. The areas with higher PM2.5 concentrations were concentrated in the competition area, east and west sides of the spectator area, and areas with high concentrations of air supply under the seats. The PM2.5 concentration was lower in the corridor and evacuation gate areas. In the referee and temporary areas, PM2.5 was mainly concentrated on the side of the area. Table 4 also presents the overall increases in the outdoor and indoor PM2.5 concentration. The spatial distribution characteristics remained basically unchanged.
4.2. Influence of Venue Airtightness
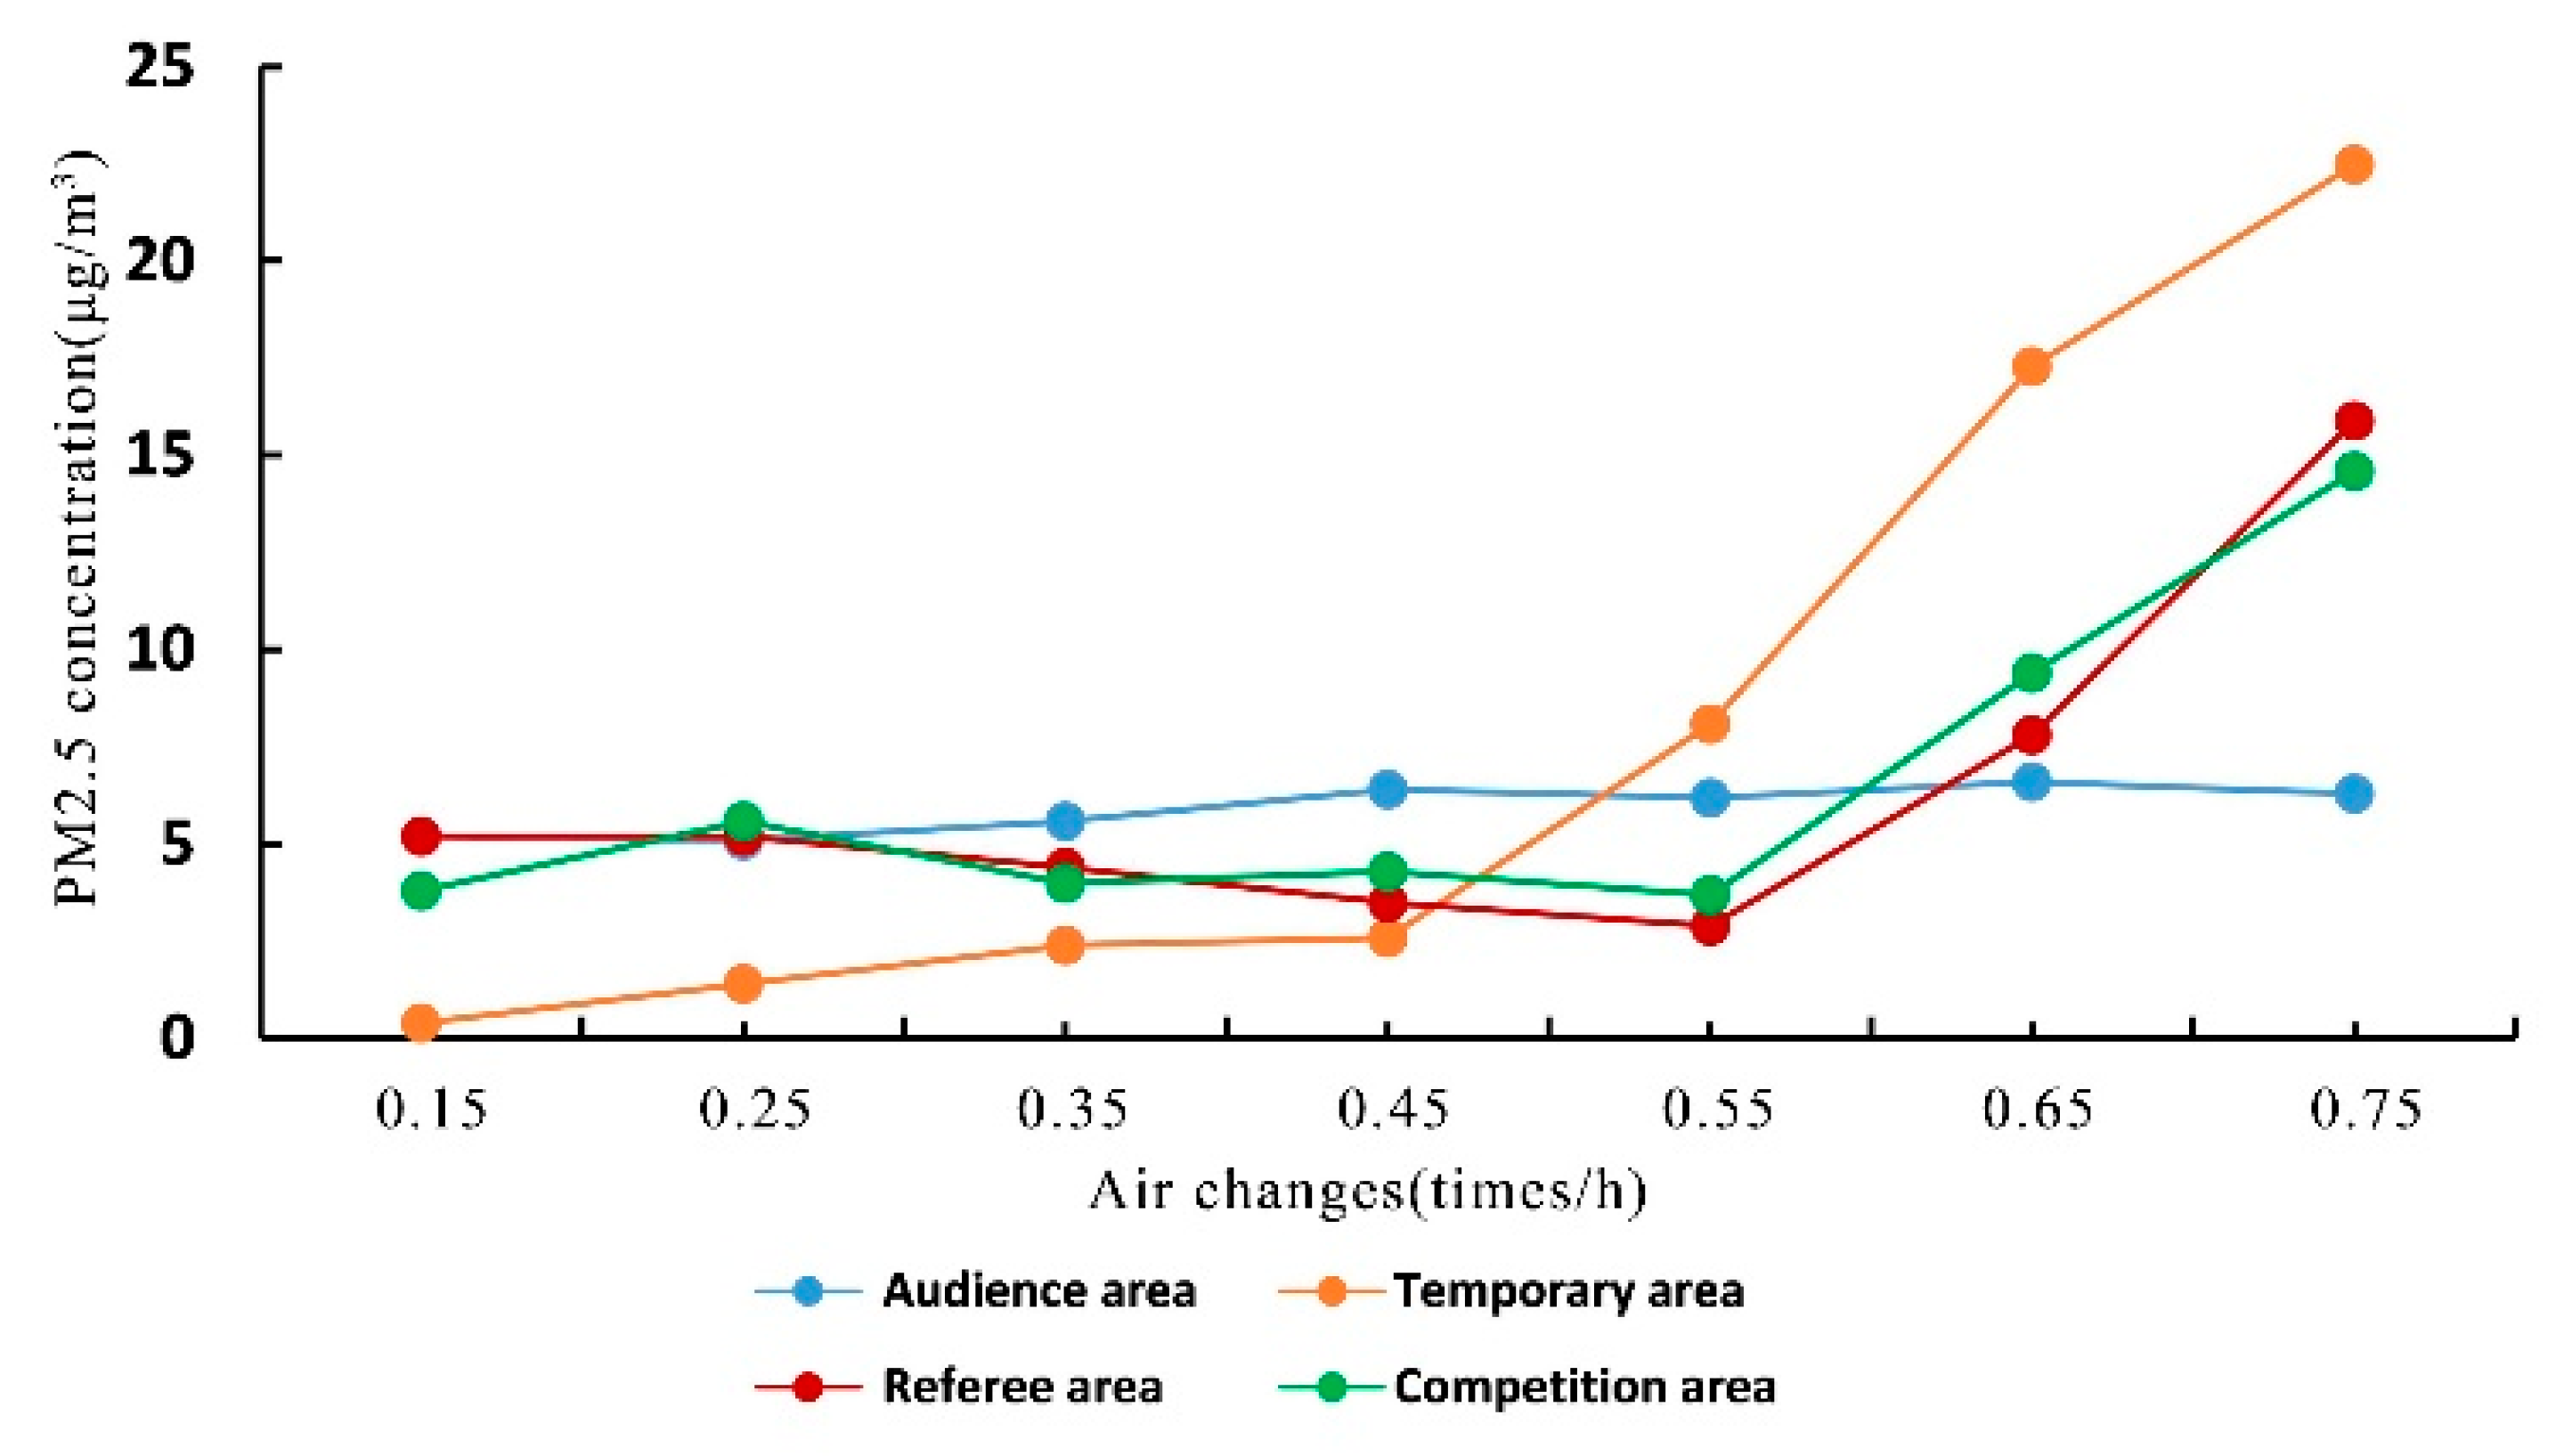
Previous analyses have shown that indoor PM2.5 concentration is significantly influenced by outdoor PM2.5 concentration. Therefore, it is of concern whether outdoor particles enter the indoor environment via wind infiltration through door and window openings. According to actual investigations and the literature [48,49,50,51,52,53], locations may exist in the curling venue where permeable wind acts, such as the top pores of the competition hall and the north and south walls, the pores connecting the corridor, entrances and exits for various spectators in the venue, the curtain wall holes on the east side of the venue, and the gate leading to the underground garage. The locations where infiltration winds may act in the model were identified. Manz et al. [45] recommends that the number of air changes per hour of infiltration wind should be used as the basis for measuring the infiltration air volume in buildings. Based on engineering measurements, the ventilation frequency of the infiltration air was set to 0.15–0.75 times/h. In the simulation, the actual values were 0.15, 0.25, 0.35, 0.45, 0.55, 0.65, and 0.75 times/h. An outdoor PM2.5 concentration of 90 μg/m3 was adopted under simulated working conditions. After the outdoor air was treated by the fresh air system, the fresh air speed in the competition and audience areas was 0.3 m/s.
Figure 9 shows the average indoor PM2.5 concentrations in the venue at different infiltration air exchange rates. As the number of infiltration ventilations increased, the PM2.5 concentration in each region increased. However, the increase in the PM2.5 concentration varied among different regions, with the temporary area on the eastern side being the most affected. Compared with 0.15 air changes per hour, the temporary area with 0.75 air changes per hour increased the PM2.5 concentrations by 55 times, whereas the competition and referee areas increased the PM2.5 concentrations by 2.0–2.8 times. The audience area experienced the least significant impact, with an increase of only 21%.
The PM2.5 distributions of the y = 35 m and x = 30 m cross sections are presented to reveal the variation in the PM2.5 concentration in the eastern temporary zone (Table 5). When the infiltration air exchange rate was 0.15 times/h, the PM2.5 concentration in the referee area closer to the entrance and exit of the venue was higher. The ventilation frequency of the infiltration air increased from 0.15 to 0.45 times/h, and the PM2.5 concentration in the competition and temporary areas on the eastern side increased significantly. However, no significant variation in the PM2.5 concentration occurred in the audience area. The ventilation frequency of the infiltration air increased from 0.45 to 0.75 times/h. As the infiltration air volume increased, the wind speed of the infiltration air increased, and the infiltration air entered the room through the pores of the curtain wall. The PM2.5 concentrations in the temporary area on the eastern side, which was closer to the curtain wall, increased significantly.
4.3. Influence of Air Supply Methods in the Competition Area
The simulation results presented in Figure 3, Figure 4 and Figure 5 show that different air supply methods at the end of the air conditioning system in the competition area can affect PM2.5 concentration distribution. The ground air supply mode [38] and cloth bag duct air supply mode [39,40,41] have been introduced in Ref. [16]. The other HVAC parameters were kept unchanged in the simulations to compare the effects of the two air supply modes on the indoor air environment, and the air supply mode was used as the only control variable. Among the variables, the wind speeds at the outlet of the ground air supply mode, outlet of the cloth bag duct air supply mode, and competition area were 0.3, 10, and 0.2 m/s, respectively, based on the measured value. Figure 10 shows the distribution of the PM2.5 concentration in each area of the room for the two air supply modes. The PM2.5 concentration in the competition area significantly decreased from 30.7 to 19.7 μg/m3 when the air supply mode was switched from ground air supply to cloth bag duct air supply. However, the average PM2.5 concentration in the eastern temporary area increased from 20 μg/m3 to an average of 34 μg/m3. This is because the installation location of the cloth bag duct air supply mode mainly faced the competition area, which minimally influenced the eastern temporary area. Moreover, the overall wind speed in the eastern temporary area was low, particles gathered easily, and the PM2.5 concentration was high. However, because the temporary area on the eastern side was primarily used as the equipment area, the air quality there was not as critical as that in the competition area. Therefore, the cloth bag duct air supply mode can significantly improve PM2.5 concentrations in the competition area.
In 2022, the cloth bag duct air supply system was adjusted accordingly to improve the humidity in the competition area. The air outlet was changed from a small double-row hole with a diameter of 1 cm to a single-row hole with a diameter of 10 cm. The number of holes in a single air duct was approximately 200, and the holes could be opened and closed flexibly using zippers. The air outlet was oriented 45° diagonally. The venue was in the sixth and seventh rows of audience seats in the southwest and northeast corners of the audience area. A return air outlet was added for the fresh air return of the cloth bag air duct, and a backup return air outlet was set under the cloth bag air duct, as shown in Figure 11. After replacing the cloth bag air duct, the fresh air volume increased as the air hole of the cloth bag air duct opened. A jet of fresh air from the cloth bag air duct shot diagonally and crossed the ice rink fence, directly reaching the competition area. After adding a return air outlet to the audience area, it was easier for fresh air from the cloth bag air duct to reach a height of 2–4 m above the competition area. This was beneficial to controlling the humidity of the competition area on a larger scale and preventing condensation on the ice surface. The PM2.5 concentration in the stadium after the renovation of the cloth bag air duct was extremely low. The average PM2.5 concentration in the competition area was approximately 1.3 μg/m3, and the average PM2.5 concentration in the audience area was 0.6 μg/m3, which was 93% lower than that before renovation.
5. Conclusions
Based on a preliminary experimental investigation of the National Aquatics Center Curling Gymnasium, CFD simulation technology was used in this study to simulate and analyse indoor PM2.5 concentration. In addition, the effects of the outdoor weather conditions, building airtightness, and air conditioning terminal supply methods on the distribution of indoor PM2.5 concentrations were analysed. The conclusions of this study are as follows:
- (1)
- The outdoor PM2.5 concentration significantly influenced the indoor PM2.5 concentration. When the outdoor PM2.5 concentration increased by 20 μg/m3, the indoor PM2.5 concentration increased by 6 μg/m3 on average. When the outdoor PM2.5 concentration reached 90 μg/m3, the indoor PM2.5 concentration exceeded the limit value of 25 μg/m3.
- (2)
- For ice sports venues with almost no natural ventilation, fresh air systems are key to ensuring indoor air quality.
- (3)
- When the airtightness of the venue was good, that is, the infiltration and ventilation frequency was 0.15 times/hour, the outdoor air quality had no significant impact on the average indoor PM2.5 concentration. With an increase in the infiltration air exchange time, the PM2.5 concentration in all the regions increased. The temporary area on the eastern side was the most affected area. Compared with a ventilation rate of 0.15 times/h, the PM2.5 concentration in the competition area at a ventilation rate of 0.75 times/h increased by 55 times, whereas that in the audience area had the least influence, only increasing by 21%.
- (4)
- The air supply system at the end of the air conditioner in the competition area adopted the cloth bag duct air supply mode. Compared with the ground air supply mode, the fresh air from the air conditioner could directly reach the area near the ice surface, and the air supply volume could be appropriately increased, decreasing the PM2.5 concentration in the competition area by 93%.
- (5)
- Measures for improving the air quality of curling venues are as follows.
① During the site planning process, areas with abundant greenery and good surrounding air environments should be selected as project sites as far as possible to minimise the possibility of excessive indoor particulate matter concentration.
② From the architectural design perspective, the direct outdoor door and window openings should be reduced, a door curtain should be set up at the frequently used entrance and exit, and a curtain wall structure with strong airtightness should be used.
③ From the perspective of daily management, strengthening the airtightness of the venue, closing entrances and exits, and organising the audience and staff in a unified manner can reduce the impact of outdoor air.
Author Contributions
Conceptualization, X.D. and J.L.; methodology, X.D. and J.L.; software, J.L.; validation, Z.T.; formal analysis, Z.T.; investigation, Z.T. and S.H.; writing—original draft preparation, X.D.and J.L.; writing—review and editing, Z.T.; visualization, J.L.; supervision, X.D.; funding acquisition, X.D. All authors have read and agreed to the published version of the manuscript.
Funding
This work was financially supported by the National Key Research and Development Program of China (NO. 2023YFE0102100).
Institutional Review Board Statement
Not applicable.
Informed Consent Statement
Not applicable.
Data Availability Statement
Data are contained within the article.
Acknowledgments
The authors would like to thank the administrative staff from the National Aquatics Center staff for their constructive feedback during the drafting of the manuscript.
Conflicts of Interest
Author Jiaxin Li was employed by China Railway First Survey and Design Institute Group Co., Ltd. The remaining authors declare that the research was conducted in the absence of any commercial or financial relationships that could be construed as a potential conflict of interest.
References
- Wang, Z.; Zhang, J.; Jin, C. The PM2.5 Concentration in the Indoor and Outdoor Air of Residences during Heavy Pollution in Beijing. Sci. Technol. Eng. 2019, 5, 312–318. (In Chinese) [Google Scholar]
- Ding, Y.; Di, Y. The Analysis if Air Flow Indoor on the Influence Factor about the Thermal Comfort. Contam. Control. Air Cond. Technol. 2014, 20–24. (In Chinese) [Google Scholar]
- Lu, W.; Chen, J.; Feng, X.; Wei, W. The Influence of Indoor Air quality on the Athletic Ability of Male College Students. Sport Sci. Res. 2013, 2, 72–74+79. (In Chinese) [Google Scholar]
- Rundell, K.W. High Levels of Airborne Ultrafine and Fine Particulate Matter in Indoor Ice Arenas. Inhal. Toxicol. 2003, 15, 237–250. [Google Scholar] [CrossRef] [PubMed]
- Rundell, K.W. Pulmonary Function Decay In Women Ice Hockey Players: Is There a Relationship to Ice Rink Air Quality? Inhal. Toxicol. 2004, 16, 117–123. [Google Scholar] [CrossRef] [PubMed]
- Stathopouiou, O.I.; Assimakopoulos, V.D.; BFlocas, H.A.; Helmis, C. An experimental study of air quality inside large athletic halls. Build. Environ. 2008, 43, 834–848. [Google Scholar] [CrossRef]
- Toomla, S.; Lestinen, S.; Kilpeläinen, S.; Leppä, L.; Kosonen, R.; Kurnitski, J. Experimental investigation of air distribution and ventilation efficiency in an ice rink arena. Int. J. Vent. 2019, 18, 187–203. [Google Scholar] [CrossRef]
- Brągoszewska, E.; Palmowska, A.; Biedroń, I. Investigation of indoor air quality in the ventilated ice rink arena. Atmos. Pollut. Res. 2020, 11, 903–908. [Google Scholar] [CrossRef]
- Guo, N.; Shui, Q.B. Analysis and Improvement of Air Quality of Large Sports Stadiums of Gansu Province. Gansu Gaoshi Xuebao 2018, 23, 115–118. (In Chinese) [Google Scholar]
- Jia, W. Testing and Evaluation of Indoor Air Microbial Colony Count in College Sports Venues. Sports Sci. Technol. 2017, 38, 27–28. (In Chinese) [Google Scholar]
- Yin, D.; Shi, B. Air quality analysis of gymnasium in elementary and secondary schools in Yinchuan. Sch. Health China 2017, 38, 1700–1703. (In Chinese) [Google Scholar]
- Ning, X.; Shen, H.; Liang, B. Analysis and countermeasures of indoor Air quality in Nanning Badminton Hall. Contemp. Sports Sci. Technol. 2016, 6, 131–132. (In Chinese) [Google Scholar]
- Xu, X. Study on Indoor Air Quality of Hubei Province Badminton Hall. Master’s Thesis, Wuhan Sports University, Wuhan, China, 2015. (In Chinese). [Google Scholar]
- Zhang, D.; Zhang, Y. Investigation and Analysis on Air Quality of Indoor Sports Environment of Colleges and Universities. J. Beijing Sport Univ. 2012, 35, 103–107. (In Chinese) [Google Scholar]
- Wang, G.; Guan, Y. The Study of Gym Microorganism Environment Safety at Harbin Institute of Technology. J. Harbin Inst. Phys. Educ. 2012, 30, 107–110. (In Chinese) [Google Scholar]
- Du, X.; Li, J. Indoor PM2.5 concentration test and analysis in Winter Olympics ‘Ice Cube’ curling venue. Energy Build. 2022, 258, 111837. [Google Scholar] [CrossRef]
- Du, X. Measurement and Analysis of PM2.5 Particle Concentration in Olympic Curling Stadium in Winter. Build. Energy Effic. 2020, 48, 144–149. (In Chinese) [Google Scholar]
- Zhang, Y.; Du, X. Indoor Air Quality Evaluation of Curling Arena Based on Occupants’ Perception. Build. Energy Effic. 2021, 49, 75–81. (In Chinese) [Google Scholar]
- Bellache, O.; Galanis, N.; Ouzzane, M.; Sunyé, R. Numerical Calculation of Air Velocity and Temperature in Ice Rinks. Proceedings eSim; Concordia University: Montreal, QC, Canada, 2002; pp. 84–91. [Google Scholar]
- Bellache, O.; Ouzzane, M.; Galanis, N. Numerical prediction of ventilation patterns and thermal processes in ice rinks. Build. Environ. 2005, 40, 417–426. [Google Scholar] [CrossRef]
- Omri, M.; Barrau, J.; Moreau, S.; Galanis, N. Three-dimensional transient heat transfer and airflow in an indoor ice rink with radiant heat sources. Build. Simul. 2016, 2, 175–182. [Google Scholar] [CrossRef]
- Palmowska, A.; Lipska, B. Research on improving thermal and humidity conditions in a ventilated ice rink arena using a validated CFD model. Int. J. Refrig. 2017, 86, 373–387. [Google Scholar] [CrossRef]
- Palmowska, A.; Lipska, B. Experimental study and numerical prediction of thermal and humidity conditions in the ventilated ice rink arena. Buildind Environ. 2018, 108, 171–182. [Google Scholar] [CrossRef]
- Kwon, Y.-I. A Study on Thermal Characteristics Affected by Air Distribution System Installed in Indoor Ice Rink Arena. Int. J. Air-Cond. Refrig. 2019, 1, 1950007. [Google Scholar] [CrossRef]
- Cheng, Z. Gymnasia Design Strategies Based on Natural Ventilation Simulation. Master’s Thesis, Harbin Institute of Technology, Harbin, China, 2017. (In Chinese). [Google Scholar]
- Wang, T. Natural Ventilation Design Strategy for Large Ball Games in National Fitness Centers. Master’s Thesis, Harbin Institute of Technology, Harbin, China, 2019. (In Chinese). [Google Scholar]
- Zhang, Z.; Huang, Y.; Cui, P.; Liu, Y.; Luo, Y. Effects of tree-canopy size and building height on ventilation and pollutant diffusion in street canyons. J. Univ. Shanghai Sci. Technol. 2022, 44, 269–280. (In Chinese) [Google Scholar]
- Huang, X.; Wang, H.; Cui, W.; Gao, L. Numerical simulation of the effects of temperature stratifications on airflow and pollutant dispersion in urban street canyons. Environ. Pollut. Control 2022, 4, 330–334. (In Chinese) [Google Scholar]
- Rufei, J. Relationship of Original Industrial Buildings Particulate Matter Concentration Levels Before and After the Industrial Remodeling; Chongqing University: Chongqing, China, 2014. [Google Scholar]
- Wang, H.; Duan, H.; Chen, A. Simulation of indoor PM2.5 and air distribution. J. Henan Univ. Eng. (Nat. Sci. Ed.) 2023, 35, 33–36. [Google Scholar]
- Liu, Y.; Liu, H.; Hong, G.; Liao, C. Simulation study on the importance of influencing factors of indoor PM2.5 spatial distribution. Build. Energy Environ. 2022, 41, 36–41. [Google Scholar]
- Yu, N. CFD Simulation and Study on Indoor Air Flow of a Gymnasium. Master’s Thesis, Tianjin University, Tianjin, China, 2012. (In Chinese). [Google Scholar]
- Fan, X.; Wang, H.; Hu, Y. Inverse Modeling of Indoor Airborne Contaminant Source Location Application of Coarse-grid Computation Fluid Dynamics. Fluid Mach. 2020, 7, 77–83. (In Chinese) [Google Scholar]
- Lin, J.; Liang, X. Simulation of Aircraft Cabin Thermal Comfort and Pollutants Concentration Distribution Based on CFD. Chin. Hydraul. Pneum. 2015, 12, 59–63. (In Chinese) [Google Scholar]
- Hou, X.; Wang, Y.; Liu, S.; Chen, X.; Zhang, X. CFD simulation and testing of unconventional pollutant emissions inside tractor cab. Trans. Chin. Soc. Agric. Eng. 2021, 24, 22–29. (In Chinese) [Google Scholar]
- Zhai, X. Experimental Research on Indoor Air Quality in Different Ventilation Modes of Residential Buildings in Xi’an. Master’s Thesis, Xi’an University of Architecture and Technology, Xi’an, China, 2021. (In Chinese). [Google Scholar]
- Li, G. The Indoor Air Quality Evaluation and Numerical Simulation of the Underground Supermarket. Master’s Thesis, Chongqing University, Chongqing, China, 2016. (In Chinese). [Google Scholar]
- Wu, R. Operation of UFAD System. Constr. Technol. 2019, 9, 34–37. (In Chinese) [Google Scholar]
- Li, G.; Li, W.; Li, M. Design and Engineering Application of Fabric-Duct Air-Dispersion System. Refrig. Air Cond. 2002, 6, 59–61. (In Chinese) [Google Scholar]
- Liu, C. A Comparative Study of Fiber Air Distribution System and Traditional Air Supply System. Master’s Thesis, Huazhong University of Science and Technology, Wuhan, China, 2019. (In Chinese). [Google Scholar]
- Liu, X.; Zhang, T.; Liang, M.; Liu, X.; Wei, Q. Literature review and energy consumption analysis of winter air infiltration in large space buildings. Heat. Vent. Air Conditioning. 2019, 8, 92–99. (In Chinese) [Google Scholar]
- World Health Organization. WHO Global Air Quality Guidelines. Available online: https://www.who.int/news/item/22-09-2021-new-who-global-air-quality-guidelines-aim-to-save-millions-of-lives-from-air-pollution (accessed on 1 January 2022).
- GB3095; Standardization Administration of China. China Standard: Beijing, China, 2012. (In Chinese)
- JGJ/T461; Design Standard for Indoor Air Quality Control in Public Buildings. China Standard: Beijing, China, 2019. (In Chinese)
- Manz, H.; Frank, T. Analysis of thermal comfort near cold vertical surfaces by means of computational fluid dynamics. Indoor Built Environ. 2004, 13, 233–242. [Google Scholar] [CrossRef]
- Moriasi, D.N.; Arnold, J.G.; van Liew, M.W.; Bingner, R.L.; Harmel, R.D.; Veith, T.L. Model evaluation guidelines for systematic quantification of accuracy in watershed simulations. Trans. ASABE 2007, 50, 885–900. [Google Scholar] [CrossRef]
- ASHRAE. ASHRAE Handbook: HVAC Applications; ASHRAE Inc.: Atlanta, GA, USA, 2019; Volume 46, p. 39. [Google Scholar]
- Zheng, F.; Sun, W.-H.; Feng, Z. National Aquatics Center (Icecube). Archit. Ski. 2021, 27, 8–13. (In Chinese) [Google Scholar]
- Zheng, F.; Zhu, B. National Speed Skating Hall and National Aquatics Center: Sustainability of new and renovated venues. Beijing Plan. Constr. 2021, 3, 146–152. (In Chinese) [Google Scholar]
- Zheng, F. Sustainable Strategy of Ice Venues for Winter Olympic Games Based on Renovation of Existing Buildings. Archit. J. 2019, 1, 43–47. (In Chinese) [Google Scholar]
- Zheng, F. The Programming and Design of Scenario Transformation in Sports Venues: The Cases of National Speed Skating Oval and National Aquatics Center. New Build. 2021, 3, 51–55. (In Chinese) [Google Scholar]
- Gu, M.; Guo, Q.; Lu, S.L. Feasibility analysis of energysaving potential of the underground ice rink using spectrum splitting sunshade technology. Renew. Energy 2022, 191, 571–579. [Google Scholar] [CrossRef]
- Lu, S.; Zeng, J.; Gu, M.; Zhang, C.; Shen, C. Research on the Energy-Saving Characteristics of the Ceiling of National Swimming Center under the Demand of Olympic Games. Archit. J. 2002, 2, 90–94. (In Chinese) [Google Scholar]
Figure 1.
National Aquatics Center (Ice Cube) curling venue.

Figure 2.
Venue model and simulation interface diagram: (a) venue model; (b) the location of simulated data collection points; (c) Y = 35 m cross section; (d) the section of 1.5 m away from the ground in audience and competition area.
Figure 2.
Venue model and simulation interface diagram: (a) venue model; (b) the location of simulated data collection points; (c) Y = 35 m cross section; (d) the section of 1.5 m away from the ground in audience and competition area.
Figure 3.
Scene 1 indoor PM2.5 concentration distribution: (a) distribution of PM2.5 concentration in Y = 35 m cross section; (b) PM2.5 concentration distribution at a cross section 1.5 m above ground level.
Figure 3.
Scene 1 indoor PM2.5 concentration distribution: (a) distribution of PM2.5 concentration in Y = 35 m cross section; (b) PM2.5 concentration distribution at a cross section 1.5 m above ground level.
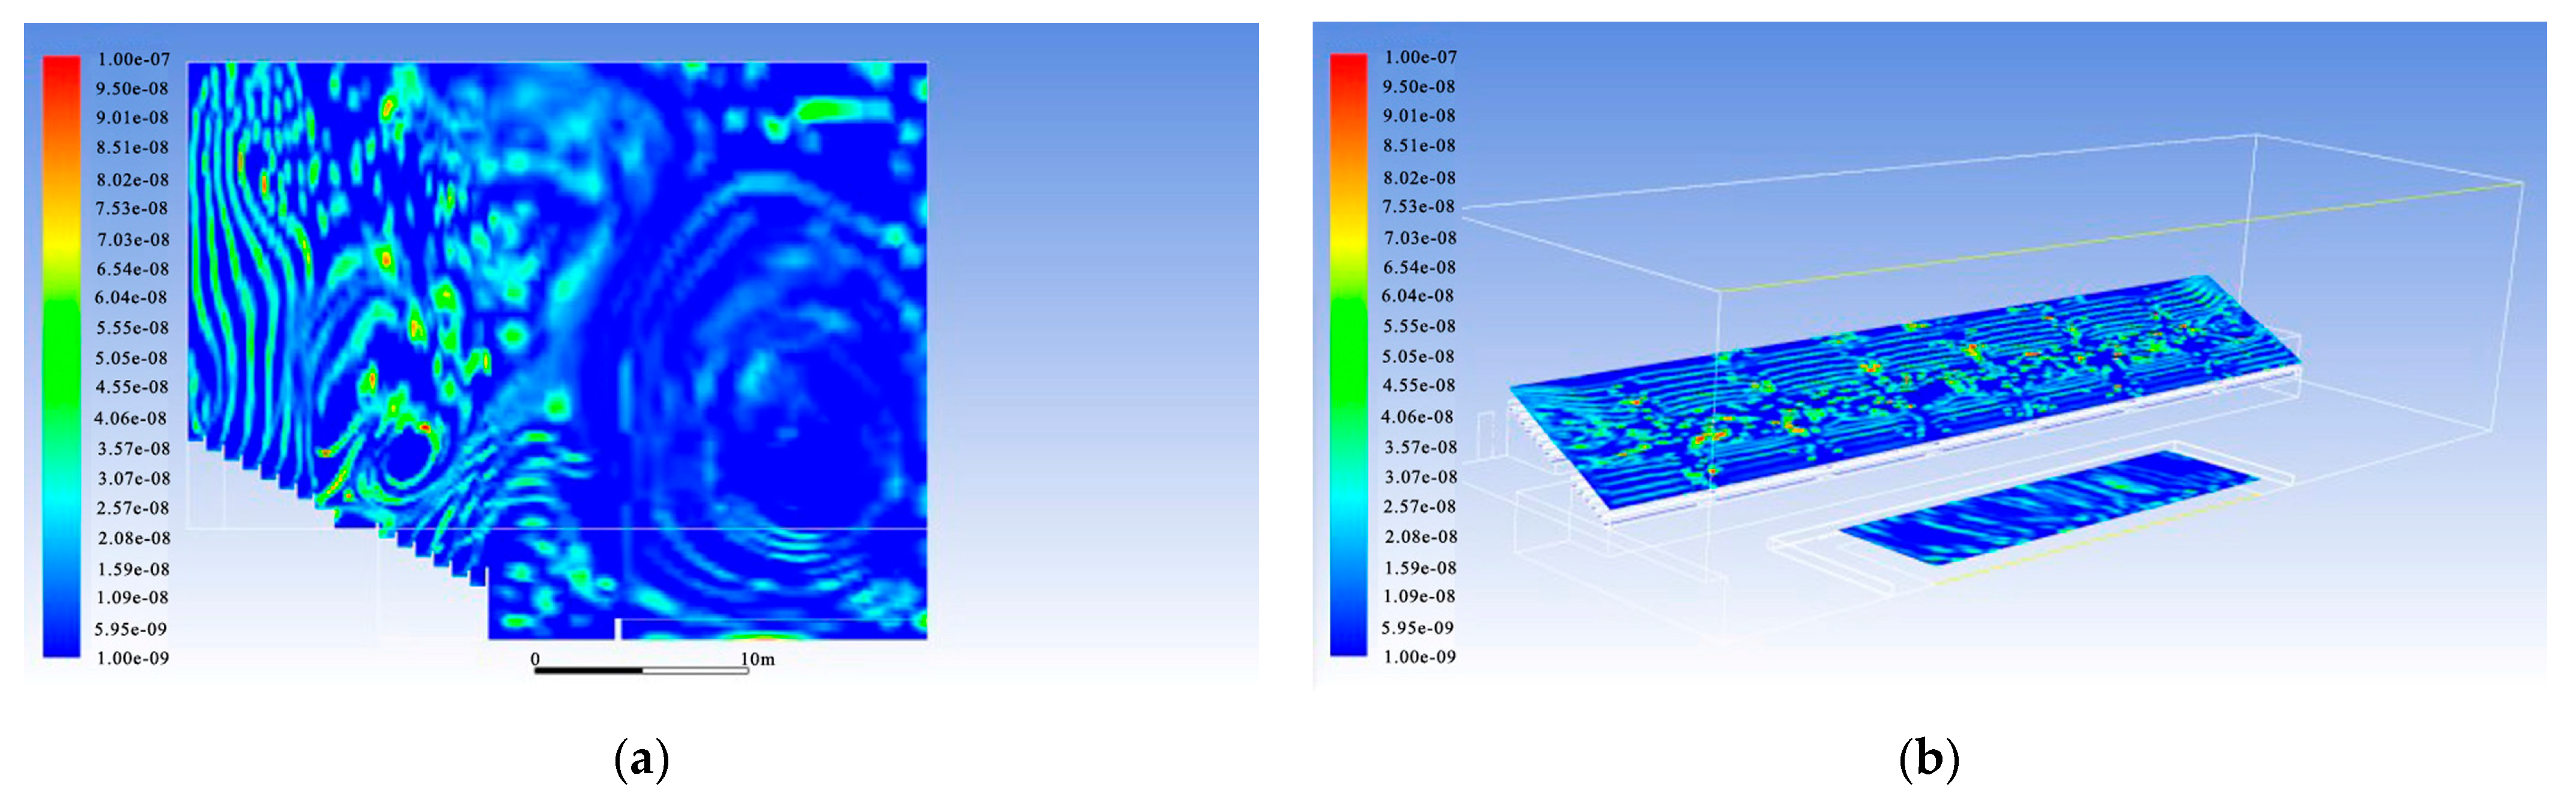
Figure 4.
Scene 2 indoor PM2.5 concentration distribution: (a) distribution of PM2.5 concentration in Y = 35 m cross section; (b) PM2.5 concentration distribution at a cross section 1.5 m above ground level.
Figure 4.
Scene 2 indoor PM2.5 concentration distribution: (a) distribution of PM2.5 concentration in Y = 35 m cross section; (b) PM2.5 concentration distribution at a cross section 1.5 m above ground level.
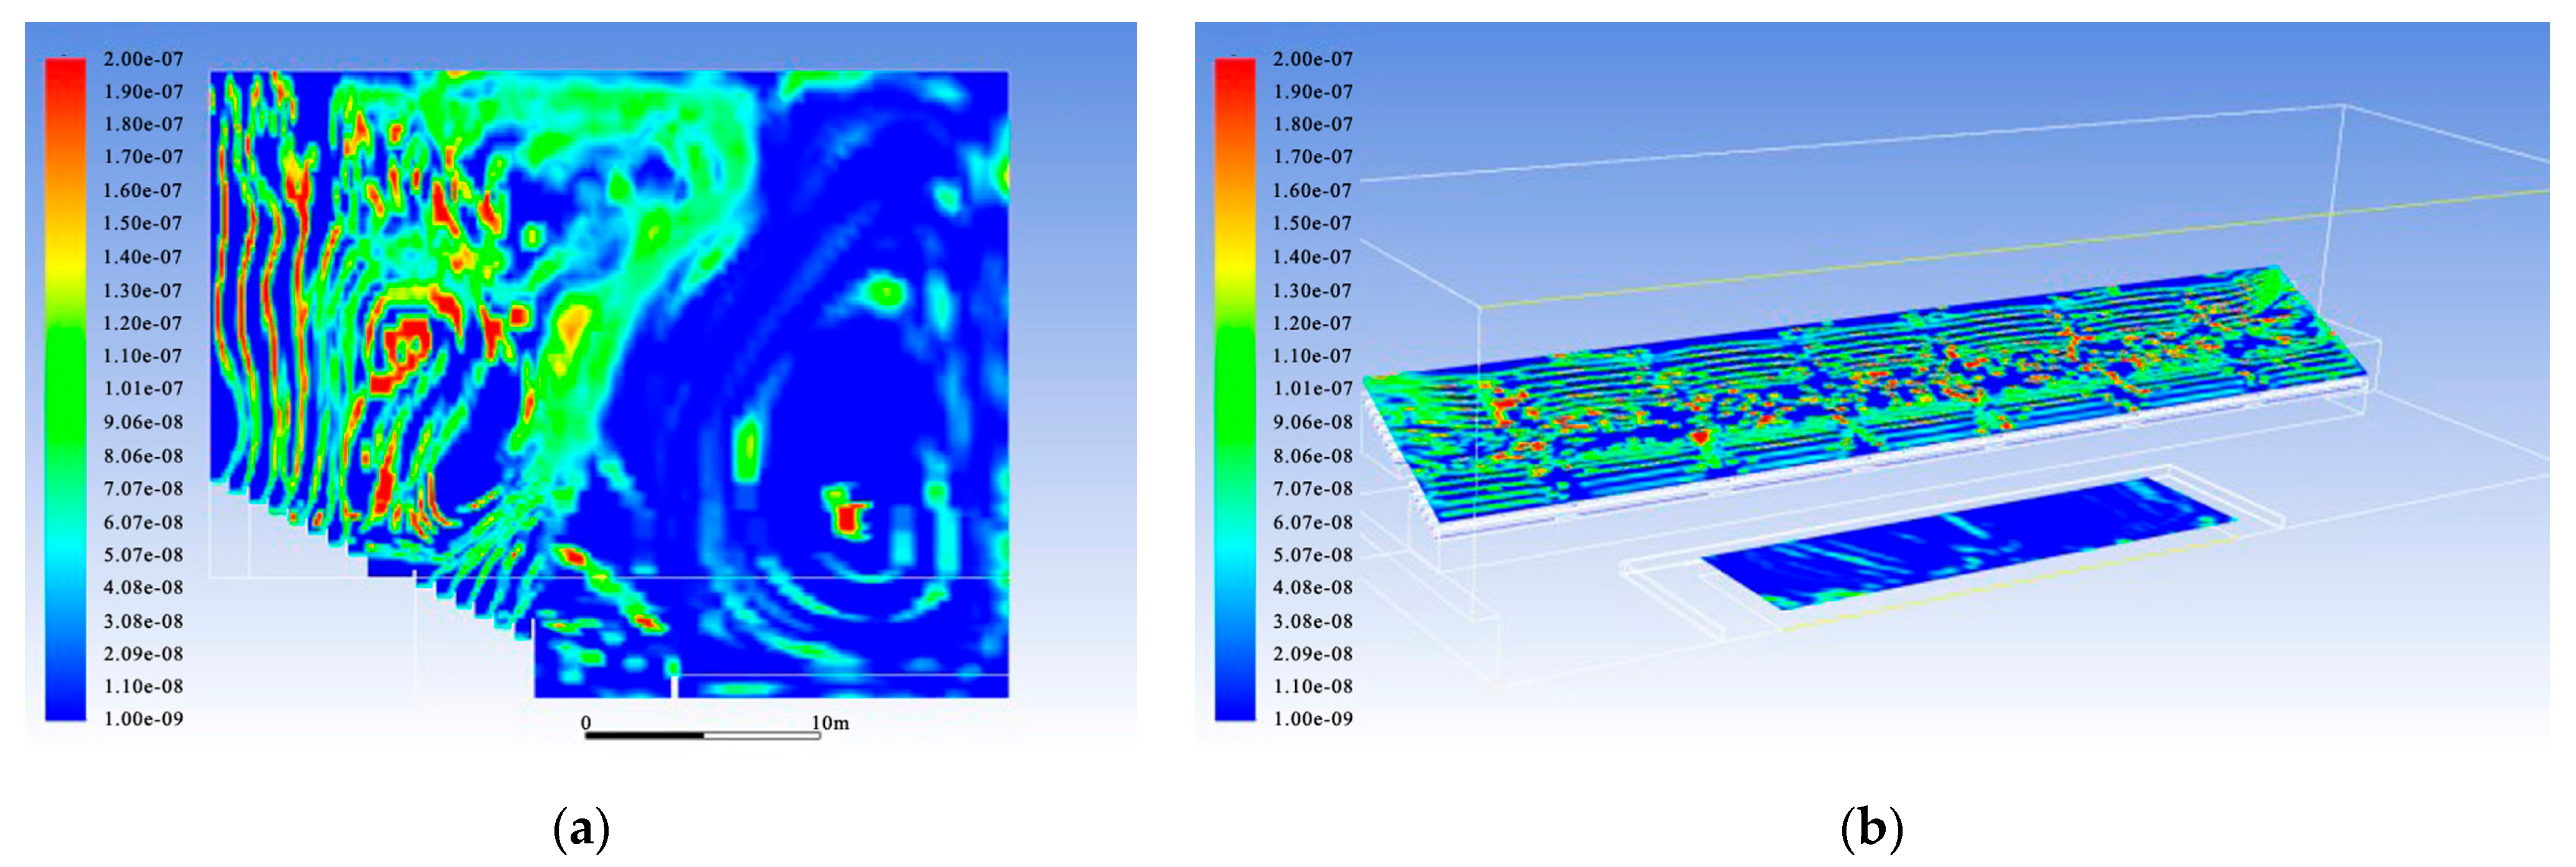
Figure 5.
Scene 3 indoor PM2.5 concentration distribution: (a) distribution of PM2.5 concentration in Y = 35 m cross section; (b) PM2.5 concentration distribution at a cross section 1.5 m above ground level.
Figure 5.
Scene 3 indoor PM2.5 concentration distribution: (a) distribution of PM2.5 concentration in Y = 35 m cross section; (b) PM2.5 concentration distribution at a cross section 1.5 m above ground level.
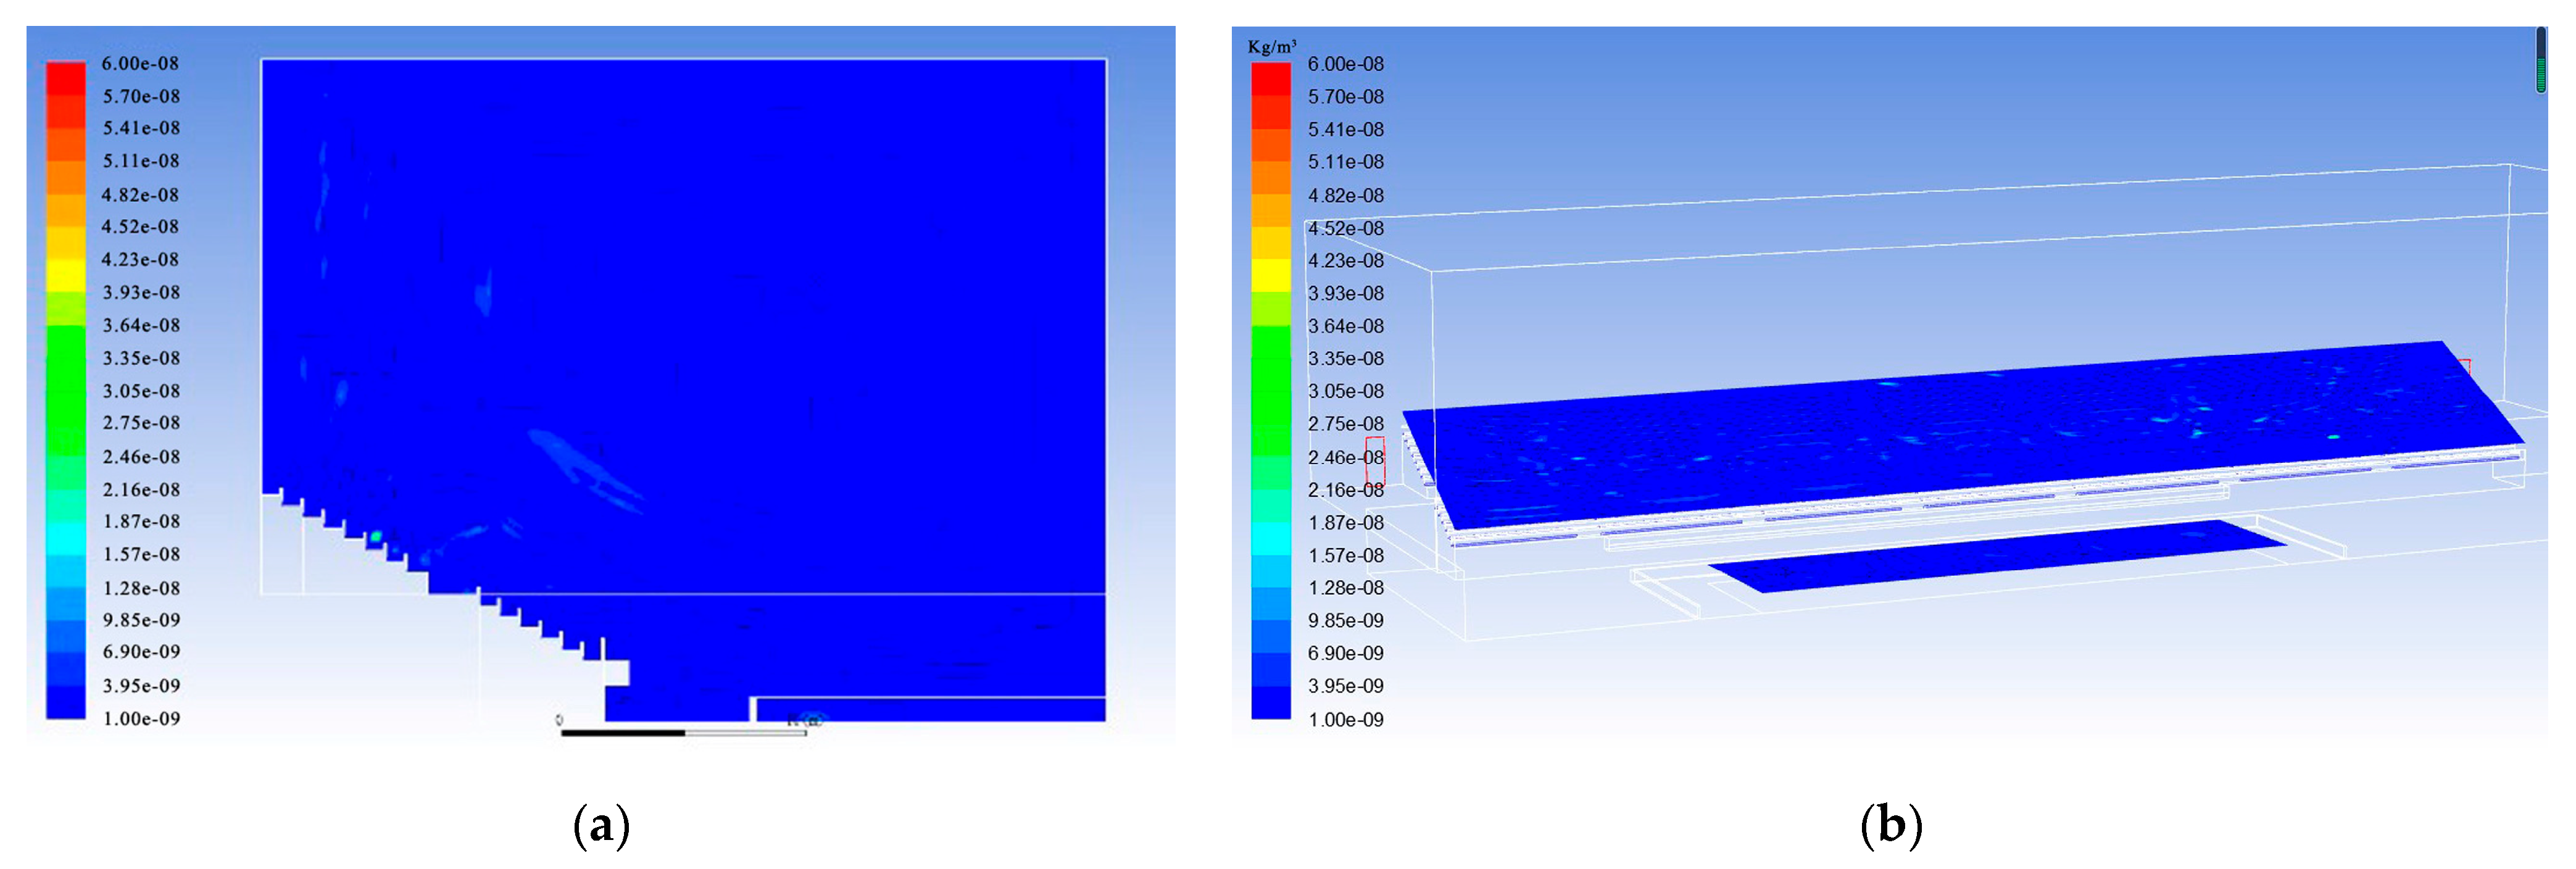
Figure 6.
Scene 4 indoor PM2.5 concentration distribution: (a) distribution of PM2.5 concentration in Y = 35 m cross section; (b) PM2.5 concentration distribution at a cross section 1.5 m above ground level.
Figure 6.
Scene 4 indoor PM2.5 concentration distribution: (a) distribution of PM2.5 concentration in Y = 35 m cross section; (b) PM2.5 concentration distribution at a cross section 1.5 m above ground level.
Figure 7.
Comparison of measured data and simulated data at different collection points in different scenes: (a) comparison between simulated and measured values in Scene 1 and Scene 2; (b) comparison between simulated and measured values in Scene 3 and Scene 4.
Figure 7.
Comparison of measured data and simulated data at different collection points in different scenes: (a) comparison between simulated and measured values in Scene 1 and Scene 2; (b) comparison between simulated and measured values in Scene 3 and Scene 4.
Figure 8.
Changes in average PM2.5 concentration in different indoor areas with different outdoor air quality.
Figure 8.
Changes in average PM2.5 concentration in different indoor areas with different outdoor air quality.
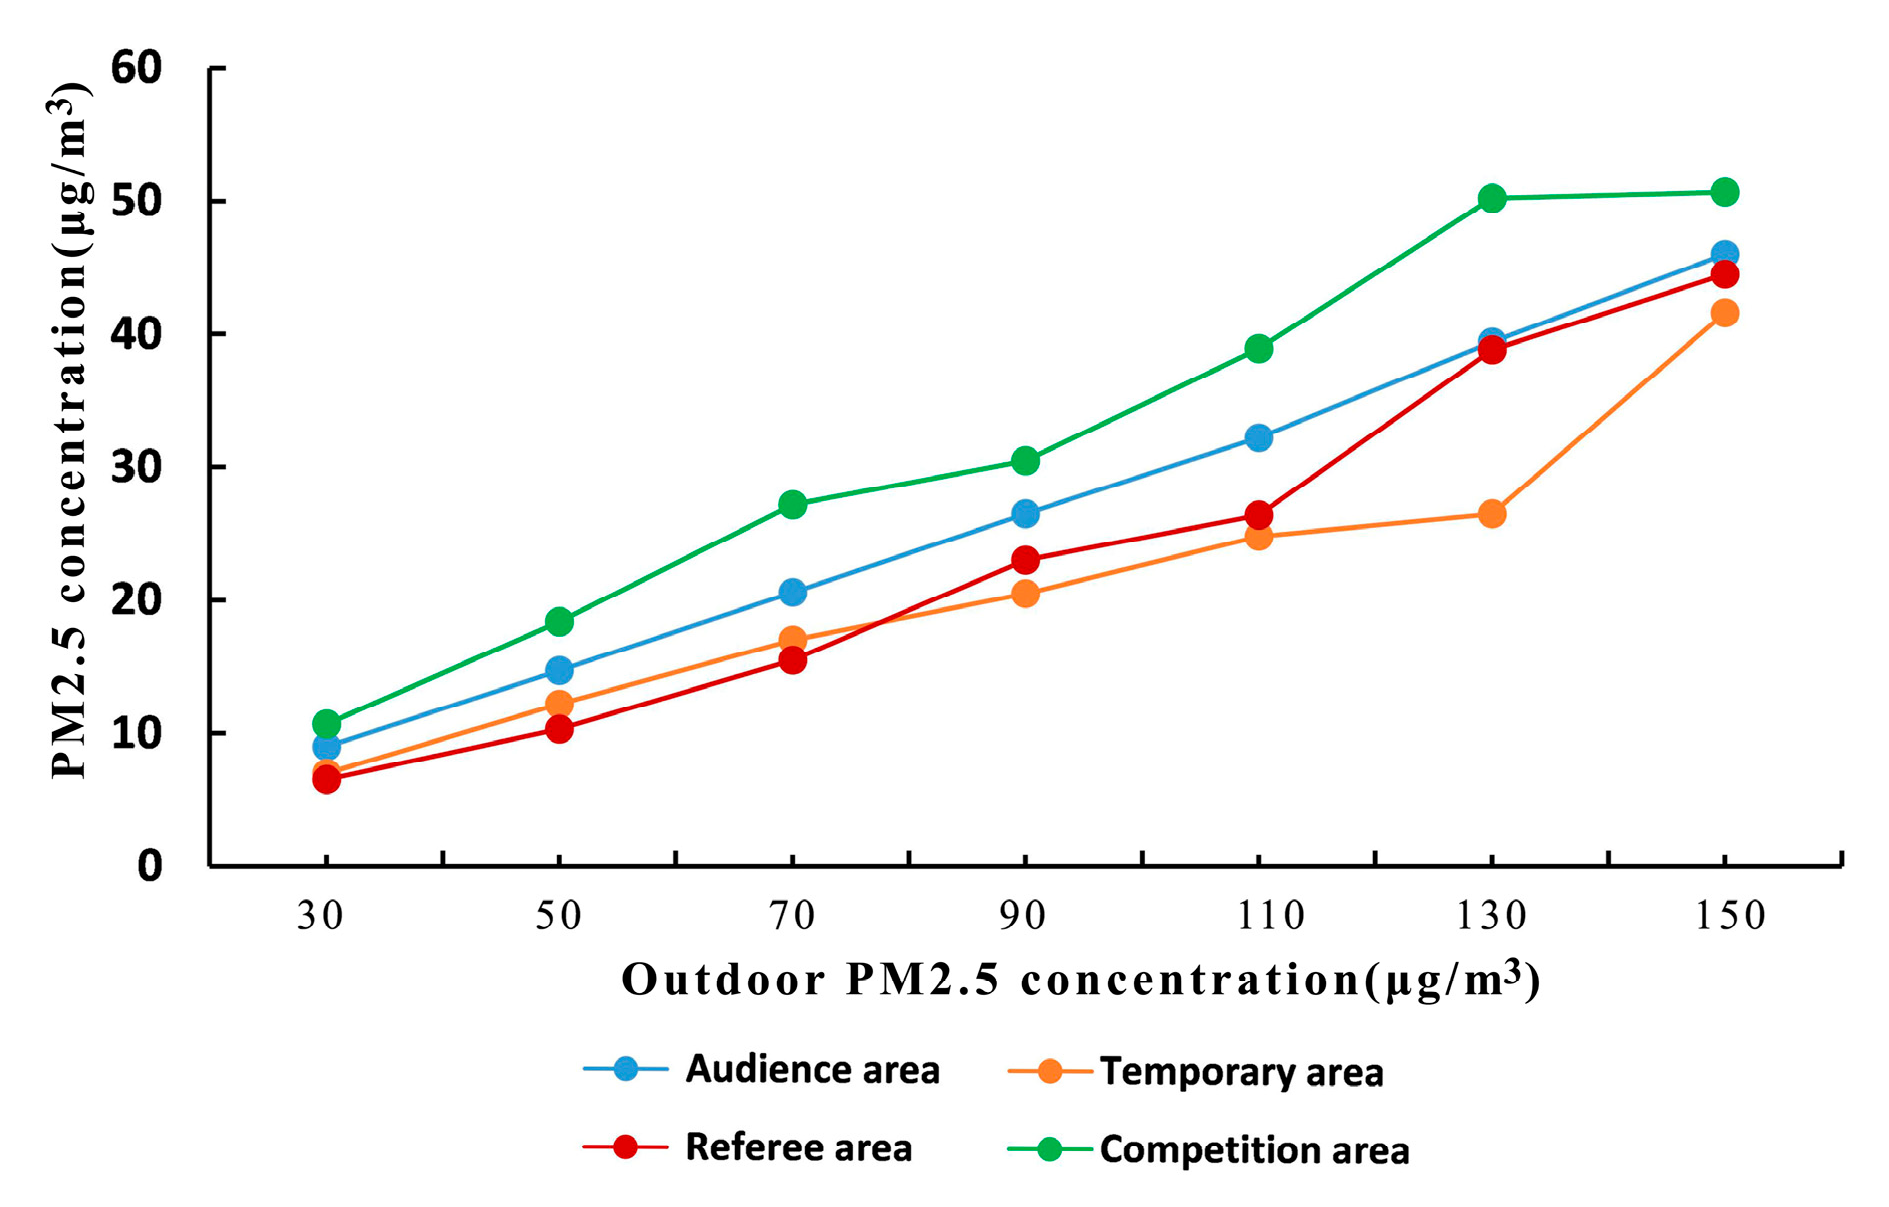
Figure 9.
Changes in the average PM2.5 concentration in various indoor areas with different air changes.
Figure 9.
Changes in the average PM2.5 concentration in various indoor areas with different air changes.
Figure 10.
Distribution of PM2.5 concentration in different indoor areas under two kinds of air supply methods: (a) PM2.5 concentration distribution in ground air supply mode; (b) PM2.5 concentration distribution in the cloth bag duct air supply mode.
Figure 10.
Distribution of PM2.5 concentration in different indoor areas under two kinds of air supply methods: (a) PM2.5 concentration distribution in ground air supply mode; (b) PM2.5 concentration distribution in the cloth bag duct air supply mode.

Figure 11.
Air outlet of bag air duct.

Table 1.
Main boundary conditions and boundary parameter settings.
| Name | Boundary Type | Model Location | Parameter Settings |
|---|---|---|---|
| audience area | Temperature | at a height of 1.5 m from the ground | 16 °C |
| Relative humidity | 20% | ||
| Air velocity | 0.1 m/s | ||
| competition area | Temperature | at a height of 1.5 m from the ground | 10 °C |
| Relative humidity | 23% | ||
| Air velocity | 0.03 m/s | ||
| Ice surface | Heat exchange wall surface | Ice surface | The temperature is −8 °C. |
| Air supply port at the end of air conditioning in the competition area | Speed air inlet | The north and south sides of the ice surface | The dehumidification unit has a fresh air humidity of 1 g/kg, a temperature of 8 °C, and a fresh air volume of 2000 m3/H. |
| Venue air-returning outlet | Speed air inlet | The north and south sides of the ice surface | The wind speed of the air supply outlet at the end of the air conditioner is 0.5 m/s |
| Seat air outlet | Speed air inlet | Seat bottom | The fresh air temperature for seat supply is 20 °C, the wind speed is 0.3 m/s, and the moisture content is 5 g/kg |
| Human respiration | Speed air inlet | 0.75 m from the ground | Calculated based on the average adult exhaling 480 mL of air per second, with a moisture content of 20 g/kg, CO2 concentration of 44,000 PPM, and a temperature of approximately 30 °C, the audience will calculate based on the number of seats according to different situations |
Table 2.
Scenario settings.
| Name | Outdoor AQI | Outdoor PM2.5 Concentration (μg/m3) | Air Supply Method at the End of the Air Conditioning System in the Competition Area | Venue Airtightness |
|---|---|---|---|---|
| Scenario 1 | 66 | 50 | Ground air supply mode [38] | Poor |
| Scenario 2 | 181 | 140 | Ground air supply mode | Poor |
| Scenario 3 | 30 | 4 | Cloth bag duct air supply mode [39,40,41] | Good |
| Scenario 4 | 171 | 94 | Cloth bag duct air supply mode | Good |
Table 3.
Comparison of errors between on-site measured data and simulated data.
| PM2.5 Concentration | ||||
|---|---|---|---|---|
| Scene 1 | Scene 2 | Scene 3 | Scene 4 | |
| MAE | 3 | 5.8 | 0.01 | 1.8 |
| MAPE | 23.10% | 24.90% | 0.30% | 24.10% |
| RMSE | 3.1 | 7.2 | 0.02 | 2 |
| SD/2 | 3.5 | 13 | 0.01 | 2 |
Table 4.
The distribution of indoor PM2.5 concentration varies with different outdoor PM2.5 concentrations.
Table 4.
The distribution of indoor PM2.5 concentration varies with different outdoor PM2.5 concentrations.
| Outdoor PM2.5 Concentrations | Y = 35 m Cross Section | The Section 1.5 m Away from the Ground |
|---|---|---|
| 30 μg/m3 | 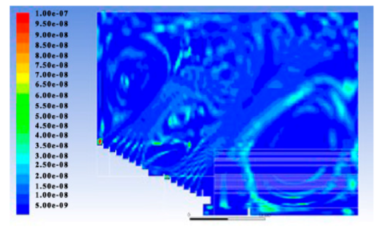 |  |
| 70 μg/m3 | 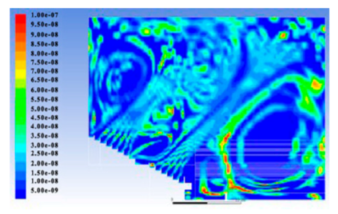 | 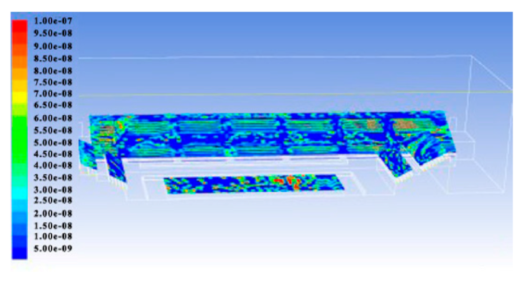 |
| 110 μg/m3 |  | 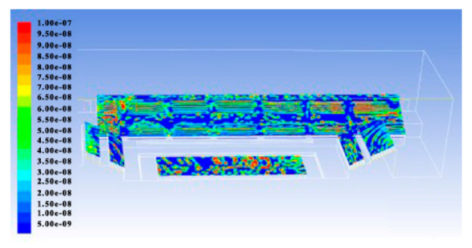 |
Table 5.
The distribution of indoor PM2.5 concentration varies with different air changes.
| Air Changes | Y = 35 m Cross Section | X = 30 m Cross Section |
|---|---|---|
| 0.15 times/h | 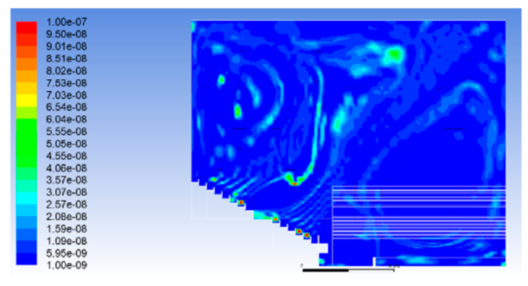 | 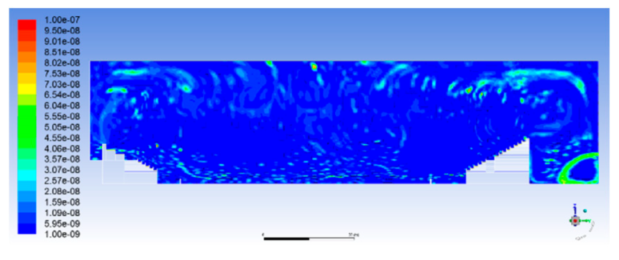 |
| 0.45 times/h | 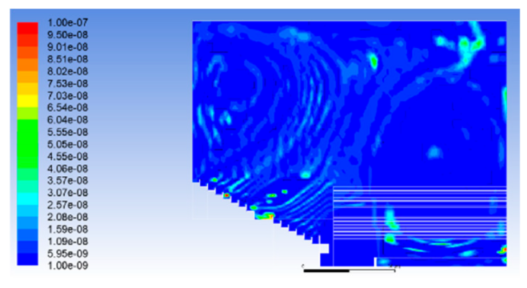 | 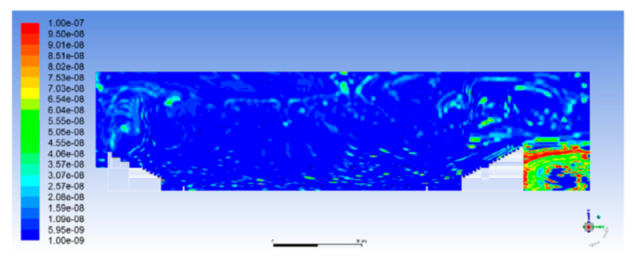 |
| 0.75 times/h | 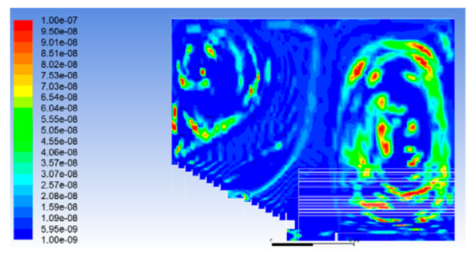 | 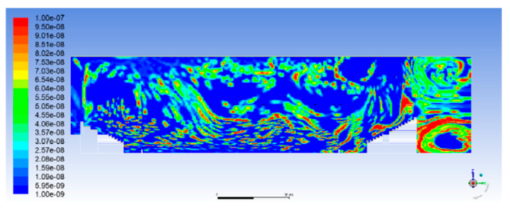 |
Disclaimer/Publisher’s Note: The statements, opinions and data contained in all publications are solely those of the individual author(s) and contributor(s) and not of MDPI and/or the editor(s). MDPI and/or the editor(s) disclaim responsibility for any injury to people or property resulting from any ideas, methods, instructions or products referred to in the content. |
© 2024 by the authors. Licensee MDPI, Basel, Switzerland. This article is an open access article distributed under the terms and conditions of the Creative Commons Attribution (CC BY) license (https://creativecommons.org/licenses/by/4.0/).
Share and Cite
MDPI and ACS Style
Du, X.; Li, J.; Tang, Z.; Hu, S. Research on Factors Influencing Indoor PM2.5 Concentration in Curling Venues Based on CFD Simulation. Appl. Sci. 2024, 14, 3446. https://doi.org/10.3390/app14083446
AMA Style
Du X, Li J, Tang Z, Hu S. Research on Factors Influencing Indoor PM2.5 Concentration in Curling Venues Based on CFD Simulation. Applied Sciences. 2024; 14(8):3446. https://doi.org/10.3390/app14083446
Chicago/Turabian StyleDu, Xiaohui, Jiaxin Li, Ziying Tang, and Shijing Hu. 2024. "Research on Factors Influencing Indoor PM2.5 Concentration in Curling Venues Based on CFD Simulation" Applied Sciences 14, no. 8: 3446. https://doi.org/10.3390/app14083446
Note that from the first issue of 2016, this journal uses article numbers instead of page numbers. See further details here.