
Influence of Biochar Application Rate, Particle Size, and Pyrolysis Temperature on Hydrophysical Parameters of Sandy Soil

1
Institute of Hydrology, Slovak Academy of Sciences, 841 04 Bratislava, Slovakia
2
Department of Land and Water Resources Management, Faculty of Civil Engineering, Slovak University of Technology, 810 05 Bratislava, Slovakia
*
Author to whom correspondence should be addressed.
Appl. Sci. 2024, 14(8), 3472; https://doi.org/10.3390/app14083472
Submission received: 26 March 2024
/
Revised: 17 April 2024
/
Accepted: 17 April 2024
/
Published: 19 April 2024
(This article belongs to the Special Issue Soil Hydraulic Properties Characterization for Improving Water Availability)
Abstract
:Sandy areas occupy a huge amount of land worldwide, but due to their characteristics, they are mostly low in fertility and low in organic matter. Sandy soils have coarse texture, high saturated hydraulic conductivity, low soil organic carbon, and poor aggregate stability and water retention capacity; therefore, it is necessary to add organic additives to them. The objective of this study was to assess the effect of particle size and application rate of biochar (BC) produced under different pyrolysis temperatures on the porosity P, available water content for plants AWC, saturated hydraulic conductivity Ks, and contact angle CA of sandy soil. The results show that an application of BC to sandy soil significantly increased AWC by 76–168%, CA by 252–489%, P by 6–11%, and significantly reduced Ks by 37–90%. Statistical analysis of the effect of three examined factors (BC application rate, particle size, and pyrolysis temperature) revealed that P, AWC, and Ks were affected by all three factors, while CA was affected only by BC application rate and particle size. The statistically significant interaction between the two factors was found for P (temperature × rate and size × rate), AWC (temperature × size), and Ks (size × rate). Statistically significant interaction among the three factors was not found for any hydrophysical parameter. The application of BC to amend sandy soils can be seen as a strategy to mitigate drought conditions and to reduce the amount of irrigation, saving water. Further investigations are needed with regard to the BC application under climate conditions with long hot and dry periods, which may promote soil water repellency.
1. Introduction
Sandy soils are considered marginal for agriculture due to coarse texture, high saturated hydraulic conductivity, low soil organic carbon, and poor aggregate stability and water retention capacity. Farming in sandy soils of drylands relies on the use of external inputs such as organic and inorganic fertilizers. However, organic amendments in sandy soils face the challenge of constant turnover, as their decomposition rate is high and the added organics are usually mineralized within only small cropping seasons. Thus, organic amendments must be applied frequently to sustain productivity. A suitable option is the use of more stable organic materials. In this respect, biochar could be a suitable choice to replace easily decomposable organic manures [1].
Biochar (BC) is produced by pyrolysis of organic residues under limited oxygen conditions. It is resistant to soil microorganisms’ decomposition and acts as a sink of carbon, leading to a decrease in the emissions of greenhouse gases into the environment and an increase in crop production [2]. BC is being increasingly discussed as a means to sequestrate carbon in the soil, and in this way reduce the CO2 emissions into the environment or atmosphere and mitigate climate change [3]. In their meta-analysis, Edeh et al. [4] presented that BC addition increased the porosity, connectivity of pore space, number of pores, available water content, field capacity, and permanent wilting point of soils, and reduced the bulk density and saturated hydraulic conductivity of sandy soils. The effect of BC was dependent on its application rate, particle size, specific surface area, porosity, and pyrolysis temperature. In addition to the above-mentioned improvement of hydrophysical properties of sandy soil, the conversion of biomass into biochar with subsequent soil storage is assumed as a prospective strategy for reducing atmospheric CO2 concentrations and mitigating climate change by enhancing the short-term carbon sequestration [5].
Biochar can increase sandy soil porosity directly by reducing bulk density and through its inherent high porosity. This has a direct effect on soil water storage and mobility. The increased number of pores (especially mesopores) and total soil porosity lead to an increase in soil moisture retention. Quin et al. [6] presented a small decrease in bulk density (from 1.60 to 1.56 g cm−3) and a corresponding small increase in porosity (from 4.5 to 4.7%) after the addition of 1% of hardwood (Eucalyptus polybractea) BC (pyrolyzed at 550 °C and sieved to 0.25–2 mm) to sandy soil. Alotaibi et al. [7] used the BC from date palm tree residues pyrolyzed at 300, 400, 500, and 600 °C, and found that the porosity of sandy desert soil increased significantly (from 38 to 46%) after the addition of BC pyrolyzed at 600 °C at the rate of 8 Mg ha−1. Ajayi and Horn [8] found that amending the pre-graded (0.13–0.36 mm) fine sand with 20 g kg−1 of woodchip and forest residue BC did not significantly increase the total porosity. However, the total porosity of fine sand was significantly increased when the amendment rate was increased to 50 and 100 g kg−1.
Basso et al. [9], Vitková et al. [10], and Ndede et al. [11] showed that BC application increases soil water retention, especially in sandy soils, which has generally been attributed to an increase in soil micro-porosity and the high porous structure of BC. Abel et al. [3] found that the maize BC addition resulted in a 16.3% increase in available water content (AWC) in the lab, but only an AWC increase of 4.3% in the field. Quin et al. [6] presented a small increase in AWC (from 5 to 6%) after the addition of 1% of hardwood (Eucalyptus polybractea) BC (pyrolyzed at 550 °C and sieved to 0.25–2 mm) to sandy soil. Ajayi and Horn [12] presented that amending pre-graded (0.13–0.36 mm) fine sand with 100 g kg−1 of woodchip and forest residue BC resulted in an AWC increase from 15.7% to 24.8%. Villagra-Mendoza and Horn [13] showed that an addition of 5% of BC (with particles < 63 μm) produced from an old mango tree and pyrolyzed at 600 °C to sandy soil increased the AWC from 8.8 to 21%. Alghamdi et al. [2] found that the AWC increased from 4.5% to 11.4% when the olive waste-derived BC was added to the top 10 cm layer of sandy soil at a rate of 5%. Fu et al. [14] presented that the increase in AWC was highest in treatments using the corn straw biochar rate of 4%; in these instances, for biochar particle sizes of 0–0.25, 0.25–1, and 1–2 mm significant increases of 65.3%, 51.4%, and 38.3%, respectively, were recorded. Xu et al. [15] found that the increase in AWC was highest in treatments using the corn straw biochar rate of 4%; in these instances, for biochar particle sizes of 0–0.25, 0.25–1, and 1–2 mm significant increases of 65.3%, 51.4%, and 38.3%, respectively, were recorded.
The saturated hydraulic conductivity KS of sand–BC mixtures varied based on biochar particle size and application rate. Ajayi and Horn [12] found that amending the pre-graded (0.13–0.36 mm) fine sand with 100 g kg−1 of woodchip and forest residue BC resulted in a decrease in KS from 846 to 191 cm d−1. Trifunovic et al. [16] used the BC produced by slow pyrolysis of pine wood at 300 °C and presented that the addition of fine BC (<2 mm) at different concentrations to pure silica sand with the median particle diameter of 0.90 mm reduced KS from 25,900 cm d−1 (control) to 18,100, 13,000, and 4300 cm d−1 for 5%, 10%, and 20% concentrations of fine BC, respectively. However, the addition of coarse BC (>2 mm) at concentrations of 5%, 10%, or 20% to sand did not influence KS. Villagra-Mendoza and Horn [13] showed that an addition of 5% of BC (with particles < 63 μm) produced from an old mango tree and pyrolyzed at 600 °C to sandy soil reduced KS from 1577 to 114 cm d−1. Alghamdi et al. [2] presented that KS acquired using a constant head test decreased from 389 to 52 cm d−1 when the olive waste-derived BC was added to the top 10 cm layer of sandy soil at the rate of 5%. On the other hand, Alessandrino et al. [17] did not find statistically significant changes in KS after an addition of wood BC at the equivalent field rate of 75 Mg ha−1 to a calcareous sandy soil.
The addition of water-repellent BC should increase the water repellency of sandy soil. Liu et al. [18] added wheat, corn, and rice straw BC produced at a pyrolysis temperature of 350–450 °C with a contact angle CA = 107° to sandy soil and found that the CA of the BC–soil mixture was 55°, 69°, and 77° for the biochar application rate of 2%, 5%, and 10%, respectively. Ajayi and Horn [12] observed that the addition of 20, 50, and 100 g woodchip biochar to fine sand altered soil water repellency.
The objective of this study was to assess the effects of particle size and application rate of biochar produced under different pyrolysis temperatures on the soil porosity, available water content for plants, saturated hydraulic conductivity, and contact angle of sandy soil. We hypothesized that biochar addition would increase available water content, porosity, and contact angle and reduce the saturated hydraulic conductivity of sandy soil. The effect of biochar would depend on its application rate, particle size, and pyrolysis temperature.
2. Materials and Methods
2.1. Soil Description
Sandy soil with a very low content of organic carbon (cf. Table 1) was used for our laboratory experiment. Disturbed samples were collected from the top 20 cm of the soil profile in Plavecký Štvrtok, western Slovakia (N 48°21′58.33″; E 16°59′49.23″), at an altitude of 157 m a.s.l. The mean annual temperature is 9 °C, and the mean annual precipitation is 600 mm at the studied site. The soil is classified as Aeolic Arenosol and has a sandy texture [19]. The basic parameters of the used soil are shown in Table 1. The grain size analysis of the soil was performed by using the hydrometer method, pH (H2O) was determined based on ISO 10390 [20], the determination of soil organic carbon content was measured based on the Walkley and Black method [21], and the carbonate content was estimated with Janko’s lime meter according to the methodology described by Hraško [22].
2.2. Biochar Description
Biochars (BCs) used in this study were produced in the UNYPIR reactor, which is part of the AgroBioTech center (Slovak University of Agriculture, Nitra, Slovakia). The feedstock material was willow (Tordis variety) and two pyrolysis temperatures were used, 300 °C and 520 °C. Basic BC properties are shown in Table 2. The pH (H2O) was determined according to ISO 10523 [23], and elemental analysis of biochar carbon (C), hydrogen (H), and nitrogen (N) was performed using a CHNSO elemental analyzer (Perkin Elmer, Inc., Waltham, MA, USA). The water drop penetration time test (WDPT) was measured based on the methodology described by Doerr [24] and Tinebra et al. [25] and the contact angle (CA) was determined by reviewing the image recordings taken with the optical goniometer OCA 11 (DataPhysics Instruments GmbH, Filderstadt, Germany).
2.3. Experimental Design
Sandy soil was sieved to a fraction with a particle size ≤ 2 mm. Both BCs were grounded with a hammer mill and sieved to a fraction with 125 µm and 2 mm particle sizes, so two different BC sizes were studied: <125 µm and 125 µm–2 mm. Also, two different application rates were examined in our research: 20 Mg ha−1 and 40 Mg ha−1. Eight soil–BC mixture treatments and one control without BC were prepared in steel cylinders with a volume of 100 cm3 and 5 replicates for each treatment were prepared in laboratory conditions. Hydrophysical measurements were provided one week after soil–BC mixture preparation.
The porosity P of the soil and soil–BC mixtures was calculated based on the Equation (1) [26]:
where P is soil/soil–BC mixture porosity (%), ρs is soil/soil–BC mixtures particle density (g cm−3) measured by the pycnometric method [27], and ρd is the bulk density of the soil/soil–BC mixtures (g cm−3) determined based on Equation (2) [28]:
where ms is the weight of the soil/soil–BC mixture samples dried at 105 °C (g) and V is the steel cylinder volume (cm3). Five values were analyzed for each treatment.
The available water content for plants (AWC) is defined as the difference between the field capacity (FC) determined at pF = 2 (10 kPa) and the wilting point (WP) determined at pF = 4.18 (1500 kPa). The above-mentioned hydrolimits were determined from the soil water retention curves, estimated on five samples for each treatment.
The soil water retention curves were measured with the pressure plate apparatus (Soil Moisture Equipment Corp., Santa Barbara, CA, USA) according to ISO 11274 [29]. A total of 9 measurement points were used at pressure potentials of 0, 6, 10, 30, 56, 100, 300, 480, and 1500 kPa. Based on measured data, the soil water retention curve values were fitted using the unimodal van Genuchten [30] model as follows:
where θ, θr, and θS (cm3 cm−3) are the actual, residual, and saturated volumetric water content, respectively, h (cm) is matric potential, m and n (−) are water retention shape parameters, and α (cm−1) is the parameter describing the matric potential of air entry.
The saturated hydraulic conductivity KS (cm h−1) was measured based on the modified falling-head method [31]. For the calculation, Equation (4) was used:
where L is the soil/soil–BC mixture core height (cm), h2 is the initial water level (cm), h1 is the water level at the end of the measurement (cm), and t is the time for the water level to decrease from h2 to h1 (h). Twelve measurements were made for each treatment.
The sessile drop method, used for contact angle (CA) estimation, involved placing a water drop on the soil sample’s surface and analyzing the CA by reviewing the image recordings taken with the optical goniometer OCA 11 (DataPhysics Instruments GmbH, Filderstadt, Germany). The procedure was described by Bachmann et al. [32]. The slide was shaken carefully to remove any unglued soil particles, and then a 5 μL drop of deionized water was placed on the sample surface using a 0.91 mm syringe needle. After 1 s, when mechanical disruption of the surface was complete after drop placement, the CA was evaluated by analyzing the shape of the drop (ellipsoid approximation) and fitting tangents on both sides of the drop using dpiMAX version 1.51.90.75 software (DataPhysics Instruments GmbH, Filderstadt, Germany) according to Goebel et al. [33]. The CA of each drop was determined as an arithmetic mean of the CA values on the left and right sides. The following classes of the severity of soil water repellency (SWR) can be distinguished: non-water-repellent (wettable) soil (CA < 40°), slightly (40° ≤ CA < 90°), moderately (90° ≤ CA < 110°), strongly and very strongly (110° ≤ CA < 130°), and extremely (CA ≥ 130°) water repellent soil [34]. The CA for each sample was estimated with five replicates.
2.4. Statistical Analyses
Our experiment was factorial 2 × 2 × 2 in 5 replicates. The proposed data analysis had three factors: one factor was the different pyrolysis temperature, the second factor was different particle size, and the third was the application rate. Tukey’s Honest Significant Difference (HSD) post hoc test was performed after three-way ANOVA for BC treatments only (three-way ANOVA HSD post hoc test). The statistical significance of this study was defined at p < 0.05. Consequently, comparisons between the eight BC treatments and the control were performed using a t-test. A t-test is a statistical test used to compare the means of two groups. It was used in hypothesis testing to determine whether any BC treatment affects the population of control. The null hypothesis (H0) is that the true difference between the control and BC treatment group means is zero. The alternate hypothesis (Ha) is that the true difference differs from zero.
3. Results
The effects of pyrolysis temperature, biochar particle size, and biochar application rate on hydrophysical parameters of sandy soil are presented in Table 3. Differences between control means and soil–BC treatment means were evaluated by t-test.
The three-factor ANOVA testing results of the effects of pyrolysis temperature, biochar particle size, and biochar application rate and their interactions on soil hydrophysical parameters are presented in Table 4. The bold p-value indicates a statistically significant difference between means on a significance level of p < 0.05.
Measured values of the hydrophysical parameters for all experiment treatments are presented in Figure 1, Figure 2, Figure 3 and Figure 4. The box plots denoted with different letters significantly differ (HSD test) on a significance level of p < 0.05.
3.1. Porosity
Results of the t-test have shown a statistically significant increase in porosity (P) for the treatments with a large-sized (125 µm–2 mm) BC, produced at both temperatures and applied at both rates. Differences between sandy soil and the small biochar particle-sized (<125 µm) treatments were insignificant (Table 3).
The three-way ANOVA test confirmed a significant difference between the groups of the independent variables, namely pyrolysis temperature, particle size, and application rate, in relation to the dependent variable P. All three examined factors (pyrolysis temperature, particle size, and application rate) significantly affected the P in BC treatments. The test results reveal that the pyrolysis temperature and application rate groups differ significantly, with p-values of 0.003 and 0.002, respectively (Table 4). Likewise, the particle size groups show a significant difference with a p-value of less than 0.001.

Table 3.
Effects of pyrolysis temperature (PT), biochar particle size, and biochar application rate (rate) on hydrophysical parameters (porosity, P; available water content for plants, AWC; saturated hydraulic conductivity, KS; contact angle, CA) of sandy soil. Values are averages over the replicates of the treatments (r), and standard deviations are given between parentheses. Differences between control means and treatment means were evaluated by t-test. Asterisks indicate significant differences between treated and control samples on a significance level of p < 0.05.
| Rate | Particle Size | PT | P (%) r = 5 | AWC (cm3 cm−3) r = 5 | KS (cm h−1) r = 12 | CA (°) r = 5 |
|---|---|---|---|---|---|---|
| 20 Mg ha−1 | <125 µm | 300 °C | 36.64 (0.78) | 0.075 (2 × 10⁻³) * | 11.19 (1.58) * | 64.82 (8.87) * |
| 20 Mg ha−1 | <125 µm | 520 °C | 36.90 (0.54) | 0.083 (2 × 10⁻³) * | 9.29 (1.44) * | 73.21 (9.81) * |
| 20 Mg ha−1 | 125 µm–2 mm | 300 °C | 41.05 (0.44) * | 0.074 (6 × 10⁻³) * | 40.01 (6.97) * | 54.43 (6.81) * |
| 20 Mg ha−1 | 125 µm–2 mm | 520 °C | 39.81 (0.16) * | 0.072 (8 × 10⁻³) | 37.17 (3.76) * | 56.83 (12.19) * |
| 40 Mg ha−1 | <125 µm | 300 °C | 32.62 (2.38) | 0.098 (6 × 10⁻³) * | 12.82 (1.35) * | 84.45 (6.91) * |
| 40 Mg ha−1 | <125 µm | 520 °C | 36.18 (1.13) | 0.112 (5 × 10⁻³) * | 11.77 (1.28) * | 91.04 (12.10) * |
| 40 Mg ha−1 | 125 µm–2 mm | 300 °C | 39.66 (0.64) * | 0.103 (1 × 10⁻³) * | 59.95 (3.48) * | 72.82 (20.35) * |
| 40 Mg ha−1 | 125 µm–2 mm | 520 °C | 41.34 (0.29) * | 0.105 (2 × 10⁻³) * | 57.82 (5.15) * | 77.94 (20.87) * |
| Control/sandy soil | 37.09 (0.28) | 0.042 (5 × 10⁻³) | 95.39 (12.01) | 15.44 (8.74) | ||
| Means for biochar rates | ||||||
| 20 Mg ha−1 | 38.60 (2.00) | 0.076 (7 × 10⁻³) | 24.41 (14.91) | 62.32 (11.62) | ||
| 40 Mg ha−1 | 37.45 (3.66) | 0.104 (6 × 10⁻³) | 35.59 (23.76) | 81.57 (16.40) | ||
| Means for biochar particle sizes | ||||||
| <125 µm | 35.59 (2.19) | 0.092 (1.5 × 10⁻²) | 11.27 (1.88) | 78.38 (13.60) | ||
| 125 µm–2 mm | 40.47 (0.87) | 0.088 (1.6 × 10⁻²) | 48.74 (11.42) | 65.50 (18.08) | ||
| Means for biochar pyrolysis temperatures | ||||||
| 300 °C | 37.49 (3.53) | 0.087 (1.3 × 10⁻²) | 30.99 (20.84) | 69.13 (15.83) | ||
| 520 °C | 38.56 (2.24) | 0.093 (1.6 × 10⁻²) | 29.01 (20.35) | 74.75 (18.21) | ||
Table 4.
Results (F-statistics and p-values) from a three-factor ANOVA testing for the effects of pyrolysis temperature, biochar particle size, and biochar application rate and their interactions on hydrophysical parameters (porosity, P; available water content for plants, AWC; saturated hydraulic conductivity, KS; contact angle, CA) of sandy soil. The bold p-value indicates a statistically significant difference between means on a significance level of p < 0.05. (df = degree of freedom).
| Soil Parameter | |||||||||
|---|---|---|---|---|---|---|---|---|---|
| P (%) | AWC (cm3 cm−3) | KS (cm h−1) | CA (°) | ||||||
| Factor | df | F | p | F | p | F | p | F | p |
| Pyrolysis temperature | 1 | 10.37 | 0.003 | 13.95 | 0.001 | 6.84 | 0.01 | 1.78 | 0.191 |
| Particle size | 1 | 217.42 | <0.001 | 5.84 | 0.021 | 2458.54 | <0.001 | 9.38 | 0.004 |
| Application rate | 1 | 12.01 | 0.002 | 364.48 | <0.001 | 218.66 | <0.001 | 20.96 | <0.001 |
| Temperature × size | 1 | 2.55 | 0.130 | 15.57 | <0.001 | 0.43 | 0.509 | 0.20 | 0.66 |
| Temperature × rate | 1 | 22.06 | <0.001 | 2.34 | 0.135 | 0.26 | 0.61 | 0.003 | 0.956 |
| Size × rate | 1 | 13.60 | 0.001 | 2.26 | 0.142 | 145.84 | <0.001 | 0.014 | 0.904 |
| Temperature × size × rate | 1 | 0.09 | 0.765 | 0.009 | 0.927 | 0.002 | 0.963 | 0.072 | 0.79 |
Figure 1.
Measured values of the porosity P for all experiment treatments. The whiskers extend to a distance of 1.5 times the interquartile range from the edges of the box and points represent individual measurements. Box plots denoted with different letters significantly differ (HSD test) on a significance level p < 0.05.
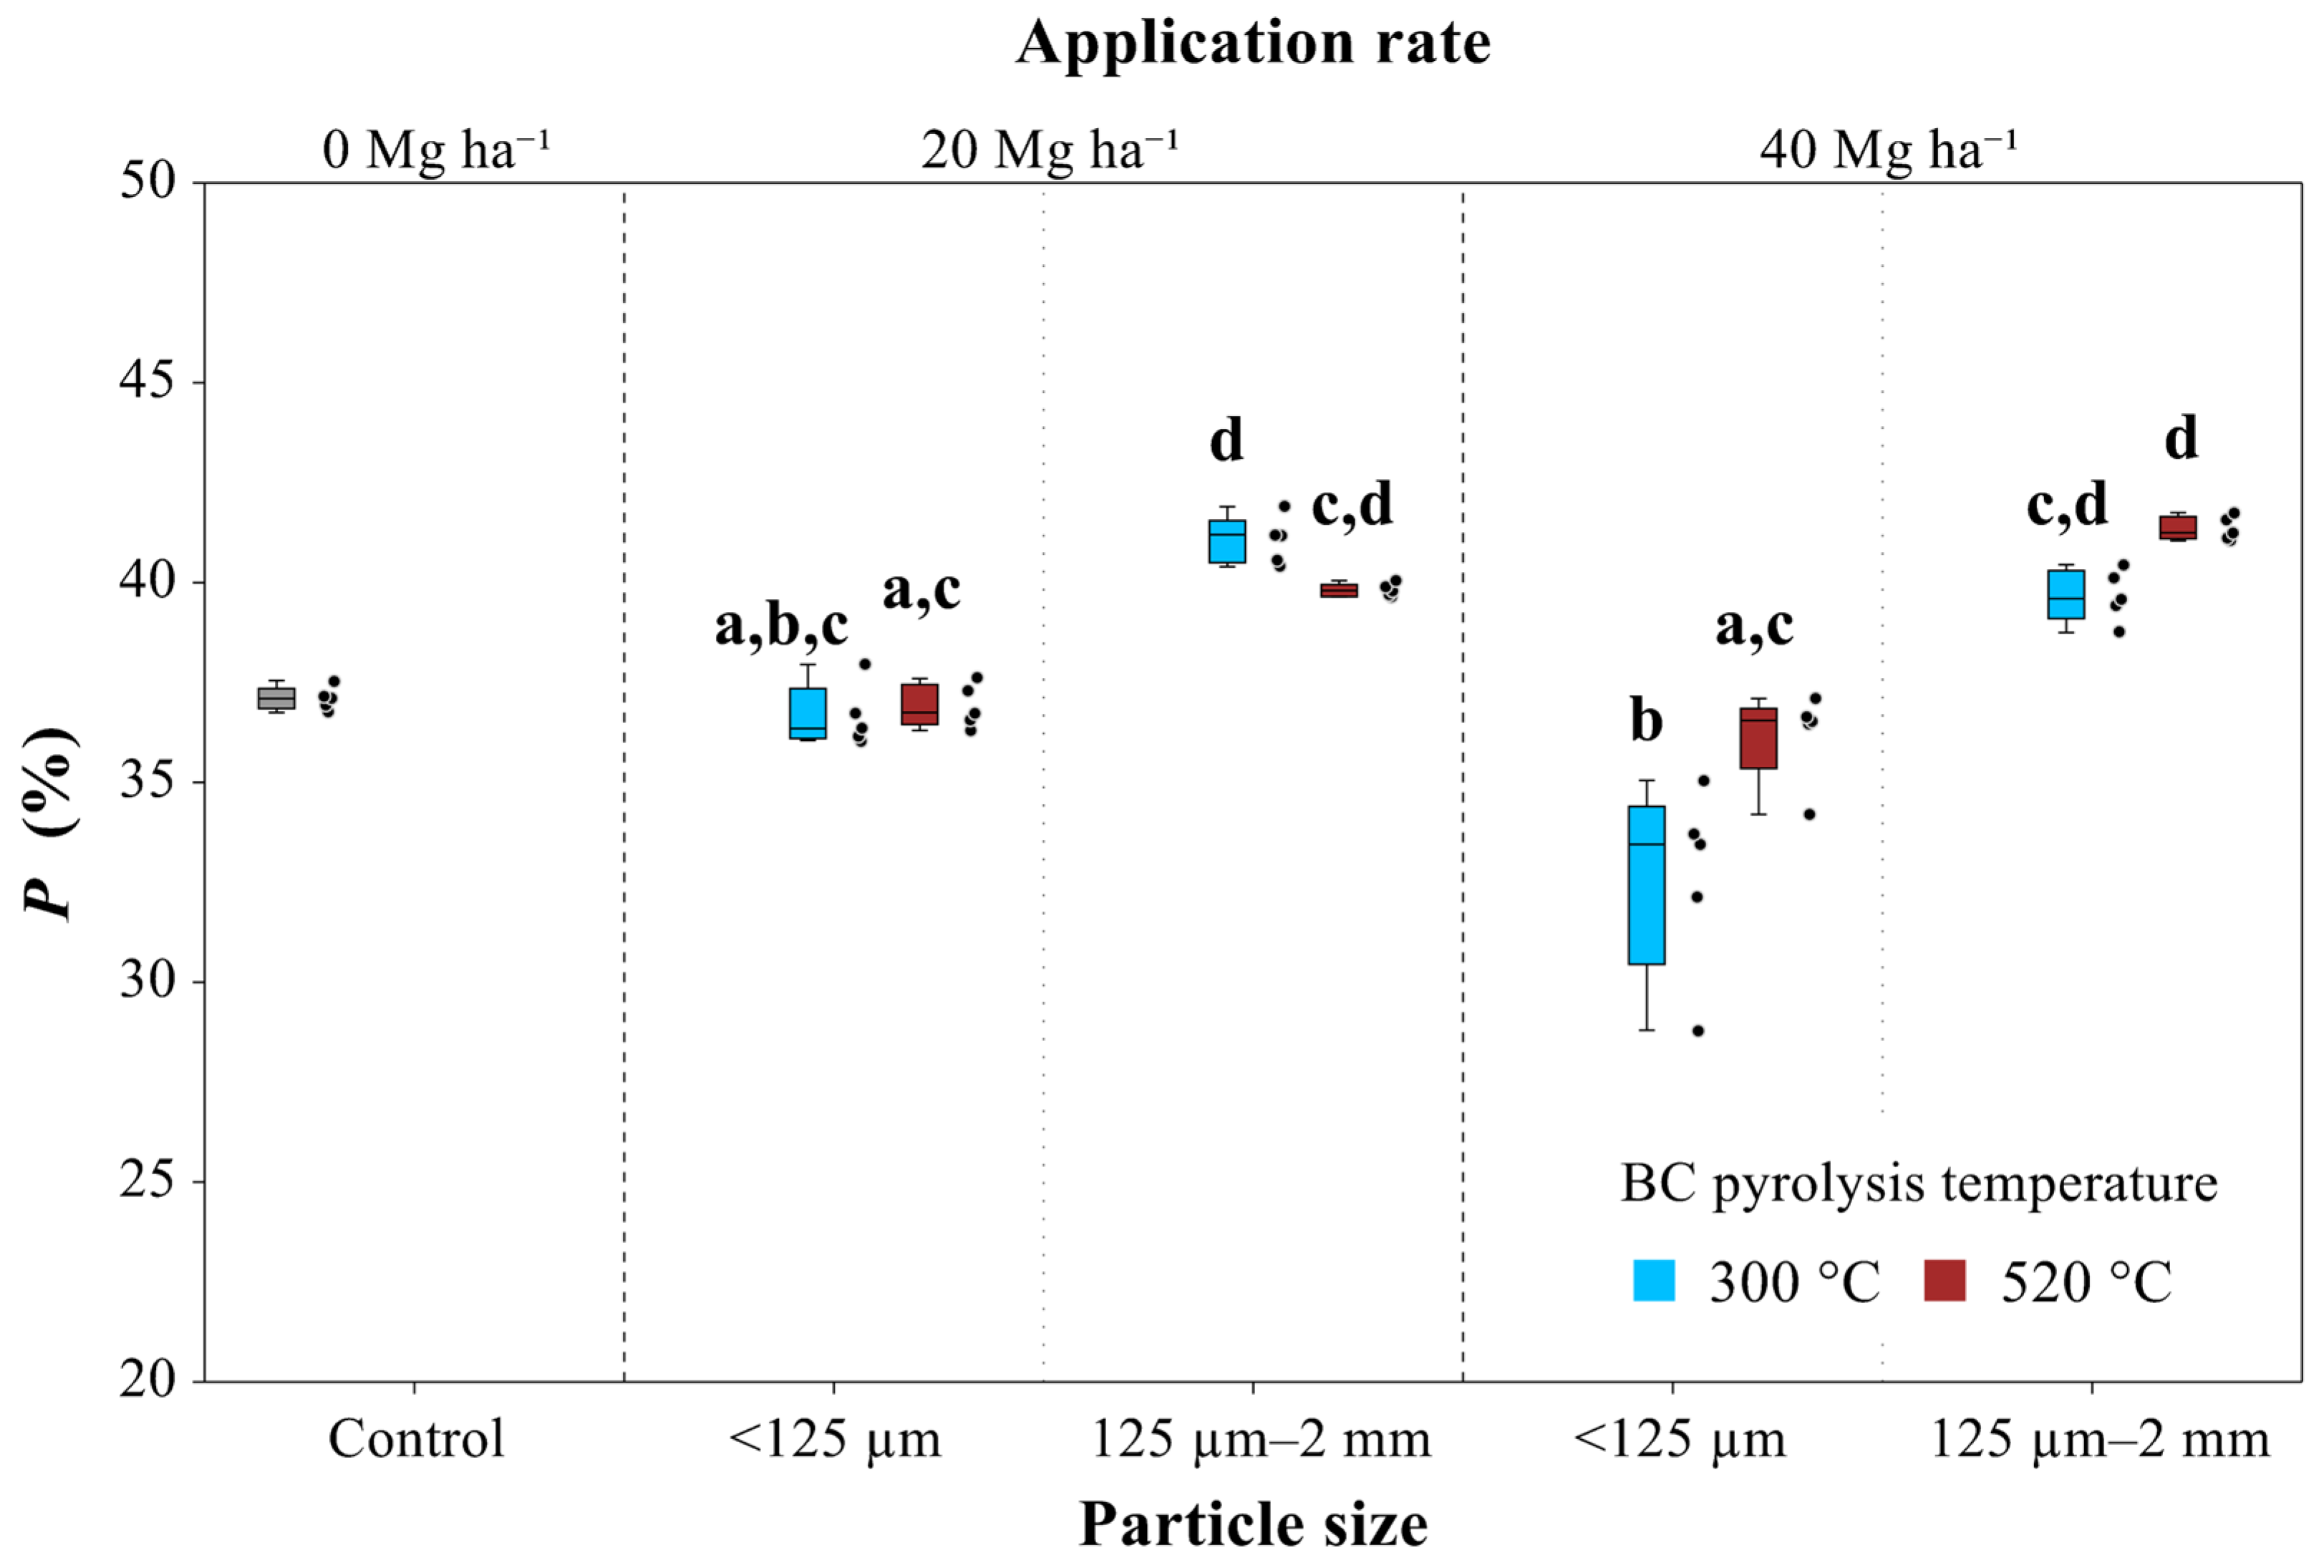
Figure 2.
Measured values of the available water content for plants (AWC) for all experiment treatments. The whiskers extend to a distance of 1.5 times the interquartile range from the edges of the box, and points represent individual measurements. Box plots denoted with different letters significantly differ (HSD test) on a significance level of p < 0.05.
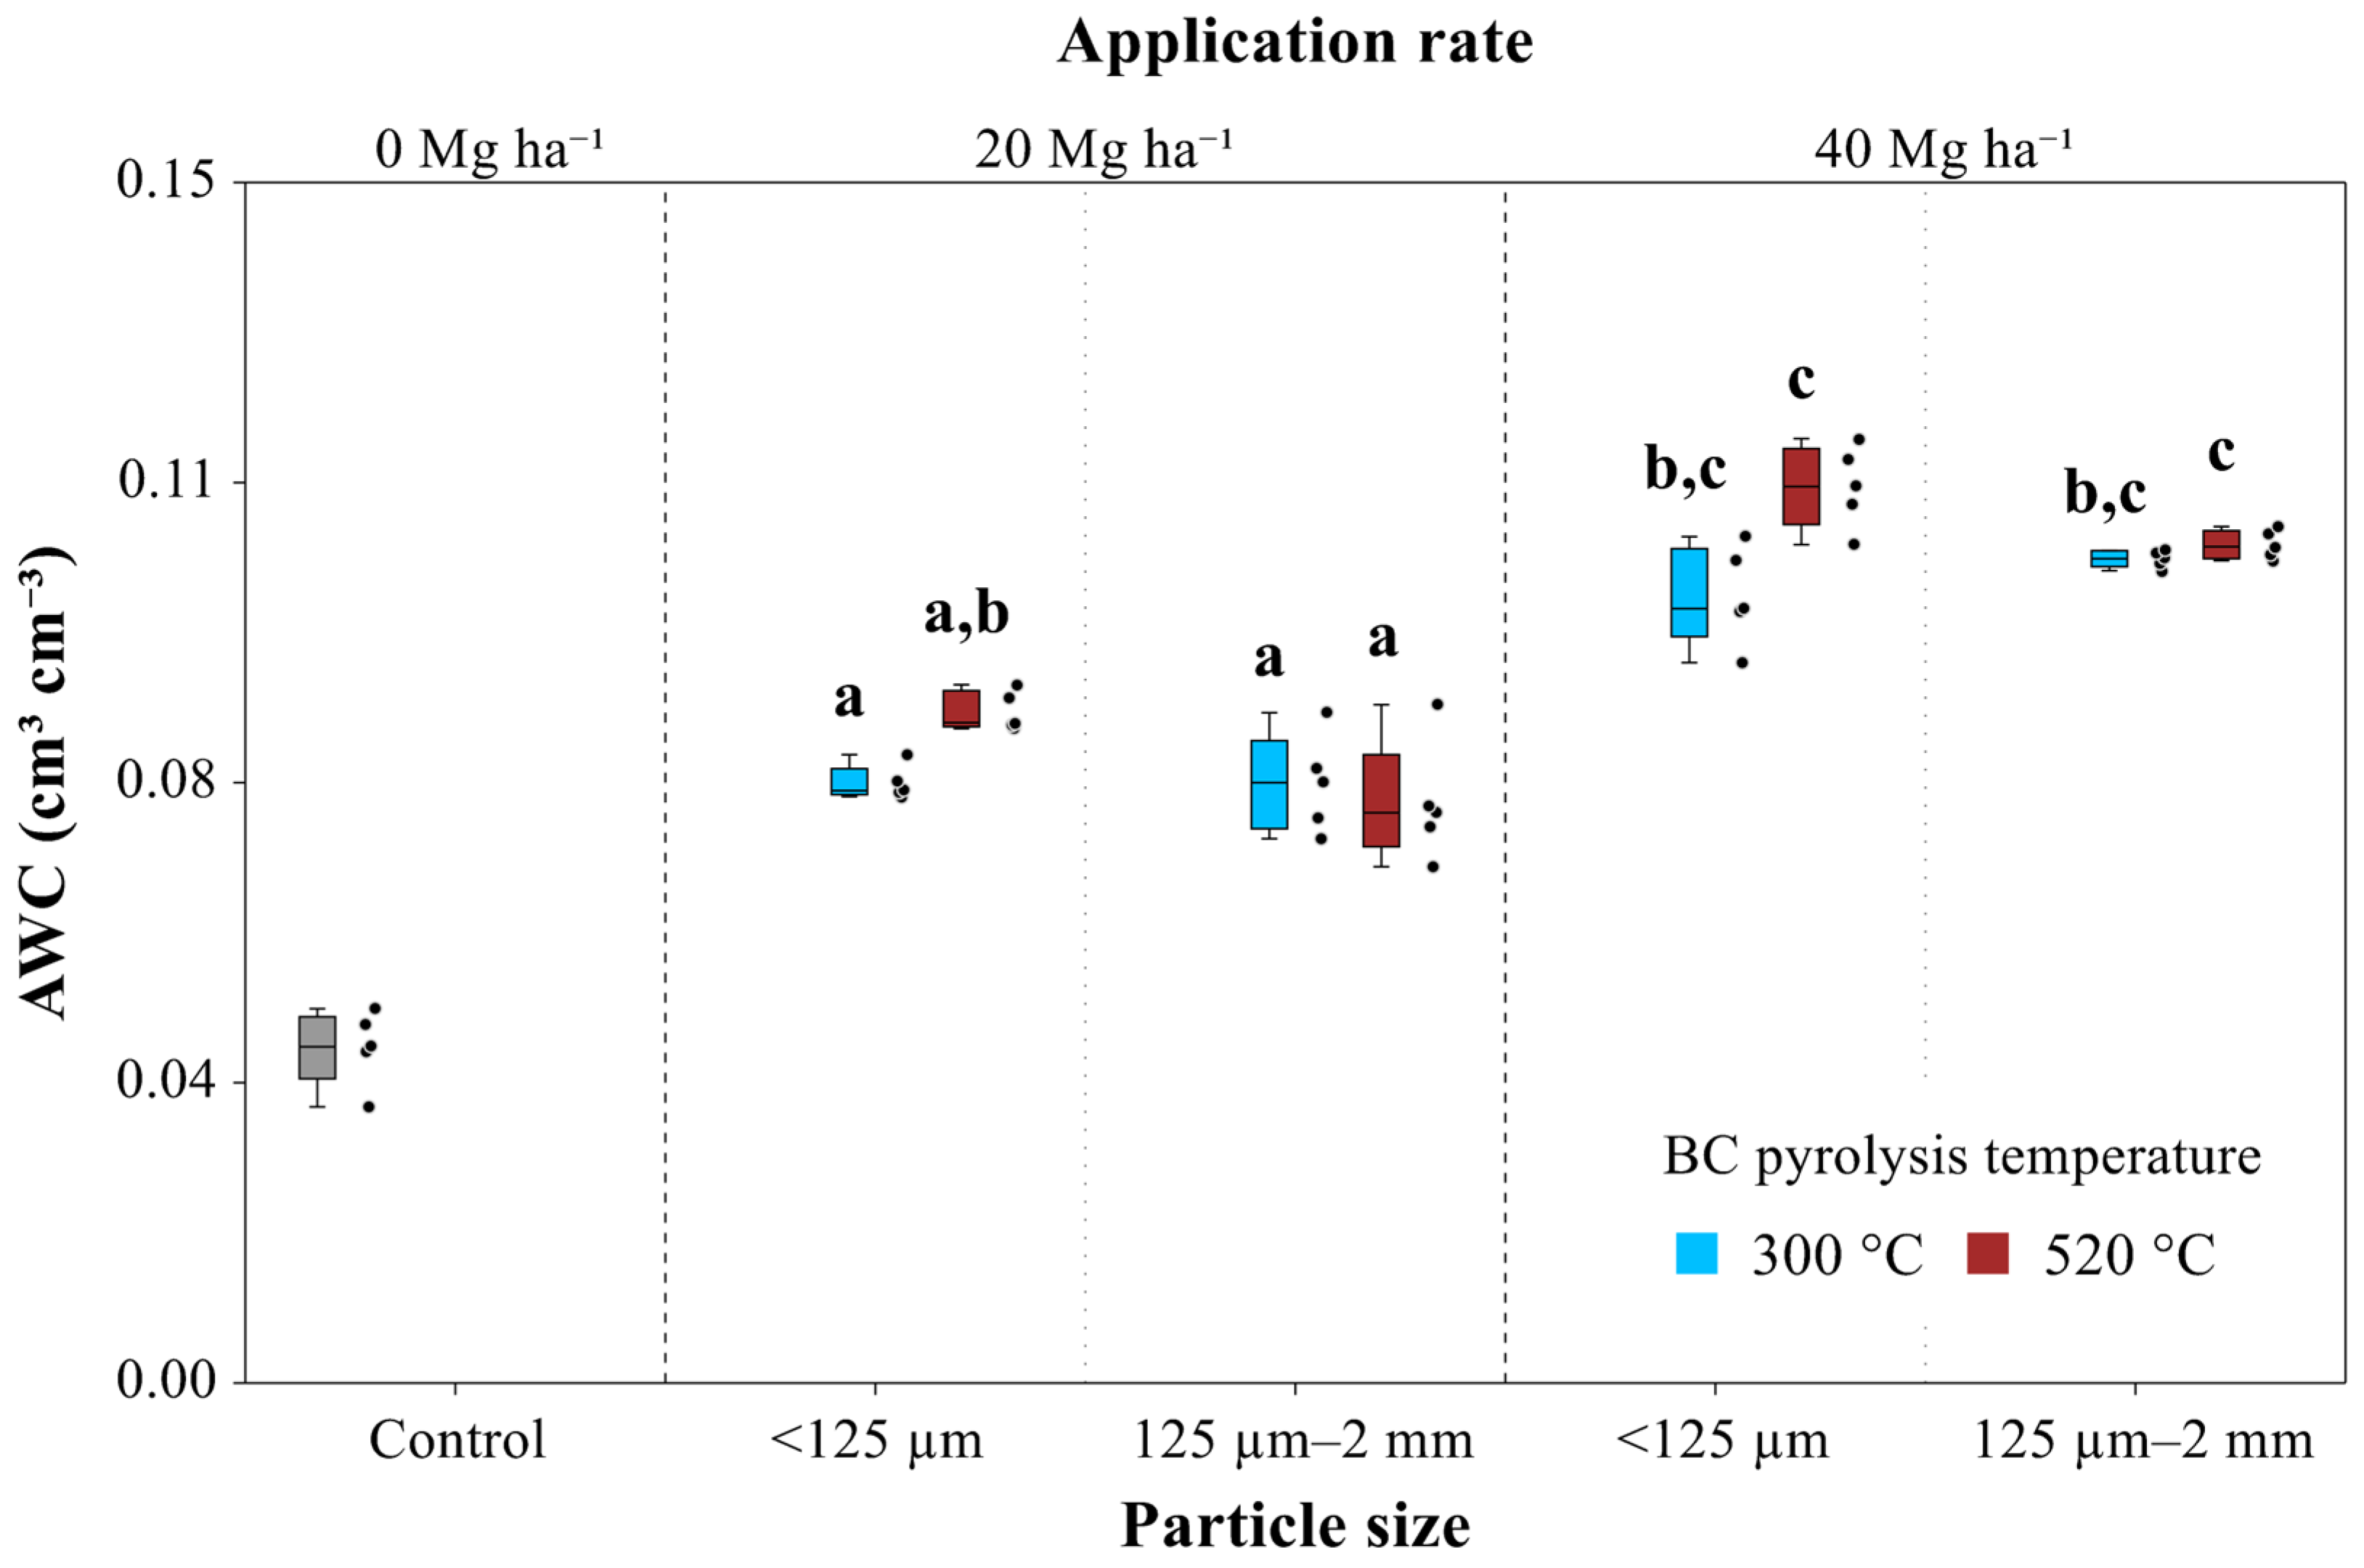
Figure 3.
Measured values of the saturated hydraulic conductivity (Ks) for all treatments of the experiment. The whiskers extend to a distance of 1.5 times the interquartile range from the edges of the box and points represent individual measurements. Box plots denoted with different letters significantly differ (HSD test) on a significance level of p < 0.05.
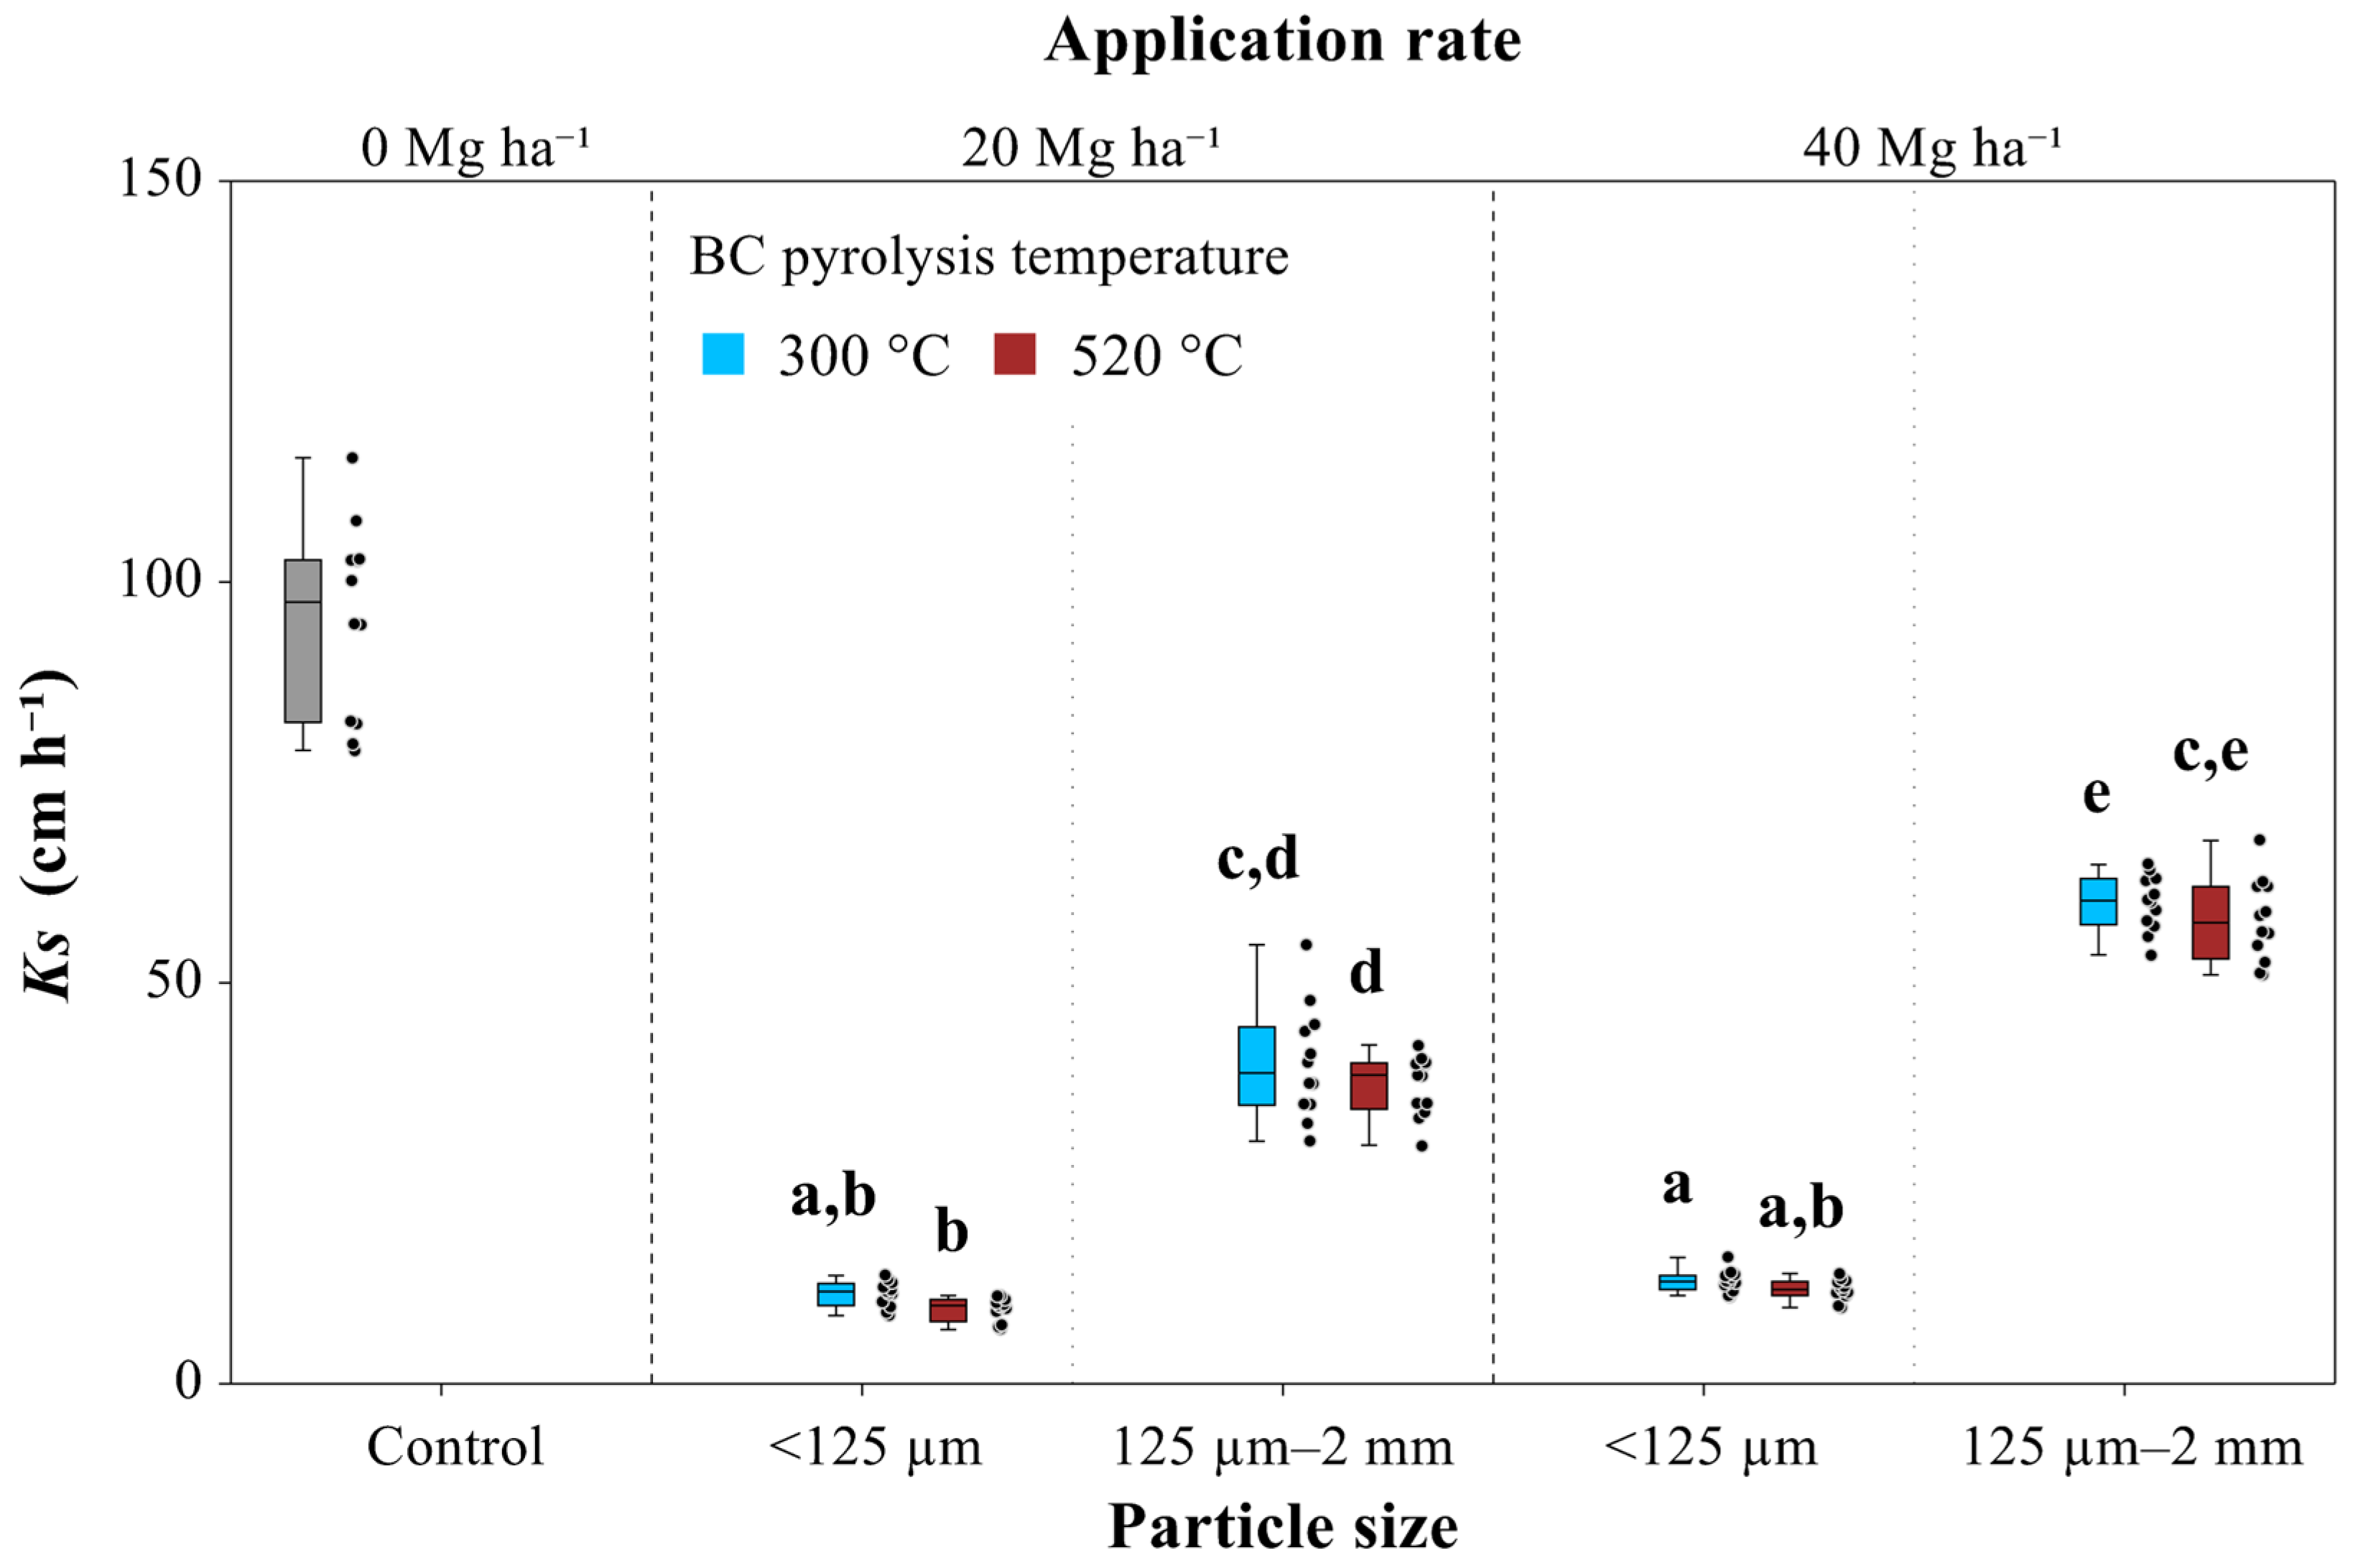
Figure 4.
Measured values of contact angle (CA) for all experiment treatments. The whiskers extend to a distance of 1.5 times the interquartile range from the edges of the box and points represent individual measurements. Box plots denoted with different letters significantly differ (HSD test) on a significance level of p < 0.05.

The test results did not indicate interactions between the variables of pyrolysis temperature and particle size, with a p-value of 0.130 (Table 4). However, there is an interaction between pyrolysis temperature and application rate with a p-value of <0.001. Additionally, an interaction between the particle size and application rate was observed with a p-value of 0.001. No interaction was observed between the pyrolysis temperature, particle size, and application rate variables, with a p-value of 0.765 (Table 4).
An HSD post hoc test confirmed significant differences in P between the treatment with the small-sized BC, pyrolyzed at 300 °C and applied at a rate of 40 Mg ha−1, and all large-sized BCs (produced at both temperatures, applied at both rates). Also, there was a significant difference between the large-sized BC, pyrolyzed at 520 °C and applied at a rate of 40 Mg ha−1, and all small-sized BCs produced at both temperatures and applied at both rates.
All significant differences in P between experimental treatments are shown in Figure 1. Compared to the control, the increase in P was measured only in treatments with the large-sized BC (the highest increase was observed in treatment with the BC pyrolyzed at 520 °C and applied at a rate of 40 Mg ha−1).
3.2. Available Water Content for Plants
Results of the t-test have shown a statistically significant increase in the available water content (AWC) for plants in all but one of the BC treatments (except for the treatment with the large-sized BC pyrolyzed at 520 °C and applied at a rate of 20 Mg ha−1) compared to sandy soil (Table 4). The AWC increase was generally higher in treatments with a higher application rate (40 Mg ha−1) regardless of the pyrolysis temperature and particle size. The largest increase was observed in the treatment with the small-sized BC pyrolyzed at 520 °C.
The results indicate that the AWC was significantly affected by pyrolysis temperature (p = 0.001), particle size (p = 0.021), and application rate (p < 0.001). Additionally, an interaction was observed between pyrolysis temperature and particle size (p < 0.001), while no interactions were found between pyrolysis temperature and rate (p = 0.135), particle size and rate (p = 0.142), or all three variables (p = 0.927) (Table 4).
In our comparison of individual BC treatments, the HSD test showed a significant difference between the treatments with a BC application rate of 20 Mg ha−1 (excluding the treatment with small-sized BC pyrolyzed at 520 °C) and the treatments with a BC application rate of 40 Mg ha−1 (Figure 2).
3.3. Saturated Hydraulic Conductivity
We found that the KS in treatments with BC was significantly affected by all examined factors: pyrolysis temperature (p = 0.01), particle size (p < 0.001), and application rate (p < 0.001). Results of the t-test have shown a statistically significant decrease in KS for all BC treatments, with the greatest decrease observed in treatments with the small-sized BC (Table 3).
The statistical analysis showed no significant interaction between pyrolysis temperature and particle size, with a p-value of 0.509. Similarly, there was no significant interaction between pyrolysis temperature and rate, with a p-value of 0.61. However, there was a significant interaction between particle size and rate, with a p-value of less than 0.001. Lastly, there was no significant interaction between pyrolysis temperature, particle size, and rate, with a p-value of 0.963 (Table 4).
After conducting an HSD post hoc test, we discovered significant differences between the treatment that used large-sized BCs, created at 300 °C and applied at 40 Mg ha−1, and all other treatments (excluding the treatment with the same size and rate of BC but with a higher pyrolysis temperature). Moreover, we observed significant differences between all treatments that used small-sized BCs and those that used large-sized BCs (Figure 3).
3.4. Contact Angle
Results of the t-test have shown a statistically significant increase in contact angle (CA) for all BC treatments, with the greatest decrease observed in treatments with small-sized BCs and BCs produced at 520 °C (Table 3).
The results of the three-way ANOVA indicate that the CA was not significantly affected by the factor pyrolysis temperature (p = 0.191). However, the test confirmed an effect of particle size (p = 0.004) and application rate (p < 0.001) on the CA in BC treatments (Table 4).
No significant interactions were observed between the pyrolysis temperature and particle size (p = 0.66), between the pyrolysis temperature and application rate (p = 0.956), between the particle size and application rate (p = 0.904), or between all three factors of pyrolysis temperature, particle size, and application rate (p = 0.79).
The results of the HSD post hoc test revealed significant differences between the treatments with the large-sized BC, which was produced at both temperatures and applied at 20 Mg ha−1, and the treatments that used the small-sized BC, which was created at both temperatures and applied at 40 Mg ha−1. Figure 4 illustrates all differences in the contact angle between experimental treatments.
4. Discussion
A statistically significant increase in porosity was registered for 4 of 8 treatments (namely for those with a large-sized (125 µm–2 mm) BC, produced at both temperatures and applied at both rates). It means that the hypothesis that biochar addition will increase porosity was only partially fulfilled. Our findings are consistent with those of Quin et al. [6], who presented a small increase in porosity (from 4.5 to 4.7%) after the addition of 1% of hardwood (Eucalyptus polybractea) BC (pyrolyzed at 550 °C and sieved to 250 µm–2 mm) to sandy soil. Gamage et al. [35] observed a higher increase in porosity (18%) after the addition of 1% of biochar to sandy soil. In our study, porosity in the soil after BC addition was significantly affected by pyrolysis temperature, particle size, and application rate. Similar results were observed by Głąb et al. [36], who found that porosity in sandy soil was affected by biochar rates and particle size but not by BC feedstock type. The changes in the physical properties of soil, such as porosity, are attributed to the mixing of soil with less dense material. This phenomenon is evident immediately after application in compacted, coarse-textured soils, as observed by Głąb [37]. Our results confirmed the effects of the pyrolysis temperature and application rate interaction and particle size and application rate interaction on p values. This fact is consistent with Verheijen et al. [38], who stated that the BC’s effects on P depend on the BC’s internal porosity, which is influenced by production conditions such as the gasification, pyrolysis temperature, and particle size of the applied BC. On the contrary, Głąb et al. [36] did not confirm the significant effect of particle size and application rate interaction or the BC feedstock and application interaction on P in sandy soil.
The BC has been found to enhance soil porosity through various mechanisms. These include the creation of new pores directly [39], a decrease in bulk density, and an increase in soil aggregation [38]. Moreover, the formation of accommodating pores between BC particles and soil aggregates [40], as well as the reduction in soil packing and restructuring of pore distribution, contribute to the increase in soil porosity.
A statistically significant increase in the available water content for plants (AWC) was registered in all but one BC treatment (an increase in AWC for the treatment with large-sized BC pyrolyzed at 520 °C and applied at a rate of 20 Mg ha−1 was not significant) compared to sandy soil. It means that the hypothesis that biochar addition will increase the AWC was fulfilled. Our findings are consistent with those of Gluba et al. [41], who registered an increase in the AWC for all the biochar size fractions (<50, 50–100, 100–250, <2000 µm) after the addition of 0.95% of biochar to sandy soil. Also, the study by Obia et al. [42] observed the highest increase of AWC after the addition of BC with a particle size of 0.5–1 mm in comparison to sandy soil without BC. Changes in the AWC after BC application in our study depended on all three examined factors (pyrolysis temperature, particle size, and application rate), similar to the study by Głąb et al. [36], who found that the AWC was affected by BC rates, particle size, and BC feedstock type. Kinney et al. [43], Peake et al. [44], and Uzoma et al. [45] found that higher pyrolysis temperatures and BC rates resulted in a greater increase in AWC after BC addition, which is consistent with our findings. Our study confirmed the effect of the interaction between pyrolysis temperature and particle size on AWC. The particle size of the BC can significantly affect AWC, influencing surface area and exposure of internal pore space [46]. Porosity and surface area remain pivotal controlling factors in determining soil AWC, but additional factors, such as the diverse surface functional groups of BCs (influenced by the feedstock used and pyrolysis temperature), also contribute to enhancing the soil AWC [43]. The study conducted by Głąb et al. [36] revealed that the application rate and particle size interaction had a significant impact on the AWC in sandy soil. However, our study showed inconsistent results as we could not confirm the effect of the interaction of these factors on AWC.
BC application could increase the AWC by reducing bulk density [47], increasing porosity [3,42], increasing surface area [48], and promoting soil aggregation, especially in coarse-textured soils.
All BC treatments resulted in a significant decrease in saturated hydraulic conductivity (KS) compared to sandy soil, with the greatest Ks decrease observed in treatments with a small-sized BC. It means that the hypothesis that biochar addition will decrease Ks was fulfilled. Our results correspond with the study by Brockhoff et al. [49], who found that switch grass BC application at a 5% v/v rate decreased Ks by about 52% in sandy soil. Also, Uzoma et al. [45] measured a 54% decrease in Ks after the application of cow manure BC in sandy soil. In our study, Ks in the sandy soil after BC addition was significantly affected by all three factors, which is consistent with Brockhoff et al. [49], who found that Ks was dependent on BC concentration in soil, and with Chen et al. [50], who observed the effect of the BC particle size on Ks in sandy soil with BC. Lim et al. [51] discovered that BCs having larger particle sizes, exceeding 1 mm, caused a more significant reduction in Ks compared to BCs having smaller particles when added to sandy soils. Our results confirmed the significant effect of the interaction between the application rate and particle size on Ks, which is not consistent with the results of the study by Głąb et al. [36], which did not confirm the effect of the interaction of the given factors.
In coarse-textured sandy soils, decreased Ks is likely to occur when (particularly small particle-sized) BCs fill macropore spaces between soil particles, leading to increased tortuosity and decreased pore diameter [51]. Reduced Ks can also be attributed to the induced water repellency in soils amended with hydrophobic BC [18]. In some cases, the values of Ks in coarse-textured soils may decrease initially due to the disruption of particle structure and clogging of macropores in the early stages. However, after several wetting–drying cycles, Ks may show an increase [13].
All BC treatments resulted in a significant increase in contact angle (CA) compared to sandy soil, with the greater CA increase for the higher BC application rate. It means that the hypothesis that BC addition will increase the CA was fulfilled. Our findings are consistent with those of Liu et al. [18], who observed the greatest CA increase for the highest application rate (10%) of BCs with a contact angle CA = 107° to sandy soil. According to the results obtained by Kinney et al. [43], the SWR depends on BC application rates (the higher the application rates, the higher the SWR), which is consistent with our results. We also observed the effect of BC particle size on the severity of the SWR (measured as the CA), which is not mentioned in previous studies. Our study did not confirm the effect of pyrolysis temperature on the CA in soil with BCs. Contrary to our findings, the study by Kinney et al. [43] confirmed the effect of pyrolysis temperature on the SWR of BC-amended soil, and the SWR decreased as the temperature increased. Hallin et al. [52] suggested an explanation for this phenomenon. They observed that BCs produced below 500 °C retained organic functional groups from the feedstock, typically water repellent. However, pyrolysis at temperatures above 500 °C caused the organic groups linked to hydrophobicity to volatilize, resulting in more hydrophilic biochar. The pyrolysis temperatures at which the BCs used in our study were produced were 300 and 520 °C. Accordingly, a second BC was produced at the upper limit of the pyrolysis temperature, at which point the loss of the SWR was not yet reached, but there was still an increase in the SWR compared to the first BC. Both BCs were water repellent and there is no significant difference between them; therefore, the effect of the pyrolysis temperature is not apparent.
5. Conclusions
Our results showed that the application of BCs altered the hydrophysical properties of control sandy soil, as shown by the increased porosity P, available water content AWC, and reduced saturated hydraulic conductivity Ks. Statistical analysis revealed that P, AWC, and Ks were affected by all three examined factors, while CA was only affected by the BC application rate and particle size. The addition of a higher application rate of 40 Mg/ha (compared to 20 Mg/ha) of water-repellent BCs to sandy soil caused a decrease in porosity (P) and an increase in plant available water (AWC), saturated hydraulic conductivity (Ks), and contact angle (CA). Treatments with applied smaller (<125 µm) size fraction (compared to 125 µm–2 mm fraction) of water-repellent BCs to sandy soil showed, on average, a decrease in P and Ks but an increase in AWC and CA. The addition of water-repellent BCs produced at a higher (520 °C) pyrolysis temperature caused an increase in P and AWC and a decrease in Ks. The change in the CA parameter was not significant for this factor. Therefore, the effectiveness of biochar as a sandy soil amendment depends on its application rate, particle size, and pyrolysis temperature.
By amending sandy soils with BCs, the amount of water required for irrigation can be reduced, which can help mitigate drought conditions and save water. Nevertheless, further investigations are needed to understand the effect of BC application under climate conditions with long hot and dry periods, which may promote soil water repellency.
In addition to improving the hydrophysical properties of sandy soil, converting biomass into biochar and subsequently storing it in the soil is seen as a promising strategy for reducing atmospheric CO2 concentrations and mitigating climate change by enhancing short-term carbon sequestration.
Author Contributions
Conceptualization, Ľ.L., P.Š., J.V. and R.V.; methodology, J.V. and P.Š.; software, P.Š.; validation, J.V. and P.Š.; formal analysis, Ľ.L., P.Š., J.V. and R.V.; investigation, P.Š. and J.V.; resources, J.V. and P.Š.; data curation, P.Š., J.V. and R.V.; writing—original draft preparation, Ľ.L., J.V. and P.Š.; writing—review and editing, Ľ.L., P.Š., J.V. and R.V.; visualization, P.Š.; supervision, J.V., P.Š. and Ľ.L.; project administration, J.V. and P.Š.; funding acquisition, J.V. and P.Š. All authors have read and agreed to the published version of the manuscript.
Funding
This research was funded by the Scientific Grant Agency project VEGA 2/0065/24 and by the Slovak Research and Development Agency project APVV-21-0089.
Data Availability Statement
The raw data supporting the conclusions of this article will be made available by the authors on request.
Conflicts of Interest
The authors declare no conflicts of interest.
References
- Baiamonte, G.; Crescimanno, G.; Parrino, F.; De Pasquale, C. Effect of Biochar on the Physical and Structural Properties of a Sandy Soil. Catena 2019, 175, 294–303. [Google Scholar] [CrossRef]
- Alghamdi, A.G.; Aljohani, B.H.; Aly, A.A. Impacts of Olive Waste-Derived Biochar on Hydro-Physical Properties of Sandy Soil. Sustainability 2021, 13, 5493. [Google Scholar] [CrossRef]
- Abel, S.; Peters, A.; Trinks, S.; Schonsky, H.; Facklam, M.; Wessolek, G. Impact of Biochar and Hydrochar Addition on Water Retention and Water Repellency of Sandy Soil. Geoderma 2013, 202–203, 183–191. [Google Scholar] [CrossRef]
- Edeh, I.G.; Mašek, O.; Buss, W. A Meta-Analysis on Biochar’s Effects on Soil Water Properties—New Insights and Future Research Challenges. Sci. Total Environ. 2020, 714, 136857. [Google Scholar] [CrossRef] [PubMed]
- Yang, Q.S.; Mašek, O.; Zhao, L.; Nan, H.Y.; Yu, S.T.; Yin, J.X.; Li, Z.P.; Cao, X.D. Country-Level Potential of Carbon Sequestration and Environmental Benefits by Utilizing Crop Residues for Biochar Implementation. Appl. Energy 2021, 282, 116275. [Google Scholar] [CrossRef]
- Quin, P.R.; Cowie, A.L.; Flavel, R.J.; Keen, B.P.; Macdonald, L.M.; Morris, S.G.; Singh, B.P.; Young, I.M.; Van Zwieten, L. Oil Mallee Biochar Improves Soil Structural Properties—A Study with x-Ray Micro-CT. Agric. Ecosyst. Environ. 2014, 191, 142–149. [Google Scholar] [CrossRef]
- Alotaibi, K.D.; Schoenau, J.J. Addition of Biochar to a Sandy Desert Soil: Effect on Crop Growth, Water Retention and Selected Properties. Agronomy 2019, 9, 327. [Google Scholar] [CrossRef]
- Ajayi, A.E.; Horn, R. Comparing the Potentials of Clay and Biochar in Improving Water Retention and Mechanical Resilience of Sandy Soil. Int. Agrophysics 2016, 30, 391–399. [Google Scholar] [CrossRef]
- Basso, A.S.; Miguez, F.E.; Laird, D.A.; Horton, R.; Westgate, M. Assessing Potential of Biochar for Increasing Water-Holding Capacity of Sandy Soils. Glob. Change Biol. Bioenergy 2013, 5, 132–143. [Google Scholar] [CrossRef]
- Vitková, J.; Kondrlová, E.; Rodný, M.; Šurda, P.; Horák, J. Analysis of Soil Water Content and Crop Yield after Biochar Application in Field Conditions. Plant Soil Environ. 2017, 63, 569–573. [Google Scholar] [CrossRef]
- Ndede, E.O.; Kurebito, S.; Idowu, O.; Tokunari, T.; Jindo, K. The Potential of Biochar to Enhance the Water Retention Properties of Sandy Agricultural Soils. Agronomy 2022, 12, 311. [Google Scholar] [CrossRef]
- Ajayi, A.E.; Horn, R. Modification of Chemical and Hydrophysical Properties of Two Texturally Differentiated Soils due to Varying Magnitudes of Added Biochar. Soil Till. Res. 2016, 164, 34–44. [Google Scholar] [CrossRef]
- Villagra-Mendoza, K.; Horn, R. Effect of Biochar Addition on Hydraulic Functions of Two Textural Soils. Geoderma 2018, 326, 88–95. [Google Scholar] [CrossRef]
- Fu, G.Q.; Qiu, X.N.; Xu, X.Y.; Zhang, W.; Zang, F.; Zhao, C.Y. The Role of Biochar Particle Size and Application Rate in Promoting the Hydraulic and Physical Properties of Sandy Desert Soil. Catena 2021, 207, 105607. [Google Scholar] [CrossRef]
- Xu, H.; Shan, Y.D.; Ling, N.; Ren, L.X.; Qu, H.G.; Liu, Z.P.; Xu, G.H. Divergent Effects of Food Waste Derived Hydrochar on Hydraulic Properties and Infiltration in a Sandy Soil. J. Hydrol. Part A 2023, 626, 130267. [Google Scholar] [CrossRef]
- Trifunovic, B.; Gonzales, H.B.; Ravi, S.; Sharratt, B.S.; Mohanty, S.K. Dynamic Effects of Biochar Concentration and Particle Size on Hydraulic Properties of Sand. Land Degrad. Dev. 2018, 29, 884–893. [Google Scholar] [CrossRef]
- Alessandrino, L.; Eusebi, A.L.; Aschonitis, V.; Mastrocicco, M.; Colombani, N. Variation of the Hydraulic Properties in Sandy Soils Induced by the Addition of Graphene and Classical Soil Improvers. J. Hydrol. Part C 2022, 612, 128256. [Google Scholar] [CrossRef]
- Liu, Z.P.; Ogunmokun, F.A.; Wallach, R. Does Biochar Affect Soil Wettability and Flow Pattern? Geoderma 2022, 417, 115826. [Google Scholar] [CrossRef]
- WRB. World Reference Base for Soil Resources 2014, Update 2015. In International Soil Classification System for Naming Soils and Creating Legends for Soil Maps, 4th ed.; International Union of Soil Sciences (IUSS): Vienna, Austria, 2022. [Google Scholar]
- ISO 10390; Soil, Treated Biowaste and Sludge. Determination of pH. International Organization for Standardization: Geneva, Switzerland, 2021.
- Walkley, A.; Black, I.A. An Examination of the Degtjareff Method for Determining Soil Organic Matter, and a Proposed Modification of the Chromic Acid Titration Method. Soil Sci. 1934, 37, 29–38. [Google Scholar] [CrossRef]
- Hraško, J. Soil Analyses, 1st ed.; Slovak Publishing House of Agricultural Literature: Bratislava, Slovakia, 1962; p. 335. (In Slovak) [Google Scholar]
- ISO 10523; Water Quality. Determination of pH. International Organization for Standardization: Geneva, Switzerland, 2008.
- Doerr, S.H. On Standardizing the “Water Drop Penetration Time” and the “Molarity of an Ethanol Droplet” Techniques to Classify Soil Hydrophobicity: A Case Study Using Medium Textured Soils. Earth Surf. Process. Landf. 1998, 23, 663–668. [Google Scholar] [CrossRef]
- Tinebra, I.; Alagna, V.; Iovino, M.; Bagarello, V. Comparing Different Application Procedures of the Water Drop Penetration Time Test to Assess Soil Water Repellency in a Fire Affected Sicilian Area. Catena 2019, 177, 41–48. [Google Scholar] [CrossRef]
- Danielson, R.E.; Sutherland, P.L. Porosity. In Methods of Soil Analysis: Part 1—Physical and Mineralogical Methods, 2nd ed.; Klute, A., Ed.; SSSA: Madison, WI, USA, 1986; pp. 443–461. [Google Scholar] [CrossRef]
- Blake, G.R.; Hartge, K.H. Particle density. In Methods of Soil Analysis: Part 1—Physical and Mineralogical Methods, 2nd ed.; Klute, A., Ed.; SSSA: Madison, WI, USA, 1986; pp. 377–381. [Google Scholar] [CrossRef]
- Jury, W.A.; Gardner, W.R.; Gardner, W.H. Soil Physics, 5th ed.; John Wiley and Sons: New York, NY, USA, 1991; p. 328. [Google Scholar]
- ISO 11274; Soil Quality. Determination of the Water-Retention Characteristic. Laboratory Methods. International Organization for Standardization: Geneva, Switzerland, 2019.
- van Genuchten, M.T. A Closed-Form Equation for Predicting the Hydraulic Conductivity of Unsaturated Soils. Soil Sci. Soc. Am. J. 1980, 44, 892–898. [Google Scholar] [CrossRef]
- Novák, V.; Hlaváčiková, H. Applied Soil Hydrology, 1st ed.; Springer: Cham, Switzerland, 2019; p. 342. [Google Scholar]
- Bachmann, J.; Horton, R.; van der Ploeg, R.R.; Woche, S. Modified Sessile Drop Method for Assessing Initial Soil-Water Contact Angle of Sandy Soil. Soil Sci. Soc. Am. J. 2000, 64, 564–567. [Google Scholar] [CrossRef]
- Goebel, M.O.; Woche, S.K.; Abraham, P.M.; Schaumann, G.E.; Bachmann, J. Water Repellency Enhances the Deposition of Negatively Charged Hydrophilic Colloids in a Water-Saturated Sand Matrix. Colloids Surf. A Physicochem. Eng. Asp. 2013, 431, 150–160. [Google Scholar] [CrossRef]
- Papierowska, E.; Matysiak, W.; Szatyłowicz, J.; Debaene, G.; Urbanek, E.; Kalisz, B.; Łachacz, A. Compatibility of Methods Used for Soil Water Repellency Determination for Organic and Organo-Mineral Soils. Geoderma 2018, 314, 221–231. [Google Scholar] [CrossRef]
- Gamage, D.N.; Mapa, R.B.; Dharmakeerthi, R.S.; Biswas, A. Effect of Rice Husk Biochar on Selected Soil Properties in Tropical Alfisols. Soil Res. 2016, 54, 302–310. [Google Scholar] [CrossRef]
- Głąb, T.; Palmowska, J.; Zaleski, T.; Gondek, K. Effect of biochar application on soil hydrological properties and physical quality of sandy soil. Geoderma 2016, 281, 11–20. [Google Scholar] [CrossRef]
- Głąb, T. Water retention and repellency of a sandy soil amended with municipal compost. Compost Sci. Util. 2014, 22, 47–56. [Google Scholar] [CrossRef]
- Verheijen, F.; Jefery, S.; Bastos, A.C.; Van der Velde, M.; Diafas, I. Biochar Application to Soils; A Critical Scientific Review of Effects on Soil Properties, Processes, and Functions; Office for Official Publications of the European Communities: Luxembourg, 2010; p. 166. [Google Scholar]
- Atkinson, C.J.; Fitzgerald, J.D.; Hipps, N.A. Potential Mechanisms for Achieving Agricultural Benefits from Biochar Application to Temperate Soils: A Review. Plant Soil 2010, 337, 1–18. [Google Scholar] [CrossRef]
- Novak, J.M.; Busscher, W.J.; Watts, D.W.; Amonette, J.E.; Ippolito, J.A.; Lima, I.M.; Gaskin, J.; Das, K.C.; Steiner, C.; Ahmedna, M.R.D.; et al. Biochars impact on soil-moisture storage in an Ultisol and two Aridisols. Soil Sci. 2012, 177, 310–320. [Google Scholar] [CrossRef]
- Gluba, Ł.; Rafalska-Przysucha, A.; Szewczak, K.; Łukowski, M.; Szlazak, R.; Vitková, J.; Kobyłecki, R.; Bis, Z.; Wichlinski, M.; Zarzycki, R.; et al. Effect of Fine Size-Fractionated Sunflower Husk Biochar on Water Retention Properties of Arable Sandy Soil. Materials 2021, 14, 1335. [Google Scholar] [CrossRef]
- Obia, A.; Mulder, J.; Martinsen, V.; Cornelissen, G.; Børresen, T. In Situ Effects of Biochar on Aggregation, Water Retention and Porosity in Light-Textured Tropical Soils. Soil Tillage Res. 2016, 155, 35–44. [Google Scholar] [CrossRef]
- Kinney, T.; Masiello, C.; Dugan, B.; Hockaday, W.; Dean, M.; Zygourakis, K.; Barnes, R. Hydrologic properties of biochars produced at different temperatures. Biomass Bioenergy 2012, 41, 34–43. [Google Scholar] [CrossRef]
- Peake, L.R.; Reid, G.J.; Tang, X. Quantifying the influence of biochar on the physical and hydrological properties of dissimilar soils. Geoderma 2014, 235–236, 182–190. [Google Scholar] [CrossRef]
- Uzoma, K.C.; Inoue, M.; Andry, H.; Zahoor, A.; Nishihara, E. Influence of Biochar Application on Sandy Soil Hydraulic Properties and Nutrient Retention. J. Food Agric. Environ. 2011, 9, 1137–1143. [Google Scholar]
- Liao, W.; Thomas, S.C. Biochar Particle Size and Post-Pyrolysis Mechanical Processing Afect Soil pH, Water Retention Capacity, and Plant Performance. Soil Syst. 2019, 3, 14. [Google Scholar] [CrossRef]
- Usowicz, B.; Lipiec, J.; Łukowski, M.; Marczewski, W.; Usowicz, J. The Effect of Biochar Application on Thermal Properties and Albedo of Loess Soil under Grassland and Fallow. Soil. Tillage Res. 2016, 164, 45–51. [Google Scholar] [CrossRef]
- Laird, D.A.; Fleming, P.; Davis, D.D.; Horton, R.; Wang, B.; Karlen, D.L. Impact of Biochar Amendments on the Quality of a Typical Midwestern Agricultural Soil. Geoderma 2010, 158, 443–449. [Google Scholar] [CrossRef]
- Brockhoff, S.R.; Christians, N.E.; Killorn, R.J.; Horton, R.; Davis, D.D. Physical and Mineral-Nutrition Properties of Sand-Based Turfgrass Root Zones Amended with Biochar. Agron. J. 2010, 102, 1627–1631. [Google Scholar] [CrossRef]
- Chen, C.; Wang, R.; Shang, J.; Liu, K.; Irshad, M.K.; Hu, K.; Arthur, E. Effect of Biochar Application on Hydraulic Properties of Sandy Soil under Dry and Wet Conditions. Vadose Zone J. 2018, 17, 1–8. [Google Scholar] [CrossRef]
- Lim, T.J.; Spokas, K.A.; Feyereisen, G.; Novak, J.M. Predicting the Impact of Biochar Additions on Soil Hydraulic Properties. Chemosphere 2016, 142, 136–144. [Google Scholar] [CrossRef] [PubMed]
- Hallin, I.L.; Douglas, P.; Doerr, S.H.; Bryant, R. The effect of addition of a wettable biochar on soil water repellency. Eur. J. Soil Sci. 2015, 66, 1063–1073. [Google Scholar] [CrossRef]
Table 1.
Parameters of sandy soil (COX—soil organic carbon content).
| Size Fraction (%) | pH (H2O) (-) | COX (%) | Carbonates (%) | ||
|---|---|---|---|---|---|
| Sand | Silt | Clay | |||
| 91.0 | 7.5 | 1.5 | 6.84 | 0.04 | <0.05 |
Table 2.
Parameters of used biochars (C—carbon content, H—hydrogen content, N—nitrogen content, WDPT—water drop penetration time, CA—contact angle).
Table 2.
Parameters of used biochars (C—carbon content, H—hydrogen content, N—nitrogen content, WDPT—water drop penetration time, CA—contact angle).
| Pyrolysis Temperature (°C) | pH (H2O) (-) | C (%) | H (%) | N (%) | WDPT (s) | CA (°) |
|---|---|---|---|---|---|---|
| 300 | 9.14 | 82.2 | 2.74 | 0.86 | 12,609 | 115.56 |
| 520 | 7.93 | 83.1 | 2.21 | 1.19 | 12,613 | 128.30 |
Disclaimer/Publisher’s Note: The statements, opinions and data contained in all publications are solely those of the individual author(s) and contributor(s) and not of MDPI and/or the editor(s). MDPI and/or the editor(s) disclaim responsibility for any injury to people or property resulting from any ideas, methods, instructions or products referred to in the content. |
© 2024 by the authors. Licensee MDPI, Basel, Switzerland. This article is an open access article distributed under the terms and conditions of the Creative Commons Attribution (CC BY) license (https://creativecommons.org/licenses/by/4.0/).
Share and Cite
MDPI and ACS Style
Vitková, J.; Šurda, P.; Lichner, Ľ.; Výleta, R. Influence of Biochar Application Rate, Particle Size, and Pyrolysis Temperature on Hydrophysical Parameters of Sandy Soil. Appl. Sci. 2024, 14, 3472. https://doi.org/10.3390/app14083472
AMA Style
Vitková J, Šurda P, Lichner Ľ, Výleta R. Influence of Biochar Application Rate, Particle Size, and Pyrolysis Temperature on Hydrophysical Parameters of Sandy Soil. Applied Sciences. 2024; 14(8):3472. https://doi.org/10.3390/app14083472
Chicago/Turabian StyleVitková, Justína, Peter Šurda, Ľubomír Lichner, and Roman Výleta. 2024. "Influence of Biochar Application Rate, Particle Size, and Pyrolysis Temperature on Hydrophysical Parameters of Sandy Soil" Applied Sciences 14, no. 8: 3472. https://doi.org/10.3390/app14083472
Note that from the first issue of 2016, this journal uses article numbers instead of page numbers. See further details here.