
The Effect of Laser Settings and Ureteral Access Sheath Size on Intrapelvic Temperature during Holmium Laser Lithotripsy

1
Department of Normal and Clinical Anatomy, Institute of Medical Sciences, Medical College of Rzeszow University, ul. Leszka Czarnego 4, 35-615 Rzeszów, Poland
2
Clinical Department of Urology and Urological Oncology, Municipal Hospital in Rzeszow, ul. Rycerska 4, 35-241 Rzeszów, Poland
3
Department of Urology, Lazarski University, Świeradowska 43, 02-662 Warsaw, Poland
*
Author to whom correspondence should be addressed.
Appl. Sci. 2024, 14(8), 3501; https://doi.org/10.3390/app14083501
Submission received: 24 March 2024
/
Revised: 18 April 2024
/
Accepted: 19 April 2024
/
Published: 21 April 2024
(This article belongs to the Section Applied Biosciences and Bioengineering)
Abstract
:Introduction: Thermal damage to the kidney during holmium laser lithotripsy is a serious complication, which cannot always be prevented considering the diversity of conditions in the kidney and the lack of technical capability to measure intrarenal temperature in real-time. The aim of this study was to analyze the impact of different power settings of the holmium laser and the flow rate of irrigation fluid conditioned by the size of the sheath on the fluid temperature in a model of the pelvicalyceal system during lithotripsy. Materials and Methods: A lithotripsy of artificial stones was performed in a 3D-printed model of the renal pelvicalyceal system with a volume of 20.5 mL. A gravity-driven fluid flow was applied (p = 60 cm H2O). A 9.2Fr ureteroscope was introduced into the model through a ureteral access sheath of either 10/12Fr or 12/14Fr. Lithotripsy power ranged from 12 to 25 W. Temperature was measured using thermography. Results: For the 10/12Fr ureteral access sheath, the fluid flow rate was 2.7 mL/min, with the maximum temperature reached within 20 min ranging from 45 to 50 °C. For the 12/14Fr ureteral access sheath, the fluid flow rate was 9.8 mL/min, with the achieved temperature ranging from 35 to 45 °C. Laser power influenced the rate of temperature increase and the maximum temperature reached. During the first 5 min, the rate of temperature increase was solely dependent on laser power, not on the flow rate. Temperatures of 40 °C were only not exceeded with high flow rates (12/14Fr sheath) and power below 20 W. Conclusions: In a short period, the rate of temperature increase depends solely on laser power, not on the irrigation flow rate. During prolonged lithotripsy, the maximum temperature value depends on both parameters.
1. Introduction
The application of the holmium YAG (Ho:YAG) laser in minimally invasive urological procedures has been a milestone in the treatment of kidney stones. Ho:YAG is a solid-state, pulsed laser, enabling a high absorption of laser energy via water. This results in efficient lithotripsy through both the photo-acoustic and photo-thermal decomposition of stones [1]. Despite the immense technological progress and the introduction of new generations of lasers into daily urological practice, the Ho:YAG laser continues to play a leading role in flexible ureteroscopy [2]. The Ho:YAG laser exhibits thermomechanical activity, and the primary concern associated with its use revolves around potential thermal injuries to the soft tissues within the urinary tract, which may occur due to the overheating of irrigation fluid, resulting from the direct absorption of infrared-laser energy [3]. Earlier studies demonstrated that the denaturation of urinary tract proteins takes place at 43 °C [4], and coagulative tissue necrosis occurs at a temperature of 54 °C in porcine kidneys [5]. One of the kidney-dependent determinants is the anatomical capacity of the pelvicalyceal system. Taking into account the modified Takazawa renal pelvicalyceal anatomical classification subtype, the size of the renal pelvis is individually a highly variable parameter. The interquartile range of the cross-sectional area of the renal pelvis in a single pelvis (Type A) spans a wide range, from 41 to 111 mm. Furthermore, in the case of a Type B pelvis, the cross-sectional area of lower bifurcated branches in a divided pelvis constitutes a significantly smaller space (on average, 26 mm) [6]. The volume of fluid in which laser activation takes place is a crucial factor in determining the degree of temperature elevation [7]. From the standpoint of laser thermal interactions, the reduced capacity of the system presents a risk factor for hyperthermia, especially considering the use of high-energy devices in therapy. Among the modifiable factors, one should mention the laser power applied, the duration of its work, the irrigation flow rate, and the baseline temperature of the irrigation fluid.
The objective of this study was to assess the effect of laser settings and ureteral access sheath size on peak maximum temperature and the rate of temperature increase in the system during holmium laser lithotripsy. Utilizing the 3D model allowed for the execution of retrograde intrarenal surgery (RIRS) procedures under nearly identical conditions, employing chemically synthesized stones of comparable size and density. The investigation aimed to analyze the variations in real-time intrapelvic temperature (IPT) generated during RIRS with two different sizes of ureteral access sheaths (UASs) (10/12Fr vs. 12/14Fr), utilizing distinct energy settings produced by the holmium: YAG laser.
2. Materials and Methods
2.1. The 3D-Printed Renal Pelvicalyceal Model and Stone Development
Based on the computed tomography (CT) scans, DICOM files were extracted to generate the model. Morphological transformations were applied using Boolean operations. This was followed by the creation of a “triangle network” mask with specified parameters and density. The pelvicalyceal tract model was produced utilizing the Ultimaker 2+ Connect 3D printer, employing Fused Filament Fabrication (FFF) technology. The printer utilized plasticized thermoplastic polyurethane (TPU) in accordance with patent application WIPO ST 10/C PL442625. Phosphate stones were chemically synthesized from phosphate salts (calcium phosphate), mixed with distilled water and acrylic styrene resin. A hydraulic press was employed at a pressure of 3 MPa, and the roasting temperature in the tube furnace was maintained at 950 °C.
2.2. Intrapelvic-Temperature Measurement
Temperature measurements in the pelvicalyceal system of the model during laser lithotripsy were conducted using an FLIR C5 thermal imaging camera model C51.1 (FLIR Systems AB, Taby, Sweden). Statistical analysis was performed on the maximum temperature readings generated during the RIRS procedure (Figure 1). The camera was positioned 60 cm above the 3D model, and the ambient air temperature and relative humidity of the operating theatre were considered during each camera calibration. The temperature was continuously recorded, with readings at 30 s intervals utilized for analysis. The temperature-measurement recording was initiated at the commencement of each laser lithotripsy session after filling the model with irrigation fluid.
2.3. Study Design
As mentioned before, the study was conducted under nearly identical conditions, utilizing a 3D model and phosphate artificial stones of comparable size deposited in the renal pelvis of the model. The 3D-printed pelvicalyceal system, along with the ureteropelvic junction, was sealed with hot-melt adhesive after placing the stone in the renal pelvis. The volume of the system was 20.5 mL. The average stone size was 471.6 mm3 (the volume was calculated according to the formula of Sorokin et al., A × B × C × 0.524 [8]). The average dimensions of the stones were the following: length 15 mm, width 12 mm, and height 5 mm. The mean stone density in non-contrast computed tomography (NCCT) was 1021 HU (620–1383, SD ± 150). The size of the equipment used in the study was determined in the French system (the French size = diameters in millimeters multiplied by 3). A flexible ureteroscope (Pusen; PU3022A, 9.2Fr diameter with maximum insertion portion width 3.2 mm) was inserted through the 10/12Fr (Flexor; Cook Medical; Bloomington, IN, USA) or 12/14Fr (ReTrace; Coloplast, France) ureteral access sheath, positioned approximately 1 cm below the model ureteropelvic junction. The ureteral access sheath was connected to the model with a rubber connector. Stone fragmentation was achieved using a holmium: YAG laser (Quanta System Cyber Ho 60W; Samarate, Italy) with a 272 mm laser fiber (Quanta System; Samarate, Italy). Constant gravity-based irrigation was maintained at a height of 60 cm above the model. The fluid flow rate for the 10/12Fr and 12/14Fr ureteral access sheath was 9.8 mL/min and 2.7 mL/min, respectively. The operator, with 15 years of experience in endourology, including 8 years in RIRS, controlled the laser power (ranging from 12 to 25 watts), pulse frequency (10 to 15 Hz), and energy (0.8 to 2.5 joules). All procedures were conducted using the virtual basket option. The virtual basket is a specific modulation of laser pulses that produces elongated bubbles that can extend further, thereby forming a connection channel with the stone target. This enhances energy delivery, allowing for the effective and rapid ablation of the stone, while also reducing retropulsion. The median pulse duration was 324.8 μs ± 15.3 μs. Endourological materials, including the flexible ureteroscope, holmium laser fiber, and ureteral access sheath, were recycled and disinfected for study use. Intrapelvic-temperature measurements were recorded after filling the model with fluid shortly before commencing lithotripsy. The baseline intrapelvic temperature in the model after fluid filling ranged from 23.2 °C to 23.4 °C (the temperature of the irrigation fluid was comparable to the ambient temperature).
2.4. Statistical Analysis
The primary objective of this analysis was to assess the influence of both laser power and ureteral access sheath (UAS) size on the variations in temperature. This study was designed to evaluate the effects of these factors under the conditions of gravity irrigation without on-demand manual pumping. The hypotheses aimed to discern the individual contributions of laser power and UAS size to temperature regulation during procedures, thereby providing valuable insights for optimizing operational parameters.
The threshold for statistical significance in this analysis was set at α = 0.05. An application of the Shapiro–Wilk test served to assess the normality of the distribution of variables [9]. The inquiry into the variance of temperature, as influenced by power and UAS factors (hereafter referred to as factors), was undertaken via a factorial design structure of 5 × 2. The aligned rank transform (ART) was utilized for this analysis; this non-parametric technique enables variance analysis without the necessity of assuming equal variances among groups or the normality of residuals [10].
The significant disparities between pairwise factor categories were assessed using post hoc pairwise comparisons, as delineated within the ART framework proposed by Kay et al. [11]. Initially, a meticulous examination of the main effects within each individual factor was conducted, affording a broad understanding of the impact of each factor devoid of potential interaction effects. Subsequently, the scope of the analysis was broadened to include pairwise comparisons amongst combinations of levels across interacting factors, yielding insights into the specific disparities between these combinations. Moreover, supplementary tests were performed to pinpoint differences within the interaction effects, thereby infusing a deeper level of detail into the analysis.
Analyses were conducted using the R statistical language (version 4.1.1; R Core Team, 2021) on Windows 10 pro 64 bit (build 19045), using the packages rio (version 0.5.29), ARTool (version 0.11.1), sjPlot (version 2.8.14), report (version 0.5.7), psych (version 2.1.6; Revelle W, 2021), ggplot2 (version 3.4.0), readxl (version 1.3.1), dplyr (version 1.1.2), and tidyr (version 1.2.0).
The data under investigation comprised temperature levels, scrutinized as a function of UAS size (10/12Fr, 12/14Fr) and laser power (12 W—0.8 J/15 Hz, 15 W—1 J/15 Hz, 18 W—1.2 J/15 Hz, 20 W—2 J/10 Hz, 25 W—2.5 J/10 Hz) over a designated time frame. Measurements were systematically procured at 30 s intervals. At each juncture, an in-depth examination of temperature levels was conducted for every possible combination of UAS size and laser power.
The intricacies of the technical design led to variations in the overall measurement time for the different factor combinations under investigation. Consequently, the total measurement time for each combination fluctuated, spanning a range from 12.5 to 30.5 min (this divergence in measurement time, whilst unavoidable due to the technical constraints, was meticulously accounted for in the analysis to ensure the robustness and validity of the findings). All procedures for each laser setting were repeated three times in this study.
3. Results
3.1. Characteristics of the Sample and Descriptive Statistics of the Studied Variables
The studied sample consisted of 433 measurements, with the duration of recorded time intervals extending from 12.5 to 30.5 min (Figure 2 and Figure 3).
To ensure a standardized sample for the analysis, the measurements were confined to a time range shared universally across all factor combinations. The common time range in this context extended from 0 to 12.5 min. Descriptive statistics illustrating the temperature distribution over this common time range (0–12.5 min) for various permutations of UAS sizes (10/12Fr and 12/14Fr) and laser power settings (12 W, 15 W, 18 W, 20 W, and 25 W) are presented in Table 1.
Our analysis of the data presented in Table 1 revealed a consistent trend of rising mean temperature and increased temperature variability with escalating power settings for both UAS sizes. As for the variability in temperature, represented by the standard deviation, there was a general tendency for it to proliferate with the power setting. This pattern indicated that higher power settings engendered more irregular temperature outcomes, which could potentially precipitate unpredictable procedural results.
The Shapiro–Wilk test demonstrated that, for most combinations of UAS sizes and power settings, the temperature distributions deviated from normality. This deviation has significant implications for statistical testing and may indicate that factors or conditions influencing the temperature, which were not encapsulated by the UAS size and power setting, were at play.
3.2. Results of Analysis of Variance and Contrast Analyses
The analysis of variance scrutinized the impact of two independent variables—the power setting (in watts) and the urethral access sheath (UAS) size—and their interaction with temperature during RIRS using gravity irrigation only, with the results reported in Table 2.
Based on the results in Table 2, it was concluded that the laser’s power setting emerged as a substantial determinant of temperature in the time range studied. This was evidenced by a highly significant F-value of 20.12 and a p < 0.001, which is far below the conventional alpha level. The partial eta squared (η2p) value of 0.24 denoted a medium effect size, suggesting that approximately 24% of the variance in temperature was attributable to the differences in the power settings. The UAS size also exerted a significant influence on temperature, as indicated by an F = 7.39 and a p = 0.007. However, the partial eta squared (η2p) value of 0.03 indicated a small effect size, signifying that about 3% of the variance in temperature can be explained by differences in the UAS size. This finding, albeit statistically significant, showed that the UAS size, as an independent variable, has a comparatively lesser impact on temperature than the power setting.
Table 3 presents the results from a contrast analysis evaluating the differences in temperature across various laser power settings for all UAS sizes. This analysis provides insights into the specific pairwise differences between distinct power settings.
The results of the analysis in Table 3 have elucidated the significant influence of different laser power settings on temperature across all UAS sizes. In the lower power spectrum, between 12 W and 15 W, our data did not show a statistically significant temperature difference. This implied that minor power increments within this range likely did not exert a strong thermal influence. Conversely, amplifying power settings from 12 W or 15 W to 18 W, 20 W, or 25 W resulted in robust and statistically significant temperature rises. Importantly, these rises were not just statistically salient, but also bore practical significance, as evidenced by medium to large effect sizes. Interestingly, the temperature differential between 20 W and 25 W was not statistically significant. This may suggest that beyond a certain power threshold, further increments do not markedly impact the temperature. This could be attributed to the aforementioned reasons or other unaccounted factors in this analysis.
Table 4 presents a contrast analysis, comparing the UAS-size factor across all laser power settings.
The positive contrast estimate of 25.32 with a standard error (SE) of 9.32 implied that the 10/12Fr UAS size was associated with higher temperatures compared to the 12/14Fr UAS size, across all laser power settings. The effect size (Cohen’s d) of 0.34, while lower than the large effect sizes observed in the previous analyses, still represents a small effect according to Cohen’s conventions. While the effect size was smaller compared to the impact of laser power, it was still a clinically relevant finding. This was because even small to medium effect sizes can have meaningful implications in a clinical setting, especially when considering factors like kidney tissue safety, and the risk of complications related to its thermal damage.
4. Discussion
Procedures of retrograde intrarenal surgery using a flexible ureterorenoscope and laser fiber constitute one of the most frequently performed procedures in endourology. A contemporary technological challenge in the treatment of kidney stones is the intraoperative real-time monitoring of pressure and temperature in the pelvicalyceal system during RIRS. Of the two mentioned physical parameters that are essential factors determining patient safety, IPP (intrarenal pelvic pressure) is significantly better understood and studied. We have research results both in vivo and in vitro, unequivocally indicating the need for intrapelvic pressure monitoring during laser lithotripsy. A breakthrough in endourology equipment comes in the form of the LithoVue Elite ureteroscope from Boston Scientific Corp. (Marlborough, MA, USA). This pioneering flexible ureterorenoscope is the first of its kind, equipped with the capability for the ongoing intraoperative monitoring of intrarenal pressure (IPP) during retrograde intrarenal surgery (RIRS) [12].
Monitoring intraoperative temperature still remains a terra incognita in everyday practice and constitutes a much less explored issue. Furthermore, understanding the changes in physical parameters occurring during laser lithotripsy in the kidney is a crucial element in ensuring the safety of this procedure for the patient. The thermal cytotoxic effect is influenced not only by the peak maximum temperature achieved during a procedure, but also by the duration of exposure.
During laser activation in the system, energy is absorbed by water, leading to a temperature increase. In a theoretical model of a completely closed and isolated system, this would result in an unlimited temperature rise. However, in a partially open and non-isolated system like the kidney, the temperature increase due to laser-energy absorption is offset by the heat outflow with the irrigation fluid and by the energy transfer through the pelvicalyceal system wall. The higher the temperature in the system, the greater the heat outflow becomes (a larger amount of energy per unit volume flowing out of the system), leading to a point where the generated energy equals the outflowing energy, and the temperature level stabilizes. The equilibrium temperature reached in such a system depends both on the laser power used and the flow rate. Taking into account the results of the analysis of variance in our experiment, both analyzed parameters, UAS size and the laser setting, are statistically significant factors affecting the temperature profile during the RIRS procedure. However, treating the examined parameters as independent variables, it has been demonstrated that the laser setting, as an independent variable, has a comparatively greater impact on the temperature than the UAS size.
Thermal damage is measured in experimental studies by crossing a thermal dose threshold. Sapareto and Dewey developed an equation to assess the thermal dose calculated as an exposure time at a reference temperature of 43 °C. This equation is also known as cumulative equivalent minutes at 43 °C (CEM43). CEM43 above 70 min resulted in acute and significant damage (up to and including coagulative necrosis), while acute and minor damage was also observed at CEM43 below 20 min [13]. The temperature generated in the pelvicalyceal system during lithotripsy is the result of several factors, among which the laser power and the irrigation flow play a pivotal role.
Increases in intrarenal temperature may potentially result in irreversible cellular damage. Additionally, such temperature increments may adversely affect the genetic expression and composition of cells, ultimately progressing to urothelial cellular death [14]. Hyperthermia induces numerous cellular changes and disrupts cellular homeostasis. An overriding event in this process is the denaturation and aggregation of proteins, resulting in cell-cycle arrest, protein-synthesis inhibition, and impeding DNA-repair mechanisms [15].
Up to now, published results of experimental studies on animals and in vitro models have focused on the impact of various laser powers settings and the type of irrigation system used on changes in IPT. The use of a ureteral access sheath may offer benefits by facilitating irrigation fluid outflow, thus lowering intrapelvic pressure and decreasing intrarenal fluid temperature [16]. But the issue of how the size of the UAS affects temperature remains a considerably less explored topic.
Wollin et al. evaluated the effect of laser settings and irrigation flow on temperature in an in vitro setting. Based on an experimental study in the absence of continuous saline irrigation, all settings ranging up to 20 W total power exceeded the upper thermal damage threshold, reaching a maximum temperature over 100 °C when a power of 20 W was applied. A safe temperature profile was observed when a 100 mL/min irrigation flow rate was employed. However, when reduced to 50 mL/min, a temperature measurement of 40 °C was only detected at a 20 W total power setting [17]. In another study, Butticè et al. assessed the change in IPT using a bench model by employing various Holmium-YAG laser settings and two sizes of laser fibers (200 and 272 μm). When irrigation was shut off, the model exceeded 45 °C (the maximum temperature limit of the study), irrespective of tank temperature and laser settings, for both fibers. With the 272 μm laser fiber, this limit was reached as early as the 30th second. Conversely, when irrigation was open, the authors did not surpass the maximum temperature limit, regardless of tank temperature and laser setting [18]. Both quoted studies were conducted under in vitro conditions; however, the temperature assessment was carried out after laser activation, without an actual lithotripsy of the stone. A similar ex vivo experiment (using a glass test tube) was conducted by Aldoukhi et al. The authors investigated changes in fluid temperature during holmium laser activation, employing settings with a power output up to 40 watts and various irrigation flow rates. Temperature showed an upward trend with the rise in laser power output and the decline in irrigation flow rate. The highest temperature recorded, 70.3 °C, occurred with a laser setting of 40 Watts (1.0 J × 40 Hz) and no irrigation after 60 s of continuous laser firing [19].
We conducted our study using 3D models printed from plasticized thermoplastic polyurethane, incorporating chemically synthesized stones. This allowed us to monitor real-time temperature changes during laser lithotripsy. Naturally, the obtained results do not allow for a direct translation to in vivo conditions, but they underscore exceptionally significant changes in the physical conditions within the pelvicalyceal system. This translates into safety considerations for conducting the procedure on a patient.
Based on the outcomes of our experiment, conducted exclusively under gravity irrigation, without the use of any additional pump irrigation, the maximum temperatures recorded during lithotripsy ranged from 40.3 °C to 50.9 °C for UAS 10/12Fr. When applying a wider UAS (12/14Fr), the range of maximum temperatures varied from 36.2 °C to 44.5 °C, contingent upon the specific laser settings. These results unequivocally indicated a significant correlation between the flow rate and the resultant maximum temperature. This phenomenon can be elucidated by the observation that the fluid flow facilitated by the 12/14Fr UAS exhibited a magnitude three and a half times superior to that of the 10/12Fr UAS. Moreover, this disparity in flow rates is contextualized by the comparatively modest twofold variance observed between the maximum and minimum laser power settings employed within the experimental framework. In the lower power spectrum, ranging from 12 W to 15 W, our data revealed no statistically significant temperature difference. However, escalating power settings from 12 W or 15 W to 18 W, 20 W, or 25 W led to substantial and statistically significant increases in temperature. Similar results were demonstrated in a study conducted on a live porcine model by Noureldin et al. [20]. Using only gravity irrigation during flexible ureteroscopy without a UAS resulted in an elevation of IPT values to hazardous levels, even at the study’s lowest laser power of 20 W. At the 20 W power setting, the incorporation of a UAS demonstrated an enhancement in temperature evolution, ensuring that safe IPT values were consistently maintained throughout the entire process. However, the positive impact of a UAS on IPT became nullified when the laser power was set to 40 W or higher, irrespective of the UAS size. Specifically, with the utilization of UAS 12/14, the maximum recorded IPT reached 63.4 °C at 40 W and 74.5 °C at 60 W [20]. The significant increase in temperature in the fluid during laser lithotripsy has also been confirmed in a single in vivo study on humans so far. During flexible ureteroscopy, the Ho:YAG laser lithotripsy in the group with the highest temperature increase after 60 s of laser activation was the one with settings at 1 J/20 Hz and an irrigation flow rate of 15 mL/min, while the lowest increase was observed in the group with settings at 0.5 J/20 Hz and an irrigation flow rate of 30 mL/min. When keeping the laser power setting constant, the temperature rise was significantly higher in groups with a lower irrigation flow rate. Similarly, with the same irrigation flow rate, the temperature rise was significantly higher in groups with a higher laser power setting [21]. In our study, when examining the temperature-escalation rate, it was noted that the rate of temperature increase during the initial minutes of laser activity was similar for both flow rates. A potential explanation for the minimal impact of flow rate on the rate of temperature increase at the initial stage of the procedures could be the uneven propagation of heat and the influx of the cooling fluid, which might flow through the shortest path from the end of the ureteroscope to the ureter, not significantly mixing with the heated fluid residing deeper within the system.
Æsøy et al. proposed very interesting conclusions when presenting the results of their study assessing temperature profiles in porcine kidneys. They evaluated the temperature of the irrigating fluid within the system as well as the temperature of the kidney parenchyma. The authors reported that there was no significant increase in parenchymal temperatures from baseline for any of the laser settings when the 150 µm fiber was used. In contrast, significant increases in parenchymal temperatures were recorded with the 200 µm fiber or larger [22].
We acknowledge that our study possesses a few noteworthy limitations. Firstly, it is important to note that, despite the similarities in dynamics with real-time situations, this study is conducted in vitro, and the 3D-printed model used lacks the physiological properties inherent in a real kidney. Factors such as the kidney’s natural vascularity, variations in blood-flow rates, ongoing urine production, and the expandability facilitated by the elasticity of kidney tissue differ significantly from those observed in an artificial model, and these distinctions may contribute to temperature fluctuations. Secondly, within the kidney, during RIRS, because of generating high intrapelvic pressure, the continuous backflow of the irrigation solution into the venosinusoidal system could also impact temperature dynamics. Another limitation of this study compared to real-world conditions was the use of a solely gravity-based irrigation system (without additional manual pumping). The experiment aimed to verify the hypothesis that the generated temperature during RIRS, using only gravity irrigation, might pose a dangerous risk of temperature rise, leading to potential damage. Research involving manual pump irrigation will constitute the next step of our experiment.
5. Conclusions
While this study is conducted in vitro, it effectively illustrates the temperature changes within the 3D-printed model designed to simulate real-time RIRS conditions. The consistency in thermodynamic properties with in vivo scenarios and the diverse range of situations simulated for the experiment contribute to the provision of valuable information. In summary, the key factor determining the dynamics of temperature increase during the RIRS procedure is primarily the applied power of the holmium: YAG laser. The second analyzed determinant, the size of the UAS, also constitutes a significant element, whereas, considering the temperature escalation profile during the first minutes of the experiment, the rate of temperature increase was solely dependent on laser power, not on the flow rate. During prolonged lithotripsy, the maximum temperature value depends on both parameters. Temperatures of 40 °C were only not exceeded with high flow rates (12/14Fr AUS) and power below 20 W.
Author Contributions
Conceptualization, K.B.; Methodology, K.B.; Resources, B.D.; Writing—original draft, K.B. and B.D.; Supervision, B.D. All authors have read and agreed to the published version of the manuscript.
Funding
This research received no external funding.
Data Availability Statement
All the data are available within the study.
Acknowledgments
We are very grateful to Mariusz Oleksy from the Department of Polymer Composites, Rzeszow University of Technology, for the invaluable support in the field of modeling and 3D printing.
Conflicts of Interest
The authors declare no conflicts of interest.
References
- Noureldin, Y.A.; Kallidonis, P.; Liatsikos, E.N. Lasers for stone treatment: How safe are they? Curr. Opin. Urol. 2020, 30, 130–134. [Google Scholar] [CrossRef] [PubMed]
- Chua, M.E.; Bobrowski, A.; Ahmad, I.; Kim, J.K.; Silangcruz, J.M.; Rickard, M.; Lorenzo, A.; Lee, J.Y. Thulium fibre laser vs holmium: Yttrium-aluminium-garnet laser lithotripsy for urolithiasis: Meta-analysis of clinical studies. BJU Int. 2023, 131, 383–394. [Google Scholar] [CrossRef] [PubMed]
- Lopes, A.C.; Dall’Aqua, V.; Carrera, R.V.; Molina, W.R.; Glina, S. Intra-renal pressure and temperature during ureteroscopy: Does it matter? Int. Braz. J. Urol. 2021, 47, 436–442. [Google Scholar] [CrossRef] [PubMed]
- He, X.; McGee, S.; Coad, J.E.; Schmidlin, F.; Iaizzo, P.A.; Swanlund, D.J.; Kluge, S.; Rudie, E.; Bischof, J.C. Investigation of the thermal and tissue injury behaviour in microwave thermal therapy using a porcine kidney model. Int. J. Hyperth. 2004, 20, 567–593. [Google Scholar] [CrossRef]
- van Rhoon, G.C.; Samaras, T.; Yarmolenko, P.S.; Dewhirst, M.W.; Neufeld, E.; Kuster, N. CEM43°C thermal dose thresholds: A potential guide for magnetic resonance radiofrequency exposure levels? Eur. Radiol. 2013, 23, 2215–2227. [Google Scholar] [CrossRef] [PubMed]
- Zhu, W.; Zheng, M.; Xiong, S.; Han, G.; Meng, C.; Li, Z.; Zhang, L.; Xiong, G.; Guan, H.; Huang, Y.; et al. Modified Takazawa anatomical classification of renal pelvicalyceal system based on three-dimensional virtual reconstruction models. Transl. Androl. Urol. 2021, 10, 2944–2952. [Google Scholar] [CrossRef] [PubMed]
- Rezakahn Khajeh, N.; Hall, T.L.; Ghani, K.R.; Roberts, W.W. Pelvicaliceal Volume and Fluid Temperature Elevation during Laser Lithotripsy. J. Endourol. 2022, 36, 22–28. [Google Scholar] [CrossRef]
- Sorokin, I.; Cardona-Grau, D.K.; Rehfuss, A.; Birney, A.; Stavrakis, C.; Leinwand, G.; Herr, A.; Feustel, P.J.; White, M.D. Stone volume is best predictor of operative time required in retrograde intrarenal surgery for renal calculi: Implications for surgical planning and quality improvement. Urolithiasis 2016, 44, 545–550. [Google Scholar] [CrossRef]
- Vetter, T.R. Fundamentals of Research Data and Variables: The Devil Is in the Details. Anesth. Analg. 2017, 125, 1375–1380. [Google Scholar] [CrossRef] [PubMed]
- Wobbrock, F.L.J.O.; Gergle, D.; Higgins, J.J. The Aligned Rank Transform for nonparametric factorial analyses using only ANOVA procedures. In Proceedings of the CHI 2011—29th Annual CHI Conference on Human Factors in Computing Systems, Conference Proceedings and Extended Abstracts, Vancouver, BC, Canada, 7–12 May 2011; Association for Computing Machinery: New York, NY, USA, 2011; pp. 143–146. [Google Scholar]
- Kay, E.L.M.; Higgins, J.; Wobbrock, J. ARTool: Aligned Rank Transform for Nonparametric Factorial ANOVAs, R package version 0.11.1; GitHub: San Francisco, CA, USA, 2021. [Google Scholar] [CrossRef]
- Bhojani, N.; Koo, K.C.; Bensaadi, K.; Halawani, A.; Wong, V.K.; Chew, B.H. Retrospective first-in-human use of the LithoVue™ Elite ureteroscope to measure intrarenal pressure. BJU Int. 2023, 104, 11–17. [Google Scholar] [CrossRef]
- Yarmolenko, P.S.; Moon, E.J.; Landon, C.; Manzoor, A.; Hochman, D.W.; Viglianti, B.L.; Dewhirst, M.W. Thresholds for thermal damage to normal tissues: An update. Int. J. Hyperthermia 2011, 27, 320–343. [Google Scholar] [CrossRef] [PubMed]
- Kampinga, H.H. Thermotolerance in mammalian cells. Protein denaturation and aggregation, and stress proteins. J. Cell Sci. 1993, 104 Pt 1, 11–17. [Google Scholar] [CrossRef]
- Bettaieb, A.; Averill-Bates, D.A. Thermotolerance induced at a mild temperature of 40°C alleviates heat shock-induced ER stress and apoptosis in HeLa cells. Biochim. Biophys. Acta 2015, 1853, 52–62. [Google Scholar] [CrossRef] [PubMed]
- Tonyali, S.; von Bargen, M.F.; Ozkan, A.; Gratzke, C.; Miernik, A. The heat is on: The impact of excessive temperature increments on complications of laser treatment for ureteral and renal stones. World J. Urol. 2023, 41, 3853–3865. [Google Scholar] [CrossRef] [PubMed]
- Wollin, D.A.; Carlos, E.C.; Tom, W.R.; Simmons, W.N.; Preminger, G.M.; Lipkin, M.E. Effect of Laser Settings and Irrigation Rates on Ureteral Temperature during Holmium Laser Lithotripsy, an In Vitro Model. J. Endourol. 2018, 32, 59–63. [Google Scholar] [CrossRef] [PubMed]
- Butticè, S.; Sener, T.E.; Proietti, S.; Dragos, L.; Tefik, T.; Doizi, S.; Traxer, O. Temperature Changes Inside the Kidney: What Happens during Holmium:Yttrium-Aluminium-Garnet Laser Usage? J. Endourol. 2016, 30, 574–579. [Google Scholar] [CrossRef] [PubMed]
- Aldoukhi, A.H.; Ghani, K.R.; Hall, T.L.; Roberts, W.W. Thermal Response to High-Power Holmium Laser Lithotripsy. J. Endourol. 2017, 31, 1308–1312. [Google Scholar] [CrossRef] [PubMed]
- Noureldin, Y.A.; Farsari, E.; Ntasiotis, P.; Adamou, C.; Vagionis, A.; Vrettos, T.; Liatsikos, E.N.; Kallidonis, P. Effects of irrigation parameters and access sheath size on the intra-renal temperature during flexible ureteroscopy with a high-power laser. World J. Urol. 2021, 39, 1257–1262. [Google Scholar] [CrossRef] [PubMed]
- Teng, J.; Wang, Y.; Jia, Z.; Guan, Y.; Fei, W.; Ai, X. Temperature profiles of calyceal irrigation fluids during flexible ureteroscopic Ho:YAG laser lithotripsy. Int. Urol. Nephrol. 2021, 53, 415–419. [Google Scholar] [CrossRef]
- Æsøy, M.S.; Juliebø-Jones, P.; Beisland, C.; Ulvik, Ø. Temperature profiles during ureteroscopy with thulium fiber laser and holmium:YAG laser: Findings from a pre-clinical study. Scand. J. Urol. 2022, 56, 313–319. [Google Scholar] [CrossRef] [PubMed]
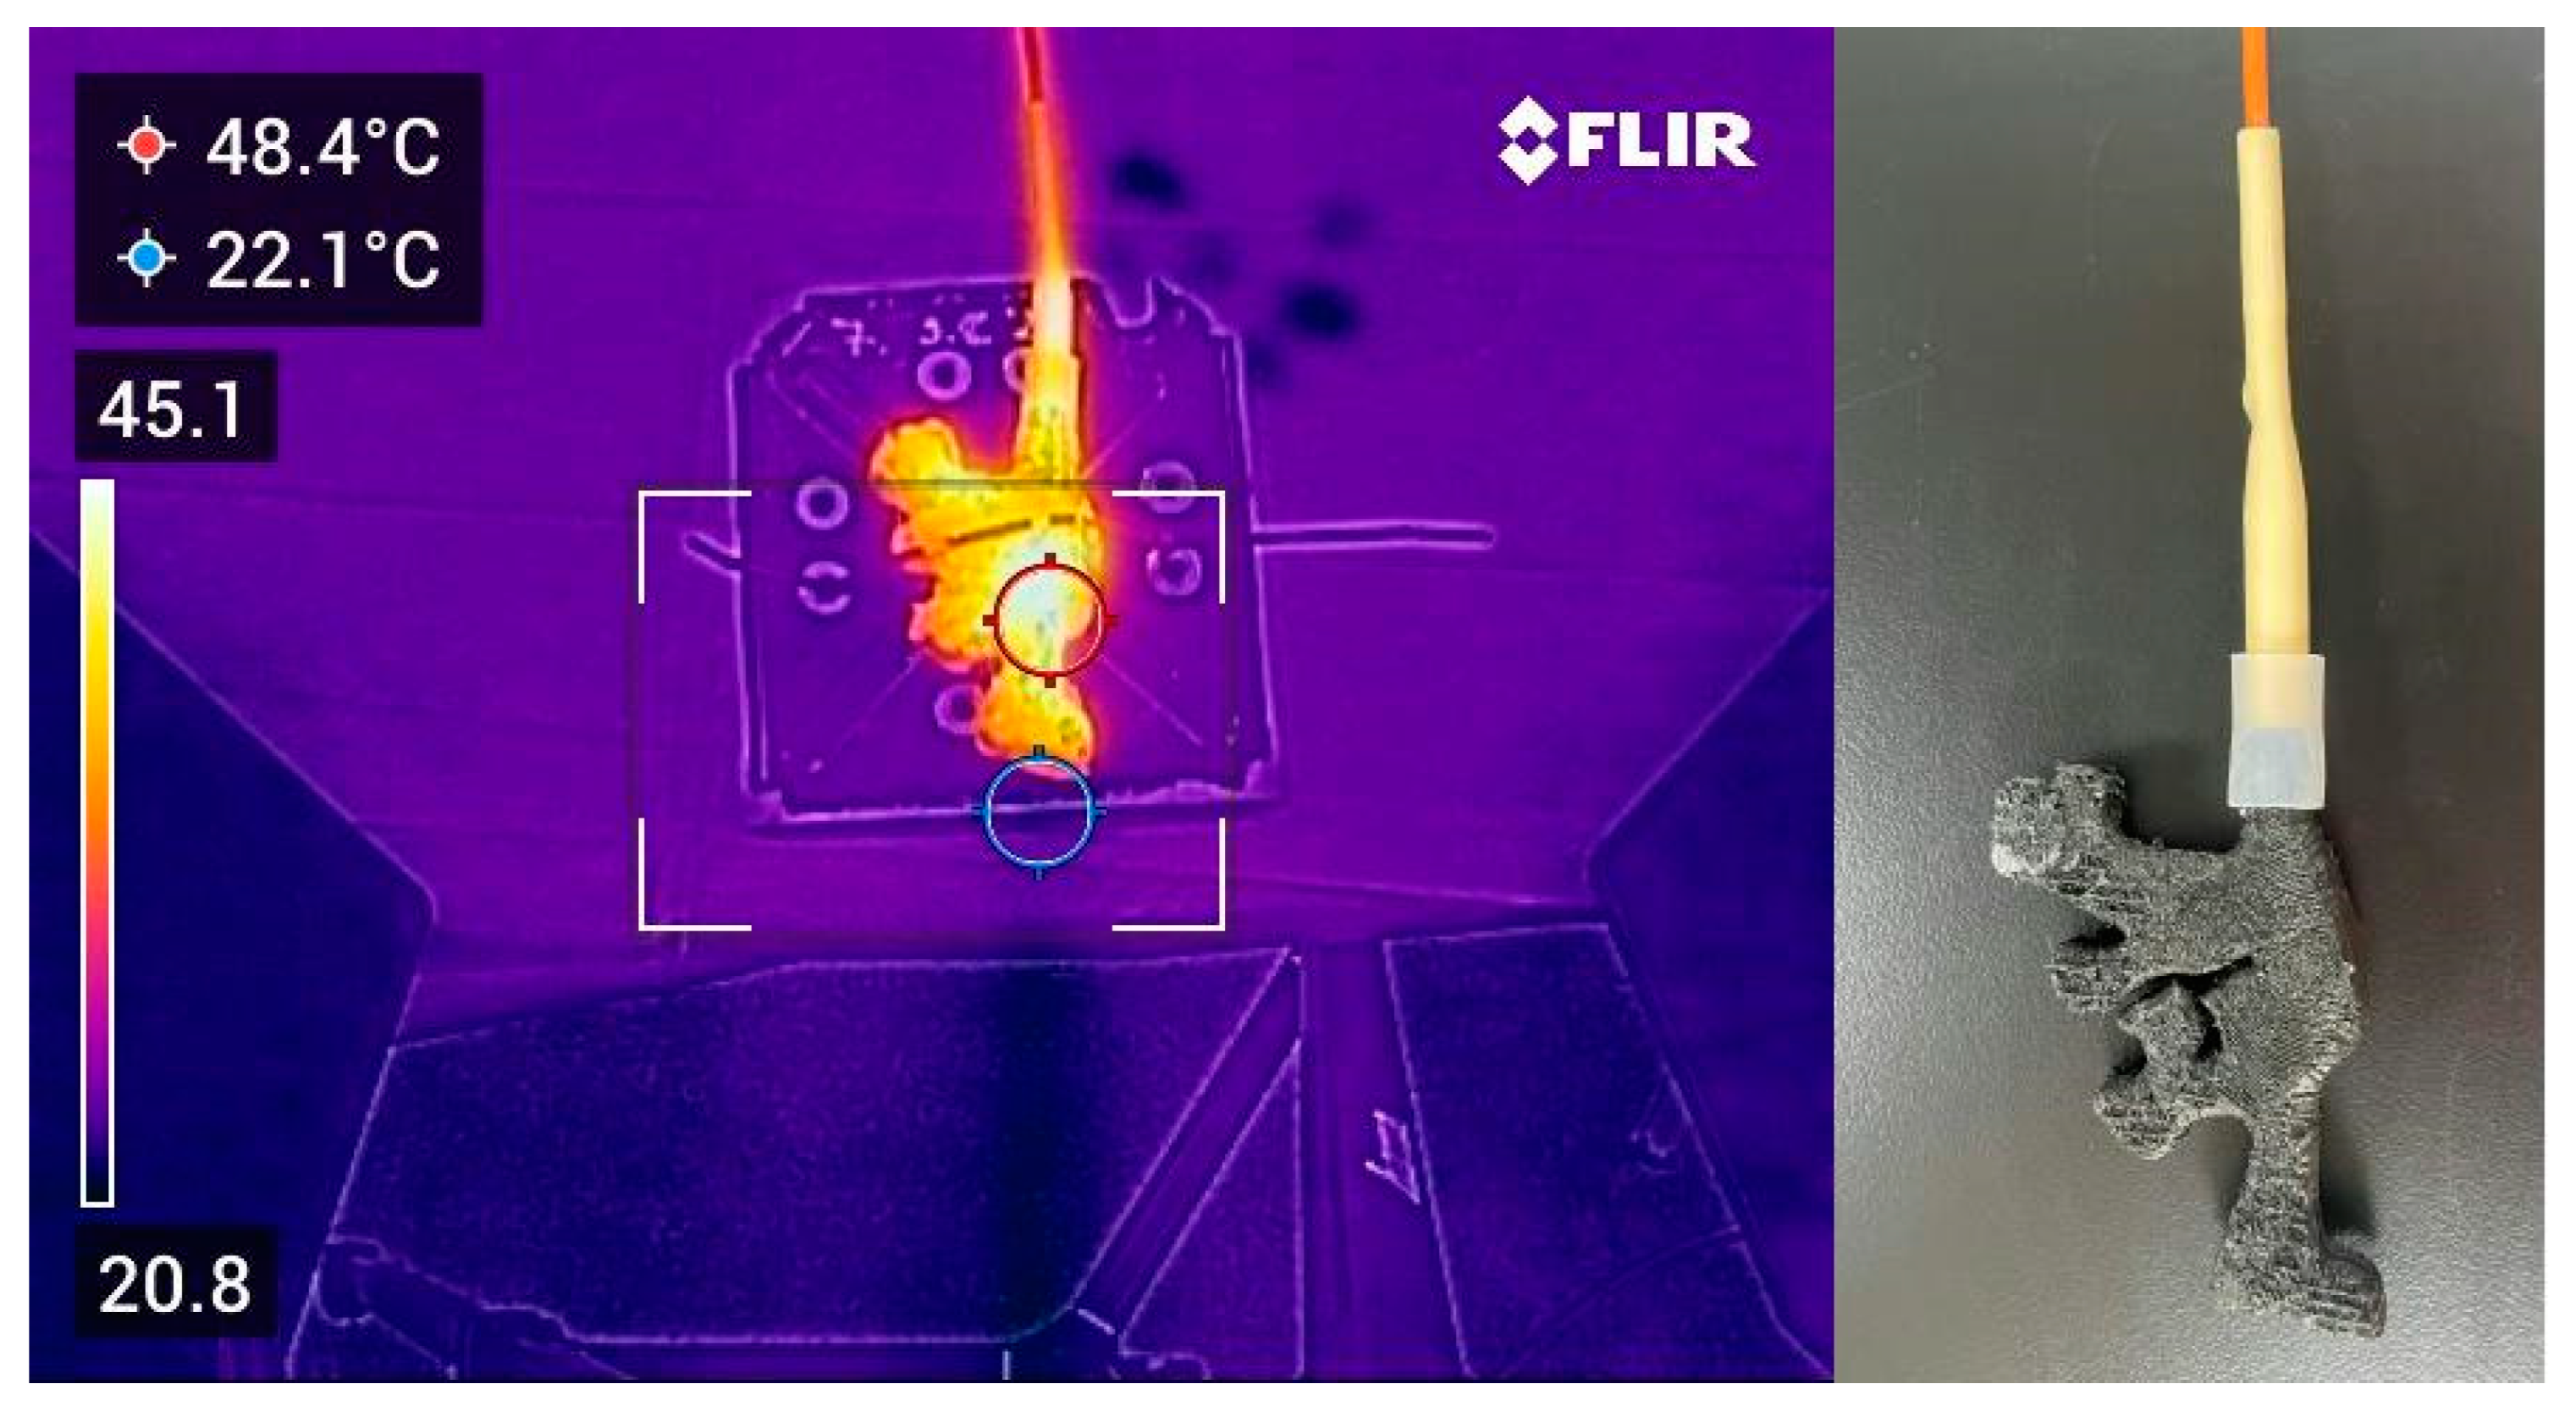
Figure 1.
Temperature readings from an FLIR C5 thermal imaging camera during the laser lithotripsy procedure (left photo) and the image of the 3D model used in the study (right photo). The area within the red circle indicates the highest temperature.
Figure 1.
Temperature readings from an FLIR C5 thermal imaging camera during the laser lithotripsy procedure (left photo) and the image of the 3D model used in the study (right photo). The area within the red circle indicates the highest temperature.

Figure 2.
Temporal distribution of temperature for different UAS sizes (utilizing only gravity irrigation), segregated by respective laser power levels. UAS—ureteral access sheath.
Figure 2.
Temporal distribution of temperature for different UAS sizes (utilizing only gravity irrigation), segregated by respective laser power levels. UAS—ureteral access sheath.

Figure 3.
Temporal distribution of temperature for different laser power levels categorized by UAS size (with gravity irrigation only). UAS—ureteral access sheath.
Figure 3.
Temporal distribution of temperature for different laser power levels categorized by UAS size (with gravity irrigation only). UAS—ureteral access sheath.


Table 1.
Descriptive statistics for temperature distribution over a common time range for UASs and power groups, n = 30. UAS—ureteral access sheath, Skew.—skewness; Kurt.—kurtosis; W—statistics of the Shapiro–Wilk test.
Table 1.
Descriptive statistics for temperature distribution over a common time range for UASs and power groups, n = 30. UAS—ureteral access sheath, Skew.—skewness; Kurt.—kurtosis; W—statistics of the Shapiro–Wilk test.
| UAS | Power | Mean | SD | Mdn | Q1 | Q3 | Min | Max | Skew. | Kurt. | W | p |
|---|---|---|---|---|---|---|---|---|---|---|---|---|
| 10/12Fr | 12 | 32.06 | 5.57 | 32.85 | 27.70 | 36.17 | 22.90 | 40.30 | −0.26 | −1.27 | 0.94 | 0.117 |
| 15 | 32.07 | 5.81 | 32.25 | 27.10 | 36.27 | 23.00 | 40.90 | −0.06 | −1.34 | 0.94 | 0.160 | |
| 18 | 36.52 | 6.02 | 39.65 | 33.65 | 40.90 | 23.20 | 41.50 | −1.01 | −0.47 | 0.79 | <0.001 | |
| 20 | 38.61 | 8.50 | 42.75 | 31.62 | 45.20 | 23.30 | 49.70 | −0.55 | −1.28 | 0.87 | 0.004 | |
| 25 | 41.66 | 10.09 | 46.45 | 32.23 | 50.40 | 23.30 | 50.90 | −0.56 | −1.40 | 0.81 | <0.001 | |
| 12/14Fr | 12 | 31.92 | 3.82 | 33.40 | 30.58 | 34.30 | 23.20 | 36.20 | −1.03 | 0.01 | 0.86 | 0.003 |
| 15 | 32.37 | 3.99 | 32.60 | 30.55 | 35.03 | 23.20 | 38.10 | −0.67 | −0.27 | 0.94 | 0.140 | |
| 18 | 34.32 | 4.60 | 35.95 | 32.12 | 37.62 | 23.10 | 39.20 | −1.04 | −0.11 | 0.86 | 0.002 | |
| 20 | 37.77 | 6.45 | 40.70 | 35.67 | 42.48 | 23.40 | 43.40 | −1.11 | −0.12 | 0.80 | <0.001 | |
| 25 | 38.98 | 5.17 | 40.50 | 38.55 | 41.80 | 23.80 | 44.50 | −1.61 | 1.90 | 0.80 | <0.001 |
Table 2.
Results of analysis of variance of aligned rank transformed data (Type III tests) without repeated methods. df—degrees of freedom; df.res—residual degree of freedom; F—statistics of F-test; η2p—partial eta squared effect size.
Table 2.
Results of analysis of variance of aligned rank transformed data (Type III tests) without repeated methods. df—degrees of freedom; df.res—residual degree of freedom; F—statistics of F-test; η2p—partial eta squared effect size.
| Variable | df | df.res | F | p | η2p |
|---|---|---|---|---|---|
| power, W | 4 | 250 | 20.12 | <0.001 | 0.24 |
| UAS, size | 1 | 250 | 7.39 | 0.007 | 0.03 |
Table 3.
Contrast analysis of temperature differences within laser power factors for all UASs. SE—the standard error; df—degrees of freedom; t—the t Student test statistic; d—the Cohen’s d effect size.
Table 3.
Contrast analysis of temperature differences within laser power factors for all UASs. SE—the standard error; df—degrees of freedom; t—the t Student test statistic; d—the Cohen’s d effect size.
| Contrast | Estimate | SE | df | t | p | d |
|---|---|---|---|---|---|---|
| 12 W–15 W | −3.48 | 13.04 | 250 | −0.27 | 0.999 | 0.05 |
| 12 W–18 W | −42.15 | 13.04 | 250 | −3.23 | 0.012 | 0.63 |
| 12 W–20 W | −74.77 | 13.04 | 250 | −5.74 | <0.001 | 1.12 |
| 12 W–25 W | −92.19 | 13.04 | 250 | −7.07 | <0.001 | 1.39 |
| 15 W–18 W | −38.67 | 13.04 | 250 | −2.97 | 0.027 | 0.58 |
| 15 W–20 W | −71.29 | 13.04 | 250 | −5.47 | <0.001 | 1.07 |
| 15 W–25 W | −88.71 | 13.04 | 250 | −6.81 | <0.001 | 1.33 |
| 18 W–20 W | −32.62 | 13.04 | 250 | −2.50 | 0.093 | 0.49 |
| 18 W–25 W | −50.04 | 13.04 | 250 | −3.84 | 0.001 | 0.75 |
| 20 W–25 W | −17.42 | 13.04 | 250 | −1.34 | 0.669 | 0.26 |
Table 4.
Contrast analysis of the UAS factor for all lasers’ power. SE—the standard error; df—degrees of freedom; t—the t Student test statistic; d—the Cohen’s d effect size.
Table 4.
Contrast analysis of the UAS factor for all lasers’ power. SE—the standard error; df—degrees of freedom; t—the t Student test statistic; d—the Cohen’s d effect size.
| Contrast | Estimate | SE | df | t | p | d |
|---|---|---|---|---|---|---|
| 10/12Fr–12/14Fr | 25.32 | 9.32 | 250 | 2.72 | 0.007 | 0.34 |
Disclaimer/Publisher’s Note: The statements, opinions and data contained in all publications are solely those of the individual author(s) and contributor(s) and not of MDPI and/or the editor(s). MDPI and/or the editor(s) disclaim responsibility for any injury to people or property resulting from any ideas, methods, instructions or products referred to in the content. |
© 2024 by the authors. Licensee MDPI, Basel, Switzerland. This article is an open access article distributed under the terms and conditions of the Creative Commons Attribution (CC BY) license (https://creativecommons.org/licenses/by/4.0/).
Share and Cite
MDPI and ACS Style
Balawender, K.; Dybowski, B. The Effect of Laser Settings and Ureteral Access Sheath Size on Intrapelvic Temperature during Holmium Laser Lithotripsy. Appl. Sci. 2024, 14, 3501. https://doi.org/10.3390/app14083501
AMA Style
Balawender K, Dybowski B. The Effect of Laser Settings and Ureteral Access Sheath Size on Intrapelvic Temperature during Holmium Laser Lithotripsy. Applied Sciences. 2024; 14(8):3501. https://doi.org/10.3390/app14083501
Chicago/Turabian StyleBalawender, Krzysztof, and Bartosz Dybowski. 2024. "The Effect of Laser Settings and Ureteral Access Sheath Size on Intrapelvic Temperature during Holmium Laser Lithotripsy" Applied Sciences 14, no. 8: 3501. https://doi.org/10.3390/app14083501
Note that from the first issue of 2016, this journal uses article numbers instead of page numbers. See further details here.