Article

Encapsulation of Fennel Essential Oil in Calcium Alginate Microbeads via Electrostatic Extrusion

Faculty of Food Technology and Biotechnology, University of Zagreb, Pierottijeva 6, 10 000 Zagreb, Croatia
*
Author to whom correspondence should be addressed.
Appl. Sci. 2024, 14(8), 3522; https://doi.org/10.3390/app14083522
Submission received: 26 March 2024 / Revised: 12 April 2024 / Accepted: 19 April 2024 / Published: 22 April 2024
(This article belongs to the Special Issue Natural Products and Bioactive Compounds)

Abstract

:
Fennel essential oil (EO) is well known for its biological activities and wide potential for use in the food, cosmetic, and pharmaceutical industries, where the main challenge is to achieve higher stability of EO. This study aimed to evaluate the potential of electrostatic extrusion for encapsulation of fennel EO by examining the effects of alginate (1%, 1.5%, and 2%) and whey protein (0%, 0.75%, and 1.5%) concentrations and drying methods on the encapsulation efficiency, loading capacity, bead characteristics, and swelling behavior of the produced fennel EO microbeads. Results revealed that electrostatic extrusion proved to be effective for encapsulating fennel EO, with whey protein addition enhancing the examined characteristics of the obtained microbeads. Freeze-drying exhibited superior performance compared to air-drying. Optimal encapsulation efficiency (51.95%) and loading capacity (78.28%) were achieved by using 1.5% alginate and 0.75% whey protein, followed by freeze-drying. GC-MS analysis revealed no differences in the qualitative aspect of the encapsulated and initial EO, with the encapsulated EO retaining 58.95% of volatile compounds. This study highlighted the potential of electrostatic extrusion using alginate and whey protein as a promising technique for fennel EO encapsulation while also emphasizing the need for further exploration into varied carrier materials and process parameters to optimize the encapsulation process and enhance product quality.

1. Introduction

Fennel (Foeniculum vulgare Mill.) is a perennial herbaceous plant from the Apiaceae family that originates from the Southern Mediterranean but has spread globally via cultivation. Known for its medicinal and aromatic qualities, fennel has been utilized since ancient times. Fennel seeds contain up to 5% essential oil (EO) characterized by distinctive sensory properties and anise-like flavor due to the presence of anethole, the main representative of volatile compounds [1]. For this reason, fennel EO is used as a flavoring agent in the food industry but also in cosmetic and pharmaceutical industries due to its numerous biological activities such as anti-inflammatory, antimicrobial, hepatoprotective, and antiallergic [2,3]. Since EOs are highly sensitive to external factors such as light, oxygen, temperature, and moisture due to their volatile composition, it is of great importance to extend their shelf life and maintain their quality for as long as possible [4,5]. Apart from the usual procedures, which include using dark-colored sealed glass bottles and storing them in a cool environment protected from direct light, other approaches, such as encapsulation by various techniques, can be applied. Electrostatic extrusion is one of the most recent techniques used for encapsulation of EOs with the main advantage of operating at ambient temperature, thus allowing for the preservation of thermosensitive compounds present in the EO, as well as the adaptability in terms of microbead size and storage stability, low energy consumption, and reduced costs [6]. A significant drawback is its limited scale-up potential, hindering industrial use; however, researchers proposed modifying the structural setup by employing a multi-needle arrangement for the encapsulation of bioactive compounds to overcome this issue [7]. The principle of this technique is based on the use of electrostatic forces to disrupt the liquid biopolymer filament at the tip of a nozzle and to form a charged stream of small droplets into a gelling bath, resulting in a microbead with EO encapsulated within a gel matrix [8]. The choice of wall material in this technique is limited to the use of gums (xanthan and gellan), which may be chosen due to their emulsifying and gel-forming properties, and the most commonly used is alginate [6]. Alginate is a linear anionic polysaccharide derived from brown seaweed composed of 1,4-glycosidic bond-linked α-L-guluronic acid and β-D-mannuronic acid residues, which has the ability to form hydrogels in the presence of divalent cations. Ca2+ is the most commonly applied cation in gelling baths because of its non-toxic and biocompatible features [6,9]. Other materials such as chitosan, gum arabic, inulin, collagen, whey protein isolate, soy protein isolate, gelatin, egg albumen, zein, and casein can be combined with alginate in order to enhance the properties of the obtained microbeads. Whey proteins are a valuable by-product from the dairy industry with excellent gelling properties, which mainly stem from the presence of β-lactoglobulin (globular protein of 162 amino acid residues containing two disulfide bridges and a free thiol group) and as such have potential to enhance the properties of alginate microbeads, namely, the swelling behavior directly proportional to release kinetics of the EO, which is highly relevant since the loss of volatile compounds is mass transfer-controlled [8,9,10]. In addition, combining whey protein with alginate may also ameliorate the loss of EO caused by the porous structure of alginate hydrogel and regulate the shrinkage of the beads during drying [9]. The dimensions and physicochemical properties of the acquired beads are a function of the complex interplay of various operational parameters, system properties, and characteristics of the polymer solution, as well as the drying process, which is challenging due to the volatile nature of the EOs. Therefore, optimization is critical for attaining high encapsulation efficiency, stability, and ideal release kinetics [8]. To date, with respect to volatile compounds, electrostatic extrusion has been successfully applied for the encapsulation of D-limonene [11], thyme (Thymus vulgaris L.) EO [12], oregano (Origanum vulgare L.) EO [13], lavender (Lavandula angustifolia L.) EO, tea tree (Melaleuca alternifolia L.) EO, bergamot (Citrus bergamia L.) EO, and peppermint (Mentha piperita L.) EO [14]. To the best of the authors’ knowledge, this technique was not applied to the encapsulation of fennel EO.
Therefore, the aim of this research was to evaluate electrostatic extrusion as a tool for fennel EO encapsulation by examining the influence of alginate content (1%, 1.5%, and 2%), whey protein content (0%, 0.75% and 1.5%), and the type of drying on the encapsulation efficiency, loading capacity, bead size, sphericity, shrinkage, and swelling behavior of the obtained microbeads, as well as by assessing the chemical composition of the encapsulated fennel EO, in order to define the conditions at which the optimal characteristics are achieved.

2. Materials and Methods

2.1. Chemicals and Reagents

Purified water was produced by Mili-Q® Ultrapure Water Purification System from Millipore, Bedford, MA, USA, while 95% n-hexane was obtained from Fisher Scientific (Loughborough, UK). Sodium chloride and anhydrous sodium sulfate were acquired from Lach-Ner Ltd. (Neratovice, Czech Republic). Commercial standards of GC-MS analysis, including α-pinene, camphene, β-pinene, α-phellandrene, 3-carene, p-cymene, γ-terpinene, eucalyptol, L-fenchone, camphor, carvone, p-anisaldehyde, trans-anethole, and an alkane standard solution ranging from C7 to C30 were purchased from Sigma-Aldrich (St. Louis, MO, USA). Myrcene was sourced from Merck, Darmstadt, Germany, while D-limonene and nerol were obtained from Fluka® Analytical (Munich, Germany). α-Terpinene and estragole were purchased from Dr. Ehrenstorfer GmbH (Augsburg, Germany).

2.2. Material

The fennel EO obtained by hydrodistillation was procured from Ireks Aroma Ltd. (Jastrebarsko, Croatia), while low-viscosity sodium alginate was procured from Alfa Aesar (Kandel, Germany), whey protein isolate (Volactive UltraWhey 90 instant) from Volac (Hertfordshire, UK), and emulsifier Tween20® from AppliChem GmbH (Darmstadt, Germany).

2.3. Preparation of Emulsions

In order to produce initial sodium alginate solutions, appropriate amounts of low-viscosity sodium alginate were weighed into glass beakers containing distilled water, and the solutions were refrigerated at 4 °C for 48 h to allow for the development of hydrogel. Initial whey protein solutions were produced by weighing an appropriate amount of whey protein isolate and mixing it with distilled water, followed by gentle agitation to ensure homogeneity. In order to denature the protein, thus enhancing its ability to interact with the alginate and facilitate the formation of stable emulsions, the initial pH of whey protein solution was adjusted to 8 by adding 0.02% of 1 M sodium hydrogen carbonate solution, followed by heating in a water bath for 40 min at 80 °C. Emulsions were formulated by mixing the initial alginate and whey protein solutions so that the final concentrations of alginate and whey protein were as shown in the experimental design outlined in Table 1. Fennel seed EO (5%, w/v) and Tween20® (0.5%, w/v) were added to all samples, and the mixtures were homogenized at 10,000 rpm for 3 min using the Ultra Turrax® T25 homogenizer (Ika, Staufen, Germany), transferred into a pressure bottle and subjected to the electrostatic extrusion process.

2.4. Electrostatic Extrusion

Encapsulation was conducted using the Büchi Encapsulator B-390 (Büchi, Switzerland) equipped with a 1 mm nozzle, employing the following fixed parameters: pressure at 0.1 bar; frequency set at 60 Hz; temperature maintained at 25 °C; and voltage set to 500 V. To ensure uniformity, a magnetic stirrer (IKA, Staufen, Germany) was positioned in front of the encapsulator to continuously stir the gelling solution (5% CaCl2, w/v). A schematic representation of the process is shown in Figure 1.
After formation, the resulting beads were allowed to remain in the gelling solution for 20 min to harden, then rinsed with distilled water and filtered through Whatman No. 40 filter paper (Whatman International Ltd., Kent, UK). Subsequently, they were either air-dried in a thin layer on filter paper for 72 h at ambient conditions or subjected to freezing at −80 °C for 1 h as a step prior to freeze-drying. Freeze-drying of the beads was carried out using a laboratory freeze-dryer (Christ, Osterode am Harz, Germany) with isothermal plate temperatures set at 20 °C for 24 h under high vacuum conditions (13–55 Pa). After drying, the obtained microbeads were vacuum-sealed using a FoodSaver® vacuum sealer (Sunbeam Products, Inc., Boca Raton, FL, USA) and stored at −18 °C in a nitrogen gas atmosphere until further analysis.

2.5. Characterization of Fennel EO Microbeads

2.5.1. Process Yield

The process yield refers to the ratio between the mass of obtained microbeads and the mass of the emulsion used. The process yield (Y) of encapsulation was calculated according to the Equation (1) [15]:
  Y % = m m c m e m · 100
where mmc represents the mass of the obtained wet microbeads, and mem represents the mass of the emulsion used for the encapsulation process.

2.5.2. Encapsulation Efficiency and Loading Capacity

Encapsulation efficiency (EE) and loading capacity (LC) were calculated after obtaining the EO from the alginate microbeads by hydrodistillation, as shown in Equations (2) and (3) [15], respectively:
E E   ( % ) = m e o m 0   · 100
L C   ( % ) = m e o ( m e o + m a l ) · 100
where m0 is the mass of the initial EO; meo is the mass of the encapsulated EO, and mal is the mass of polymer.
The hydrodistillation process was carried out on a Clevenger-type apparatus by weighing 1 g of dry microbeads into a round 250 mL flask and adding 100 mL of distilled water. After 2 h, the separated EO was collected in a vial, and anhydrous sodium sulfate was added to remove water residue. The oil was then transferred to a weighed clean vial, and the mass of the separated EO was used to calculate the mass of EO in the whole sample of dry microbeads using a simple ratio method. The EO was stored at −18 °C until analysis.

2.5.3. Sphericity and Shrinkage Factor

In order to determine the sphericity factor of wet and dry microbeads and shrinkage of the dry microbeads, their size was measured by micrometer (accuracy of 0.001 mm; Digimet, HP, Helios Preisser, Gammertingen, Germany). The size was determined by measuring the microbead diameter at the longest part of the capsule (dmax) and the capsule diameter perpendicular to dmax (dmin). A total of 30 microbeads were measured for each sample and average values of dmax and dmin were determined, from which average values of dry and wet capsule diameters were then calculated.
The deformation of capsules relative to a perfect spherical shape was calculated and expressed as the sphericity factor (SF) according to Equation (4) [16]:
S F = ( d m a x d m i n ) ( d m a x + d m i n )
where dmax was the average microbead diameter at the longest part of the capsule, and dmin was the average capsule diameter perpendicular to dmax.
The reduction in capsule size after drying is expressed by the shrinkage factor (Ksf) and was calculated according to Equation (5) [17]:
K sf = ( d b d b d ) d b
where db was the average diameter of wet beads, and dbd was the average diameter of dry beads.

2.5.4. Swelling Kinetics

The method for determining beads’ swelling is based on measuring the change in mass of capsules after absorbing water at specific time intervals (0–200 min in the present study). To determine swelling behavior, 1 g of dry fennel EO alginate microbeads were immersed in 100 mL of distilled water with continuous agitation at 100 rpm. At fixed time intervals (every 20 min), the beads were separated from the medium, and the mass of the beads was measured.
In order to describe the swelling kinetics, firstly, the swelling ratio (S) was calculated according to Equation (6) [12]:
S = ( m 1 m 2 ) m 2
where m1 was the mass of beads after swelling, and m2 was the mass of beads prior to swelling.
After calculating the swelling ratio, data were fitted to a Korsmeyer–Peppas model following a simple Fick’s law in order to describe swelling kinetics and diffusion of the polymeric structures according to Equation (7) [18]:
F = S t S e = k t n
where F represents the swelling fraction; St is the swelling content at a given time; Se is the equilibrium swelling content; t is time; n is the diffusion exponential of the solvent, and k is the constant that changes according to the gel network structure.

2.5.5. Gas Chromatography–Mass Spectrometry Analysis

To assess the composition of fennel EO before and after encapsulation, GC-MS analysis was conducted following the method outlined by Marčac et al. [1]. This analysis utilized an Agilent Technologies 6890N Network GC System with an Agilent 5973 inert mass selective detector and a capillary column (Agilent HP-5MS: 5%-phenyl-methylpolysiloxane; dimensions: 30 m × 0.25 mm × 0.25 μm). Samples were diluted (1:99) in a mixture of n-hexane and an internal standard (nerol, concentration: 1.0518 mg/mL), and 1.0 µL was injected automatically by Agilent 7683B autosampler injector in split mode at a 1:100 ratio, with an injection temperature of 250 °C. Helium served as the carrier gas, flowing at a constant rate of 1 mL/min. The oven temperature program ranged from 60–145 °C at a rate of 3 °C/min, followed by 145–250 °C at a rate of 30 °C/min, maintained at the final temperature for 3 min. The transfer line, MS source, and quadrupole temperatures were maintained at 280, 230, and 150 °C, respectively. The ionization energy of the detector was set at 70 eV. Mass spectra (m/z) were recorded within the range of 30–550 at a scan rate of 1 scan/s, with quantification performed in single ion monitoring (SIM) mode. These conditions were consistent for analyzing the alkane solution, and retention indices (RI) were computed as per Bianchi et al. [19]. Identification of EO components relied on comparing their retention times, RI, and m/z values with authentic standards and entries in the NIST library (Chem Station Data Analysis). Volatile compounds were quantified using calibration curves of α-pinene, β-pinene, camphene, myrcene, α-phellandrene, p-cymene, α-terpinene, γ-terpinene, D-limonene, eucalyptol, L-fenchone, estragole, camphor, p-anisaldehyde, carvone, and trans-anethole. Sabinene and cis-sabinene hydrate were identified based on their m/z values, RI, and comparison with the literature data, while the calibration curve for 3-carene was utilized for their quantification. The concentration of the quantified compounds was expressed as mg/mL of EO.

2.6. Experimental Design and Statistical Analysis

Statistica ver. 10.0 software (Statsoft Inc, Tulsa, OK, USA) was used for experimental design and statistical analysis. The encapsulation process and all analyses were carried out in duplicate (n = 4). Mixed two and three-level full factorial experimental designs consisting of 18 trials were used to evaluate the effects of three independent variables, namely, the carrier type and ratio (1%, 1.5%, and 2% alginate; 0%, 0.75%, and 1.5% whey protein) and the drying type (air-drying and freeze-drying), on the encapsulation efficiency, loading capacity, sphericity, and shrinkage of the microbeads (dependent variables). Normality and homoscedasticity of the residuals were tested by the Shapiro–Wilk’s test and Levene’s test, respectively. The samples, which met the normality and homoscedasticity requirements, were analyzed using multifactorial analysis of variance (ANOVA), followed by Tukey’s HSD multiple comparison test for marginal means comparison between groups. Nonparametric data were analyzed using the Kruskal–Wallis test. Significant differences in the chemical composition of initial EO and encapsulated EO obtained under optimal electrostatic extrusion conditions were tested using one-way ANOVA and post-hoc Tukey’s HSD test. The significance level p ≤ 0.05 was assigned for all tests.

3. Results and Discussion

This study examined the effect of alginate and whey content during encapsulation, as well as the post-encapsulation drying process, on the physicochemical properties of fennel EO calcium alginate microbeads, including the process yield, encapsulation efficiency, loading capacity, sphericity, and size reduction in microbeads. Selected microbeads were further analyzed for their swelling behavior, and the microbeads obtained at optimal conditions were analyzed by GC-MS in order to evaluate the quality of the encapsulated EO.

3.1. Process Yield

The process yield is an important factor during the production of alginate microbeads since it reflects the cost-effectiveness of the process and is vital for industrial-scale production and ensuring product quality. A higher yield indicates that more beads are produced per unit of alginate, and a consistent yield from batch to batch ensures a stable and well-controlled process. The yield in this study ranged from 37.75% to 56.97% with a mean of 49.43%, which was similar to the range reported by Caceres et al. [20] during the encapsulation of grapefruit oil in alginate hydrogel by ionic gelation, as well as slightly lower than the average 62% that Benavides et al. [15] achieved during encapsulation of thyme EO in alginate microbeads. The relatively low values can be explained by the loss of emulsion during transfer as well as the loss of water during cross-linking [20]. Statistical analysis (Table 2) showed that only the content of alginate had a significant effect on the yield, which can be explained by its effect on the water loss, as lower content of alginate means less hydrophilic groups responsible for the water-adsorbing capacity of alginate during gel formation [21].

3.2. Encapsulation Efficiency and Loading Capacity

Encapsulation efficiency can be considered the most important parameter in evaluating the success of the encapsulation process, as it shows how much of the initial EO was entrapped in the produced microbeads. Loading capacity is another important factor, as it reflects how much of the EO can be contained by the used carrier and is most often defined by the properties of the used carriers [15]. In the present study, the encapsulation efficiency varied notably between samples and ranged from 6.16. to 51.95% (Table 1), which was similar to the range (10.57–63.17%) reported during encapsulation of thyme, geraniol, and rosemary EOs entrapped in alginate microbeads by oil emulsion technique [22], but also lower than 80% reported by Volić et al. [12] during the encapsulation of thyme EO by emulsification or 90% reported by Soliman et al. [23] during preparation of alginate microbeads from several different EOs. Loading capacity also varied notably with a range from 39.23 to 82.60% (Table 1), where most values were similar to values obtained during encapsulation of oregano EO (64.19–78.64%) [13] and thyme EO (~30–55%) [15] by ionic gelation but higher than 22–26% reported during encapsulation of several EOs [23,24]. As mentioned previously, loading capacity was generally affected by the applied carriers, which was also a case in the present study since drying type had no significant effect, as opposed to the significant effect of the combination of alginate and whey protein where 1% alginate with 1.5% of whey protein resulted in the highest loading capacity. At 1.5% alginate containing 0.75% whey protein, the loading capacity increased, while further addition of whey protein caused the decrease in loading capacity, likely due to the decrease in free volume within the polymer–protein matrix, which reduced the amount of oil which could be entrapped [23]. At 2% alginate, adding whey protein had no significant effect on loading capacity, possibly due to the higher density of the gel with fewer pores, which reduced the ability to retain whey proteins.
Many factors can influence the encapsulation efficiency in alginate-based systems, and they include the preparation technique, parameters applied, used carriers, properties of the Eos, and the quantity of the EO used in an encapsulation process [15]. For example, EOs rich in aliphatic structure components facilitate the hydrogen bonding between the alginate and EO, while aromatic compounds hinder the hydrophilic interactions with alginate or other carriers used [22]. Also, different ratios of carriers result in more or less available groups that react with the EO, resulting in varying encapsulation efficiency. In the present study, statistical analysis showed that the content of alginate in the applied range had no significant influence on the encapsulation efficiency, and the same was observed for whey protein. Their combination, however, had a significant effect, and it can be observed from the results in Table 2 that a 1% alginate combination with 1.5% whey protein significantly improved the encapsulation efficiency, while at 2% alginate, no significant differences were observed when whey protein was added. The highest encapsulation efficiency was achieved at a combination of 1.5% alginate and 0.75% whey protein, which suggests that a balance was achieved between stability, allowing for the protection of the EO from degradation or release, and adequate fluidity and dispersion, which facilitated the encapsulation of the EO. Adding a higher concentration of whey protein might have resulted in hindering EO entrapment by complex formation between the amino acid residues of the whey protein and carboxylic groups of alginate chains [25]. These results are in agreement with results reported during the encapsulation of marjoram EO [26], where the highest efficiency was achieved when 1.25% alginate and 1.25% whey protein were used, while further increase reduced the encapsulation efficiency. Another factor that significantly influenced the encapsulation efficiency but not loading capacity was the drying type, with freeze-drying resulting in higher values than air-drying. This can be explained by the characteristics of the freeze-drying process during which the sample is rapidly frozen, and the water is removed rapidly under vacuum by sublimation of ice, thus preserving the structure of the alginate bead, as opposed to air-drying during which slow evaporation can result in damage of encapsulated material and reduced encapsulation efficiency [12,27]. In addition, the low temperature and vacuum conditions during freeze-drying can minimize chemical and physical degradation of the encapsulated material, resulting in better retention of EO.
Based on these findings, the optimal conditions for achieving maximum encapsulation efficiency and loading capacity are the use of 1.5% alginate in combination with 0.75% whey protein and applying freeze-drying as a method of choice superior to air-drying. At these conditions, the highest encapsulation efficiency of 51.95%, accompanied by the loading capacity of 78.28%, was obtained, while the process yield at these conditions was 50.70%, which is at the higher end of the values obtained in the present study (Table 1).

3.3. Sphericity and Shrinkage of the Microbeads

The size and sphericity (a value between 0 and 1, indicating how closely the shape of the bead resembles a sphere) of microbeads have a vital role in polymer application. It was shown that the alginate microbead’s resistance to compressive pressures and shear increases as its size decreases and that the sphericity of a microsphere is in direct correlation with its mechanochemical stability [28]. In the present study, the microsphere size varied from 2.56 to 3.67 mm (mean diameter) for wet and from 1.18 to 2.75 mm for dry microbeads, respectively. The mean diameter of the wet beads differed from the diameter of the nozzle (1000 μm), which was expected since the diameter of the beads was usually double the diameter of the used nozzle due to the dominance of surface tension force over the gravitational force during the droplet formation [29]. Since the size and sphericity of the microcapsules can be influenced by various parameters, this study examined the influence of alginate and whey content, as well as drying type, on the sphericity and shrinkage of the microbeads, and their effect is presented in Table 3.
As can be observed, alginate content had no significant influence on the sphericity of wet microbeads, and all of the concentrations resulted in a spherical shape of microbeads (SF ≤ 0.05) [12]. On the other hand, adding whey protein significantly influenced the sphericity of the wet microbeads, and it can be observed that at both 1 and 2% alginate, increased whey content improved the sphericity of the microbeads, indicating their higher mechanochemical stability. This could possibly be a result of denatured whey protein clusters forming cross-linkages with Ca2+ ions [30], making the matrix tighter and, thus, allowing for the formation of a more spherical shape. Drying resulted in reduced size and roundness of the microbeads as none of the dry beads had a sphericity factor lower than 0.05, which was also observed by other authors [12,31,32]. The drying type had no significant effect, while higher sphericity of the microbeads was observed with a higher content of alginate. Only at 2% alginate, the addition of whey protein resulted in better sphericity, possibly due to its emulsifying properties [33], which reduced material contraction that would have occurred as a result of higher viscosity of higher alginate content. The effect was also likely more pronounced at a higher content of alginate due to more binding sites available for interaction with whey protein.
The shrinkage of the microbeads was significantly influenced by alginate content and drying type, while the content of whey protein only had a significant effect when 0.75% was combined with 1% alginate. As the content of alginate increased, a higher shrinkage factor was observed, possibly due to high water loss from the hydrogel network, as a higher content of alginate allowed for a higher water uptake capacity during hydrogel formation [34]. Adding 0.75% whey protein to 1% alginate increased shrinkage of the microbeads, likely due to steric hindrance, which might have occurred between the bulky protein molecules and the alginate chains, therefore disrupting the formation of a well-defined gel structure and resulting in increased shrinkage. Adding a higher concentration of whey protein resulted in the same shrinkage factor as adding no whey protein at 1% alginate, which could have been a result of more opportunities for cross-linking between whey protein molecules and alginate chains, which compensated for the steric hindrance. In addition, whey protein has surface-active properties [35] and can form a film around particles, which may enhance the cohesion between alginate particles during bead formation, resulting in stronger microbeads that are less prone to shrinkage during drying [9]. As for the effect of drying, the freeze-dried microbeads had a significantly lower shrinkage factor, which was likely a result of minimized structural rearrangement by removing water without melting, as opposed to the air-drying which involves slow evaporation and, therefore, may result in the collapse of the structure and subsequent shrinkage of the beads. Similar results were observed by Santagapita et al. [32], where freeze-drying of alginate beads resulted in over 20% lesser size reduction compared to vacuum- and air-drying.

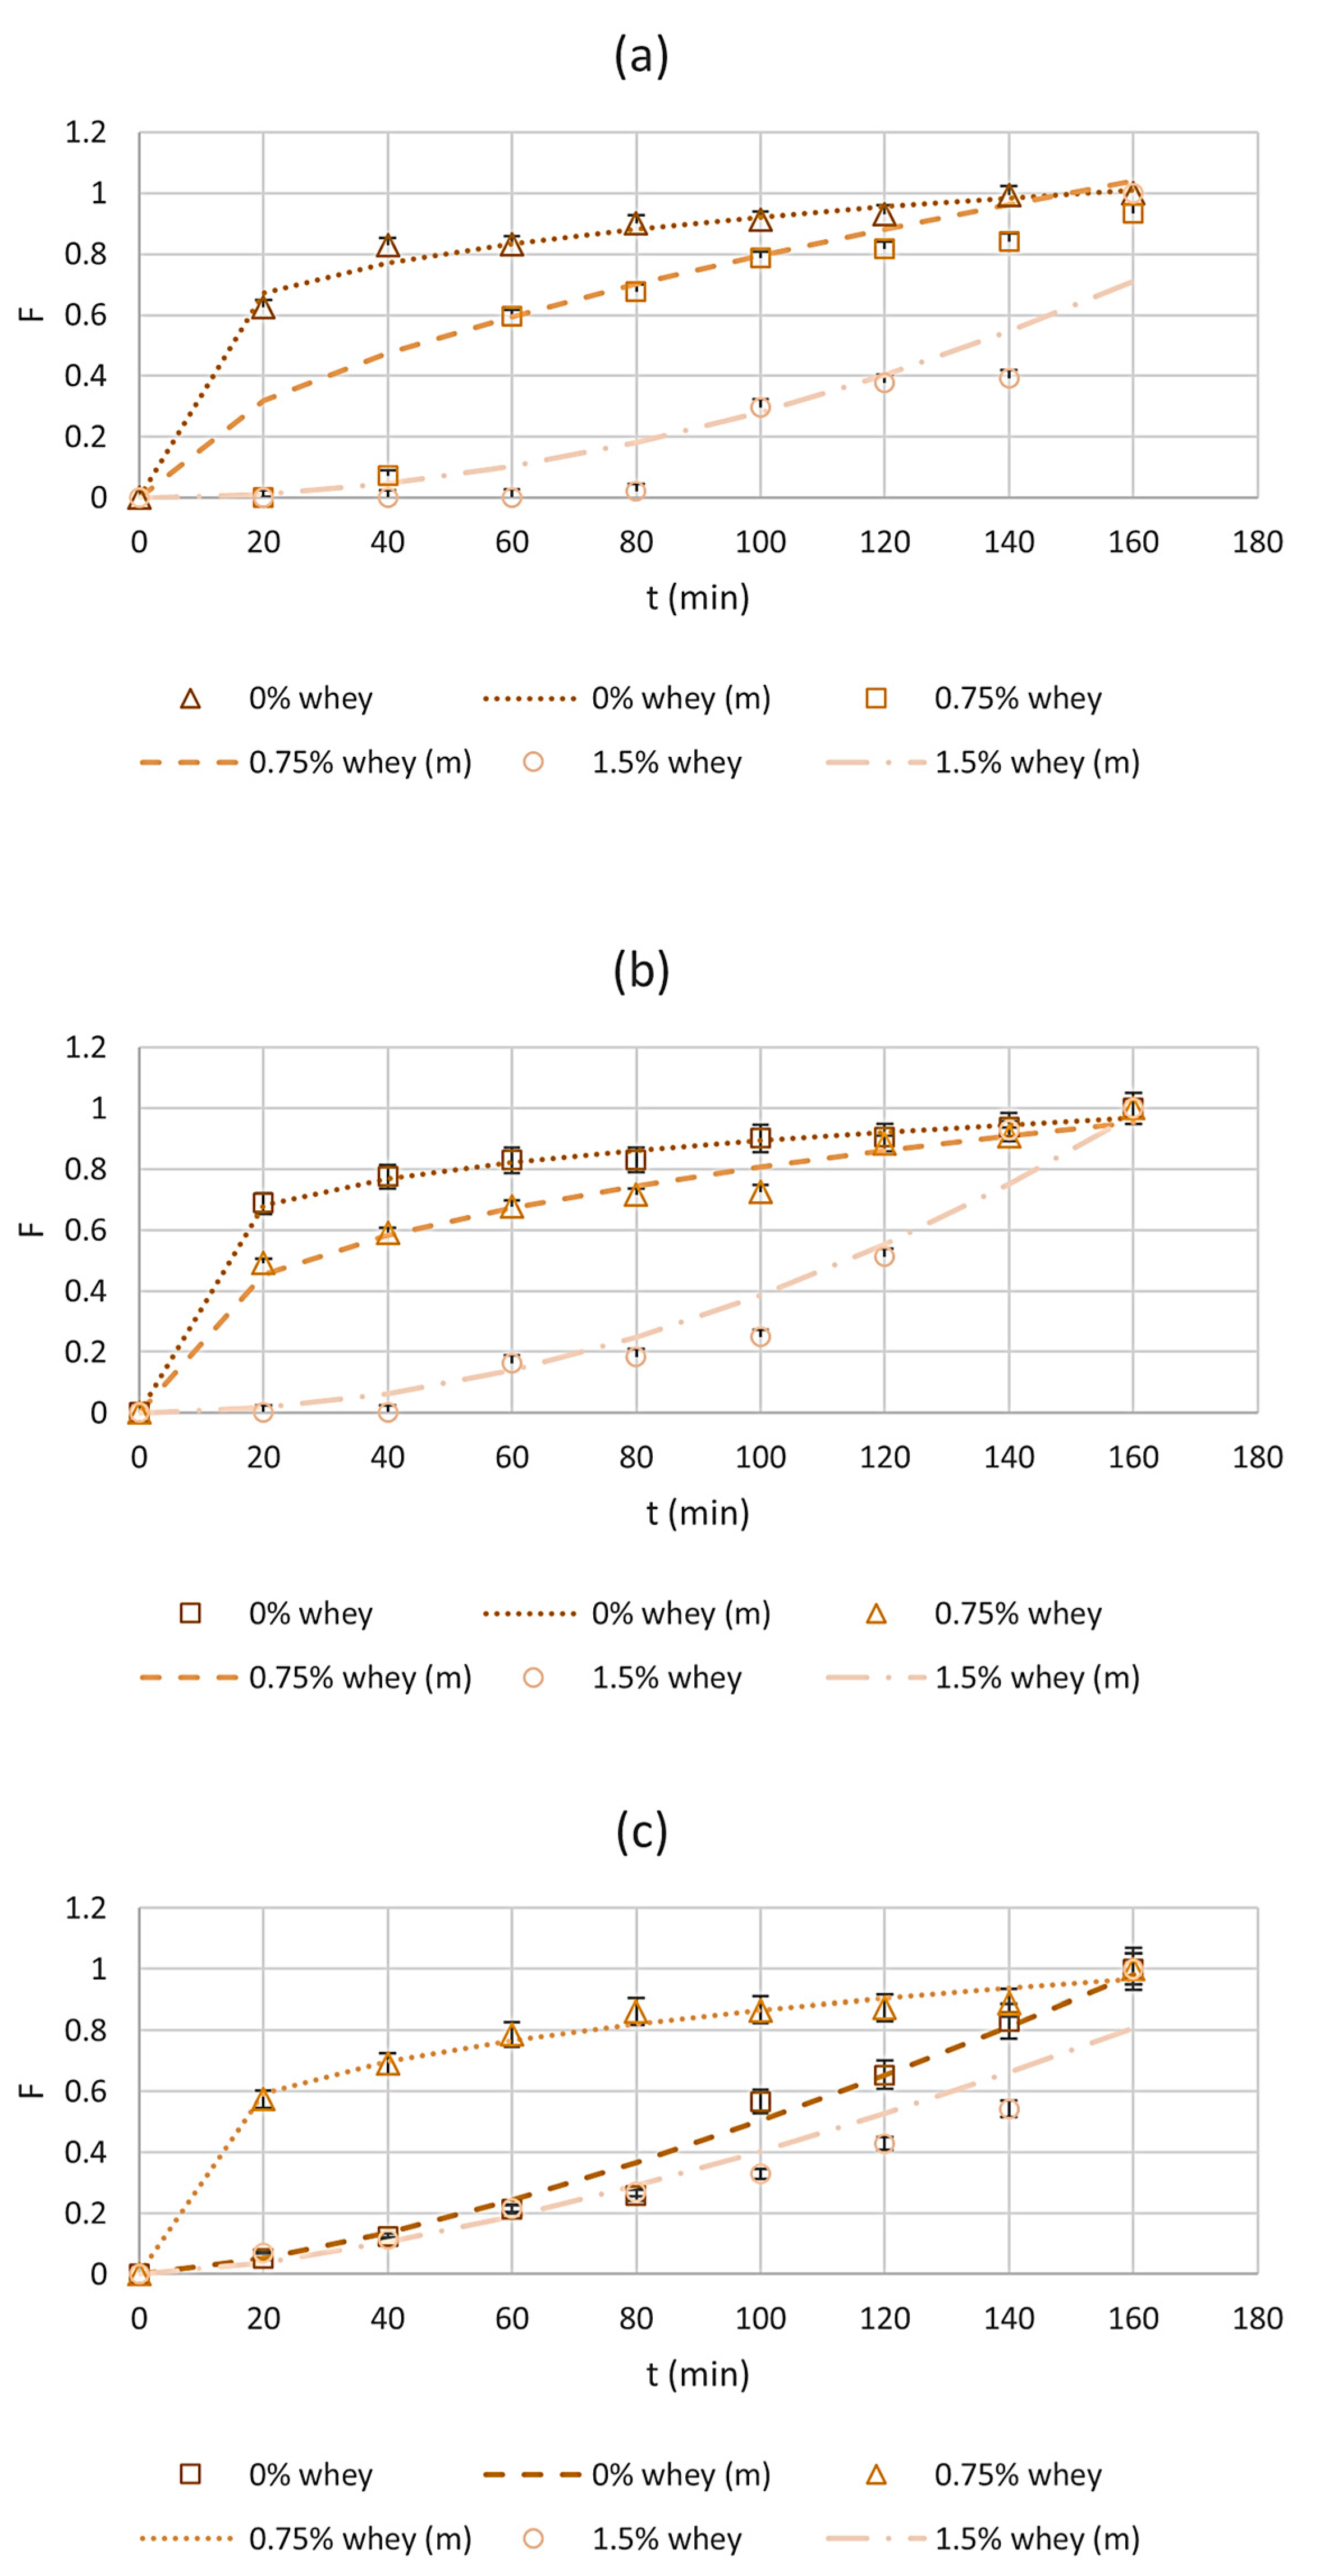
3.4. Swelling Kinetics

Investigating the swelling behavior of encapsulated systems is highly relevant since the essential feature of encapsulated EOs’ release from initially dry hydrogels lies in the transition from immobile molecules within the dry material to their mobility upon swelling of the matrix by water [36]. This process gives rise to what can be termed as “swelling-controlled” drug release. In cases where the matrix exhibits sufficient hydrophilicity, the increased mobility of the molecules can reduce resistance to transport within the swollen layer, thereby regulating the rate of release primarily by the rate of water penetration [37]. Understanding which mechanism governs the release is crucial for designing encapsulates with specific release characteristics. For instance, if release is primarily controlled by water penetration into the glassy matrix, modifying the EO’s diffusivity within the equilibrium-swollen gel, such as via cross-linking, may have minimal impact [37]. Conversely, if the matrix quickly undergoes penetration and plasticization but then swells slowly, focusing efforts on modifying the rate of secondary swelling would be most advantageous. The simple power law approach used in the present study offers researchers a straightforward method to correlate and assess release data, as it provides a convenient measure of release rate constancy via the parameter n, where values of n < 0.5 indicate classical Fickian diffusion of molecules from areas of high concentration to areas of low concentration. Values of n above 1 indicate the super case II transport mechanism, often referred to as relaxation-controlled transport, as it is attributed to structural changes in polymers due to penetration of water and subsequent plasticization. The range of behavior with n values falling between 0.5 and 1 is often referred to as viscoelastic or anomalous transport [37]. The constants k and n represent parameters specific to the polymer/bioactive agent/dissolution medium system under consideration. Optimal kinetic behavior in swelling-controlled release systems is typically associated with n = 1.0, indicating time-independent drug release, which is highly desirable. The swelling kinetics of the freeze-dried fennel EO alginate microbeads, which had significantly higher encapsulation efficiency and loading capacity, were calculated by fitting to a simple power-law model, which, according to the high correlation coefficient R2 values, showed good correlation with the experimental data. The results are shown in Figure 2, while the values of k and n obtained from data fitting are shown in Table 4.
As can be observed, at 1 and 1.5% alginate concentrations, microbeads without whey protein absorbed 60% of the total water within the first 20 min, indicating an initial burst, which occurs due to the increased porosity of the device and rapidly increased diffusion coefficient [36]. According to the value of n, which was lower than 0.5, the swelling behavior of these microbeads followed Fickian diffusion. With the addition of 0.75% whey protein, the absorption time was prolonged, with 60% of the water absorbed after 40 and 60 min of 1 and 1.5% alginate, respectively. In the case of adding 1.5% whey, swelling occurred significantly slower, with 40% of the water released by 120 (1% alginate) and 140 min (1.5% alginate), reaching equilibrium after 160 min. These results indicate that the interaction of whey proteins and alginate resulted in the reduction in hydrogel’s porosity, which was also observed in freeze-dried oregano EO microbeads [13]. At 1% alginate, neither of the microbeads containing whey protein swelled according to Fickian diffusion (n > 0.5), while at 1.5% alginate, only the microbeads with the highest amount of whey protein exhibited anomalous behavior, which likely included an interplay of swelling and erosion of the polymeric matrix [38].
At 2% alginate concentration, trends were somewhat different. Microbeads without whey protein absorbed 60% of the total water after 120 min, with an increase observed up to 160 min before reaching equilibrium. These results suggest that the porosity of 2% alginate hydrogel was lower than those with less alginate, likely due to a denser polymer network and stronger interactions between polymer chains within the hydrogel, reducing the space available for pore formation, which also resulted in anomalous swelling, which did not follow Fickian diffusion [39]. With the addition of 0.75% whey protein, 60% of the water was absorbed within the first 20 min, indicating an initial burst, which might have been caused by the formation of protein aggregates within the alginate matrix, which created additional void spaces or channels within the hydrogel structure, thereby increasing its overall porosity and resulting in a swelling behavior consistent with Fickian diffusion. In the case of adding 1.5% whey protein, similar to other alginate concentrations, swelling occurred significantly slower, with the maximum water uptake occurring between 140 and 160 min, suggesting a different release mechanism, which was also supported by the values of n > 1. The radical difference between adding 0.75 and 1.5% of whey protein could have been caused by the change in the interaction of alginate and whey protein due to different concentrations [9], where instead of promoting porosity, these interactions resulted in stronger binding between the protein and polymer molecules, thus forming tighter hydrogel structure with lower porosity.

3.5. Characterization of the Essential Oil by GC-MS

In order to assess the chemical composition and quality of the fennel EO encapsulated by electrostatic extrusion, the initial fennel EO and the EO hydrodistilled from the fennel EO microbeads obtained under optimal conditions (1.5% alginate/0.75% whey protein/freeze-drying) were analyzed by GC-MS. The comparison of their chemical profiles is shown in Table 5. The GC-MS analysis identified a total of 18 compounds (Figure 3) in both samples, categorized into monoterpene hydrocarbons (11), oxygenated monoterpenes (4), phenylpropanoids (2), and aromatic aldehydes (1). The results indicate that electrostatic extrusion followed by freeze-drying did not affect the qualitative composition of the fennel EO. Both oils exhibited a comparable composition of chemical groups, with phenylpropanoids being the most prevalent (68.96 and 81.09%), followed by oxygenated monoterpenes (16.22 and 13.19%) and monoterpene hydrocarbons (12.78 and 4.63%). Aromatic aldehydes were the least abundant, accounting only for 2.04 and 1.09% of the oils, respectively.
Trans-anethole was the main representative of phenylpropanoids and the most abundant compound in both oils, which is consistent with previous data [1,40,41]. L-fenchone was the dominant representative of oxygenated monoterpenoids, while α-pinene, D-limonene, and myrcene were the most abundant monoterpene hydrocarbons. The content of p-anisaldehyde was also relatively high compared to other constituents. Repajić et al. [42] and Marčac et al. [1] observed a similar composition of the fennel EO prior to and after encapsulation by spray-drying and during hydrodistillation and steam distillation of fennel EO from seeds with or without pretreatment by cryogrinding, respectively.
As for the quantitative aspect, the results highlighted notable variances in the levels of compounds between the original and encapsulated EO. It was observed that the concentrations of all compounds were reduced in the encapsulated EO compared to the original EO, except for carvone, where no significant differences were observed in its concentration between the two oils. The most significant reduction (63.8%) was observed for monoterpene hydrocarbons, followed by aromatic aldehydes (46.4%) and oxygenated monoterpenes (18.7%), while the relative amount of phenylpropanoids rose 17.6% on account of other groups. The retention of EO constituents within a polymer matrix largely depends on their volatility and hydrophobicity, which was demonstrated as highly relevant in the case of monoterpene hydrocarbons whose hydrophobic nature increased their concentration on the particle surface, leaving them less protected and more prone to volatilization [43]. The process of freeze-drying, which proved to be superior in terms of volatiles’ retention over other drying techniques [44,45], also plays a significant role in EO retention. During the initial phase of freeze-drying, volatile substances possess vapor pressures higher than ice at the freezing temperatures, resulting in their swift evaporation from both the surface and interior of the frozen microbead, and compounds with higher volatility usually exhibit lower retention [46], which was observed in the present study. In addition, as the frozen water within the microbeads sublimates, it creates pores and voids within the alginate–whey protein structure of the beads, enabling, therefore, pathways for moisture vapor and volatile compounds to escape from the beads. During the advanced freeze-drying phase, the retention of compounds is improved by sorption or locking due to the partially dried hydrogel matrix [46]. Despite noting a substantial loss of compounds during the encapsulation process employing electrostatic extrusion followed by freeze-drying, the mean retention rate reached 58.95%, signifying the effective preservation of a large portion of fennel EO encapsulated with 1.5% alginate and 0.75% whey protein, thus paving the way for future research of this encapsulation technique.

4. Conclusions

In the present study, electrostatic extrusion emerged as a successful technique for the encapsulation of fennel EO, offering promising prospects for various applications. The incorporation of whey protein into the alginate polymeric matrix yielded favorable outcomes, enhancing the encapsulation efficiency and loading capacity. Moreover, the choice of drying method significantly impacted these parameters, with freeze-drying demonstrating superiority over air-drying. Optimal encapsulation efficiency was achieved when applying a mixture of 1.5% alginate and 0.75% whey protein, followed by freeze-drying. The sphericity and shrinkage of the beads were largely influenced by the applied carrier mixture, where adding whey protein resulted in more desirable characteristics. Air-drying led to a more pronounced reduction in bead sphericity and an increase in the microbeads’ shrinkage factor compared to freeze-drying. Analysis of swelling kinetics unveiled the influential role of the carrier type, with the addition of 1.5% whey protein inducing anomalous behavior across all alginate concentrations. For formulations targeting Fickian diffusion release, adding 0.75% whey protein to 1.5 or 2% alginate emerged as a favorable option. GC-MS analysis revealed no qualitative disparities between the initial and encapsulated fennel EO. However, a decline in individual compound content was observed, with more volatile compounds exhibiting greater reductions. Despite this, the average retention of volatile compounds stood at a respectable 58.95%. Therefore, it can be concluded that electrostatic extrusion using alginate and whey protein presents a promising avenue for fennel EO encapsulation. Further investigation into the incorporation of a wider range of carrier materials and the adjustment of their concentrations is necessary to refine the encapsulation process and achieve the utmost quality in fennel EO microbeads. Nevertheless, the findings of this study underscore the potential for innovative advancements in encapsulation technology to enhance the delivery and efficacy of EOs in various applications.

Author Contributions

Conceptualization, M.R. and E.D.; methodology, M.R. and E.D.; formal analysis, K.R., E.C. and M.R.; investigation, K.R. and E.D.; data curation, K.R., E.D. and M.R.; writing—original draft preparation, E.D.; writing—review and editing, M.R., E.C. and I.E.G.; supervision, M.R.; project administration, V.D.-U.; funding acquisition, V.D.-U. All authors have read and agreed to the published version of the manuscript.

Funding

This research was funded by the Croatian Science Foundation, grant number IP-01-2018-4924.

Data Availability Statement

The original contributions presented in the study are included in the article, further inquiries can be directed to the corresponding author.

Acknowledgments

The authors would like to thank Ireks Aroma Ltd. for providing the fennel essential oil used for this experiment.

Conflicts of Interest

The authors declare no conflicts of interest. The funders had no role in the design of this study, in the collection, analyses, or interpretation of data, in the writing of the manuscript, or in the decision to publish the results.

References

  1. Marčac, N.; Balbino, S.; Tonković, P.; Medved, A.M.; Cegledi, E.; Dragović, S.; Dragović-Uzelac, V.; Repajić, M. Hydrodistillation and Steam Distillation of Fennel Seeds Essential Oil: Parameter Optimization and Application of Cryomilling Pretreatment. Processes 2023, 11, 2354. [Google Scholar] [CrossRef]
  2. Telci, I.; Demirtas, I.; Sahin, A. Variation in Plant Properties and Essential Oil Composition of Sweet Fennel (Foeniculum vulgare Mill.) Fruits during Stages of Maturity. Ind. Crop. Prod. 2009, 30, 126–130. [Google Scholar] [CrossRef]
  3. Rather, M.A.; Dar, B.A.; Sofi, S.N.; Bhat, B.A.; Qurishi, M.A. Foeniculum Vulgare: A Comprehensive Review of Its Traditional Use, Phytochemistry, Pharmacology, and Safety. Arab. J. Chem. 2016, 9, S1574–S1583. [Google Scholar] [CrossRef]
  4. Misharina, T.A.; Polshkov, A.N. Antioxidant Properties of Essential Oils: Autoxidation of Essential Oils from Laurel and Fennel and of Their Mixtures with Essential Oil from Coriander. Appl. Biochem. Microbiol. 2005, 41, 610–618. [Google Scholar] [CrossRef]
  5. Turek, C.; Stintzing, F.C. Stability of Essential Oils: A Review. Compr. Rev. Food Sci. Food Saf. 2013, 12, 40–53. [Google Scholar] [CrossRef]
  6. Bamidele, O.P.; Emmambux, M.N. Encapsulation of Bioactive Compounds by “Extrusion” Technologies: A Review. Crit. Rev. Food Sci. Nutr. 2021, 61, 3100–3118. [Google Scholar] [CrossRef]
  7. Anu Bhushani, J.; Anandharamakrishnan, C. Electrospinning and Electrospraying Techniques: Potential Food Based Applications. Trends Food Sci. Technol. 2014, 38, 21–33. [Google Scholar] [CrossRef]
  8. Manojlovic, V.; Rajic, N.; Djonlagic, J.; Obradovic, B.; Nedovic, V.; Bugarski, B. Application of Electrostatic Extrusion—Flavour Encapsulation and Controlled Release. Sensors 2008, 8, 1488–1496. [Google Scholar] [CrossRef]
  9. Pedrali, D.; Scarafoni, A.; Giorgi, A.; Lavelli, V. Binary Alginate-Whey Protein Hydrogels for Antioxidant Encapsulation. Antioxidants 2023, 12, 1192. [Google Scholar] [CrossRef]
  10. Gunasekaran, S.; Ko, S.; Xiao, L. Use of Whey Proteins for Encapsulation and Controlled Delivery Applications. J. Food Eng. 2007, 83, 31–40. [Google Scholar] [CrossRef]
  11. Lević, S.; Pajić Lijaković, I.; Đorđević, V.; Rac, V.; Rakić, V.; Šolević Knudsen, T.; Pavlović, V.; Bugarski, B.; Nedović, V. Characterization of Sodium Alginate/d-Limonene Emulsions and Respective Calcium Alginate/d-Limonene Beads Produced by Electrostatic Extrusion. Food Hydrocoll. 2015, 45, 111–123. [Google Scholar] [CrossRef]
  12. Volić, M.; Pajić-Lijaković, I.; Djordjević, V.; Knežević-Jugović, Z.; Pećinar, I.; Stevanović-Dajić, Z.; Veljović, Đ.; Hadnadjev, M.; Bugarski, B. Alginate/Soy Protein System for Essential Oil Encapsulation with Intestinal Delivery. Carbohydr. Polym. 2018, 200, 15–24. [Google Scholar] [CrossRef]
  13. Gallo, T.C.B.; Cattelan, M.G.; Alvim, I.D.; Nicoletti, V.R. Oregano Essential Oil Encapsulated in Alginate Beads: Release Kinetics as Affected by Electrostatic Interaction with Whey Proteins and Freeze-Drying. J. Food Process Preserv. 2020, 44, e14947. [Google Scholar] [CrossRef]
  14. Kalušević, A.; Nedović, V.; Nikšić, M.; Shamtsyan, M.; Šavikin, K.; Pljevljakušić, D.; Pantić, M.; Lević, S.; Salević, A.; Kokina, M. Characterization, Antioxidant and Antibacterial Activity of Essential Oils and Their Encapsulation into Biodegradable Material Followed by Freeze Drying. Food Technol. Biotechnol. 2019, 57, 282–289. [Google Scholar] [CrossRef]
  15. Benavides, S.; Cortés, P.; Parada, J.; Franco, W. Development of Alginate Microspheres Containing Thyme Essential Oil Using Ionic Gelation. Food Chem. 2016, 204, 77–83. [Google Scholar] [CrossRef]
  16. Chan, E.-S.; Lee, B.-B.; Ravindra, P.; Poncelet, D. Prediction Models for Shape and Size of Ca-Alginate Macrobeads Produced through Extrusion–Dripping Method. J. Colloid. Interface Sci. 2009, 338, 63–72. [Google Scholar] [CrossRef]
  17. Chan, E.-S.; Wong, S.-L.; Lee, P.-P.; Lee, J.-S.; Ti, T.B.; Zhang, Z.; Poncelet, D.; Ravindra, P.; Phan, S.-H.; Yim, Z.-H. Effects of Starch Filler on the Physical Properties of Lyophilized Calcium–Alginate Beads and the Viability of Encapsulated Cells. Carbohydr. Polym. 2011, 83, 225–232. [Google Scholar] [CrossRef]
  18. Kipcak, A.S.; Ismail, O.; Doymaz, I.; Piskin, S. Modeling and Investigation of the Swelling Kinetics of Acrylamide-Sodium Acrylate Hydrogel. J. Chem. 2014, 2014, 281063. [Google Scholar] [CrossRef]
  19. Bianchi, F.; Careri, M.; Mangia, A.; Musci, M. Retention Indices in the Analysis of Food Aroma Volatile Compounds in Temperature-programmed Gas Chromatography: Database Creation and Evaluation of Precision and Robustness. J. Sep. Sci. 2007, 30, 563–572. [Google Scholar] [CrossRef]
  20. Cáceres, L.M.; Velasco, G.A.; Dagnino, E.P.; Chamorro, E.R. Microencapsulation of Grapefruit Oil with Sodium Alginate by Gelation and Ionic Extrusion: Optimization and Modeling of Crosslinking and Study of Controlled Release Kinetics. Rev. Tecnol. Y Cienc. 2020, 41, 41–61. [Google Scholar] [CrossRef]
  21. Milivojević, M.; Popović, A.; Pajić-Lijaković, I.; Šoštarić, I.; Kolašinac, S.; Stevanović, Z.D. Alginate Gel-Based Carriers for Encapsulation of Carotenoids: On Challenges and Applications. Gels 2023, 9, 620. [Google Scholar] [CrossRef]
  22. Thanaruenin, P.; Sutthasupa, S.; Kanha, N.; Sangsuwan, J. Antioxidation Effect of Alginate Beads Containing Thyme, Rosemary or Geranium Essential Oils in Lard and Coconut Oil. Int. J. Food Sci. Technol. 2023, 58, 898–906. [Google Scholar] [CrossRef]
  23. Soliman, E.A.; El-Moghazy, A.Y.; El-Din, M.S.M.; Massoud, M.A. Microencapsulation of Essential Oils within Alginate: Formulation and in Vitro Evaluation of Antifungal Activity. J. Encapsulation Adsorpt. Sci. 2013, 3, 48–55. [Google Scholar] [CrossRef]
  24. Hosseini, S.M.; Hosseini, H.; Mohammadifar, M.A.; Mortazavian, A.M.; Mohammadi, A.; Khosravi-Darani, K.; Shojaee-Aliabadi, S.; Dehghan, S.; Khaksar, R. Incorporation of Essential Oil in Alginate Microparticles by Multiple Emulsion/Ionic Gelation Process. Int. J. Biol. Macromol. 2013, 62, 582–588. [Google Scholar] [CrossRef]
  25. Liu, X.; Qin, X.; Wang, Y.; Zhong, J. Physicochemical Properties and Formation Mechanism of Whey Protein Isolate-Sodium Alginate Complexes: Experimental and Computational Study. Food Hydrocoll. 2022, 131, 107786. [Google Scholar] [CrossRef]
  26. Mazza, K.E.L.; Costa, A.M.M.; da Silva, J.P.L.; Alviano, D.S.; Bizzo, H.R.; Tonon, R.V. Microencapsulation of Marjoram Essential Oil as a Food Additive Using Sodium Alginate and Whey Protein Isolate. Int. J. Biol. Macromol. 2023, 233, 123478. [Google Scholar] [CrossRef]
  27. do Vale Morais, A.R.; do Nascimento Alencar, É.; Xavier Júnior, F.H.; de Oliveira, C.M.; Marcelino, H.R.; Barratt, G.; Fessi, H.; do Egito, E.S.T.; Elaissari, A. Freeze-Drying of Emulsified Systems: A Review. Int. J. Pharm. 2016, 503, 102–114. [Google Scholar] [CrossRef]
  28. Anani, J.; Noby, H.; Zkria, A.; Yoshitake, T.; ElKady, M. Monothetic Analysis and Response Surface Methodology Optimization of Calcium Alginate Microcapsules Characteristics. Polymers 2022, 14, 709. [Google Scholar] [CrossRef]
  29. Lee, B.B.; Ravindra, P.; Chan, E.S. Size and Shape of Calcium Alginate Beads Produced by Extrusion Dripping. Chem. Eng. Technol. 2013, 36, 1627–1642. [Google Scholar] [CrossRef]
  30. Abaee, A.; Mohammadian, M.; Jafari, S.M. Whey and Soy Protein-Based Hydrogels and Nano-Hydrogels as Bioactive Delivery Systems. Trends Food Sci. Technol. 2017, 70, 69–81. [Google Scholar] [CrossRef]
  31. Trifković, K.T.; Milašinović, N.Z.; Djordjević, V.B.; Krušić, M.T.K.; Knežević-Jugović, Z.D.; Nedović, V.A.; Bugarski, B.M. Chitosan Microbeads for Encapsulation of Thyme (Thymus serpyllum L.) Polyphenols. Carbohydr. Polym. 2014, 111, 901–907. [Google Scholar] [CrossRef]
  32. Santagapita, P.R.; Mazzobre, M.F.; Buera, M.P. Formulation and Drying of Alginate Beads for Controlled Release and Stabilization of Invertase. Biomacromolecules 2011, 12, 3147–3155. [Google Scholar] [CrossRef] [PubMed]
  33. Masson, G.; Jost, R. A Study of Oil-in-Water Emulsions Stabilized by Whey Proteins. Colloid. Polym. Sci. 1986, 264, 631–638. [Google Scholar] [CrossRef]
  34. Álvarez-Castillo, E.; Aguilar, J.M.; Bengoechea, C.; López-Castejón, M.L.; Guerrero, A. Rheology and Water Absorption Properties of Alginate–Soy Protein Composites. Polymers 2021, 13, 1807. [Google Scholar] [CrossRef]
  35. Huertas, S.P.; Terpiłowski, K.; Tomczyńska-Mleko, M.; Wesołowska-Trojanowska, M.; Kawecka-Radomska, M.; Nastaj, M.; Mleko, S.; Pl, M. Surface Properties of Whey Protein Gels. J. Chem. Soc. Pak. 2019, 41, 956–965. [Google Scholar]
  36. Setapa, A.; Ahmad, N.; Mohd Mahali, S.; Mohd Amin, M.C.I. Mathematical Model for Estimating Parameters of Swelling Drug Delivery Devices in a Two-Phase Release. Polymer 2020, 12, 2921. [Google Scholar] [CrossRef] [PubMed]
  37. Peppas, N.A.; Korsmeyer, R.W. Dynamically Swelling Hydrogels in Controlled Release Applications. Hydrogels Med. Pharm. 1986, 3, 109–136. [Google Scholar]
  38. Malekjani, N.; Jafari, S.M. Modeling the Release of Food Bioactive Ingredients from Carriers/Nanocarriers by the Empirical, Semiempirical, and Mechanistic Models. Compr. Rev. Food Sci. Food Saf. 2021, 20, 3–47. [Google Scholar] [CrossRef]
  39. Savić Gajić, I.M.; Savić, I.M.; Svirčev, Z. Preparation and Characterization of Alginate Hydrogels with High Water-Retaining Capacity. Polymers 2023, 15, 2592. [Google Scholar] [CrossRef]
  40. Chang, S.; Mohammadi Nafchi, A.; Karim, A.A. Chemical Composition, Antioxidant Activity and Antimicrobial Properties of Three Selected Varieties of Iranian Fennel Seeds. J. Essent. Oil Res. 2016, 28, 357–363. [Google Scholar] [CrossRef]
  41. Sayed Ahmad, B.; Talou, T.; Saad, Z.; Hijazi, A.; Cerny, M.; Kanaan, H.; Chokr, A.; Merah, O. Fennel Oil and By-Products Seed Characterization and Their Potential Applications. Ind. Crop. Prod. 2018, 111, 92–98. [Google Scholar] [CrossRef]
  42. Repajić, M.; Elez Garofulić, I.; Marčac Duraković, N.; Balun, M.; Cegledi, K.; Cegledi, E.; Dobroslavić, E.; Dragović-Uzelac, V. Physico-Chemical Characterization of Encapsulated Fennel Essential Oil under the Influence of Spray-Drying Conditions. Processes 2024, 12, 577. [Google Scholar] [CrossRef]
  43. Marques, G.R.; de Barros Fernandesa, R.V.; Lago, A.M.T.; Borges, S.V.; Bertolucci, S.K.V.; de Jesus Boari Lima, A.; Botrel, D.A. Spray-Dried Thyme Essential Oil Microparticles Using Different Polymeric Matrices. Dry. Technol. 2021, 39, 1883–1894. [Google Scholar] [CrossRef]
  44. Özkan-Karabacak, A.; Özcan-Sinir, G.; Utku Copur, O. Effects of Drying Methods on the Composition of Volatile Compounds in Fruits and Vegetables. In Flavor Science; Siegmund, B., Leitner, E., Eds.; Technischen Universität Graz: Graz, Austria, 2018; pp. 95–98. [Google Scholar]
  45. Gardeli, C.; Evageliou, V.; Poulos, C.; Yanniotis, S.; Komaitis, M. Drying of Fennel Plants: Oven, Freeze Drying, Effect of Freeze-Drying Time, and Use of Biopolymers. Dry. Technol. 2010, 28, 542–549. [Google Scholar] [CrossRef]
  46. Krokida, M.K.; Philippopoulos, C. Volatility of Apples during Air and Freeze Drying. J. Food Eng. 2006, 73, 135–141. [Google Scholar] [CrossRef]
Figure 1. Schematic representation of the electrostatic extrusion process. (1) Pressure bottle containing prepared emulsions. (2) Bead-producing unit. (3) Vibration unit. (4) A 1 mm single nozzle. (5) Electrode. (6) Dispersion control. (7) Vibration control. (8) LED/ stroboscope. (9) Gelling solution on a magnetic stirrer. (P) = air pressure.
Applsci 14 03522 g001
Figure 2. Plots of fraction of fennel EO alginate beads swelling in water versus time and modeling for the correlation of kinetic parameters: (a) An amount of 1.0% alginate; (b) An amount of 1.5% alginate; (c) An amount of 2% alginate. Data are expressed as mean ± standard deviation. Symbols: experimental data. Lines: modeling results. (m) = model.
Applsci 14 03522 g002
Figure 3. GC-MS chromatogram of the fennel EO prior to encapsulation (1 = α-Pinene; 2 = Camphene; 3 = Sabinene; 4 = β-Pinene; 5 = Myrcene; 6 = α-Phellandrene; 7 = α-Terpinene; 8 = p-Cymene; 9 = D-Limonene; 10 = Eucalyptol; 11 = γ-Terpinene; 12 = cis-Sabinene hydrate; 13 = L-Fenchone; 14 = Camphor; 15 = Estragole; 16 = Nerol (internal standard); 17 = Carvone; 18 = p-Anisaldehyde; 19 = trans-Anethole).
Applsci 14 03522 g003
Table 1. Experimental design and physicochemical characteristics of the fennel EO microbeads produced by an electrostatic extrusion.
SampleDrying
Type
Alginate (%, w/v)Whey Protein (%, w/v)Yield
(%)
Encapsulation Efficiency
(%)
Loading
Capacity
(%)
Sphericity Factor (Wet)Sphericity Factor (Dry)Shrinkage Factor
1Air-drying1048.19 ± 1.3615.46 ± 0.4461.27 ± 1.740.06 ± 0.000.09 ±0.000.34 ± 0.01
20.7549.67 ± 1.4018.01 ± 0.5264.69 ± 1.840.05 ± 0.000.15 ± 0.010.46 ± 0.02
31.539.10 ± 1.1116.85 ± 0.4963.08 ± 1.810.04 ± 0.000.11 ± 0.010.45 ± 0.01
41.5046.91 ± 1.3316.82 ± 0.4853.13 ± 1.520.07 ± 0.000.15 ± 0.010.48 ± 0.02
50.7549.30 ± 1.3918.91 ± 0.5556.47 ± 1.610.03 ± 0.000.17 ± 0.010.50 ± 0.02
61.551.73 ± 1.4615.92 ± 0.4651.65 ± 1.470.05 ± 0.000.22 ± 0.010.55 ± 0.03
72052.92 ± 1.5013.05 ± 0.3839.63 ± 1.140.06 ± 0.000.12 ± 0.010.52 ± 0.03
80.7556.68 ± 1.6013.45 ± 0.3942.01 ± 1.210.06 ± 0.000.06 ± 0.000.50 ± 0.03
91.551.82 ± 1.4716.69 ± 0.4845.80 ± 1.310.03 ± 0.000.07 ± 0.000.51 ± 0.03
10Freeze-drying1043.42 ± 1.236.16 ± 0.1837.88 ± 1.080.09 ± 0.000.18 ± 0.010.17 ± 0.01
110.7537.75 ± 1.076.45 ± 0.1839.54 ± 1.130.05 ± 0.000.14 ± 0.010.23 ± 0.01
121.552.05 ± 1.4742.78 ± 1.2082.60 ± 2.330.03 ± 0.000.10 ± 0.000.17 ± 0.01
131.5047.38 ± 1.3427.58 ± 0.7965.17 ± 1.850.03 ± 0.000.11 ± 0.010.24 ± 0.01
140.7550.70 ± 1.4351.95 ± 1.5178.28 ± 2.230.05 ± 0.000.08 ± 0.010.20 ± 0.01
151.547.57 ± 1.3529.00 ± 0.8366.31 ± 1.880.06 ± 0.000.09 ± 0.010.29 ± 0.01
162053.01 ± 1.5031.04 ± 0.9061.18 ± 1.750.05 ± 0.000.14 ± 0.010.36 ± 0.02
170.7554.50 ± 1.5423.94 ± 0.7054.55 ± 1.560.06 ± 0.000.15 ± 0.010.29 ± 0.03
181.556.97 ± 1.6136.61 ± 1.0665.57 ± 1.870.04 ± 0.000.13 ± 0.000.34 ± 0.04
Results are expressed as mean ± standard deviation.
Table 2. Influence of the applied encapsulation parameters on yield, encapsulation efficiency, and loading capacity of fennel EO microbeads.
Source of VariationNYield
(%)
Encapsulation Efficiency
(%)
Loading Capacity
(%)
Alginate (%, w/v) p < 0.01 *p = 0.17p = 0.14
12445.03 ± 1.64 a17.78 ± 3.63 a58.55 ± 4.63 a
1.52448.93 ± 0.62 b27.17 ± 3.84 a62.20 ± 2.79 a
22454.32 ± 0.67 c23.09 ± 2.77 a52.13 ± 2.93 a
Whey protein (%, w/v) p = 0.83p = 0.29p = 0.18
02448.64 ± 1.07 a18.69 ± 2.62 a53.47 ± 3.22 a
0.752449.76 ± 1.83 a22.70 ± 4.46 a56.52 ± 3.96 a
1.52449.87 ± 1.70 a26.65 ± 3.17 a62.90 ± 3.50 a
Alginate (%, w/v)/
Whey protein (%, w/v) p = 0.87p = 0.04 *p = 0.03 *
1/0845.81 ± 1.48 a10.90 ± 2.69 a49.81 ± 6.72 a
1/0.75843.71 ± 3.48 a12.52 ± 3.42 a52.66 ± 7.28 a
1/1.5845.58 ± 3.78 a29.91 ± 7.19 b73.19 ± 5.42 b
p = 0.11p = 0.04 *p = 0.03 *
1.5/0847.14 ± 0.56 a22.47 ± 3.09 a59.48 ± 2.47 a
1.5/0.75850.00 ± 0.70 a36.34 ± 4.84 b67.86 ± 4.32 b
1.5/1.5849.65 ± 1.33 a22.70 ± 3.77 a59.26 ± 2.21 a
p = 0.30p = 0.53p = 0.63
2/0852.97 ± 0.61 a22.69 ± 5.34 a51.11 ± 6.23 a
2/0.75855.59 ± 0.90 a19.25 ± 3.09 a49.03 ± 3.62 a
2/1.5854.39 ± 1.61 a27.33 ± 5.96 a56.25 ± 5.78 a
Drying type -p < 0.01 *p = 0.06
Air-drying3616.20 ± 0.45 a53.63 ± 3.48 a
Freeze-drying3628.40 ± 3.52 b61.62 ± 2.09 a
Mean7249.43 ± 0.8722.30 ± 2.0157.14 ± 2.13
N = number of trials. Results are expressed as mean ± standard error. * significant at p ≤ 0.05. Values within groups marked with different letters are statistically different at p ≤ 0.05.
Table 3. Influence of the applied encapsulation parameters on sphericity and size reduction in the obtained microbeads.
Source of VariationNSphericity Factor (Wet)Sphericity Factor (Dry)Shrinkage Factor
Alginate (%, w/v) p = 0.93p = 0.03 *p < 0.01 *
1.03600.05 ± 0.00 a0.13 ± 0.00 b0.30 ± 0.00 a
1.53600.05 ± 0.00 a0.14 ± 0.00 b0.38 ± 0.01 b
2.03600.05 ± 0.00 a0.11 ± 0.00 a0.42 ± 0.02 b
Whey protein (%, w/v) p < 0.01 *p = 0.65p = 0.39
03600.06 ± 0.00 b0.13 ± 0.00 a0.35 ± 0.00 a
0.753600.05 ± 0.00 a.b0.13 ± 0.00 a0.36 ± 0.01 a
1.53600.04 ± 0.00 a0.12 ± 0.00 a0.39 ± 0.02 a
Alginate (%, w/v)/Whey protein (%, w/v) p = 0.02 *p = 0.30p < 0.01 *
1/01200.07 ± 0.01 b0.14 ± 0.03 a0.25 ± 0.02 a
1/0.751200.04 ± 0.01 a0.15 ± 0.01 a0.35 ± 0.01 b
1/1.51200.03 ± 0.01 a0.12 ± 0.03 a0.21 ± 0.02 a
p = 0.24p = 0.69p = 0.06
1.5/01200.06 ± 0.01 a0.14 ± 0.02 a0.50 ± 0.01 a
1.5/0.751200.05 ± 0.01 a0.12 ± 0.02 a0.50 ± 0.01 a
1.5/1.51200.04 ± 0.01 a0.14 ± 0.02 a0.53 ± 0.01 a
p < 0.01 *p = 0.01 *p = 0.88
2/01200.07 ± 0.01 b0.15 ± 0.01 b0.35 ± 0.04 a
2/0.751200.05 ± 0.01 a0.10 ± 0.02 a0.37 ± 0.03 a
2/1.51200.03 ± 0.01 a0.09 ± 0.02 a0.34 ± 0.04 a
Drying type -p = 0.72p < 0.01 *
Air-drying5400.13 ± 0.00 a0.48 ± 0.00 b
Freeze-drying5400.13 ± 0.00 a0.26 ± 0.00 a
Mean10800.05 ± 0.000.13 ± 0.010.37 ± 0.02
N = number of trials. Results are expressed as mean ± standard error. * significant at p ≤ 0.05. Values within group marked with different letters are statistically different at p ≤ 0.05.
Table 4. The kinetic parameters for the swelling kinetics of fennel EO alginate beads correlated using the power law model.
Alginate (%, w/v)Whey Protein (%, w/v)knR2
100.37430.19570.9605
0.750.05830.56750.9188
1.53.22 × 10−51.97040.9358
1.500.41290.16780.9803
0.750.15720.35490.9715
1.54.36 × 10−51.97370.9776
200.00071.4255090.9914
0.750.29180.2358930.9722
1.50.00041.47770.9436
k = constant specific to the gel network; n = diffusion exponent; R2 = correlation coefficient.
Table 5. Chemical composition (mg/mL) of initial and encapsulated fennel EO obtained under optimal conditions.
No.CompoundRIRTp-ValueInitial
Fennel EO
Encapsulated Fennel EO
mg/mL
Monoterpene hydrocarbons
1α-Pinene9375.030<0.001 *68.14 ± 0.60 b12.14 ± 0.09 a
2Camphene9535.398<0.001 *1.84 ± 0.06 b0.72 ± 0.02 a
3Sabinene9766.002<0.001 *0.63 ± 0.01 b0.42 ± 0.01 a
4β-Pinene9806.109<0.001 *2.79 ± 0.03 b1.01 ± 0.03 a
5Myrcene9926.459<0.001 *10.63 ± 0.14 b3.96 ± 0.01 a
6α-Phellandrene10066.862<0.001 *6.12 ± 0.04 b2.70 ± 0.03 a
7α-Terpinene10197.236<0.001 *1.19 ± 0.01 b0.48 ± 0.05 a
8p-Cymene10277.479<0.001 *1.73 ± 0.01 b1.05 ± 0.01 a
9D-Limonene10317.609<0.001 *30.15 ± 0.32 b7.78 ± 0.08 a
11γ-Terpinene10628.605<0.001 *2.00 ± 0.02 b1.41 ± 0.01 a
12cis-Sabinene hydrate10708.9020.002 *0.43 ± 0.01 b0.38 ± 0.01 a
Oxygenated monoterpenes
10Eucalyptol10347.704<0.001 *0.71 ± 0.06 b0.34 ± 0.01 a
13L-Fenchone10899.643<0.001 *155.50 ± 1.23 b88.47 ± 0.69 a
14Camphor114611.742<0.001 *2.06 ± 0.02 b1.39 ± 0.03 a
16Carvone124315.6840.4041.17 ± 0.02 a1.15 ± 0.03 a
Phenylpropanoids
15Estragole119813.923<0.001 *31.29 ± 0.22 b19.54 ± 0.21 a
18trans-Anethole128817.605<0.001 *646.53 ± 4.38 b541.85 ± 3.27 a
Others
17p-Anisaldehyde125516.176<0.001 *20.00 ± 0.19 b7.56 ± 0.04 a
Total (%)Monoterpene hydrocarbons<0.001 *12.78 ± 0.01 b4.63 ± 0.04 a
Oxygenated monoterpenes<0.001 *16.22 ± 0.02 b13.19 ± 0.07 a
Phenylpropanoids<0.001 *68.96 ± 0.02 a81.09 ± 0.09 b
Others<0.001 *2.04 ± 0.01 b1.09 ± 0.01 a
EO = essential oil. Results are expressed as mean ± standard deviation. * significant at p ≤ 0.05. Values with different letters within row are statistically different at p ≤ 0.05.
Disclaimer/Publisher’s Note: The statements, opinions and data contained in all publications are solely those of the individual author(s) and contributor(s) and not of MDPI and/or the editor(s). MDPI and/or the editor(s) disclaim responsibility for any injury to people or property resulting from any ideas, methods, instructions or products referred to in the content.

