
A Comparison of Dental Arch Width and Length on 3D Digital and Plaster Models
by
 , and
, and
Valentina Petrović
1,
Martina Šlaj
2,
Mia Buljan
3,
Luka Morelato
4,
Ana Zulijani
5,6,* and
Berislav Perić
2,7 1
Private Dental Practice, 10000 Zagreb, Croatia
2
School of Dental Medicine, University of Zagreb, 10000 Zagreb, Croatia
3
General Hospital “Dr Josip Benčević”, 35000 Slavonski Brod, Croatia
4
Private Dental Practice, 52440 Poreč, Croatia
5
Department of Oral Surgery, Clinical Hospital Center Rijeka, 51000 Rijeka, Croatia
6
Department of Dental Medicine, Faculty of Dental Medicine and Health, Josip Juraj Strossmayer University of Osijek, 31000 Osijek, Croatia
7
Department of Oral and Maxillofacial Surgery, University Hospital Dubrava, 10000 Zagreb, Croatia
*
Author to whom correspondence should be addressed.
Appl. Sci. 2024, 14(9), 3572; https://doi.org/10.3390/app14093572
Submission received: 30 March 2024
/
Revised: 20 April 2024
/
Accepted: 22 April 2024
/
Published: 24 April 2024
(This article belongs to the Section Applied Dentistry and Oral Sciences)
Abstract
:The aim of the study was to determine potential deviation in measurements of commonly used orthodontic variables, including intermolar width (IMW), intercanine width (ICW), and arch perimeter (AP), when measured on three-dimensional images compared to measurements performed on plaster models obtained from alginate impressions using a hand-held digital vernier caliper. A total of 120 sets of models were divided into four groups: plaster models made from an alginate impression, digitized plaster models made from an alginate and silicone impression, and digital models obtained via intraoral scan. The repeated measurements analysis of variance (ANOVA) with Sidak post-hoc test was applied to test differences in measurements between the four methods. The results show better agreement for intermolar and intercanine width (r = 0.468–0.967) and smaller measurement error (ME = 0.53–1.07) compared to arch length (r = 0.422–0.477; ME = 2.04–2.89). Better agreement levels were more frequently observed between plaster models with intraoral scans than between digitized plaster models. The deviations in intermolar and intercanine width measurements between the hand-held digital vernier caliper and digital analyses were found to be clinically insignificant. The observed difference in arch perimeter suggests that curved measurements may not be clinically acceptable.
1. Introduction
Accurate diagnostics in orthodontic treatment planning are essential for correct identification of the orthodontic problem and the underlying causes. This allows orthodontists to create a personalized treatment plan and increases the likelihood of achieving optimal results for each patient. Among the standard components of orthodontic diagnostic records, conventional plaster casts play a significant role in diagnostic procedures and consequent treatment planning, evaluation of the treatment progress and outcomes, and record keeping [1]. However, the impression and pouring process of plaster casts presents certain drawbacks that can lead to errors, such as the distortion of impression material and volumetric deformation of the plaster casts [2,3]. Furthermore, plaster casts require a physical storage space, and there is the risk of damage or breakage [2,3,4,5,6].
In recent years, the digitization of orthodontic dental models has made significant changes in orthodontics, providing numerous benefits. Digital models have significantly improved efficiency and accessibility, allowing quick access to patient records and seamless exchange of patient data for communication with other specialists [2]. Furthermore, digital dental models offer significant advantages in treatment planning, as they enable the creation of virtual setups and the fabrication of customized aligners and brackets [7]. Additionally, digital models eliminate the need for physical storage space and the risk of damage or breakage [2].
Digital three-dimensional (3D) models can be obtained by scanning a plaster model or impression with a 3D model scanner, directly scanning dental arches with an intraoral scanner, or generating from CBCT scans [8].
Previous studies have demonstrated the high accuracy, reproducibility, and reliability of orthodontic measurements made on digitized models obtained from plaster casts or impressions compared to conventional plaster models [9,10,11,12,13,14]. It is important to note that digitized models share certain drawbacks with plaster models, including impression and pouring process errors, as well as patient discomfort. The disadvantages associated with plaster models can be avoided by using direct intraoral scanning [15]. However, several factors can impact the precision of digital impression, such as the examiner’s experience, the scanning strategy, and software algorithms [16,17,18,19,20,21].
Most studies have reported that intraoral scanners have higher accuracy compared to digitized models or conventional plaster models, especially when the scan length is shorter. When comparing the accuracy of the full arch impression, it appears to be lower than that of conventional plaster models [22,23,24,25,26]. Moreover, the presence of edentulous areas, restorative materials, saliva, or blood can also affect the accuracy of digital impressions [27,28,29].
The objective of this study was to determine potential deviation in measurements of commonly used orthodontic variables—intermolar width (IMW), intercanine width (ICW), and arch perimeter (AP)—when measured on three-dimensional images compared to measurements performed on plaster models obtained from alginate impressions using a hand-held digital vernier caliper.
2. Materials and Methods
The study was approved by the Ethics Committee of the School of Dental Medicine, University of Zagreb, Croatia (05-PA-15-12/2017 on 14 December 2017), and it was conducted in accordance with the Declaration of Helsinki. All subjects provided written informed consent.
The study involved 30 randomly selected subjects, each with no missing permanent teeth from the first molar to the first molar in both jaws and without abnormal morphology or defects that could affect the crown diameter. A minimum sample size of 24 study models per group was estimated using a power of more than 80% to detect a difference of 0.05 mm, with a standard deviation of 0.06 mm and a significance level of 0.05. An online calculator was used (https://statulator.com/SampleSize/ss2M.html; accessed on 2 February 2019).
Four sets of study models of each subject were taken by the same person using conventional and digital impression techniques. The workflow of the procedures is shown in Figure 1.
Full-arch impressions of the maxillary and mandibular were taken with alginate (Orthotrace alginate, Cavex, Haarlem, Holland) and silicone (3M ESPE, Seefeld, Germany) material. The impressions were poured after half an hour with a type IV dental stone (Sherakfo-gips, Shera, Lemfoerde, Germany) according to the manufacturer’s guidelines. After 40 min, the impressions were removed from the plaster models. The plaster models were stored at room temperature for 72 h before being scanned using a laboratory Neway scanner (Open Tech 3D, Brescia, Italy) to create digital models according to the manufacturer’s instructions. The same plaster model obtained from the alginate impression was used for manual and digital measurements. Direct intraoral digital impressions of both the arches and occlusion were taken using the Trios 3 intraoral scan device (3Shape, Copenhagen, Denmark). The scanning process began with the occlusal surface of the left first molar, followed by slow progression towards the incisors and continuing until the last molar on the right side. Then, the scan probe was rotated to the lingual side, scanning along the lingual surface until reaching the last molar on the opposite side. Subsequently, the scan probe was smoothly rolled to the buccal side, ensuring comprehensive coverage of the entire arch to the opposite side. When scanning the maxillary arch, a similar procedure was followed, starting from the occlusal side, progressing to the buccal, and concluding with the palatal side.
The measurements were simultaneously and independently performed by two examiners. After one month, both examiners independently repeated measurements of 5 randomly selected models to evaluate measurement error (both random and systematic error).
On the plaster model, measurements were performed manually using the digital caliper Mitutoyo (Ontario, Canada). Measurements of digital models were made using Ortho Analyzer software (version 1.5.1.7, 3Shape, Copenhagen, Denmark).
The measurements made on both arches (Mx-maxillary, Md-mandibular) included the following:
- -
- ICW—transversal width between the tips of left and right canines (Figure 2);
- -
- IMW—transversal width between the mesiobuccal cusp tips of the left and right first permanent molars (Figure 2);
- -
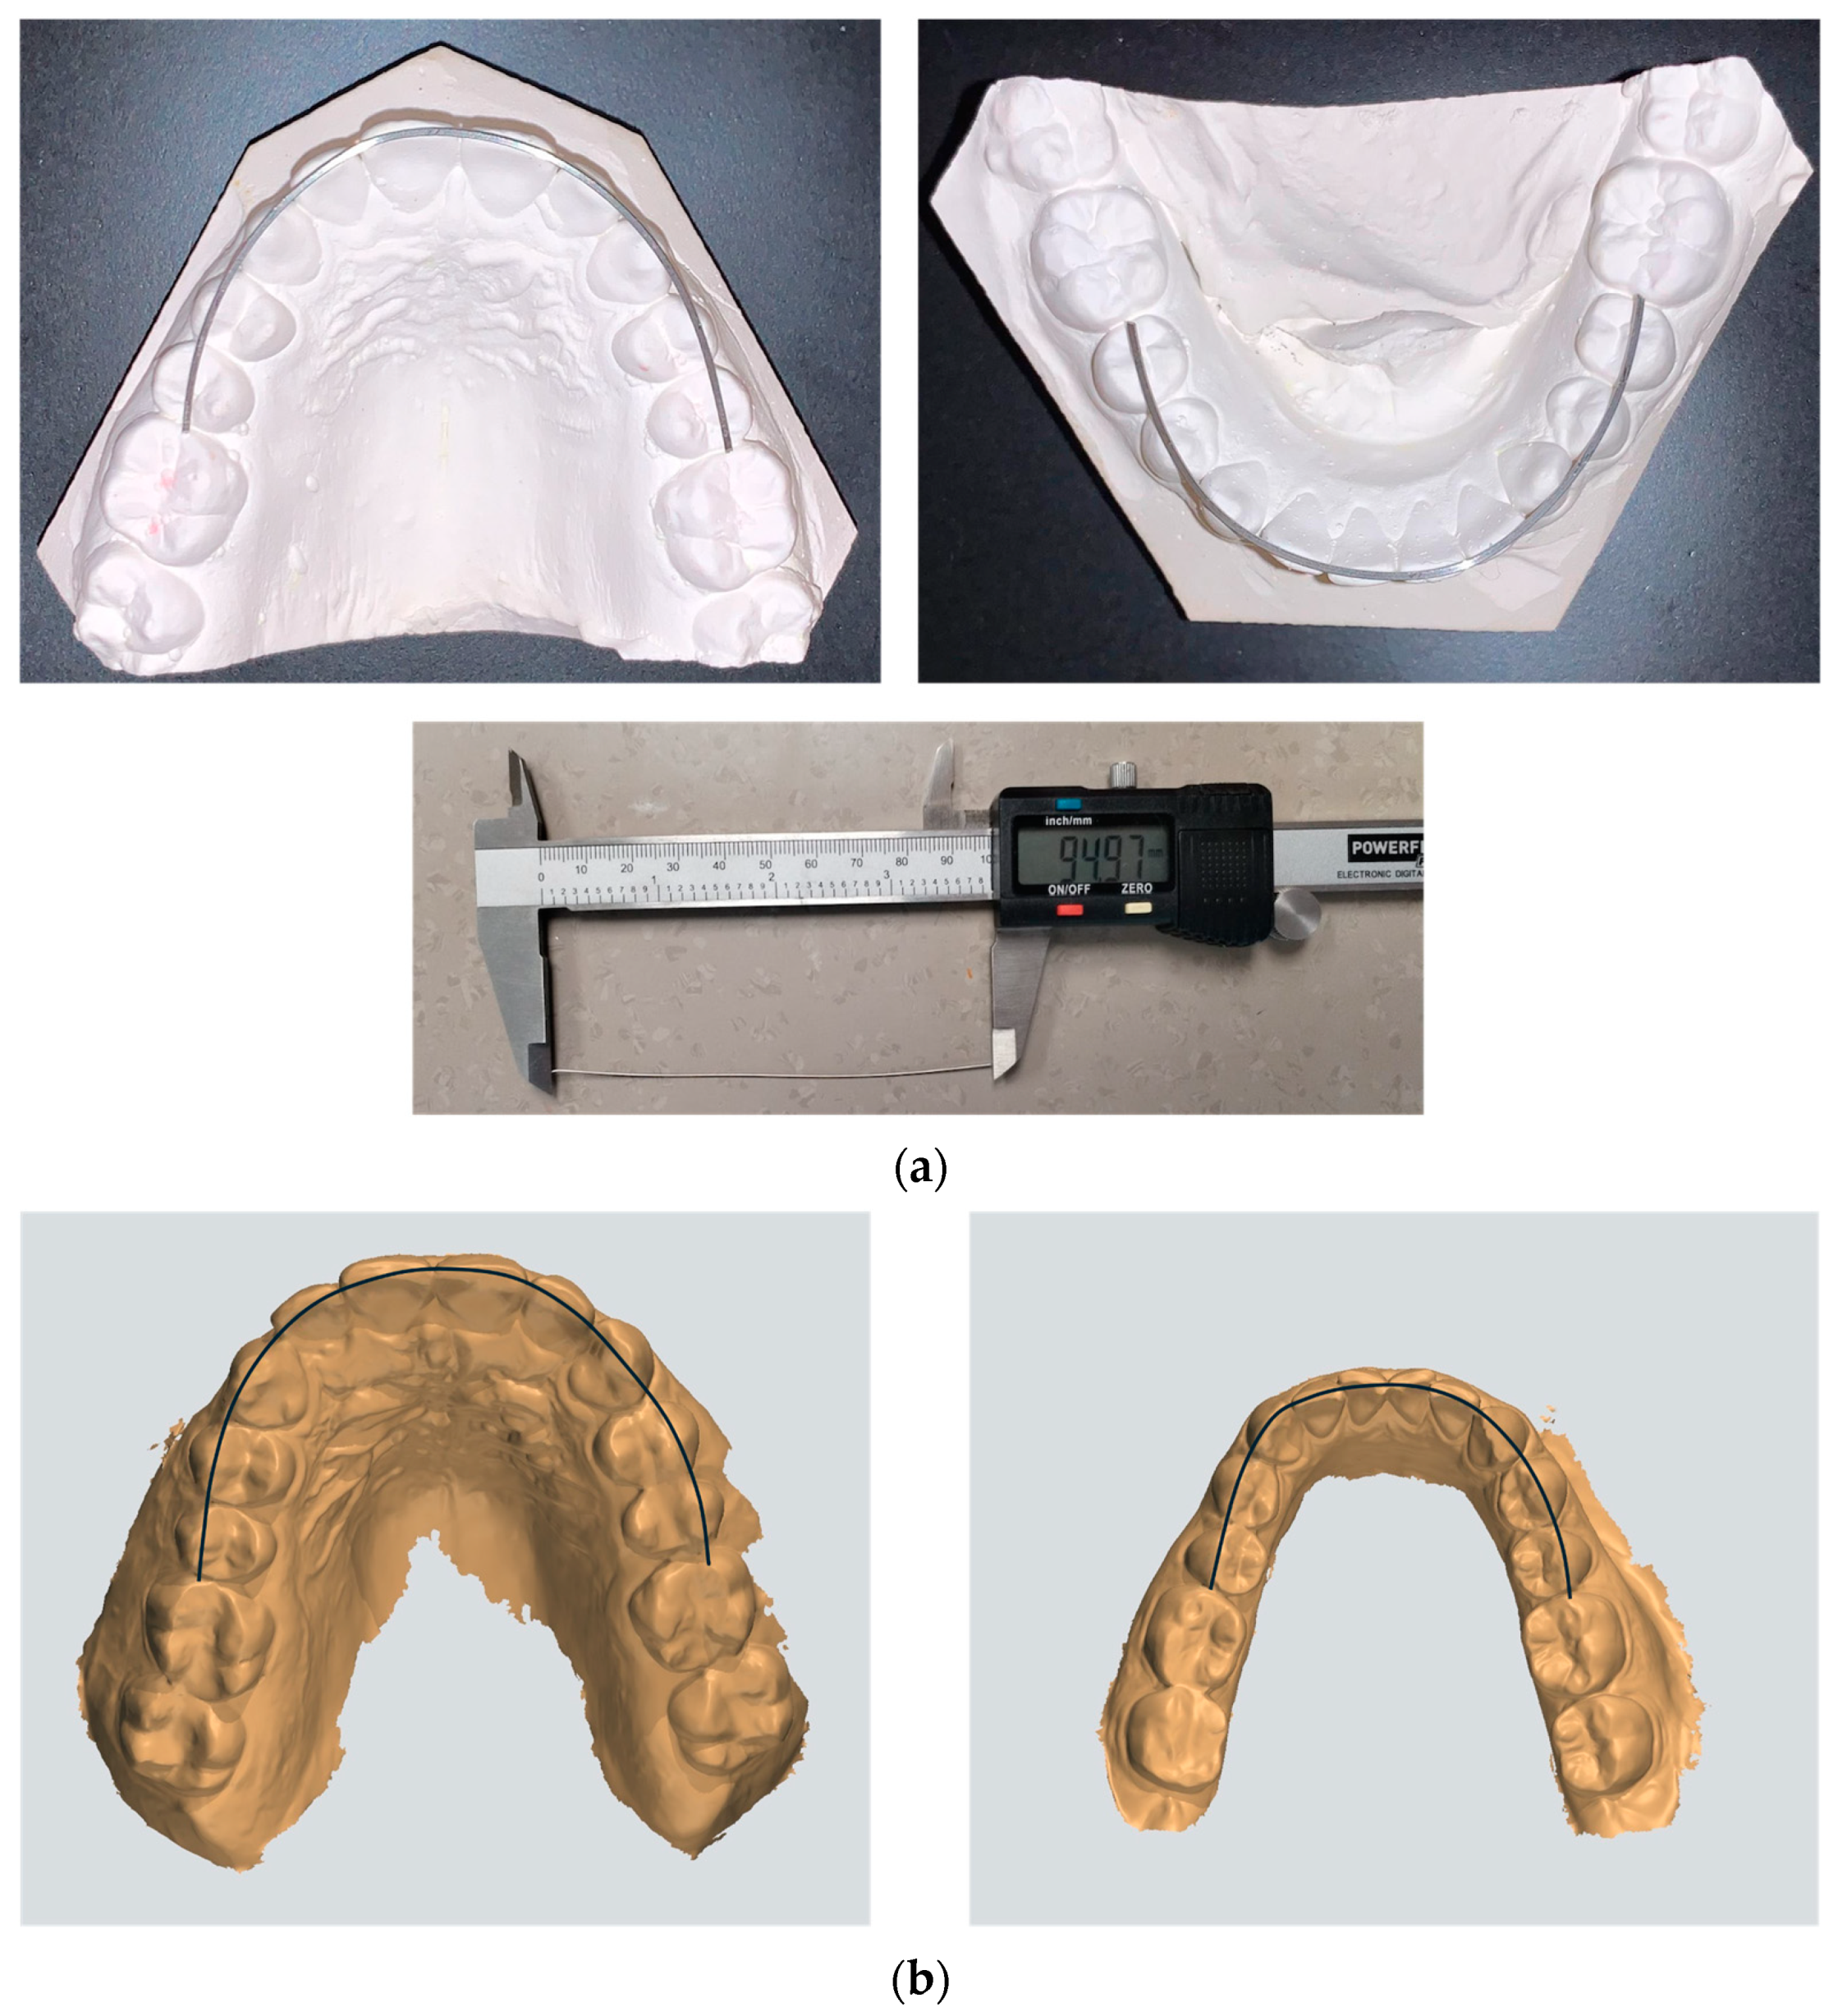
- AP—curve line connecting the mesial contact point of the permanent first molars along the buccal cusps of the premolars and incisal edges of the anterior teeth. The arch perimeter on the plaster models was determined as the length of a soft wire (e.g., brass wire) which was modeled to the individual shape of the maxillary and mandibular arch (Figure 3).
Statistical analysis was performed using the IBM SPSS Statistics software (Version 22.0, IBM SPSS Inc., Chicago, IL, USA). After verifying the normality of the distribution using the Shapiro–Wilk test, parametric and non-parametric statistical tests were performed. The random error was calculated using the Dahlberg formula:
where d represents the difference between two measurements and N represents the sample size which was measured. The systematic error was assessed using a paired samples t-test. The intraclass correlation coefficient (ICC) was calculated (with 95% confidence interval; CI) to compare results of measurements between plaster models and digital models, and interpretation was based on predefined criteria. An ICC < 0.5 was considered to indicate poor agreement, 0.5 to 0.75 was considered moderate, and 0.75 to 0.9 was considered good, while a value greater than 0.9 was considered excellent. The repeated measurements analysis of variance (ANOVA) with Sidak post-hoc test was applied to test differences in measurements between the four methods. The measurement error (ME) was determined as the square root of the residual variance obtained from the analysis of variance. The smallest detectable change (SDC) was calculated using a formula involving the ME; SDC = 1.96 × √2 ME. The concordance between measurement methods was assessed by calculating the mean value of measurement differences and constructing a concordance interval. Additionally, a t-test was conducted to detect deviations from the hypothetical mean of 0. The proportion of cases falling within the matching limits was recorded. In cases where the t-test showed no significant differences, a linear regression analysis was performed to examine any potential proportionality bias. The interpretation of effect sizes (r, V, and η) was based on Cohen’s criteria. Effect sizes within the range of 0.1–0.3 were classified as a small effect size, 0.3–0.5 were considered a moderate to large effect size, and 0.5–0.7 were considered a large effect size, while effect sizes greater than 0.7 were considered a very large effect size. For eta-squared, effect sizes <0.09 were interpreted as a small effect size, 0.09–0.25 were interpreted as a moderate effect size, 0.25–0.49 as a large effect size, and >0.49 as a very large effect size.
3. Results
The difference in the measurements was found to be small and not statistically significant. The differences observed in the digital measurements were greater in contrast to manual measurements obtained from plaster models (Table 1 and Table 2).
The difference in measurements between the two examiners was small and not statistically significant. Only the case of the intraoral scan (IOS) was significant, amounting 0.55 ± 0.3 mm (p = 0.014) with a random error of 0.17, according to Dahlberg (Table 2). The intra-examiner difference was only significant in the case of the digitalized plaster model obtained from the alginate impression (DPMA), amounting 0.06 ± 0.01 mm (p = 0.001) with a random error of 0.02 (Table 1).
3.1. Comparison of Methods for Measuring Maxillary ICW
The statistically significant differences were observed between the methods with a large effect size (p < 0.001; η2 = 0.427; Table 3). The manual measurements significantly differed from all digital methods in the range from 0.72 mm to 0.83 mm. In contrast, no significant differences were observed between the digital methods within the range from 0.03 mm to 0.12 mm. The agreement between the three methods was excellent (ICC = 0.904; 95% CI 0.780–0.956; p < 0.001), with a small measurement error (ME = 0.47).
When comparing the difference between manual measurements and the digital measurements made on intraoral scans, the agreement was good (ICC = 0.844; 95% CI 0.459–0.941; p < 0.001; Table 4). The measurement error was small (ME = 0.62 mm), and a statistically significant fixed deviation of 0.72 mm was detected compared to the hypothetical mean deviation of 0 mm (p < 0.001). The confidence interval was relatively wide, ranging from −1.00 to 2.43, with 93.3% of the subjects’ measurements falling within this range (only two cases were outside the range). A strong correlation (r = 0.899; p < 0.001) was found between manual measurements and digital measurements obtained from the intraoral scan.
Comparing the difference between manual measurements and the digital measurements obtained from digitized models made from the alginate impression, a good agreement was observed (ICC = 0.821; p < 0.001; Table 4), with a small measurement error of 0.63 mm. A statistically significant fixed deviation of 0.83 mm was detected compared to the hypothetical mean deviation of 0 mm (p < 0.001). The confidence interval was relatively wide, ranging from −0.90 to 2.57, with 93.3% of the subjects’ measurements falling within this range (only two cases were outside the range).
Similarly, when comparing manual measurements with the digital measurements obtained from digitized models made from the silicone impression, a good agreement was observed, with a small measurement error (ICC = 0.831; p < 0.001, ME = 0.60 mm; Table 4). Additionally, a statistically significant fixed deviation of 0.80 mm was detected. The measurements from 96.7% of subjects were within the confidence interval.
3.2. Comparison of Methods for Measuring Mandibular ICW
The intercanine width of the mandible was significantly different between the methods with large effect sizes (p < 0.001; η2 = 0.385; Table 3). However, only the manual measurements significantly deviated from all digital methods, with differences in the range from 1.17 mm to 1.23 mm. No significant differences (0.004–0.06 mm) were found between the digital methods. The agreement between the three methods was moderate, with a small measurement error (ICC = 0.695; 95% CI 0.472–0.839; p < 0.001; ME = 0.77).
3.3. Comparison of Methods for Measuring Maxillary IMW
The measurement methods were significantly different with a moderate effect size (p < 0.002; η2 = 0.206; Table 3), with manual measurements differing significantly from measurements obtained from digitalized models in a range from 0.23 mm to 0.45 mm, but not from the measurements made on the intraoral scans (range 0.00–0.22 mm). The agreement between the three methods was excellent (ICC = 0.977; 95% CI 0.957–0.988; p < 0.001) with a small measurement error (ME = 0.43 mm).
When comparing the manual measurements with digital measurements made on the intraoral scans, an excellent agreement was found (ICC = 0.967; 95% CI 0.931–0.984; p < 0.001; Table 4). The measurement error was small (ME = 0.56 mm), and a statistically insignificant fixed deviation of 0.24 mm was detected compared to the hypothesized average deviation of 0 mm. Linear regression showed that there was no proportionality bias, indicating that one method did not consistently give higher or lower values than the other method. The confidence interval was from −1.32 to 1.79, and the measurements of 93.3% of subjects fell within this range (two were outside this range).
3.4. Comparison of Methods for Measuring Mandibular IMW
The measurement methods showed significant differences (p < 0.001; η2 = 0.414; Table 3), ranging from 0.01 to 1.13 mm. No significant differences were observed among the digital measurements (range 0.01–0.22 mm). The agreement between the three methods was excellent (ICC = 0.977; 95% CI 0.957–0.988; p < 0.001), with a small measurement error (ME = 0.43 mm).
The reproducibility of the measurements was found to be good, with a correlation coefficient of r = 0.943 (95% CI 0.867–0.975; p < 0.001). The agreement between manual measurements and digital measurements obtained from the intraoral scan and digitalized plaster models made from the silicone impression was slightly better.
3.5. Comparison of Methods for Measuring Maxillary AP
A significant difference between measurements was observed (p < 0.001; η2 = 0.601; Table 3). The manual measurements significantly differed from all measurements obtained from digital models in a range of 3.55–3.78 mm. In contrast, no significant difference was observed between measurements obtained from digital methods within a range from 0.03 to 0.23 mm. The level of agreement between the three methods was moderate (ICC = 0.664; 95% CI 0.324–0.841; p < 0.001), with a large measurement error (ME = 1.51 mm).
Comparing manual measurements on plaster models with digital measurements on each group of digital models, the agreement was poor (ICC = 0.447–0.777). The measurement error was large, ranging from 2.04 to 2.12 mm, but smaller than the detectable change (Table 4). A statistically significant fixed deviation from 3.55 to 3.78 mm was detected compared to a hypothetically set average deviation of 0 mm (p < 0.001). Measurements in 93.3% of subjects fell within the range of reliability, but the range was wide (over 10 mm).
3.6. Comparison of Methods for Measuring Mandibular AP
The measurement methods showed significant differences, with the manual measurements differing significantly from digital measurements in a range from 2.48 to 2.64 mm. The differences among the digital measurements were not large or statistically significant (0.06–0.22 mm; Table 3). The agreement between methods was moderate (ICC = 0.616; 95% CI 0.416–0.776; p < 0.001), with a measurement error of 2.06 mm. When analyzing the manual measurements obtained from plaster models with the measurements made on digital models, the agreement was poor (ICC = 0.437–0.459), with a measurement error of 2.89 mm (Table 4).
4. Discussion
Precise measurements and thorough analysis of study models are essential elements for the efficacy of orthodontic treatment. The present study was performed to evaluate and compare commonly used orthodontic variables (IMW, ICW, and AP) on plaster models and 3D digital models. The canine and molar relationships have been identified as predictors of stability of orthodontic treatment results, while arch length is one of the most crucial parameters for space analysis (representing available space) [25,30].
The measurements of the maxillary and mandibular intercanine and intermolar width significantly differed between the methods. Digital analyses gave significantly lower values. The greater difference in width measurements between manual and digital methods was 1.23 mm. In several studies, the discrepancy in measurements between manual calipers and digital analyses was found to be clinically insignificant, with variances of less than 1.5 mm [2,31,32]. These findings underscore that the differences in measured values are minor and do not impact therapeutic diagnosis. In our study, the agreement between methods for mandibular ICW measurements was weaker than that for the maxillary ICW, possibly due to the smaller dimensions being assessed. The differences between manual and digital measurements of mandibular and maxillary IMW were smaller than the difference observed in ICW, which confirms that longer dimensions have better agreement between measurement methods. Regarding the mandibular and maxillary arch perimeter, the obtained differences between the measurements on plaster models significantly differed from digital models in a range from 2.48 to 2.78 mm, which could be clinically significant. In contrast, no significant difference was observed between measurements obtained from digital models.
The linear distances (ICW and IMW) obtained from digital models were observed to be smaller compared with the measurements taken from plaster models. In contrast, digital measurements yielded larger values when assessing the arch perimeter. Some authors have also noted that digital measurements of linear distances often result in smaller values compared to manual measurements [12,13,33].
The study conducted by Jiménez-Gayosso et al. demonstrated certain similarities in comparison to our results. Notably, their research highlighted superior measurement repeatability in digital models, particularly those obtained from intraoral scans and silicone impressions, when compared to plaster models. Furthermore, the alignment patterns observed in the maxilla and mandible, emphasizing advantages in arch width over length and intermolar dimensions over intercanine ones, align with our findings. It is noteworthy that the differences identified were more frequently associated with random errors than with systematic discrepancies [33].
The comparison between 3D digital models and plaster models in this study highlights the advantages of digital models in terms of accuracy and reliability. The standardized nature of digital scanning techniques contributes to the enhanced consistency observed among digital models, offering potential benefits for orthodontic assessments and treatment planning [9,12,21].
The identification of points represents significant sources of random measurement error, with difficulties in accurately identifying and placing landmarks leading to potential inaccuracies. The reliability of model analysis is substantially influenced by the accuracy of landmark identification, which is closely related to the shape of the anatomical structure being measured and the operator’s experience [32,34]. In this study, we demonstrated that the precision of defining anatomical landmarks can lead to error reduction if the examiners have experience. However, it is important to recognize that inaccuracies in point identification may exist. Point positioning, on the other hand, relies on the measuring instrument used and the specific item being measured [3].
Other factors that may influence the accuracy and repeatability of measurements include dimensional changes in impression materials, during plaster cast production and during the scanning process [9,35,36].
The results of this study support the reliability of digital orthodontic models, specifically those originating from intraoral scans, in providing accurate measurements of orthodontic variables. Nevertheless, clinicians and researchers must meticulously evaluate the variables being studied and acknowledge potential sources of variation. It is essential to have a thorough understanding of the strengths and limitations of digital models when incorporating them into orthodontic practice and research.
The limitations of the present study include the potential errors arising from differences in dentists’ impression-taking or in pouring techniques and distortion of impression and pouring materials. Moreover, digital models present a challenge to identifying and placing exact landmarks on the image. Future research incorporating more comprehensive measurements is essential to evaluate assessments of digital model accuracy.
5. Conclusions
Generally greater repeatability was obtained when using digital calipers on plaster models. A significant difference in measurements was found when comparing manual and digital methods, while no significant difference was found between the digital methods. Better levels of agreement were observed in the width of the maxillary arch compared to its length, and better agreement was found for intermolar width than for intercanine width.
Author Contributions
Conceptualization, V.P. and M.Š.; methodology, A.Z.; validation, V.P., M.B. and L.M.; formal analysis, V.P. and M.Š.; investigation, V.P. and M.B.; data curation, B.P.; writing—original draft preparation, V.P. and A.Z.; writing—review and editing, B.P. All authors have read and agreed to the published version of the manuscript.
Funding
This research received no external funding.
Institutional Review Board Statement
The study was conducted in accordance with the Declaration of Helsinki and approved by the Ethics Committee of the School of Dental Medicine, University of Zagreb (05-PA-15-12/2017 on 14 December 2017).
Informed Consent Statement
Informed consent was obtained from all subjects involved in the study.
Data Availability Statement
The study was not publicly funded. Data are not open-ended.
Conflicts of Interest
Valentina Petrović and Luka Morelato were employed by Private Dental Practice. Mia Buljan was employed by General Hospital “Dr Josip Benčević”. The remaining authors declare that the research was conducted in the absence of any commercial or financial relationships that could be construed as a potential conflict of interest.
References
- Rischen, R.J.; Breuning, K.H.; Bronkhorst, E.M.; Kuijpers-Jagtman, A.M. Records needed for orthodontic diagnosis and treatment planning: A systematic review. PLoS ONE 2013, 8, e74186. [Google Scholar] [CrossRef] [PubMed]
- Wiranto, M.; Engelbrecht, W.; Nolthenius, H.; van der Meer, W.; Ren, Y. Validity, reliability, and reproducibility of linear measurements on digital models obtained from intraoral and cone-beam computed tomography scans of alginate impressions. Am. J. Orthod. Dentofac. Orthop. 2013, 143, 140–147. [Google Scholar] [CrossRef] [PubMed]
- Leifert, M.F.; Leifert, M.M.; Efstratiadis, S.S.; Cangialosi, T.J. Comparison of space analysis evaluations with digital models and plaster dental casts. Am. J. Orthod. Dentofac. Orthop. 2009, 136, 16-e1. [Google Scholar] [CrossRef] [PubMed]
- Lippold, C.; Kirschneck, C.; Schreiber, K.; Abukiress, S.; Tahvildari, A.; Moiseenko, T.; Danesh, G. Methodological accuracy of digital and manual model analysis in orthodontics—A retrospective clinical study. Comput. Biol. Med. 2015, 62, 103–109. [Google Scholar] [CrossRef] [PubMed]
- Wan Hassan, W.N.; Othman, S.A.; Chan, C.S.; Ahmad, R.; Ali, S.N.; Abd Rohim, A. Assessing agreement in measurements of orthodontic study models: Digital caliper on plaster models vs 3-dimensional software on models scanned by structured-light scanner. Am. J. Orthod. Dentofac. Orthop. 2016, 150, 886–895. [Google Scholar] [CrossRef] [PubMed]
- Kumar, A.; Ghafoor, H. Rapid prototyping: A future in orthodontics. J. Orthod. Res. 2016, 4, 1–7. [Google Scholar] [CrossRef]
- Taneva, E.; Kusnoto, B.; Evans, C.A. Issues in Contemporary Orthodontics; IntechOpen: London, UK, 2015. [Google Scholar] [CrossRef]
- Ender, A.; Mehl, A. Accuracy of complete-arch dental impressions: A new method of measuring trueness and precision. J. Prosthet. Dent. 2013, 109, 121–128. [Google Scholar] [CrossRef]
- Rossini, G.; Parrini, S.; Castroflorio, T.; Deregibus, A.; Debernardi, C. Diagnostic accuracy and measurment sensitivity of digital models for orthodontic purposes: A systematic review. Am. J. Orthod. Dentofac. Orthop. 2016, 149, 161–170. [Google Scholar] [CrossRef]
- Zilberman, O.; Huggare, J.; Parikakis, K. Evaluation of the validity of tooth size and arch width measurments using conventional and three- dimentional virtual orthodontic models. Angle Orthod. 2003, 73, 301–306. [Google Scholar] [CrossRef]
- Fleming, P.; Marinho, V.; Johal, A. Orthodontic measurements on digital study models compared with plaster models: A systematic review. Orthhod. Craniofac. Res. 2011, 14, 1–16. [Google Scholar] [CrossRef]
- Santoro, M.; Galkin, S.; Teredesai, M.; Nicolay, O.; Cangialosi, T. Comparison of measurements made on digital and plaster models. Am. J. Orthod. Dentofac. Orthop. 2003, 124, 101–105. [Google Scholar] [CrossRef] [PubMed]
- Stevens, D.R.; Flores-Mir, C.; Nebbe, B.; Raboud, D.W.; Heo, G.; Major, P.W. Validity, reliability, and reproducibility of plaster vs digital study models: Comparison of peer assessment rating and Bolton analysis and their constituent measurements. Am. J. Orthod. Dentofac. Orthop. 2006, 129, 794–803. [Google Scholar] [CrossRef] [PubMed]
- Tomassetti, J.J.; Taloumis, L.J.; Denny, J.M.; Fischer, J.R., Jr. A comparison of 3 computerized Bolton tooth-size analyses with a commonly used method. Angle Orthod. 2001, 71, 351–357. [Google Scholar] [CrossRef] [PubMed]
- Tomita, Y.; Uechi, J.; Konno, M.; Sasamoto, S.; Iijima, M.; Mizoguchi, I. Accuracy of digital models generated by conventional impression/plaster-model methods and intraoral scanning. Dent. Mater. J. 2018, 37, 628–633. [Google Scholar] [CrossRef] [PubMed]
- Marques, S.; Ribeiro, P.; Falcão, C.; Lemos, B.F.; Ríos-Carrasco, B.; Ríos-Santos, J.V.; Herrero-Climent, M. Digital Impressions in Implant Dentistry: A Literature Review. Int. J. Environ. Res. Public Health 2021, 18, 1020. [Google Scholar] [CrossRef] [PubMed]
- Schmalzl, J.; Róth, I.; Borbély, J.; Hermann, P.; Vecsei, B. The effect of generation change on the accuracy of full arch digital impressions. BMC Oral Health 2023, 23, 766. [Google Scholar] [CrossRef] [PubMed]
- Revilla-León, M.; Kois, D.E.; Kois, J.C. A guide for maximizing the accuracy of intraoral digital scans. Part 1: Operator factors. J. Esthet. Restor. Dent. 2023, 35, 230–240. [Google Scholar] [CrossRef] [PubMed]
- Schmalzl, J.; Róth, I.; Borbély, J.; Hermann, P.; Vecsei, B. The impact of software updates on accuracy of intraoral scanners. BMC Oral Health 2023, 23, 219. [Google Scholar] [CrossRef] [PubMed]
- Müller, P.; Ender, A.; Joda, T.; Katsoulis, J. Impact of digital intraoral scan strategies on the impression accuracy using the TRIOS Pod scanner. Quintessence Int. 2016, 47, 343–349. [Google Scholar] [CrossRef]
- Alkadi, L. A Comprehensive Review of Factors That Influence the Accuracy of Intraoral Scanners. Diagnostics 2023, 13, 3291. [Google Scholar] [CrossRef]
- Ender, A.; Zimmermann, M.; Mehl, A. Accuracy of complete- and partial-arch impressions of actual intraoral scanning systems in vitro. Int. J. Comput. Dent. 2019, 22, 11–19. [Google Scholar] [PubMed]
- Ender, A.; Attin, T.; Mehl, A. In vivo precision of conventional and digital methods of obtaining complete-arch dental impressions. J. Prosthet. Dent. 2016, 115, 313–320. [Google Scholar] [CrossRef] [PubMed]
- Park, G.H.; Son, K.; Lee, K.B. Feasibility of using an intraoral scanner for a complete-arch digital scan. J. Prosthet. Dent. 2019, 121, 803–810. [Google Scholar] [CrossRef] [PubMed]
- Park, S.H.; Byun, S.H.; Oh, S.H.; Lee, H.L.; Kim, J.W.; Yang, B.E.; Park, I.Y. Evaluation of the Reliability, Reproducibility and Validity of Digital Orthodontic Measurements Based on Various Digital Models among Young Patients. J. Clin. Med. 2020, 9, 2728. [Google Scholar] [CrossRef] [PubMed]
- Zimmermann, M.; Ender, A.; Mehl, A. Local accuracy of actual intraoral scanning systems for single-tooth preparations in vitro. J. Am. Dent. Assoc. 2020, 151, 127–135. [Google Scholar] [CrossRef] [PubMed]
- Kim, J.E.; Amelya, A.; Shin, Y.; Shim, J.S. Accuracy of intraoral digital impressions using an artificial landmark. J. Prosthet. Dent. 2017, 117, 755–761. [Google Scholar] [CrossRef]
- Kravitz, N.D.; Groth, C.; Jones, P.E.; Graham, J.W.; Redmond, W.R. Intraoral digital scanners. J. Clin. Orthod. 2014, 48, 337–347. [Google Scholar] [PubMed]
- Revilla-León, M.; Kois, D.E.; Kois, J.C. A guide for maximizing the accuracy of intraoral digital scans: Part 2-Patient factors. J. Esthet. Restor. Dent. 2023, 35, 241–249. [Google Scholar] [CrossRef]
- Kanizaj Ugrin, S.; Dzipunova, B.; Spalj, S. Retention using braided bonded wires: A 2-year follow-up of the dentition and oral hygiene with predictors of relapse. Australas. Orthod. J. 2023, 39, 113–122. [Google Scholar] [CrossRef]
- Naidu, D.; Freer, T.J. Validity, reliability, and reproducibility of the iOC intraoral scanner: A comparison of tooth widths and Bolton ratios. Am. J. Orthod. Dentofac. Orthop. 2013, 144, 304–310. [Google Scholar] [CrossRef]
- Reuschl, R.; Heuer, W.; Stiesch, M.; Wenzel, D.; Dittmer, M. Reliability and validity of measurements on digital study models and plaster models. Eur. J. Orthod. 2016, 38, 22–26. [Google Scholar] [CrossRef] [PubMed]
- Jiménez-Gayosso, S.I.; Lara-Carrillo, E.; López-González, S.; Medina-Solís, C.E.; Scougall-Vilchis, R.J.; Hernández-Martínez, C.T.; Colomé-Ruiz, G.E.; Escoffié-Ramirez, M. Difference between manual and digital measurements of dental arches of orthodontic patients. Medicine 2018, 97, e10887. [Google Scholar] [CrossRef] [PubMed]
- Kardach, H.; Szponar-Zurowska, A.; Biedziak, B.A. Comparison of Teeth Measurements on Plaster and Digital Models. J. Clin. Med. 2023, 12, 943. [Google Scholar] [CrossRef] [PubMed]
- Camardella, L.T.; Ongkosuwito, E.M.; Penning, E.W.; Kuijpers-Jagtman, A.M.; Vilella, O.V.; Breuning, K.H. Accuracy and reliability of measurements performed using two different software programs on digital models generated using laser and computed tomography plaster model scanners. Korean J. Orthod. 2020, 50, 13–25. [Google Scholar] [CrossRef]
- Kihara, H.; Hatakeyama, W.; Komine, F.; Takafuji, K.; Takahashi, T.; Yokota, J.; Oriso, K.; Kondo, H. Accuracy and practicality of intraoral scanner in dentistry: A literature review. J. Prosthodont. Res. 2020, 64, 109–113. [Google Scholar] [CrossRef]
Figure 1.
The workflow of the procedures.
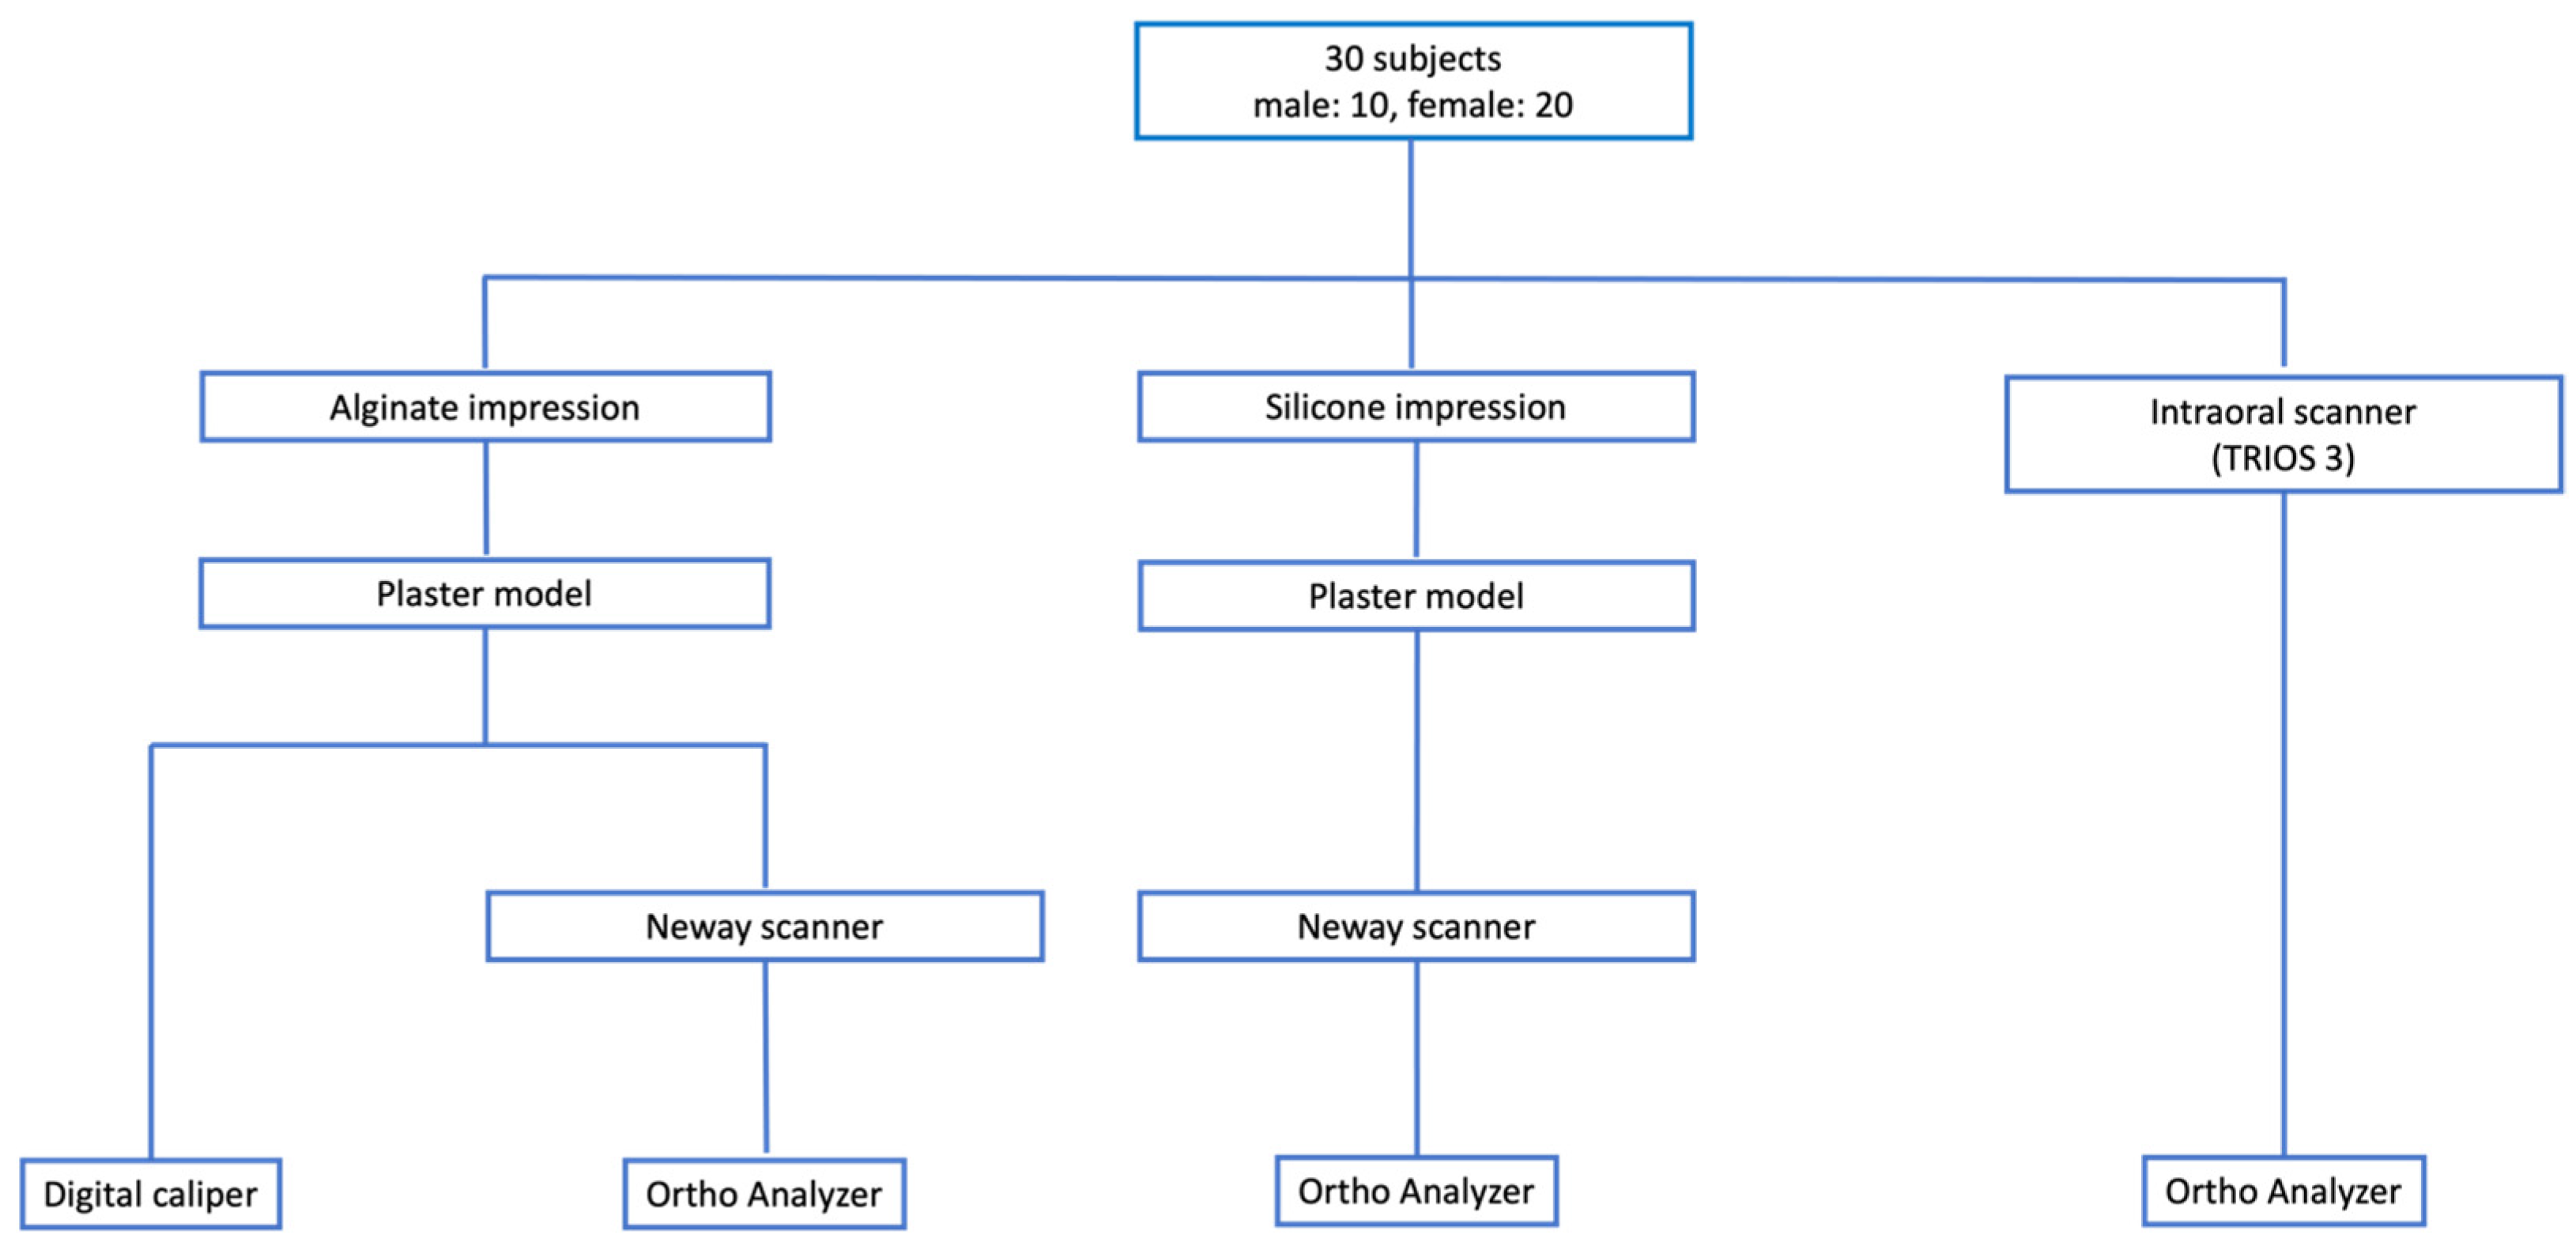
Figure 2.
The measurements of intercanine width (ICW) and intermolar width (IMW) dimensions (a) using a hand-held digital vernier caliper and (b) using Ortho Analyzer software.
Figure 2.
The measurements of intercanine width (ICW) and intermolar width (IMW) dimensions (a) using a hand-held digital vernier caliper and (b) using Ortho Analyzer software.
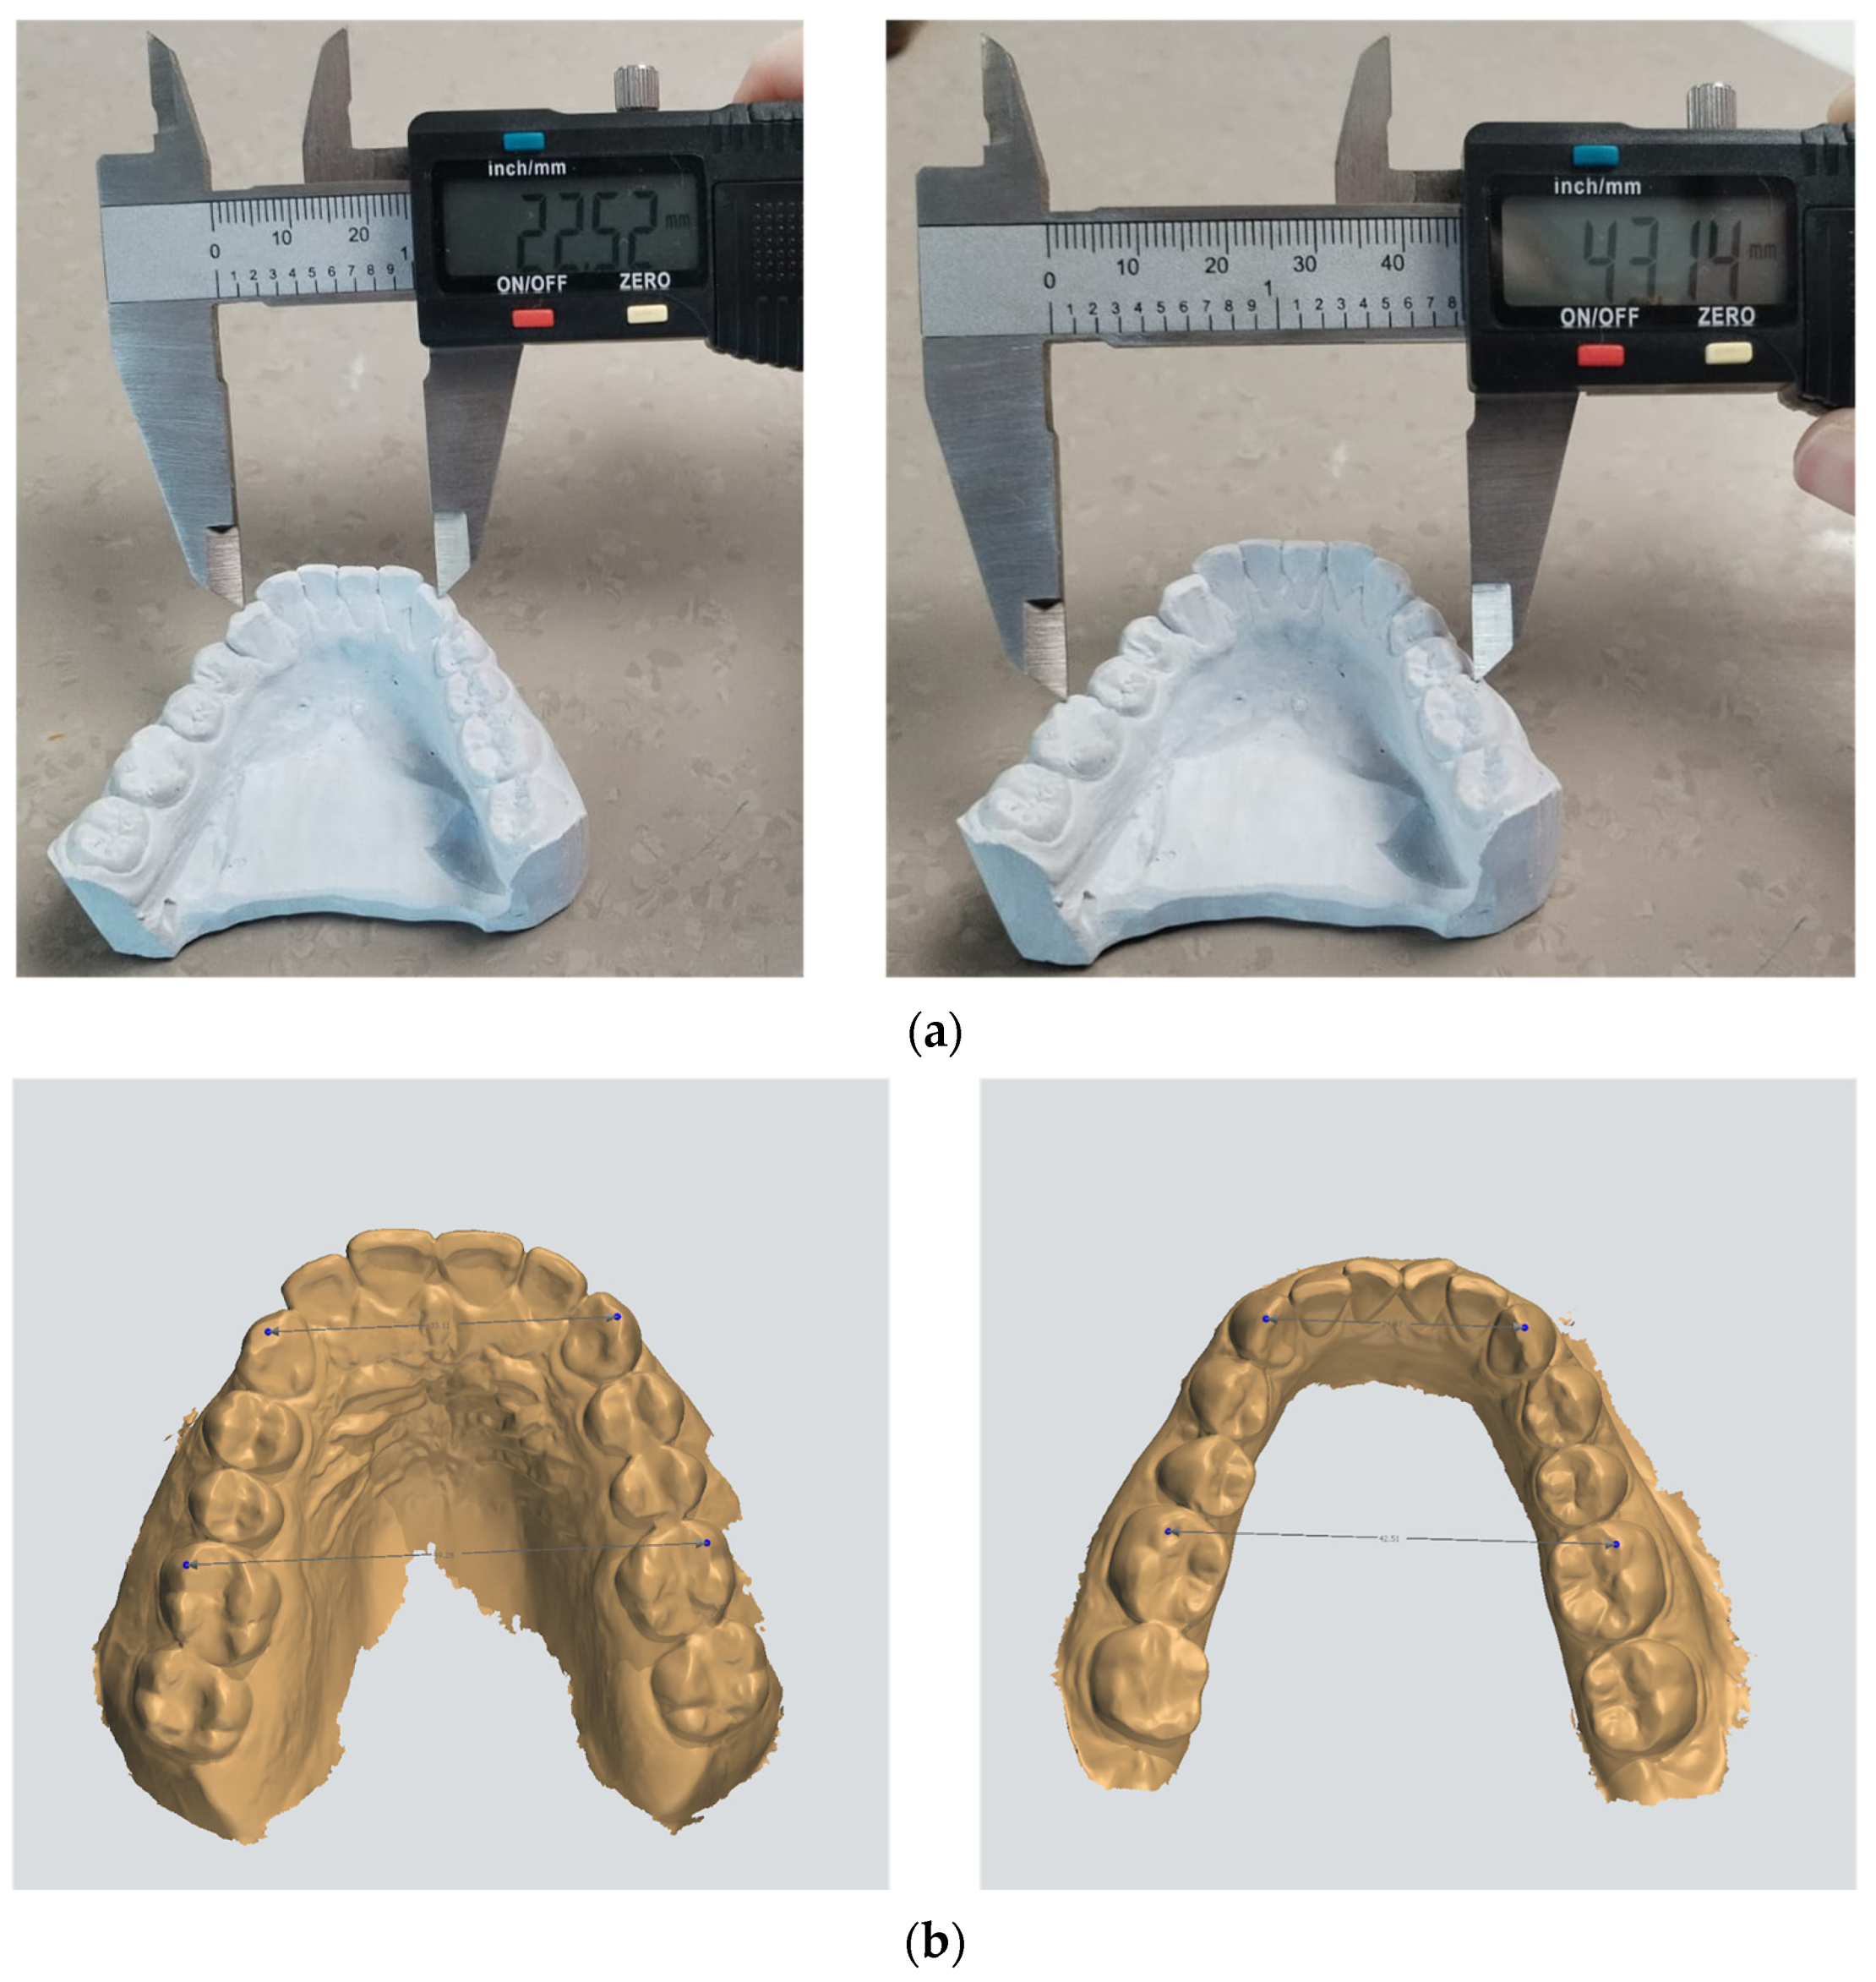
Figure 3.
The measurements of maxillary and mandibular arch perimeter dimensions (a) using soft wire which was modeled to the individual shape of the maxillary and mandibular arch on plaster models and (b) using Ortho Analyzer software.
Figure 3.
The measurements of maxillary and mandibular arch perimeter dimensions (a) using soft wire which was modeled to the individual shape of the maxillary and mandibular arch on plaster models and (b) using Ortho Analyzer software.

Table 1.
Random and systematic errors of measurements on different models by same examiner.
| Intraoral Scan (IOS) | Digitalized Plaster Model Obtained from Alginate Impression (DPMA) | Digitalized Plaster Model Obtained from Silicone Impression (DPMS) | Plaster Model (PM) | |||||||||
|---|---|---|---|---|---|---|---|---|---|---|---|---|
| Parameter | Mean ± SD * | p ** | Dahlberg | Mean ± SD * | p ** | Dahlberg | Mean ± SD * | p ** | Dahlberg | Mean ± SD * | p ** | Dahlberg |
| MxICW | −0.01 ± 0.10 | 0.828 | 0.00 | −0.01 ± 0.09 | 0.89 | 0.00 | −0.03 ± 0.08 | 0.449 | 0.01 | 0.00 ± 0.07 | 1 | 0.00 |
| MdICW | −0.04 ± 0.07 | 0.226 | 0.01 | −0.01 ± 0.07 | 0.669 | 0.00 | 0.00 ± 0.04 | 1 | 0.00 | −0.02 ± 0.08 | 0.621 | 0.01 |
| MxIMW | −0.24 ± 0.52 | 0.36 | 0.08 | −0.06 ± 0.01 | 0.001 | 0.02 | −0.03 ± 0.05 | 0.231 | 0.01 | 0.04 ± 0.09 | 0.374 | 0.01 |
| MdIMW | −0.03 ± 0.08 | 0.421 | 0.01 | −0.01 ± 0.07 | 0.816 | 0.00 | −0.01 ± 0.06 | 0.719 | 0.00 | 0.06 ± 0.05 | 0.07 | 0.02 |
| MxAP | −0.05 ± 0.13 | 0.431 | 0.02 | −0.02 ± 0.09 | 0.631 | 0.01 | 0.01 ± 0.09 | 0.887 | 0.00 | 0.00 ± 0.00 | 1 | 0.00 |
| MdAP | −0.02 ± 0.08 | 0.549 | 0.01 | −0.06 ± 0.06 | 0.106 | 0.02 | −0.03 ± 0.06 | 0.32 | 0.01 | −0.02 ± 0.11 | 0.704 | 0.01 |
Mean ± SD *—mean and standard deviation represent differences in measurements. p—significant level. ** t-test for repeated measurements in assessing systematic error.
Table 2.
Random and systematic errors of measurements on different models between two examiners.
| Intraoral Scan (IOS) | Digitalized Plaster Model Obtained from Alginate Impression (DPMA) | Digitalized Plaster Model Obtained from Silicone Impression (DPMS) | Plaster Model (PM) | |||||||||
|---|---|---|---|---|---|---|---|---|---|---|---|---|
| Parameter | Mean ± SD * | p ** | Dahlberg | Mean ± SD * | p ** | Dahlberg | Mean ± SD * | p ** | Dahlberg | Mean ± SD * | p ** | Dahlberg |
| MxICW | 0.16 ± 0.27 | 0.255 | 0.05 | 0.30 ± 0.37 | 0.142 | 0.10 | 0.27 ± 0.24 | 0.065 | 0.08 | 0.02 ± 0.04 | 0.374 | 0.01 |
| MdICW | 0.01 ± 0.41 | 0.967 | 0.00 | 0.21 ± 0.28 | 0.178 | 0.07 | 0.01 ± 0.07 | 0.71 | 0.00 | 0.02 ± 0.04 | 0.374 | 0.01 |
| MxIMW | −0.55 ± 0.30 | 0.014 | 0.17 | −0.07 ± 0.28 | 0.591 | 0.02 | 0.08 ± 0.07 | 0.073 | 0.03 | −0.04 ± 0.09 | 0.374 | 0.01 |
| MdIMW | 0.04 ± 0.48 | 0.874 | 0.01 | 0.07 ± 0.45 | 0.754 | 0.02 | 0.00 ± 0.08 | 0.958 | 0.00 | 0.06 ± 0.09 | 0.208 | 0.02 |
| MxAP | 0.08 ± 0.76 | 0.821 | 0.03 | 0.00 ± 0.95 | 0.996 | 0.00 | 0.16 ± 0.22 | 0.165 | 0.05 | −0.18 ± 0.60 | 0.54 | 0.06 |
| MdAP | 0.12 ± 0.53 | 0.637 | 0.04 | 0.07 ± 0.80 | 0.846 | 0.02 | 0.03 ± 0.17 | 0.683 | 0.01 | 0.08 ± 0.23 | 0.477 | 0.03 |
Mean ± SD *—mean and standard deviation represent measurement differences. p—significant level. ** t-test for repeated measurement.
Table 3.
Descriptive analysis of the comparison between methods of maxillary and mandibular width and arch perimeter.
Table 3.
Descriptive analysis of the comparison between methods of maxillary and mandibular width and arch perimeter.
| Parameter | IOS Mean * ± SD | DPMA Mean * ± SD | DPMS Mean * ± SD | PM Mean * ± SD | p ** | η2 *** |
|---|---|---|---|---|---|---|
| MxICW | 33.80 a ± 1.93 | 33.68 a ± 1.91 | 33.71 a ± 1.86 | 34.52 b ± 1.95 | <0.001 | 0.427 |
| MdICW | 25.54 a ± 1.71 | 25.49 a ± 1.63 | 25.55 a ± 1.54 | 26.71 b ± 1.68 | <0.001 | 0.439 |
| MxIMW | 51.58 ab ± 3.21 | 51.36 a ± 3.03 | 51.36 a ± 3.10 | 51.81 b ± 3.14 | 0.002 | 0.206 |
| MdIMW | 44.66 ± 3.24 | 44.46 ± 3.22 | 44.67 ± 3.30 | 44.59 ± 3.32 | <0.001 | 0.414 |
| MxAP | 97.06 a ± 3.62 | 97.09 a ± 3.65 | 97.28 a ± 3.41 | 93.51 b ± 3.83 | <0.001 | 0.601 |
| MdAP | 87.10 a ± 3.24 | 87.04 a ± 3.05 | 87.26 a ± 3.02 | 84.62 b ± 4.94 | 0.002 | 0.279 |
* Superscript letters next to means present results of Sidak post-hoc test. Methods with different letters in superscripts (a and b) were statistically significantly different. ** ANOVA for repeated measures. *** Effect size. IOS—intraoral scan. DPMA—digitalized plaster model obtained from alginate impression. DPMS—digitalized plaster model obtained from silicone impression. PM—plaster model.
Table 4.
Comparison of measurements between plaster and digital models of maxillary and mandibular width and arch perimeter.
Table 4.
Comparison of measurements between plaster and digital models of maxillary and mandibular width and arch perimeter.
| Parameter | ICC (95% CI) | ME * | Mean Difference (95% CI) | p |
|---|---|---|---|---|
| MxICW | ||||
| PM-IOS | 0.844 (0.459–0.941) | 0.62 | 0.72 (0.39–1.04) | <0.001 |
| PM-DPMA | 0.821 (0.307–0.937) | 0.63 | 0.83 (0.50–1.16) | <0.001 |
| PM-DPMS | 0.831 (0.318–0.941) | 0.60 | 0.80 (0.49–1.12) | <0.001 |
| MdICW | ||||
| PM-IOS | 0.487 (0.062–0.742) | 1.07 | 1.17 (0.60–1.74) | <0.001 |
| PM-DPMA | 0.487 (0.029–0.735) | 1.02 | 1.23 (0.69–1.77) | <0.001 |
| PM-DPMS | 0.468 (0.039–0.731) | 1.04 | 1.17 (0.62–1.71) | <0.001 |
| MxIMW | ||||
| PM-IOS | 0.967 (0.931–0.984) | 0.56 | 0.24 (−0.06–0.53) | 0.112 |
| PM-DPMA | 0.961 (0.884–0.984) | 0.53 | 0.45 (0.17–0.73) | 0.003 |
| PM-DPMS | 0.962 (0.886–0.984) | 0.53 | 0.45 (0.17–0.73) | 0.002 |
| MdIMW | ||||
| PM-IOS | 0.913 (0.591–0.970) | 0.75 | 0.93 (0.53–1.32) | <0.001 |
| PM-DPMA | 0.879 (0.457–0.959) | 0.87 | 1.13 (0.67–1.59) | <0.001 |
| PM-DPMS | 0.913 (0.620–0.969) | 0.77 | 0.92 (0.51–1.32) | <0.001 |
| MxAP | ||||
| PM-IOS | 0.477 (−0.080–0.775) | 2.08 | −3.55 (−4.65–(−2.45)) | <0.001 |
| PM-DPMA | 0.468 (−0.079–0.768) | 2.12 | −3.58 (−4.71–(−2.46)) | <0.001 |
| PM-DPMS | 0.477 (−0.096–0.761) | 2.04 | −3.78 (−4.85–(−2.70)) | <0.001 |
| MdAP | ||||
| PM-IOS | 0.459 (0.098–0.707) | 2.86 | −2.48 (−4.00–(−0.97)) | 0.002 |
| PM-DPMA | 0.437 (0.157–0.816) | 2.89 | −2.42 (−3.94–(−0.89)) | 0.003 |
| PM-DPMS | 0.459 (0.058–0.682) | 2.89 | −2.64 (−4.17–(−1.12)) | 0.001 |
* ME—measurement error quantified using the square root of the residual variance. IOS—intraoral scan. DPMA—digitalized plaster model obtained from alginate impression. DPMS—digitalized plaster model obtained from silicone impression. PM—plaster model.
Disclaimer/Publisher’s Note: The statements, opinions and data contained in all publications are solely those of the individual author(s) and contributor(s) and not of MDPI and/or the editor(s). MDPI and/or the editor(s) disclaim responsibility for any injury to people or property resulting from any ideas, methods, instructions or products referred to in the content. |
© 2024 by the authors. Licensee MDPI, Basel, Switzerland. This article is an open access article distributed under the terms and conditions of the Creative Commons Attribution (CC BY) license (https://creativecommons.org/licenses/by/4.0/).
Share and Cite
MDPI and ACS Style
Petrović, V.; Šlaj, M.; Buljan, M.; Morelato, L.; Zulijani, A.; Perić, B. A Comparison of Dental Arch Width and Length on 3D Digital and Plaster Models. Appl. Sci. 2024, 14, 3572. https://doi.org/10.3390/app14093572
AMA Style
Petrović V, Šlaj M, Buljan M, Morelato L, Zulijani A, Perić B. A Comparison of Dental Arch Width and Length on 3D Digital and Plaster Models. Applied Sciences. 2024; 14(9):3572. https://doi.org/10.3390/app14093572
Chicago/Turabian StylePetrović, Valentina, Martina Šlaj, Mia Buljan, Luka Morelato, Ana Zulijani, and Berislav Perić. 2024. "A Comparison of Dental Arch Width and Length on 3D Digital and Plaster Models" Applied Sciences 14, no. 9: 3572. https://doi.org/10.3390/app14093572
Note that from the first issue of 2016, this journal uses article numbers instead of page numbers. See further details here.