
Angle-Resolved Fluorescence of a Dye Coupled to a Plasmonic Nanohole Array
by
 , , , and
Francesco Floris
1,* ,
,
Margherita Angelini
1,*,
Eliana Manobianco
2,
Paola Pellacani
2,
Valentina Tolardo
2 and
Franco Marabelli
1 1
Department of Physics, University of Pavia, Via Bassi 6, 27100 Pavia, Italy
2
Plasmore S.r.l, Via Vittorio Emanuele II 4, 27100 Pavia, Italy
*
Authors to whom correspondence should be addressed.
Appl. Sci. 2024, 14(9), 3574; https://doi.org/10.3390/app14093574
Submission received: 15 March 2024
/
Revised: 17 April 2024
/
Accepted: 22 April 2024
/
Published: 24 April 2024
(This article belongs to the Special Issue Nanostructured Materials: From Surface to Porous Solid)
Abstract
:Featured Application
Gold nanohole arrays represent a valid platform to realize multiplexed, label-free biosensing devices based on both plasmon-enhanced fluorescence and surface plasmon resonance detection methods. This has to be achieved by properly co-optimizing the gold nanohole array plasmonic response in combination with the fluorophore, or target molecule more in general, features, and also by choosing the optimal measurement configuration for both the sensing methods.
Abstract
Gold nanohole arrays are periodic metasurfaces that are gathering huge interest in biosensing applications. The bi-dimensional grating-like structure defines their plasmonic response, together with the corresponding mode of angular dispersion. These properties can be used to investigate the interaction processes with the fluorescence features of a properly chosen emitting molecule. By employing a custom gold nanohole array alongside a commercial organic dye, we conducted an accurate angle-resolved optical characterization resorting to fluorescence, reflectance, and transmittance spectra. The coupling between the plasmonic modes and the fluorescence features was then identified as a modification of the dye fluorescence signal in terms of both spectral redistribution and enhancement. By carefully analyzing the results, different measurement efficiencies can be identified, depending on the set-up configuration, to be properly engineered for sensitivity maximization in plasmon-enhanced fluorescence-based applications.
1. Introduction
Metal-based metastructures are ordered systems made of highly efficient electromagnetic scatterers. By changing their size, shape, and composition, their optical response can be tuned as desired, from ultraviolet through visible to near-infrared regions. This peculiar optical response is driven by coherent collective oscillations of conduction electrons in metal, a phenomenon known as surface plasmon resonance. At the plasmon resonant wavelength, the scatterers act as tiny antennas, increasing the local electromagnetic field intensity near the metastructure surface. Interestingly, these enhanced near fields associated with the surface plasmon resonances can interact with molecules close to the metastructure surface, granting a better interaction between light and matter at the nanoscale and enabling the detection of a very small amount of molecules through surface field-enhanced spectroscopy techniques.
The most popular configuration for performing field-enhanced spectroscopy is Surface-Enhanced Raman Spectroscopy (SERS) [1,2].
Moreover, Surface-Enhanced Fluorescence (SEF), i.e., the study of fluorescence and its dependence on the local environment, has been investigated for a long time [3,4].
Above all, the deposition of a dye on a generic surface and its interaction with the surroundings has been theoretically and experimentally investigated, especially for metallic surfaces [5,6]. This topic gathers a huge interest [7], in particular, thanks to the field enhancement effects [8], which are crucial for technologically relevant applications such as (bio)molecule sensing. In this framework, the concept of critical distance between the dye and the metal surface needs to be introduced: for small distances, the Förster quenching process prevails, suppressing the fluorescence signal, whereas, for large separation distances, the enhancement is reduced until it is lost [8]. Nevertheless, in several studies dealing with different metallic platforms, such a constraint has been discussed and relaxed [9,10,11,12]. The key point is the plasmonic near-field capability to strongly interact with the dye and the consequent establishment of an energy exchange between the two. In this scenario, the transduction of such an interaction in terms of suppression or enhancement of the far field emission depends on the specific coupling established with the far field radiation mechanism of the plasmon itself. In the case of bulk metals, where the plasmonic modes are non-radiative, suppression prevails. For localized resonances, such as in metallic nanoparticles where plasmonic dipolar modes are supported or nanostructured films, where additional coupling schemes can be supported, emission enhancement can be observed.
As a result, beyond the near-field enhancement provided by the metal and acting on the dye pumping and/or emission processes, the energy exchange efficiency depends mostly on the specific coupling mechanism established between the plasmonic modes and the far-field radiation. In this regard, a wide amount of studies and applications concerning plasmon-enhanced fluorescence (PEF) have been performed using metallic nanoparticles, likely because plasmonic localized resonances (LSPR) can be easily optically excited and detected [13,14,15,16,17]. Instead, the use of metallic surfaces poses many constraints regarding the specific optical configuration to be used for exploiting the plasmonic resonances: in the case of thin layers, a prism must be used; for corrugated surfaces or gratings, the diffraction must be considered [7,18,19,20,21].
Nevertheless, several applications have been developed using gold nanohole arrays (GNAs), exploiting the capability of this particular kind of metal-based metastructure to tailor the pumping and/or emission features of a dye laid on its surface [22,23,24,25].
GNAs are bi-dimensional metastructures, also called plasmonic metasurfaces, supporting plasmonic modes able to provide enhanced scattering properties characterized by a strong localization of the electromagnetic field on their surface.
The angular distribution properties of a dye fluorescence signal with respect to the surface orientation have also been considered in some cases. Further, a complete study of the connection between the angle-dependent plasmonic behavior in the pump and in emission and the dye features was performed in [26], although it focused on a single plasmonic delocalized resonance. At the same time, the majority of the most recent papers on this topic are focused on specific bio-detection problems with an empirical approach [15,27,28,29,30]. In this view, the present work is aimed at verifying the suitability of a GNA for engineering a comprehensive PEF platform. The GNA exhibits an optical response determined by a mix of either localized, i.e., LSPRs, or propagating, i.e., surface plasmon polaritons (SPPs), modes [31,32]. The GNA was developed by Plasmore Srl as a surface plasmon resonance (SPR) sensor [33] and can be customized to a homemade computational algorithm [34], ensuring the plasmonic response is tailored to specific needs. Moreover, the GNA has been considered for the development of a double-signal optical detection platform combining both SPR and PEF [35,36,37].
The synergic combination of SPR and PEF allows for exploiting the benefits while mitigating the drawbacks of each optical method, obtaining breakthrough characteristics combined into the same portable sensor:
- Extended dynamic-range and reliable semi-quantitative measurements.
- PEF has a limited dynamic range (for analytes in a high concentration) due to self-quenching. This can be overcome since SPR is not affected by intermolecular interactions (being sensitive to the mass of the analyte molecules). Such a solution can provide the extension of the dynamic range and a real-time double-check of the sensor response in the concentration region where both SPR and PEF methods are applied. As reported in [38] when considering, e.g., Hg2+, the dynamic range could span from 0.5 nM (the lower limit for the PEF method) up to 50 μM (the higher limit for the SPR method).
- High sensitivity for multiple analytes.
- Both SPR and PEF detection methods can reach a high sensitivity for microbiological contaminants with a limit of detection (LOD) of up to tens of CFU/mL [39]. While low LOD (ppt-ppb) is expected, for example, in SPR bio-sensors in the case of heavy metals, SPR may also show low sensitivity for other low-molecular-weight compounds in low concentrations (ppb), such as pesticides. A double-signal optical detection platform will fill this gap in plasmonics-based methodology by exploiting the PEF detection mode, enabling low-LOD detection by collecting signals with respect to a non-fluorescent background [40].
- In consideration of all the above, we identified two main goals deserving our interest:
- 1.
- To analyze the spectral weight of fluorescence mediated by plasmonic resonance behavior and its angular dispersion;
- 2.
- To define the enhancement factor for each measurement configuration.
2. Materials and Methods
2.1. GNA Nanofabrication
The PEF platform is the GNA consisting of a hexagonal array of PMMA/air nanoholes embedded in an optically thick gold layer deposited on a glass substrate [31]. The nanofabrication protocol is based on a combination of colloidal lithography and plasma-based processes. Cleaned SiO2 microscope slides were activated under glow discharge for 15 min, and then a silanization process was performed. Thus, the silanized SiO2 was coated with a 180 nm thick layer of polymethyl methacrylate (PMMA) using a spin coater. Consequently, a monolayer of polystyrene nanoparticles (diameter = 500 nm) was assembled and transferred on top of the PMMA layer using the Langmuir Blodgett technique. This monolayer was then conditioned via O2 plasma etching to nanostructure the underlying PMMA layer. Consequently, a gold layer was deposited by magnetron sputtering with the same nominal thickness as the PMMA layer. The residual of the nanosphere mask was lifted off, resorting to an isopropanol bath under ultrasonication. Finally, thermal treatment at 300 °C for about one hour was performed to improve the stability of the gold layer. Surfaces fabricated were characterized by resorting to the SEM technique. The gold ring surrounding the top of each hole was about 30 nm in height. A SEM image is reported in Figure 1, showing a very well-ordered nanohole array with a pitch around 460 nm.
2.2. Dye Deposition
ATTO700 dye was selected to provide a distinct spectral overlap between the dye absorption and emission spectra, the plasmonic features, and the detection device in use [35,41,42]. The dye was deposited by drop-casting on the GNA and, in parallel, on a bare SiO2 slide taken as a reference. To provide both uniformity and stability, alternating positively and negatively charged polyelectrolyte layers (PEL) were deposited on the targeted surface before the dye-deposition process.
Operatively, poly(styrene) sulfonate at 2% and poly(diallyldimethylammonium) chloride at 2% solutions were alternatively deposited on the plasmonic metasurface, as shown in Figure 1. After each deposition step, the sample was washed with MilliQ water and dried under nitrogen flow. In this way, the PEL layers were stacked on the sample surface. The substrate charge was considered in the deposition procedure: positive for the PEF platform and negative for the SiO2 one. Therefore, two layers on the PEF platform were deposited and three in the SiO2 case. Consequently, the PEL coverage thickness was estimated to be 4 nm for the PEF platform and 6 nm for the SiO2 sample.
2.3. Experimental Optical Setups
A custom setup was realized to perform angle-resolved photoluminescence measurements for four different pumping and collection configurations. To better distinguish the different measurement configurations, two sides of the PEF platform are defined in panel (a) of Figure 2, i.e., the front and back sides. A schematic of the setup is shown in panel (b) of Figure 2.
This setup includes two independent custom pumps and sample holders that allow for the autonomous selection of either the pumping or collection angles relative to the optical axis indicated as α and β, respectively, in panel (b) of Figure 2.
Specifically, a 632 nm continuous-wave (CW) He-Ne laser coupled to a standard multimode optical fiber was employed as the source. The laser beam was focused on the sample’s rotation axis using a BK7 lens with a focal length of 5 cm, resulting in a 1 mm2 spot diameter with a measured power of 10 mW.
Two BK7 lenses (Lens 1 and 2 in Figure 2) having the same focal length of 10 cm were used to collect the fluorescence signal over an angle of 15 degrees.
An Oriel Multispec spectrograph equipped with a 600 lines/mm grating and a Thorlabs LC-100/M line camera was exploited for detection. To filter out the pumping laser line, a FELH0650 Thorlabs high-pass filter was placed before the 200 µm spectrograph slit.
The fluorescence signal was collected following two different measurement schemes, where the pumping angle alpha (α) and the collection angle beta (β) were changed. In the first one, α was varied relative to the plasmonic surface normal axis, while β was kept fixed. In the second scheme, β was spanned while maintaining α constant. In both configurations, the angle variation was set to 5°. To improve the collection resolution, measurement at a fixed pumping angle was performed by using a single lens arrangement for the collection with an acceptance angle of 5°.
The reflectance (R) and transmittance (T) data were collected using a commercial Fourier transform spectrometer Bruker IFS66S coupled to a custom micro reflectometer. Broadband (500 nm to 1000 nm) variable-incidence-angle R and T measurements were performed, illuminating the sample from both front and back sides with a resolution of 16 cm−1. Glan-Taylor polarization was used to select the TE or TM spectral components.
3. Results
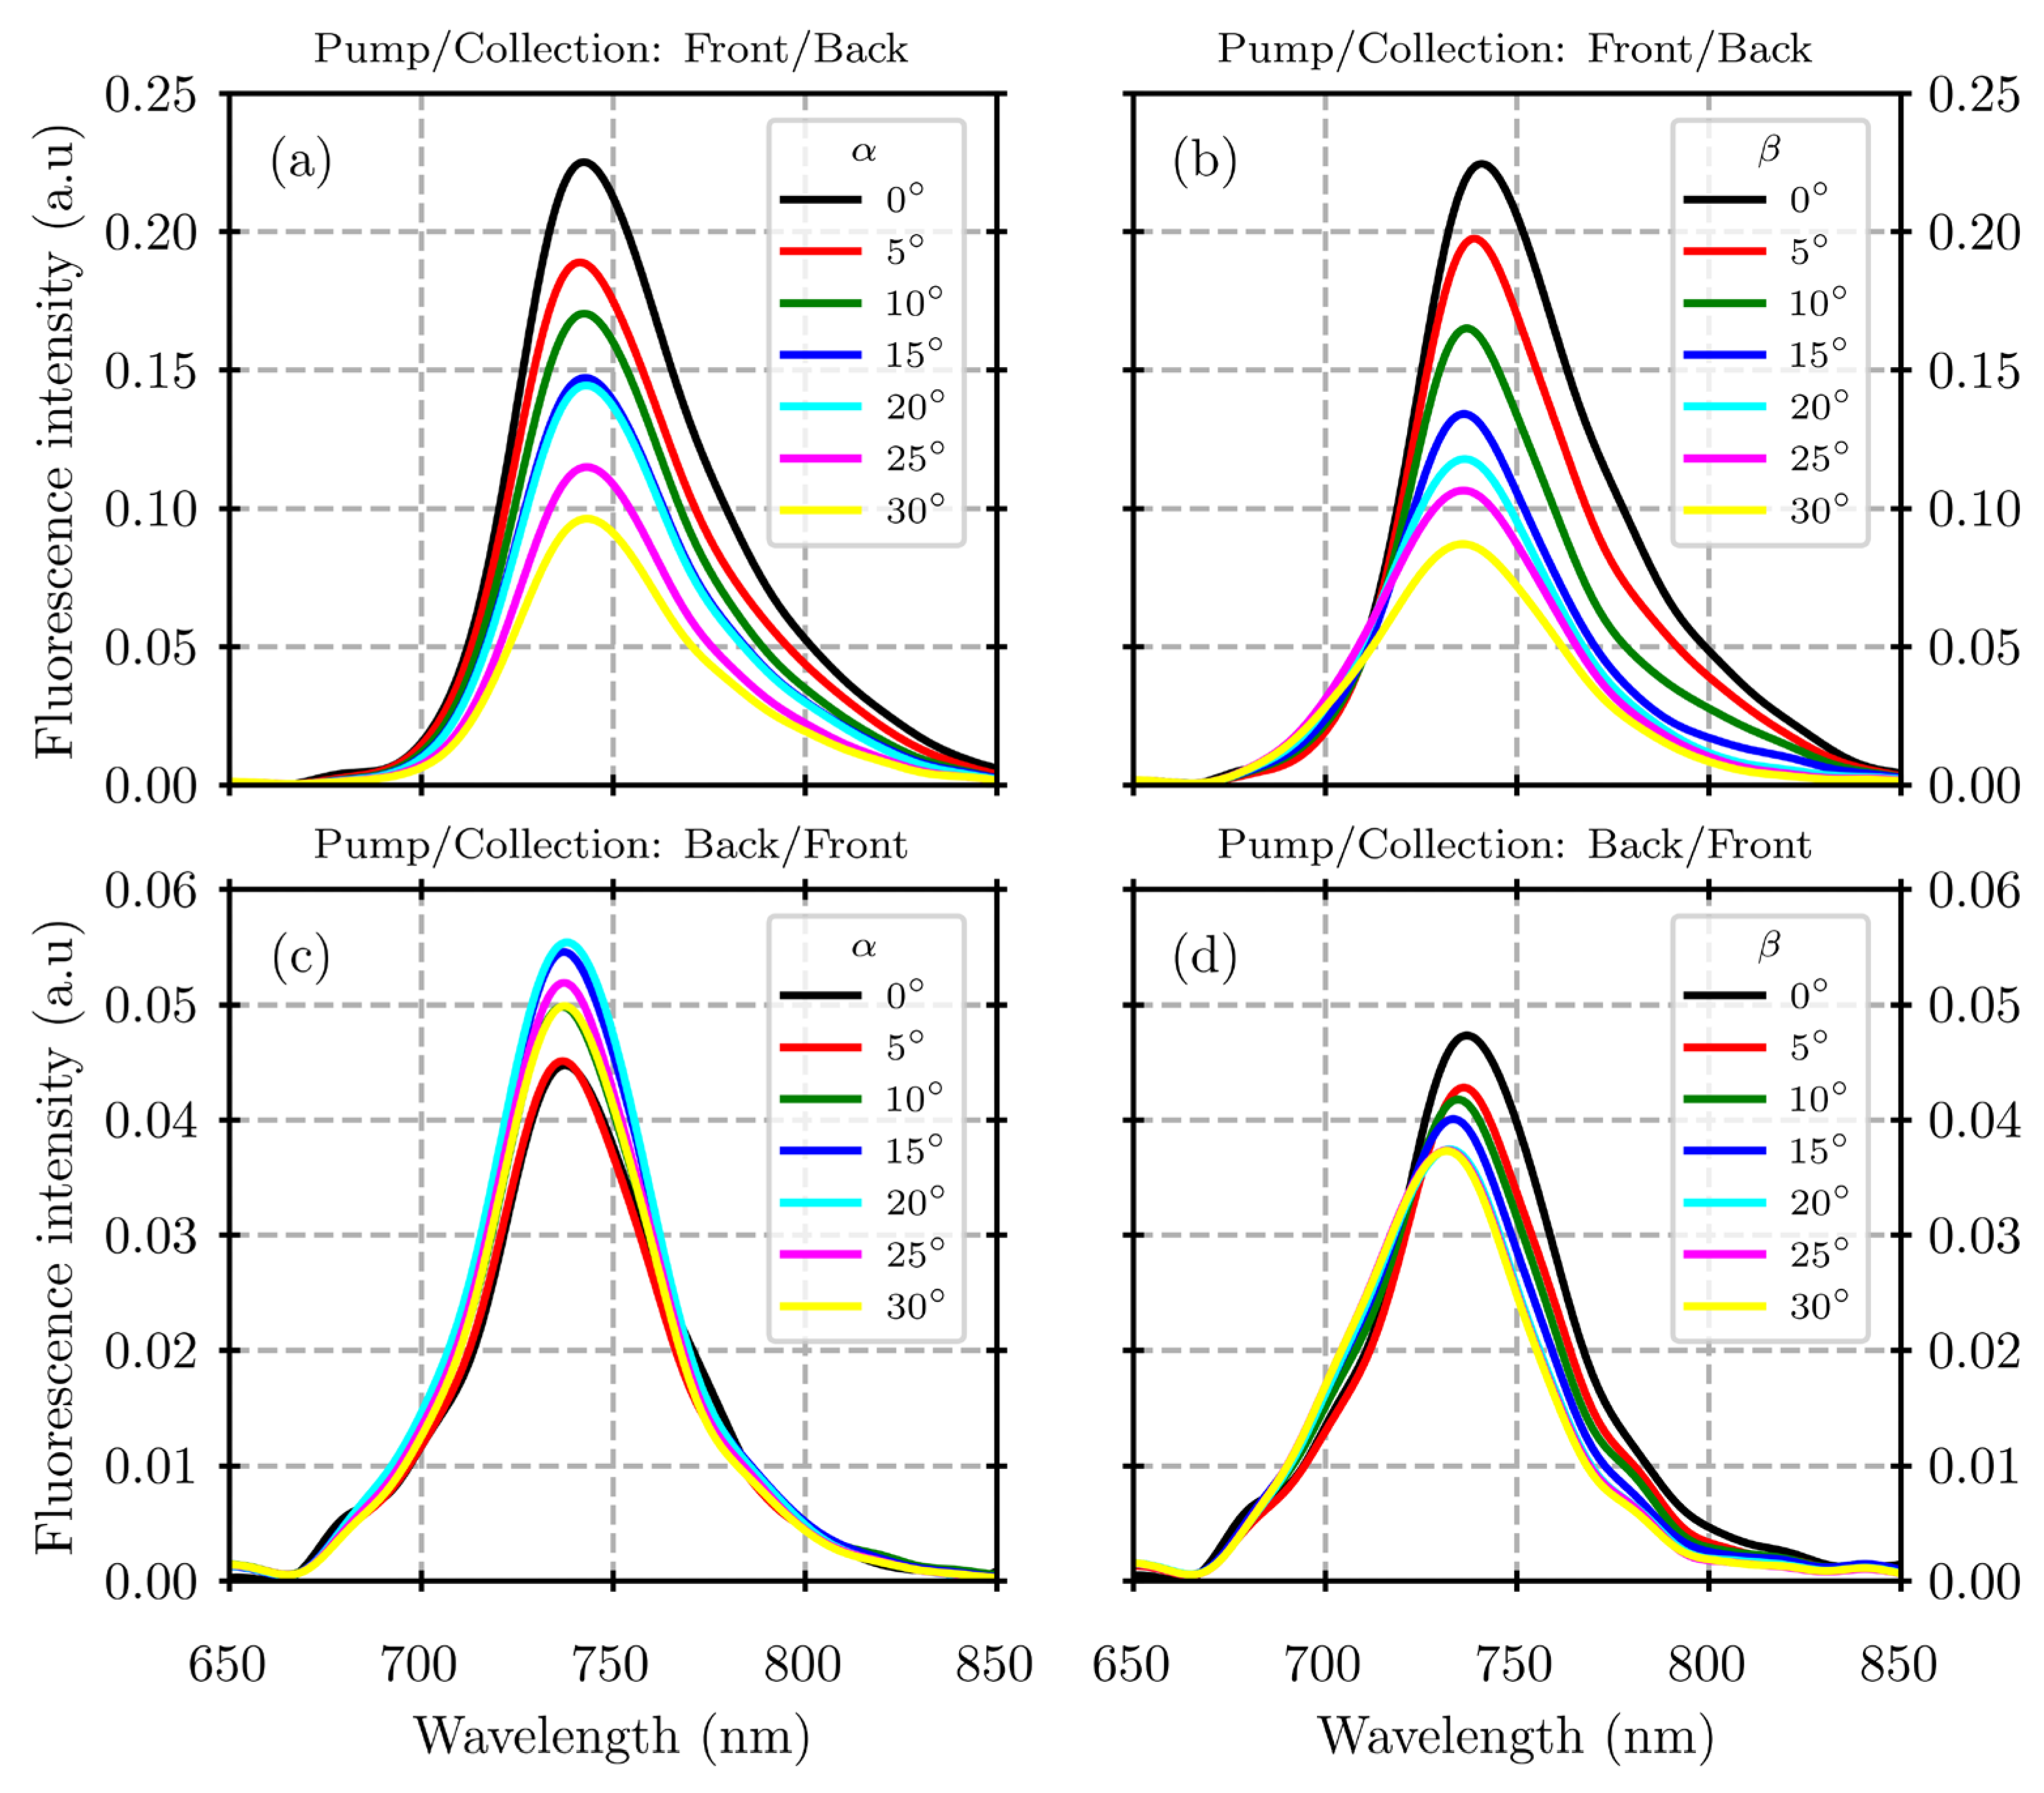
The measured ATTO700 dye fluorescence spectra of the PEF platform are presented in Figure 3. The configuration with the pump on the front side, panels (a) and (b) of Figure 3, shows a systematically higher intensity compared to pumping from the back side. Considering the front/back configuration, looking at pumping angle α, panel (a), Figure 3, no significant spectral changes in the curves are noted. On the other hand, the peak intensity decreases with α, undergoing an interruption between 15° and 20°. Considering the variation in collection angle β, instead, in panel (b), Figure 3, the peak intensity is decreasing.
When the pumping is performed from the back, panel (c), Figure 3, the fluorescence peak intensity increases with the pumping angle α, 0° to 20°, and then decreases. Considering the variation with respect to the collection angle β, panel (d), Figure 3, the peak intensity also shows a decrease for this configuration.
Overall, the peak spectral position is mainly unaffected, displaying the emission maximum near 730 nm, regardless of the pumping angle for both the pumping/collection configurations. On the other hand, considering the dependence on the collection angle β, the peak spectral position remains unchanged for the front/back configuration and exhibits a blue shift in the back/front one.
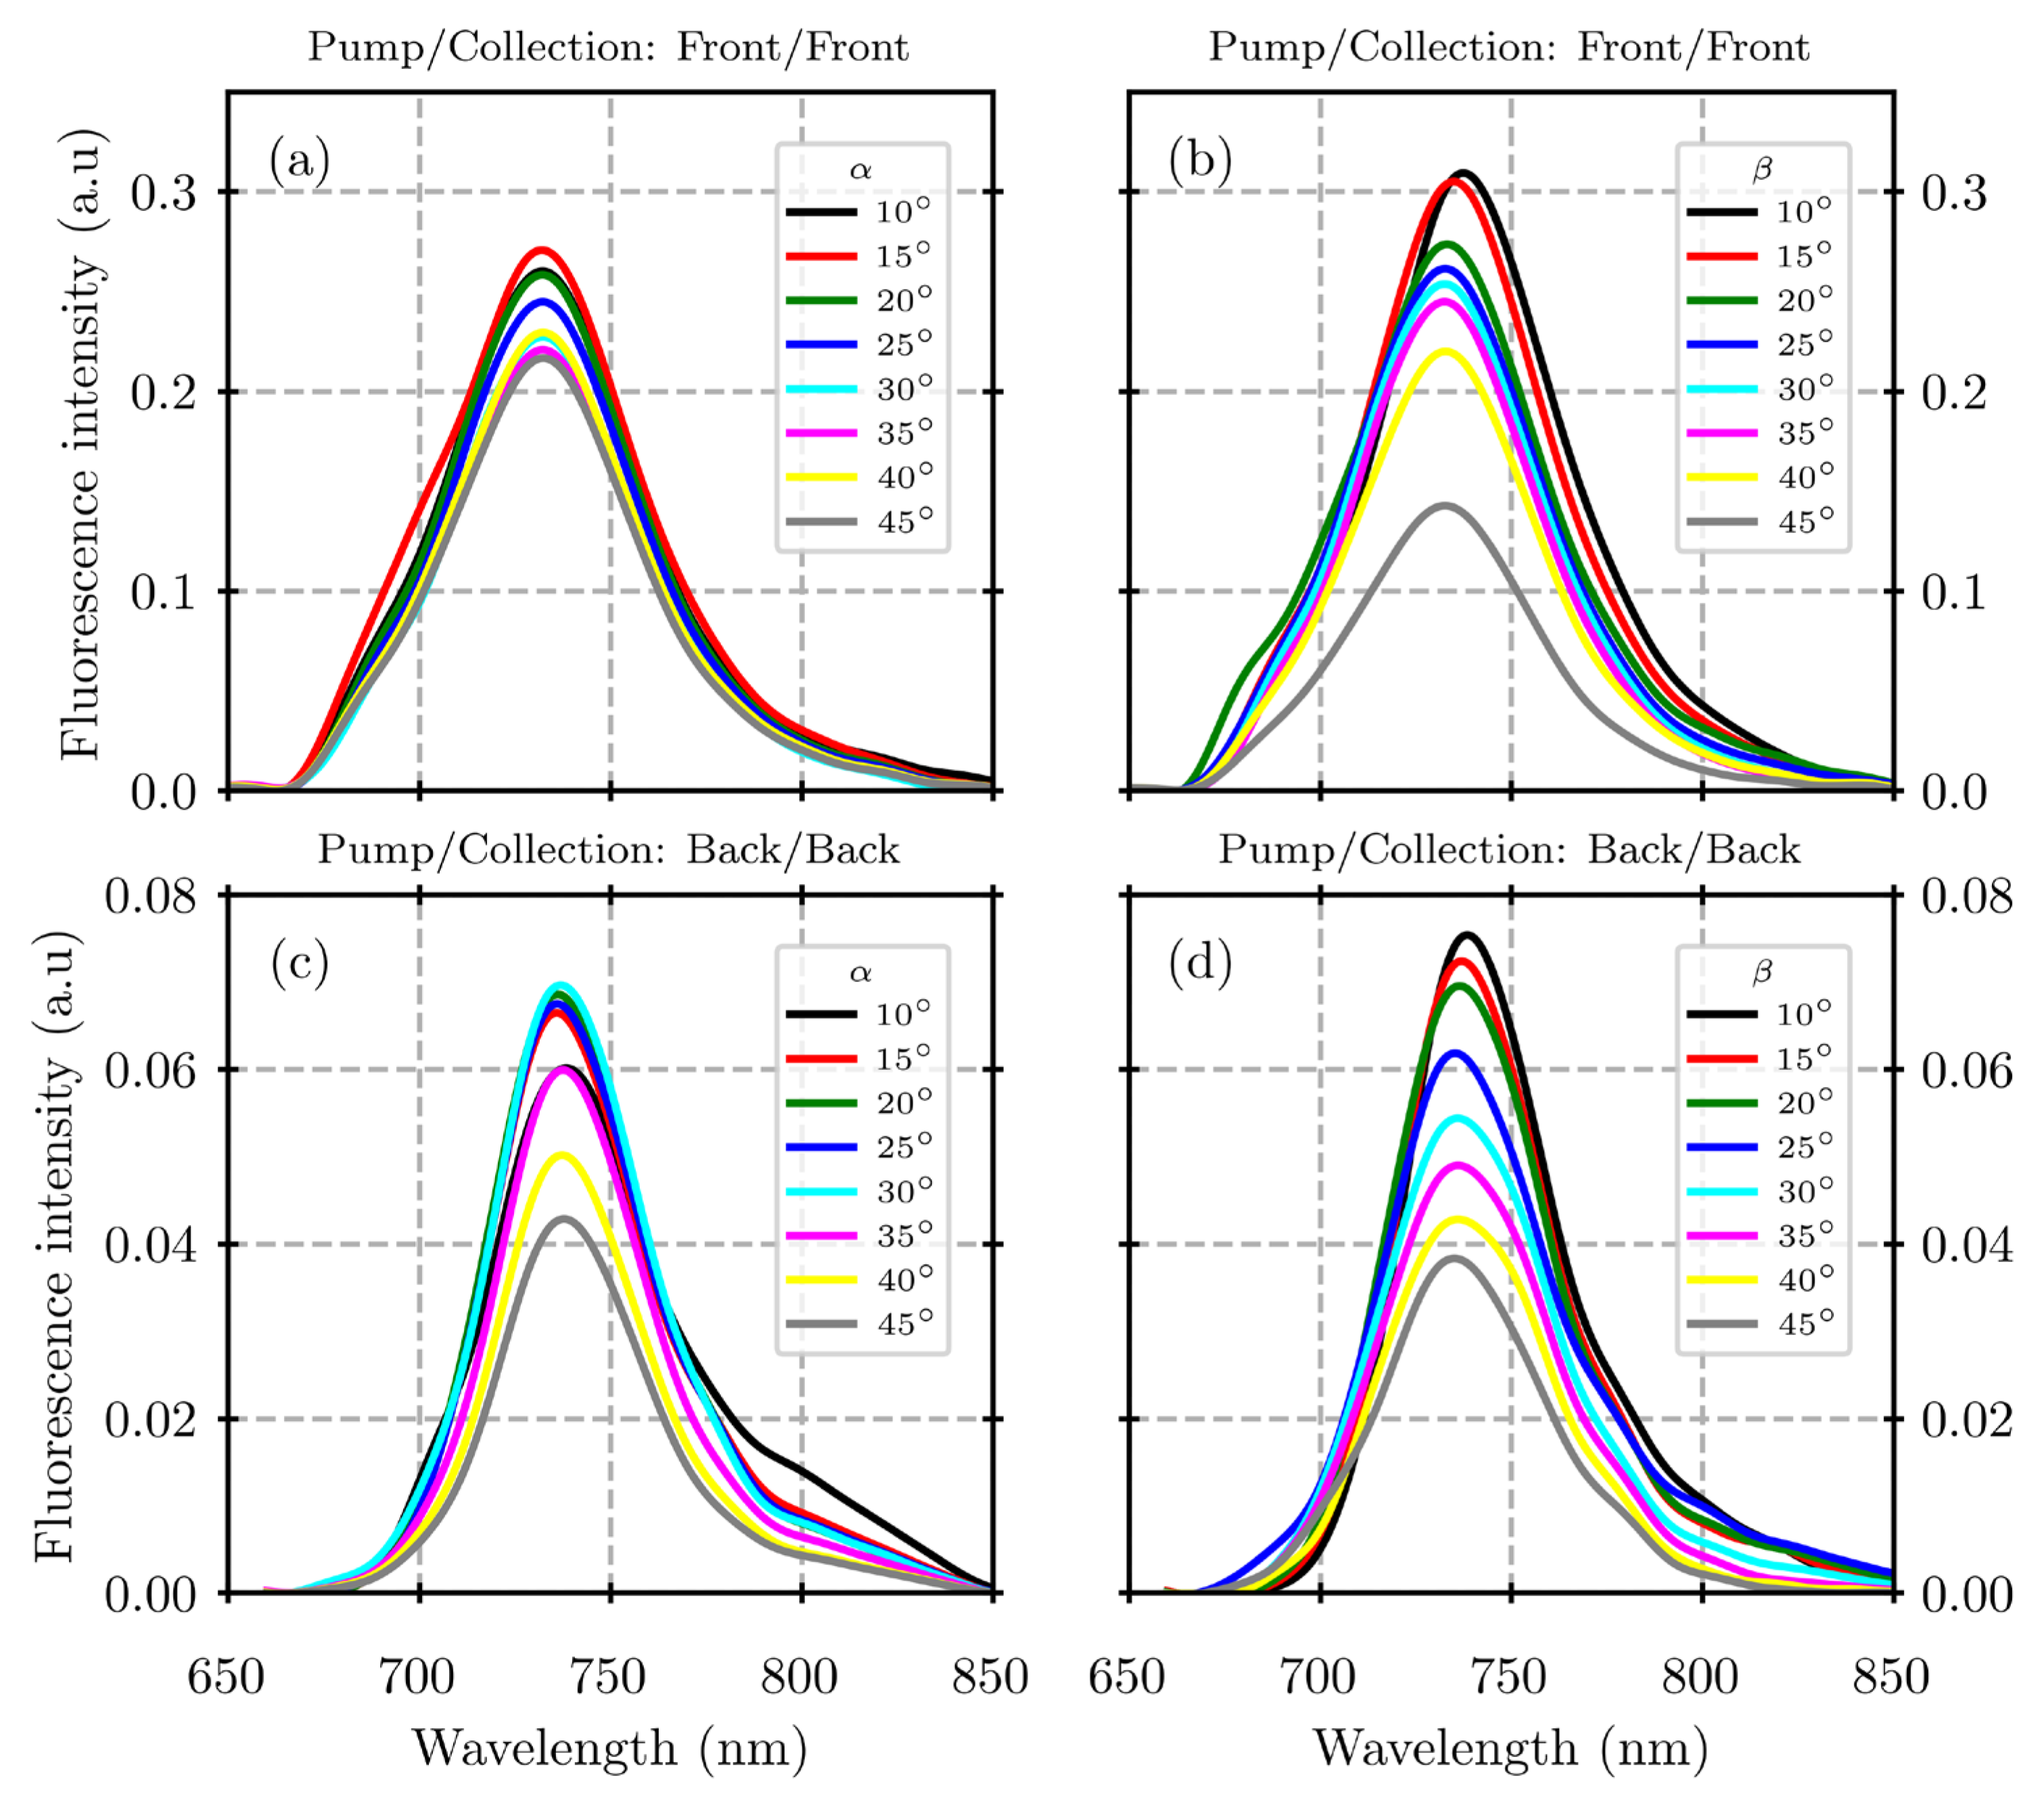
Consistent behavior of the fluorescence emission spectra is also observed when pumping and collection both persist on the same side (front/front or back/back). Figure 4 reports the results obtained for these configurations. In this case, the front/front measurements exhibit the largest fluorescence intensities, whereas the back/back ones are roughly one-third lower in intensity. Also, in this case, the spectral shape remains substantially unchanged when the pumping angle is varied, displaying a maximum of around 730 nm. Starting from the lowest collection angle of 10°, the fluorescence maximum intensity decreases down to 45° for the front configuration (panel (a), Figure 4), while maintaining its value up to 30° to lower again for the back/back configuration (panel (c), Figure 4).
A shift and a reshape of the spectral curves can also be observed in this case by varying the collection angle. In fact, for both the front/front and back/back configurations, panels (b) and (d) of Figure 4, respectively, the fluorescence spectra show a redistribution of the spectral weight toward lower wavelengths, exhibiting a blue shift of the fluorescence maximum. So, by comparing the results corresponding to the different measurement configurations, it results that the side on which the pumping occurs determines the intensity of the response. Instead, the spectral shape is mainly affected by the collection angle, independently of the chosen configuration.
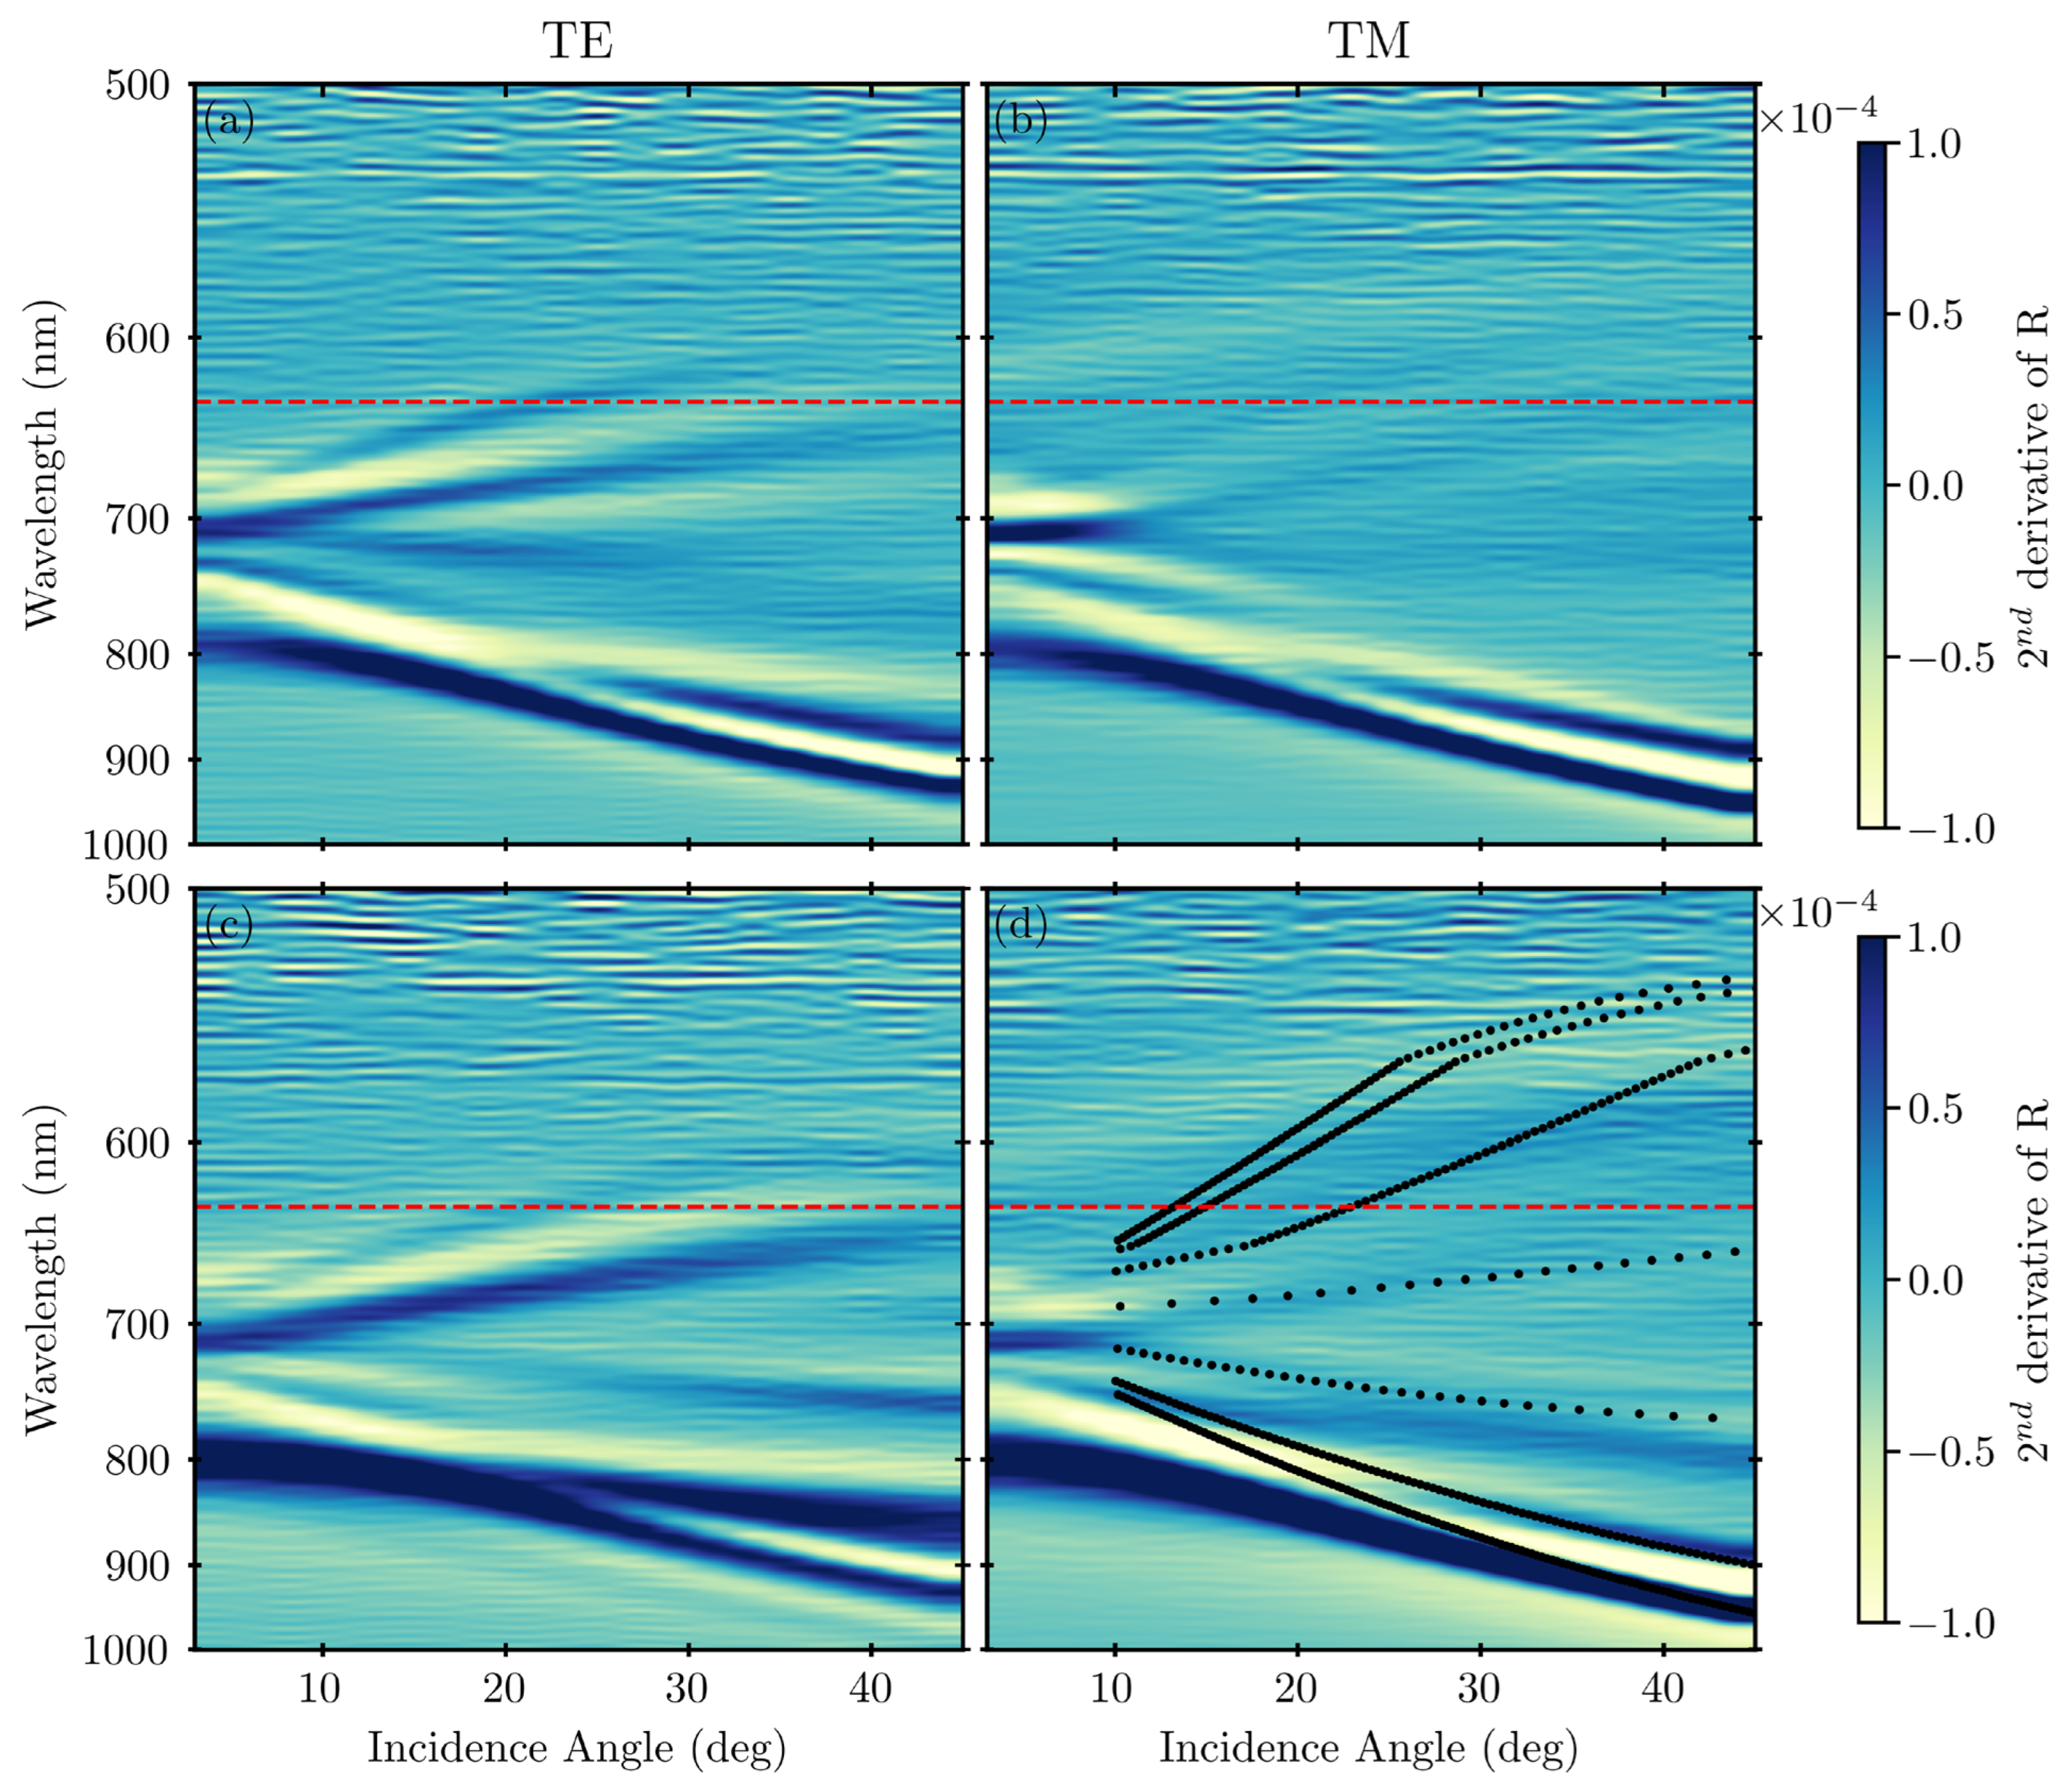
The dispersion of SPPs can be identified by comparing the experimental R behavior and the theoretical SPPs model (see Appendix A.1), depicted by the dotted curves in Figure 5. Here, the black lines in panel (d) can be ascribed to the SPPs related to the Au/SiO2 interface and can be clearly observed when measuring from the back.
To better highlight the complex plasmonic response of the GNA, which can be associated with maxima and minima in the optical spectra, Figure 5 reports the second derivative of the reflectance (R) spectra (see Appendix A.2, Figure A1) as a function of the incidence angle [32]. The first row of Figure 5 (panels (a) and (b)) results from the TE and TM R spectra acquired impinging and collecting from the front side, in contrast to panels (c) and (d) from the back side, respectively. The dispersion behavior of the spectral features can be clearly observed, and several different polaritonic branches can be recognized. The same behavior can also be recognized in transmittance (T), as shown in Appendix A.1.
To identify SPP dispersion, the calculated dispersion curves were compared with the R spectra measured in the TM configuration. On the other hand, the R spectra in the TE configuration provide a better visualization of the LSPR mode features [31]. At the lowest angles, below 15°, the superposition of both LSPR and SPP modes is noticeable, together with the photonic band gap opening at about 680 nm, corresponding to a simultaneous minimum in T and a maximum in R. Further, around 0° at 800 nm, an evident optical branch can be observed with almost no dispersion until 10° and an evolution that coincides with the lowest SPP mode trend for larger angles. It is worth noticing how the laser excitation wavelength, indicated with the dashed red line in Figure 5, crosses the GNA plasmonic modes around (15÷20)° and (30÷40)°.
4. Discussion
In consideration of the aforementioned optical behavior, a possible coupling between the GNA plasmonic modes and the organic dye features was analyzed.
Recalling Figure 3, it is then clear that two different behaviors for the spectral evolution can be defined with respect to the collection and pumping angle. To better understand the dependence on the collection angle, the ratio of the fluorescence spectra at the different angles with respect to the one at normal incidence (collected at 0°) was considered, and their plots are gathered in a map reported in Figure 6, panel (a). For the sake of comparison, a subset of the second derivative of the TE component of the T map measured impinging from the front side (see Appendix A.2, Figure A2) is reported in panel (b) of Figure 6.
The dispersion of the spectral features can be identified in either the fluorescence or T maps, highlighting the interplay between the GNA plasmonic modes and the fluorescence emission. This agrees with the literature where the explanation of the coupling mechanism is proposed in terms of excitation transfer between plasmonic resonances and dyes. According to Lackoviz [7], emission efficiency is critically related to a direct interaction between the plasmonic modes with the far-field radiation, either in absorption or in emission [8,9,10]. In our case, the structure periodicity guarantees the optical coupling of the LSPR and SPP plasmonic resonances.
Specifically, Chan et al. in [26] give an interpretation of the complexity of such an interplay, going beyond the pure Purcell effect due to field enhancement. They also report the collection of fluorescence emission spectra showing the clear signature of a single plasmonic mode overlapped with the dye emission spectral range. Consistently, as in our case, several different plasmonic modes contribute to reshaping the fluorescence signal.
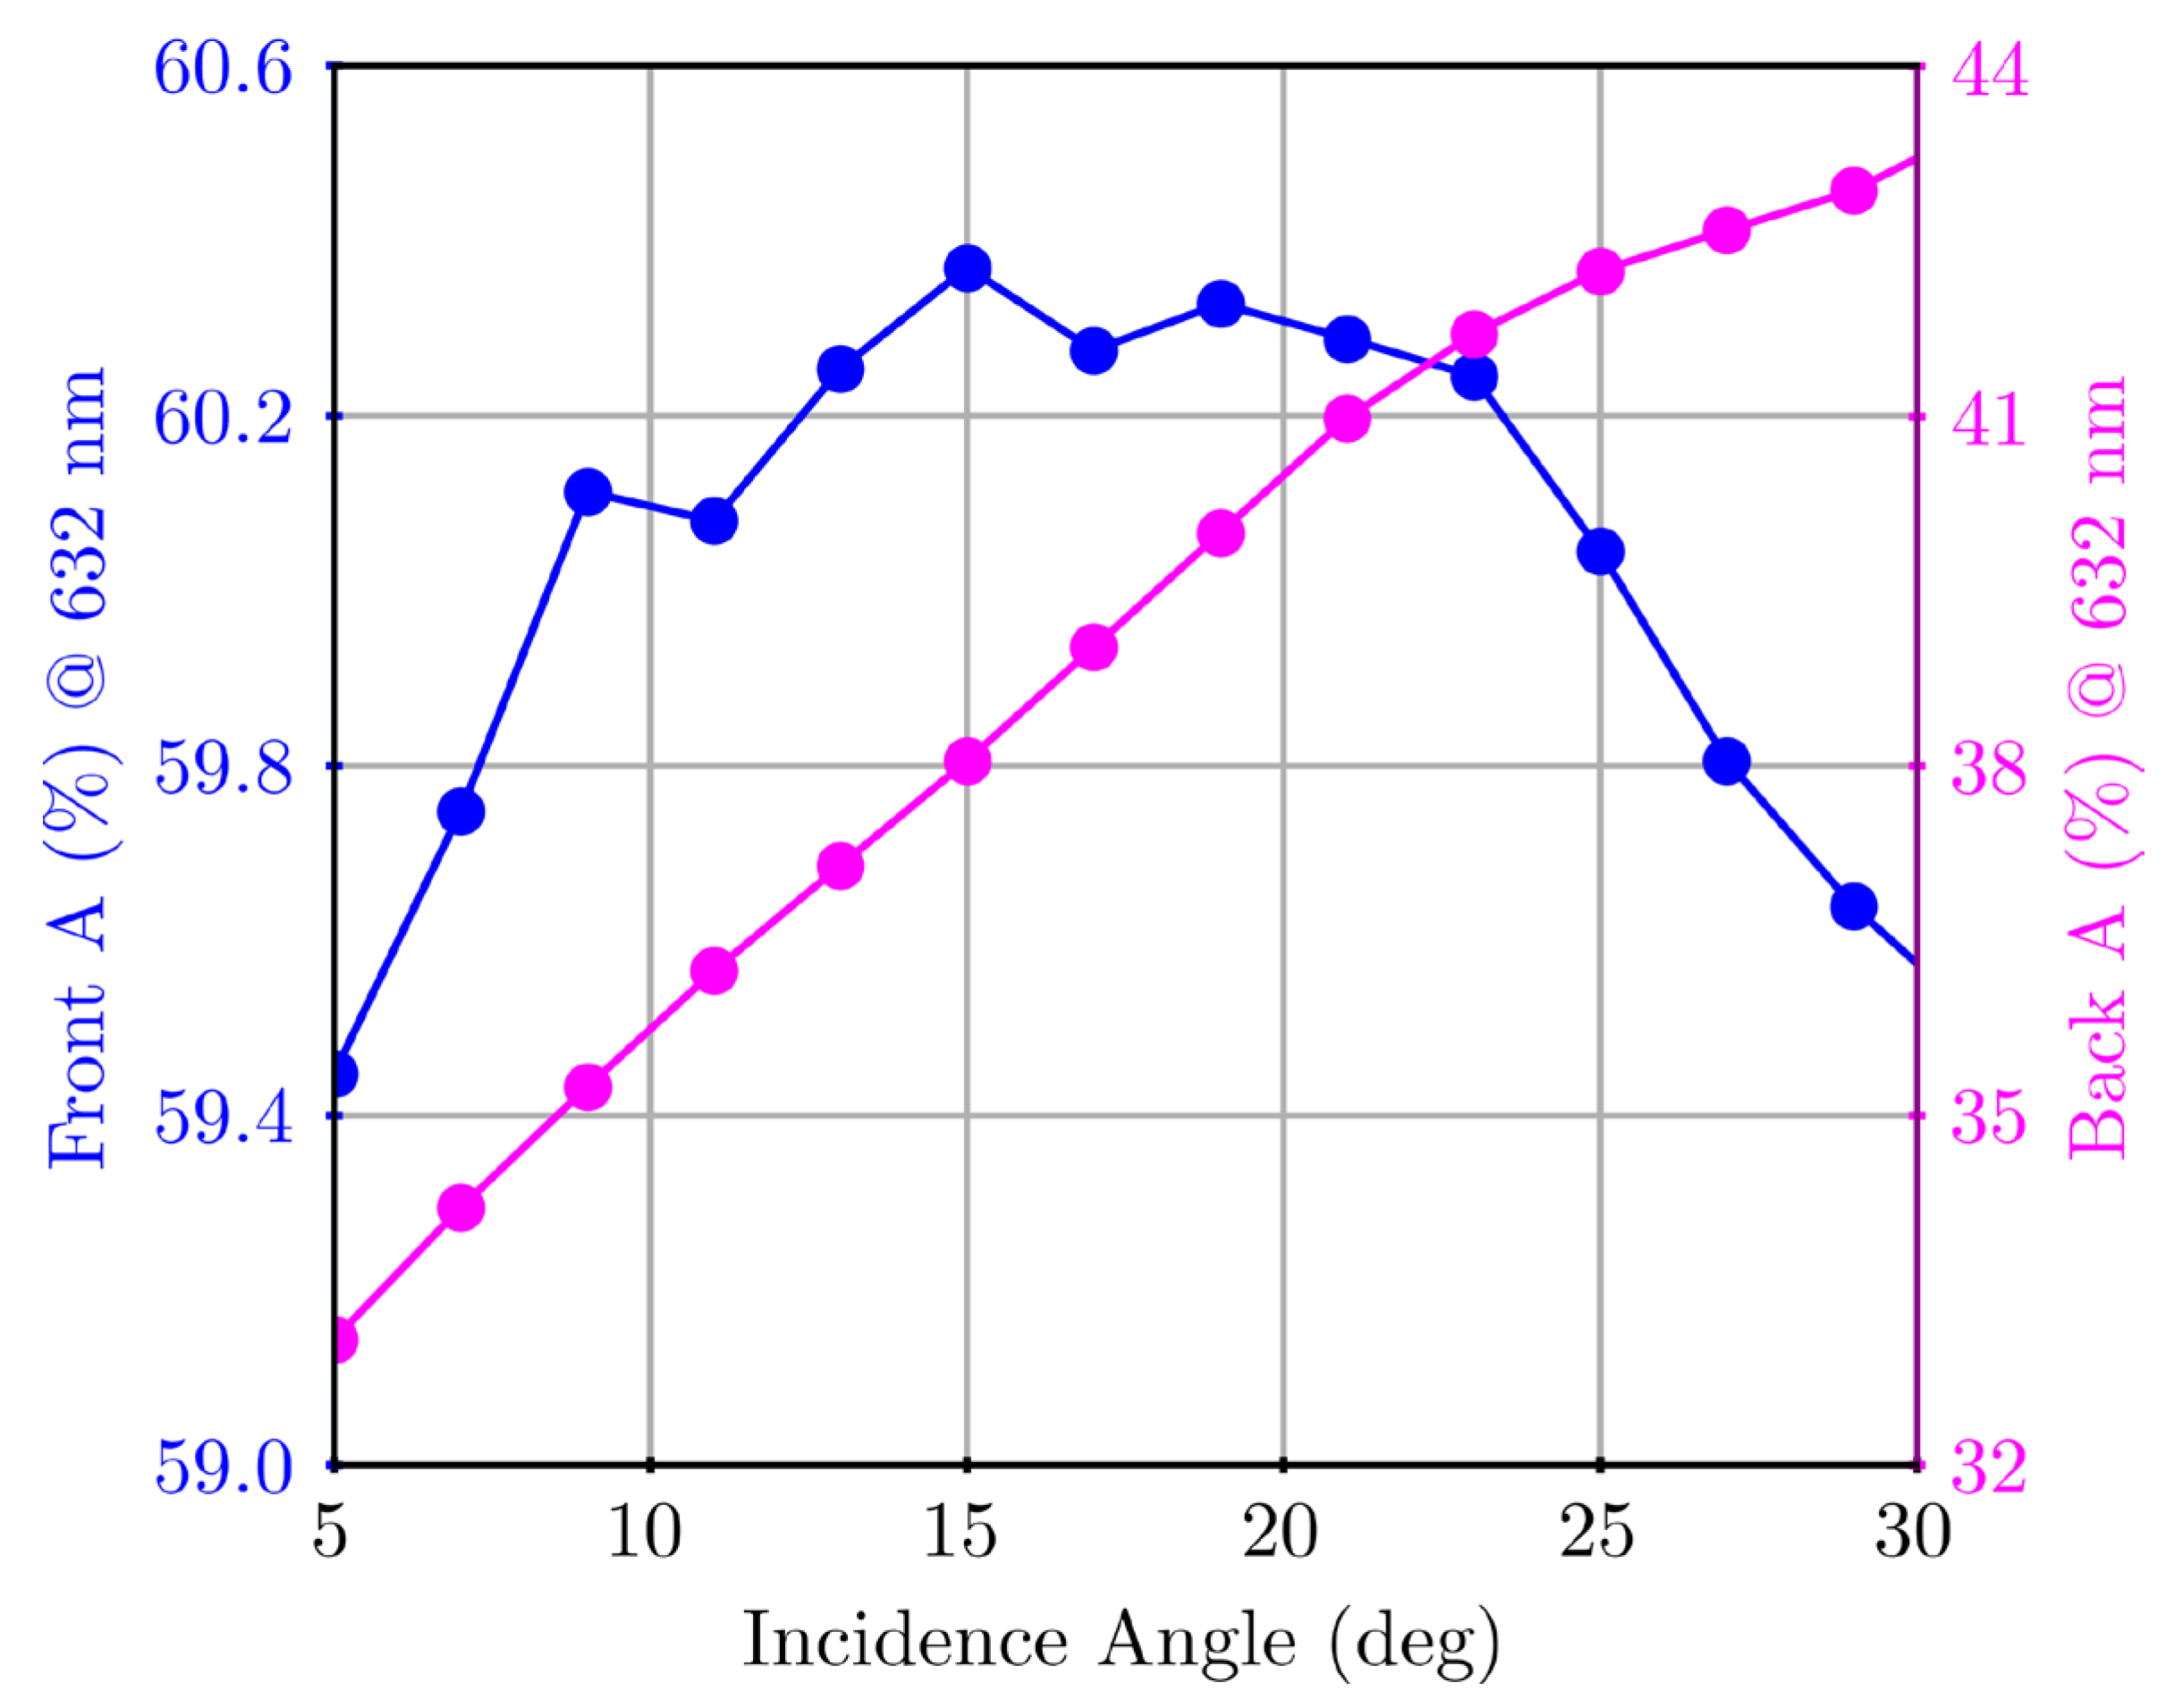
Instead, the influence of the pumping angle can be understood by focusing on the absorbance (A), defined as A = 1−R-T, evaluated at the pumping laser wavelength of 632 nm. In Figure 7, A is presented for both front and back configurations as a function of the incident angle. For the sake of completeness, the variable-incidence-angle A maps are reported in Appendix A.2, Figure A3. Regarding the front configuration, a tiny variation in A intensity is observed with a maximum in the range of (15÷20)°. On the contrary, a relatively large variation occurs for the back configuration with a monotonic growth until 20° and a subsequent slowdown in growth for higher angles.
This is perfectly in line with the fluorescence results when considered together with the increase in absorbance at 632 nm This can also be easily correlated to the crossing highlighted in Figure 5 between the laser excitation wavelength, with the GNA plasmonic modes around (15÷20)°.
This represents the fraction of energy that is stored in the plasmonic modes excited with a specific wavelength but at different angles.
In addition, when focusing on the pumping mechanism, the plasmonic contribution to fluorescence is crucial. Remarkably, it can be noticed that the absorbance in the front configuration is roughly twice the intensity of the back configuration. Therefore, it is not surprising that, as observed above, the largest fluorescence intensities are measured when pumping from the front side. Furthermore, the pumping wavelength is set within the spectral region below the band gap around 680, exciting selectively the plasmonic resonances lying down on the front surface, as reported in [35,36]. These modes are characterized by a higher efficiency with respect to resonance centered around 780 nm (at 0°) thanks to a narrower bandwidth and a longer decay time [26].
In fact, the fluorescence signal is systematically and significantly larger when pumping from the front side. A contribution to the enhancement can also be identified in emission, in this case for wavelengths above the band gap, but it is much less effective.
The synergic combination of all the listed contributions to both pumping and collection, leads to an enhancement in the fluorescence signal. Figure 8 reports a comparison of the fluorescence signals for each of the four measurement configurations. The enhancement was evaluated as the ratio of the fluorescence spectra collected on the PEF platform with respect to the analogous measurement performed on the ATTO700 directly drop-casted on a bare SiO2 substrate with PEL layers and no plasmonic metasurface underneath.
It can be clearly seen how the enhancement in the fluorescence signal for all the measurements performed with the support of the PEF platform is constantly relevant. Consistent with our findings, the highest enhancements are visible when pumping from the front, as visible in Figure 8 panels (a) and (b). In fact, the fluorescence signal collected from the PEF platform is enhanced roughly 40 and 60 times with respect to the bare glass reference, considering the collection from the same side (the front) and the back side, respectively. Remarkably, the fluorescence signal is also enhanced when pumping from the back side and collecting from the back or the front sides, as shown in Figure 8 panels (c) and (d), respectively, but less efficiently, roughly about 20 times with respect to the reference.
5. Conclusions
The combination of an off-the-shelf GNA, commonly used for SPR biosensing, and a commercial dye has been studied. The analysis was carried out in terms of spectral overlap between the complex (both LSPR and SPP) optical GNA response and the absorption and emission fluorophore features. The signature of the underneath GNA can be clearly recognized in the fluorescence emission spectra when considering their angular evolution. In addition, a remarkable fluorescence enhancement has been detected, depending on the specific measurement setup. Moreover, the largest enhancement is observed by pumping from the front side since the pumping beam is resonantly coupled to the plasmonic modes confined at the GNA-PEL interface, allowing the identification of a preferred measurement configuration.
Author Contributions
Conceptualization, F.M. and F.F.; methodology, F.F. and F.M.; validation, F.F., F.M. and M.A.; formal analysis, M.A.; investigation, E.M. and M.A.; resources, E.M., V.T. and P.P.; data curation, E.M. and M.A.; writing—original draft preparation V.T., E.M., M.A., F.F. and F.M.; writing—review and editing, F.M., F.F., E.M. and M.A.; visualization, F.M., F.F. and M.A.; supervision, F.M. and F.F.; project administration, F.F. and F.M.; funding acquisition, F.F. and F.M. All authors have read and agreed to the published version of the manuscript.
Funding
This research was co-funded by the European Union’s Horizon 2020 project h-ALO (photonic system for adaptable multiple-analyte monitoring of food quality), grant agreement No. 101016706, and by the European Union—FSE REACT-EU, PON Ricerca e Innovazione 2014–2020, funding number F11B21009090007.
Institutional Review Board Statement
Not applicable.
Informed Consent Statement
Not applicable.
Data Availability Statement
The original contributions presented in the study are included in the article, further inquiries can be directed to the corresponding authors.
Conflicts of Interest
Authors Eliana Manobianco, Paola Pellacani and Valentina Tolardo were employed by the company Plasmore S.r.l. The remaining authors declare that the research was conducted in the absence of any commercial or financial relationships that could be construed as a potential conflict of interest.
Appendix A
Appendix A.1. Surface Plasmon Polariton Dispersion
The SPP dispersion relation was calculated using the simple theoretical model reported by Giudicatti in [31]. The energies of the SPPs are determined by the following equation:
where εd represents the permittivity of the dielectric medium interfacing with the gold surface, qmn denotes the reciprocal lattice vectors for the hexagonal lattice (Figure A3), and k0 sinθ is the in-plane wavevector of the incident light. The azimuthal angle Φ in this context accounts for the lattice orientation.
Appendix A.2. Variable-Angle Spectra
Figure A1 and Figure A2 show the variable-angle R and T spectra, respectively, acquired by impinging from the front side (panels (a), (b)) and from the back side of the sample (panels (c) and (d) for different light polarization (TE or TM). Figure A3 reports the A maps calculated from the R and T spectra. In both cases, the red line indicates the He-Ne CW laser line at 632 nm.
Figure A1.
Variable-incidence-angle R spectra for both TE and TM polarization. Panels (a,b) display the curves resulting from the spectra measured by impinging with the white source from the front side of the sample, while panels (c,d) display those resulting from the back side, respectively. The dashed black line indicates the pumping laser line at 632 nm.

Figure A2.
Variable-incidence-angle T spectra for both TE and TM polarization. Panels (a,b) display the curves resulting from the spectra measured by impinging with the white source from the front side of the sample, while panels (c,d) display those resulting from the back side, respectively. The dashed black line indicates the pumping laser line at 632 nm.

Figure A3.
Calculated variable-incidence-angle A spectra for both TE and TM polarization. Panels (a,b) display the curves resulting from the spectra measured by impinging with the white source from the front side of the sample, while panels (c,d) display those resulting from the back side, respectively. The dashed black line indicates the pumping laser line at 632 nm.

References
- Liang, X.; Li, N.; Zhang, R.; Yin, P.; Zhang, C.; Yang, N.; Liang, K.; Kong, B. Carbon-Based SERS Biosensor: From Substrate Design to Sensing and Bioapplication. NPG Asia Mater. 2021, 13, 8. [Google Scholar] [CrossRef]
- Golparvar, A.; Kim, J.; Boukhayma, A.; Briand, D.; Carrara, S. Highly Accurate Multimodal Monitoring of Lactate and Urea in Sweat by Soft Epidermal Optofluidics with Single-Band Raman Scattering. Sens. Actuators B Chem. 2023, 387, 133814. [Google Scholar] [CrossRef]
- Jack, G.C.; James, N.P. Photochemistry; Wiley: Hoboken, NJ, USA, 1966; Volume 378. [Google Scholar]
- Chance, R.R.; Prock, A.; Silbey, R. Molecular Fluorescence and Energy Transfer Near Interfaces. In Advances in Chemical Physics; Prigogine, I., Rice, S.A., Eds.; John Wiley & Sons, Inc.: Hoboken, NJ, USA, 1978; Volume XXXVII, pp. 1–65. [Google Scholar]
- Barnes, W.L. Fluorescence near Interfaces: The Role of Photonic Mode Density. J. Mod. Opt. 1998, 45, 661–699. [Google Scholar] [CrossRef]
- Ford, G.W.; Weber, W.H. Electromagnetic Interactions of Molecules with Metal Surfaces. Phys. Rep. 1984, 113, 195–287. [Google Scholar] [CrossRef]
- Kitson, S.C.; Barnes, W.L.; Sambles, J.R. Surface-Plasmon Energy Gaps and Photoluminescence. Phys. Rev. B 1995, 52, 11441–11445. [Google Scholar] [CrossRef]
- Liebermann, T.; Knoll, W. Surface-Plasmon Field-Enhanced Fluorescence Spectroscopy. Colloids Surf. A Physicochem. Eng. Asp. 2000, 171, 115–130. [Google Scholar] [CrossRef]
- Lakowicz, J.R. Radiative Decay Engineering: Biophysical and Biomedical Applications. Anal. Biochem. 2001, 298, 1–24. [Google Scholar] [CrossRef]
- Geddes, C.D.; Lakowicz, R. Metal-Enhanced Fluorescence. J. Fluoresc. 2002, 15, 124–129. [Google Scholar]
- Lakowicz, J.R. Radiative Decay Engineering 5: Metal-Enhanced Fluorescence and Plasmon Emission. Anal. Biochem. 2005, 337, 171–194. [Google Scholar] [CrossRef]
- Fort, E.; Grésillon, S. Surface Enhanced Fluorescence. J. Phys. D Appl. Phys. 2008, 41, 013001. [Google Scholar] [CrossRef]
- Bauch, M.; Toma, K.; Toma, M.; Zhang, Q.; Dostalek, J. Plasmon-Enhanced Fluorescence Biosensors: A Review. Plasmonics 2014, 9, 781–799. [Google Scholar] [CrossRef]
- Osorio-Román, I.O.; Guerrero, A.R.; Albella, P.; Aroca, R.F. Plasmon Enhanced Fluorescence with Aggregated Shell-Isolated Nanoparticles. Anal. Chem. 2014, 86, 10246–10251. [Google Scholar] [CrossRef]
- Dong, J.; Zhang, Z.; Zheng, H.; Sun, M. Recent Progress on Plasmon-Enhanced Fluorescence. Nanophotonics 2015, 4, 472–490. [Google Scholar] [CrossRef]
- Li, J.-F.; Li, C.-Y.; Aroca, R.F. Plasmon-Enhanced Fluorescence Spectroscopy. Chem. Soc. Rev. 2017, 46, 3962–3979. [Google Scholar] [CrossRef]
- Jeong, Y.; Kook, Y.-M.; Lee, K.; Koh, W.-G. Metal Enhanced Fluorescence (MEF) for Biosensors: General Approaches and a Review of Recent Developments. Biosens. Bioelectron. 2018, 111, 102–116. [Google Scholar] [CrossRef]
- Liu, Y.; Blair, S. Fluorescence Enhancement from an Array of Subwavelength Metal Apertures. Opt. Lett. 2003, 28, 507. [Google Scholar] [CrossRef]
- Andrew, P.; Barnes, W.L. Molecular Fluorescence above Metallic Gratings. Phys. Rev. B 2001, 64, 125405. [Google Scholar] [CrossRef]
- Jiang, Y.; Wang, H.-Y.; Wang, H.; Gao, B.-R.; Hao, Y.; Jin, Y.; Chen, Q.-D.; Sun, H.-B. Surface Plasmon Enhanced Fluorescence of Dye Molecules on Metal Grating Films. J. Phys. Chem. C 2011, 115, 12636–12642. [Google Scholar] [CrossRef]
- Garrett, S.H.; Smith, L.H.; Barnes, W.L. Fluorescence in the Presence of Metallic Hole Arrays. J. Mod. Opt. 2005, 52, 1105–1122. [Google Scholar] [CrossRef]
- Lakowicz, J.R.; Ray, K.; Chowdhury, M.; Szmacinski, H.; Fu, Y.; Zhang, J.; Nowaczyk, K. Plasmon-Controlled Fluorescence: A New Paradigm in Fluorescence Spectroscopy. Analyst 2008, 133, 1308. [Google Scholar] [CrossRef]
- Cui, X.; Tawa, K.; Hori, H.; Nishii, J. Tailored Plasmonic Gratings for Enhanced Fluorescence Detection and Microscopic Imaging. Adv. Funct. Mater. 2010, 20, 546–553. [Google Scholar] [CrossRef]
- Cui, X.; Tawa, K.; Kintaka, K.; Nishii, J. Enhanced Fluorescence Microscopic Imaging by Plasmonic Nanostructures: From a 1D Grating to a 2D Nanohole Array. Adv. Funct. Mater. 2010, 20, 945–950. [Google Scholar] [CrossRef]
- Langguth, L.; Punj, D.; Wenger, J.; Koenderink, A.F. Plasmonic Band Structure Controls Single-Molecule Fluorescence. ACS Nano 2013, 7, 8840–8848. [Google Scholar] [CrossRef] [PubMed]
- Chan, K.F.; Hui, K.C.; Li, J.; Fok, C.H.; Ong, H.C. Roles of Surface Plasmon Polaritons in Fluorescence Enhancement. In Surface Plasmon Enhanced, Coupled and Controlled Fluorescence; Geddes, C.D., Ed.; John Wiley & Sons, Inc.: Hoboken, NJ, USA, 2017; pp. 91–109. ISBN 978-1-119-32516-1. [Google Scholar]
- Min, J.; Son, T.; Hong, J.S.; Cheah, P.S.; Wegemann, A.; Murlidharan, K.; Weissleder, R.; Lee, H.; Im, H. Hyungsoon Plasmon-Enhanced Biosensing for Multiplexed Profiling of Extracellular Vesicles. Adv. Biosyst. 2020, 4, 2000003. [Google Scholar] [CrossRef] [PubMed]
- Izumi, S.; Yamamura, S.; Hayashi, N.; Toma, M.; Tawa, K. Dual-Color Fluorescence Imaging of EpCAM and EGFR in Breast Cancer Cells with a Bull’s Eye-Type Plasmonic Chip. Sensors 2017, 17, 2942. [Google Scholar] [CrossRef] [PubMed]
- Zhang, Q.; Wu, L.; Wong, T.I.; Zhang, J.; Liu, X.; Zhou, X.; Bai, P.; Liedberg, B.; Wang, Y. Surface Plasmon-Enhanced Fluorescence on Au Nanohole Array for Prostate-Specific Antigen Detection. Int. J. Nanomed. 2017, 12, 2307–2314. [Google Scholar] [CrossRef]
- Semeniak, D.; Cruz, D.F.; Chilkoti, A.; Mikkelsen, M.H. Plasmonic Fluorescence Enhancement in Diagnostics for Clinical Tests at Point-of-Care: A Review of Recent Technologies. Adv. Mater. 2023, 35, 2107986. [Google Scholar] [CrossRef] [PubMed]
- Giudicatti, S.; Valsesia, A.; Marabelli, F.; Colpo, P.; Rossi, F. Plasmonic Resonances in Nanostructured Gold/Polymer Surfaces by Colloidal Lithography: Plasmonic Resonances in Nanostructured Gold/Polymer Surfaces. Phys. Stat. Sol. 2010, 207, 935–942. [Google Scholar] [CrossRef]
- Giudicatti, S.; Marabelli, F.; Valsesia, A.; Pellacani, P.; Colpo, P.; Rossi, F. Interaction among Plasmonic Resonances in a Gold Film Embedding a Two-Dimensional Array of Polymeric Nanopillars. J. Opt. Soc. Am. B 2012, 29, 1641. [Google Scholar] [CrossRef]
- Bottazzi, B.; Fornasari, L.; Frangolho, A.; Giudicatti, S.; Mantovani, A.; Marabelli, F.; Marchesini, G.; Pellacani, P.; Therisod, R.; Valsesia, A. Multiplexed Label-Free Optical Biosensor for Medical Diagnostics. J. Biomed. Opt. 2014, 19, 017006. [Google Scholar] [CrossRef]
- Angelini, M.; Zagaglia, L.; Marabelli, F.; Floris, F. Convergence and Performance Analysis of a Particle Swarm Optimization Algorithm for Optical Tuning of Gold Nanohole Arrays. Materials 2024, 17, 807. [Google Scholar] [CrossRef] [PubMed]
- Angelini, M.; Manobianco, E.; Pellacani, P.; Floris, F.; Marabelli, F. Plasmonic Modes and Fluorescence Enhancement Coupling Mechanism: A Case with a Nanostructured Grating. Nanomaterials 2022, 12, 4339. [Google Scholar] [CrossRef]
- Angelini, M.; Manobianco, E.; Pellacani, P.; Floris, F.; Marabelli, F. Refractive Index Dependence of Fluorescence Enhancement in a Nanostructured Plasmonic Grating. Materials 2023, 16, 1289. [Google Scholar] [CrossRef]
- Available online: https://h-alo.eu/ (accessed on 23 April 2024).
- Guo, H.; Li, J.; Li, Y.; Wu, D.; Ma, H.; Wei, Q.; Du, B. A Turn-on Fluorescent Sensor for Hg 2+ Detection Based on Graphene Oxide and DNA Aptamers. New J. Chem. 2018, 42, 11147–11152. [Google Scholar] [CrossRef]
- Nelis, J.L.D.; Tsagkaris, A.S.; Zhao, Y.; Lou-Franco, J.; Nolan, P.; Zhou, H.; Cao, C.; Rafferty, K.; Hajslova, J.; Elliott, C.T.; et al. The End User Sensor Tree: An End-User Friendly Sensor Database. Biosens. Bioelectron. 2019, 130, 245–253. [Google Scholar] [CrossRef]
- Forzani, E.S.; Zhang, H.; Chen, W.; Tao, N. Detection of Heavy Metal Ions in Drinking Water Using a High-Resolution Differential Surface Plasmon Resonance Sensor. Environ. Sci. Technol. 2005, 39, 1257–1262. [Google Scholar] [CrossRef]
- Bolognesi, M.; Prosa, M.; Toerker, M.; Lopez Sanchez, L.; Wieczorek, M.; Giacomelli, C.; Benvenuti, E.; Pellacani, P.; Elferink, A.; Morschhauser, A.; et al. A Fully Integrated Miniaturized Optical Biosensor for Fast and Multiplexing Plasmonic Detection of High- and Low-Molecular-Weight Analytes. Adv. Mater. 2023, 35, 2208719. [Google Scholar] [CrossRef]
- Benvenuti, E.; Moschetto, S.; Angelini, M.; Marabelli, F.; Natali, M.; Pellacani, P.; Bolognesi, M.; Prosa, M.; Toffanin, S. Design of an Optical Sensor Based on Organic Optoelectronics and Nanoplasmonics for Multiplex and Multimodal Detection. Org. Electron. 2024, 128, 107023. [Google Scholar] [CrossRef]
- Glinel, K.; Moussa, A.; Jonas, A.M.; Laschewsky, A. Influence of Polyelectrolyte Charge Density on the Formation of Multilayers of Strong Polyelectrolytes at Low Ionic Strength. Langmuir 2002, 18, 1408–1412. [Google Scholar] [CrossRef]
- Nicol, E.; Habib-Jiwan, J.-L.; Jonas, A.M. Polyelectrolyte Multilayers as Nanocontainers for Functional Hydrophilic Molecules. Langmuir 2003, 19, 6178–6186. [Google Scholar] [CrossRef]
Figure 1.
Scanning electron microscope image of the plasmonic metasurface.

Figure 2.
Panel (a): PEF platform stack layout and fluorescence measurement configurations. Panel (b): Scheme of the custom optical setup for either pumping (α) or collection (β) of angle-resolved fluorescence measurements.
Figure 2.
Panel (a): PEF platform stack layout and fluorescence measurement configurations. Panel (b): Scheme of the custom optical setup for either pumping (α) or collection (β) of angle-resolved fluorescence measurements.

Figure 3.
Variable-angle fluorescence spectra of ATTO700 dye measured on the PEF platform by impinging and collecting on opposite sides. Panels (a,b) report the spectra collected when illuminating from the front side and collecting from the back one. Panels (c,d) refer to the pumping on the back side and collection from the front one. Spectra are shown as a function of the pumping angle α in panels (a,c), in contrast to the collection angle β in panels (b,d).

Figure 4.
Variable-angle fluorescence spectra of ATTO700 dye measured on the PEF platform by impinging and collecting from the same side. Panels (a,b) report the spectra corresponding to the front-side measurements. Panels (c,d) report the spectra corresponding to the back side ones. Spectra are shown as a function of the pumping angle α in panels (a,c), in contrast to the collection angle β in panels (b,d).

Figure 5.
Second derivative of variable-incidence-angle R spectra for both TE and TM polarization. Panels (a,b) display the curves resulting from the spectra measured by impinging from the front side, while panels (c,d) display the curves from the back side, respectively. The dashed red line indicates He-Ne pumping at 632 nm. The black curves in panel (d) are the SPP dispersion branches calculated with the model in Appendix A.2 at the back side.

Figure 6.
Panel (a): map of the fluorescence spectral ratios at the different collection angles with respect to the one at normal incidence (collection angle 0°) for a pumping angle of 20°. Panel (b): second derivative of the T spectra (TE-component) in the fluorescence range detection.
Figure 6.
Panel (a): map of the fluorescence spectral ratios at the different collection angles with respect to the one at normal incidence (collection angle 0°) for a pumping angle of 20°. Panel (b): second derivative of the T spectra (TE-component) in the fluorescence range detection.

Figure 7.
Angular dependence of the absorbance evaluated at the pumping wavelength of 632 nm.

Figure 8.
Fluorescence spectra measured on the PEF platform and on the reference glass slide. The signal is multiplied by a factor of 20 for the different measurement configurations. Pump and collection from the front (a) and back sides (c), respectively. (b) Pump from the front side and collection from the back side. (d) Pump from the back side and collection from the front side.

Disclaimer/Publisher’s Note: The statements, opinions and data contained in all publications are solely those of the individual author(s) and contributor(s) and not of MDPI and/or the editor(s). MDPI and/or the editor(s) disclaim responsibility for any injury to people or property resulting from any ideas, methods, instructions or products referred to in the content. |
© 2024 by the authors. Licensee MDPI, Basel, Switzerland. This article is an open access article distributed under the terms and conditions of the Creative Commons Attribution (CC BY) license (https://creativecommons.org/licenses/by/4.0/).
Share and Cite
MDPI and ACS Style
Floris, F.; Angelini, M.; Manobianco, E.; Pellacani, P.; Tolardo, V.; Marabelli, F. Angle-Resolved Fluorescence of a Dye Coupled to a Plasmonic Nanohole Array. Appl. Sci. 2024, 14, 3574. https://doi.org/10.3390/app14093574
AMA Style
Floris F, Angelini M, Manobianco E, Pellacani P, Tolardo V, Marabelli F. Angle-Resolved Fluorescence of a Dye Coupled to a Plasmonic Nanohole Array. Applied Sciences. 2024; 14(9):3574. https://doi.org/10.3390/app14093574
Chicago/Turabian StyleFloris, Francesco, Margherita Angelini, Eliana Manobianco, Paola Pellacani, Valentina Tolardo, and Franco Marabelli. 2024. "Angle-Resolved Fluorescence of a Dye Coupled to a Plasmonic Nanohole Array" Applied Sciences 14, no. 9: 3574. https://doi.org/10.3390/app14093574
Note that from the first issue of 2016, this journal uses article numbers instead of page numbers. See further details here.