

Alternative Method for Predicting Thermal Response in Two-Layer Systems

Wilson College of Textiles, North Carolina State University, Raleigh, NC 27606, USA
*
Author to whom correspondence should be addressed.
Appl. Sci. 2024, 14(9), 3576; https://doi.org/10.3390/app14093576
Submission received: 22 March 2024
/
Revised: 22 April 2024
/
Accepted: 23 April 2024
/
Published: 24 April 2024
(This article belongs to the Special Issue Advances in Protective Clothing Research Meeting the Challenges in the Changing World)
Abstract
:Thermal balance is paramount to human comfort and safety. To better understand the effects of the material and environment, a modified sweating-hot-plate test was used to incorporate environmental parameters such as the ventilation and microclimate thickness. It was found that at wind speeds ≤ 0.5 m/s, the environment has the most significant effect on the insulation. However, at an increased wind speed (1.3 m/s), the construction of the material has a large influence on the insulation of the system. At a low metabolic rate, the heat storage can be compensated for through dry heat loss; but, at a higher metabolic rate, substantial differences in the sweating rates are required based on the material and environment. The various aspects of the environment wind speed, microclimate thickness, and ventilation are crucial, but, in certain combinations, the material can have a significant impact as well.
1. Introduction
Protective clothing defends users from various toxic and environmental hazards [1,2]. While protection against external hazards is paramount, there also exists serious concerns about the internal accumulation of heat. Clothing is responsible for both the heat exchange of the user with the environment and protection against ambient hazards [3,4,5]. When the clothing is not able to dissipate the heat generated by the user, numerous issues can arise, such as changes in the skin and core temperatures. This can eventually lead to potential life-threating responses, such as heat stress and stroke [6,7,8]. Balancing the insulative properties of garments with the protective requirements is a delicate process [9].
Several aspects of the clothing and environment must be considered when evaluating the insulative properties. Previous studies have shown that the clothing fit and level of ventilation can have a significant impact on the total insulation provided by a clothing system [8,10,11]. Špelić et al. found that the inner air layer, enclosed between the user and the garment, can account for up to 60% of the total insulation of a garment system [12]. In firefighter turnout, manipulation of the air layer thickness was found to prolong the time until burns occurred [2,13]. Therefore, the material fit, and the subsequent microclimate thickness, have a significant impact on the insulation of garment systems. Similarly, other studies have found that ventilation via the garment and apertures also has a significant impact on the insulation [14,15]. It has also long been accepted that the wind speed decreases the insulation of the garment system as it increases due to the “stripping” of the boundary air layer [16]. The critical impact of the environment on the insulation of garment systems is clear.
Similarly, the construction and fibers of the garment itself are also important for heat exchange. Alberghini et al. showed that polyethylene fabrics could be used to improve cooling [17], but typically, the fabric construction parameters have a strong impact on the insulation properties of garments. Namely, it was thought that the material thickness is the most influential construction parameter of fabrics [18]. But some studies have shown that, in actuality, the air permeability of fabrics may be the most important construction parameter to consider [19,20]. However, in these studies, the fabrics used were not only of various air permeabilities but also had discrepancies in their thicknesses. This made it difficult to determine whether the air permeability of these materials was the main influence on the insulation when the thickness was a confounding variable. But there has certainly been evidence that air permeability has a significant impact on insulation.
Various test methods exist to predict the insulative performances of materials using various apparatuses, such as the heated sweating torso and sweating thermal manikin [21,22,23]. However, these tests are expensive and time-consuming. Therefore, one alternative test method is the sweating guarded hot plate. This test method is more convenient and uses less resources than the other ones mentioned, but it is not able to incorporate the environmental variables mentioned previously, such as the microclimate thickness and ventilation [24,25].
Despite the mentioned limitations, the results from these insulation measurement systems can be used to predict human thermal responses using the human heat balance equation, which can then be used to determine the changes in human physiology over a given time and workload, and to predict the response of the user [26]. This is a powerful methodology, as it allows for predictions of the performances of various materials and scenarios [27,28,29].
Therefore, experiments were carried out using a modified guarded-hot-plate test in order to assess and compare the insulative properties of materials of differing air permeabilities but similar thicknesses. This, in turn, yielded a more comprehensive understanding of the effect of air permeability on insulation. Additionally, different microclimate thicknesses, wind velocities, and insulation levels were investigated. Finally, the human heat balance equation was used to predict the thermal strain at different metabolic rates.
2. Materials and Methods
For these experiments, the environmental conditions were 21 °C and 65% rH. The tests were conducted on a small guarded hot plate, part of the Kawabata Evaluation System (KES), at the Textile Protection and Comfort Center (TPACC) at North Carolina State University; the apparatus can be seen in Figure 1. Figure 1 also outlines the test cross section and primary form of heat transfer at different sections. It is constructed of metal and has a test area of 10 × 10 cm. This device measures the power required, in watts, to maintain a temperature of 35 °C. This information can then be used to calculate the insulation (Rct,tot) using Equation (1). Additionally, there were different “spacers” that were used to provide different microclimate thicknesses (0, 5, 10, and 25 mm) and two spacer designs to give different levels of heat exchange via ventilation. These microclimate thicknesses were chosen because they represent the different fits and microclimates in garments. Thicknesses between 0 and 5 mm are more attuned to tight-fitting and compression garments and thicknesses of 10–25 mm are more representative of relaxed fits. The open-spacer design can also be seen in Figure 1. The closed-spacer design was the same but without the openings to reduce the ventilation of the system. Finally, 3 wind speeds of 0.25, 0.5, and 1.3 m/s were explored during the experiments. These were generated using small USB fans with different power settings to increase the wind speed (an example is seen in Figure 1), and the fan was located on the upper edge directly above the test area.
Table 1 below outlines the construction parameters of the samples used for these experiments. Fabric A was always used as the base layer in these trials. The top layer was either sample B, C, or D and was placed on the apparatus such that the technical face was in contact with the wind. Table 1 includes the Rct,tot values of the samples at the 0 mm air layer thickness with no additional layers. These tests were conducted on the sweating guarded hot plate (Thermetrics, WA) following ASTM F1868. The thickness and air permeability were derived at the physical testing lab at NC State using ASTM D1777 and ASTM D737, respectively.
The Rct,tot value from the experiments was calculated using Equation (1) below. This equation was also used to calculate the change in the Rct,tot in Section 3.1:
where Rct,tot is the total insulation of the system (m2 °C/W); Tp is the temperature of the plate surface (°C); Ta is the temperature of the environment (°C): Pgen is the power generated by the plate (W/m2).
Rct,tot = (Tp − Ta)/Pgen
Additionally, 2 different conditions were considered to calculate the human heat balance results: a low activity workload and high activity workload, and the values were approximated from ISO 8996:2021 [30]. These values were 150 W/m2 and 400 W/m2 for the low and high workloads, respectively. The heat storage and the resultant required sweat rate that needed to be compensated for were calculated using Equations (2) and (3), respectively:
where S is the heat storage; M is the metabolic rate; Wext is the external work (assumed to be 0 (W/m2); D is the dry heat loss; E is the evaporative heat loss; R is the respiratory heat loss;
where SR is the sweat rate (g/hr/m2); S is the heat storage (from Equation (2)); t is the time (3600 s); Hvap,w is the heat of evaporation of water (2430 J/g).
S = M − Wext ± D ± E ± R
SR = S × t/Hvap,w
3. Results
Section 3.1 outlines the Rct,tot values of the trials conducted on the small plate in different environmental conditions. Section 3.2 demonstrates the expected thermal burden using the human heat balance (Equations (2) and (3)) at the low metabolic rate, while Section 3.3 demonstrates the results at the high metabolic rate.
3.1. Rct,tot Values from Hot-Plate Testing
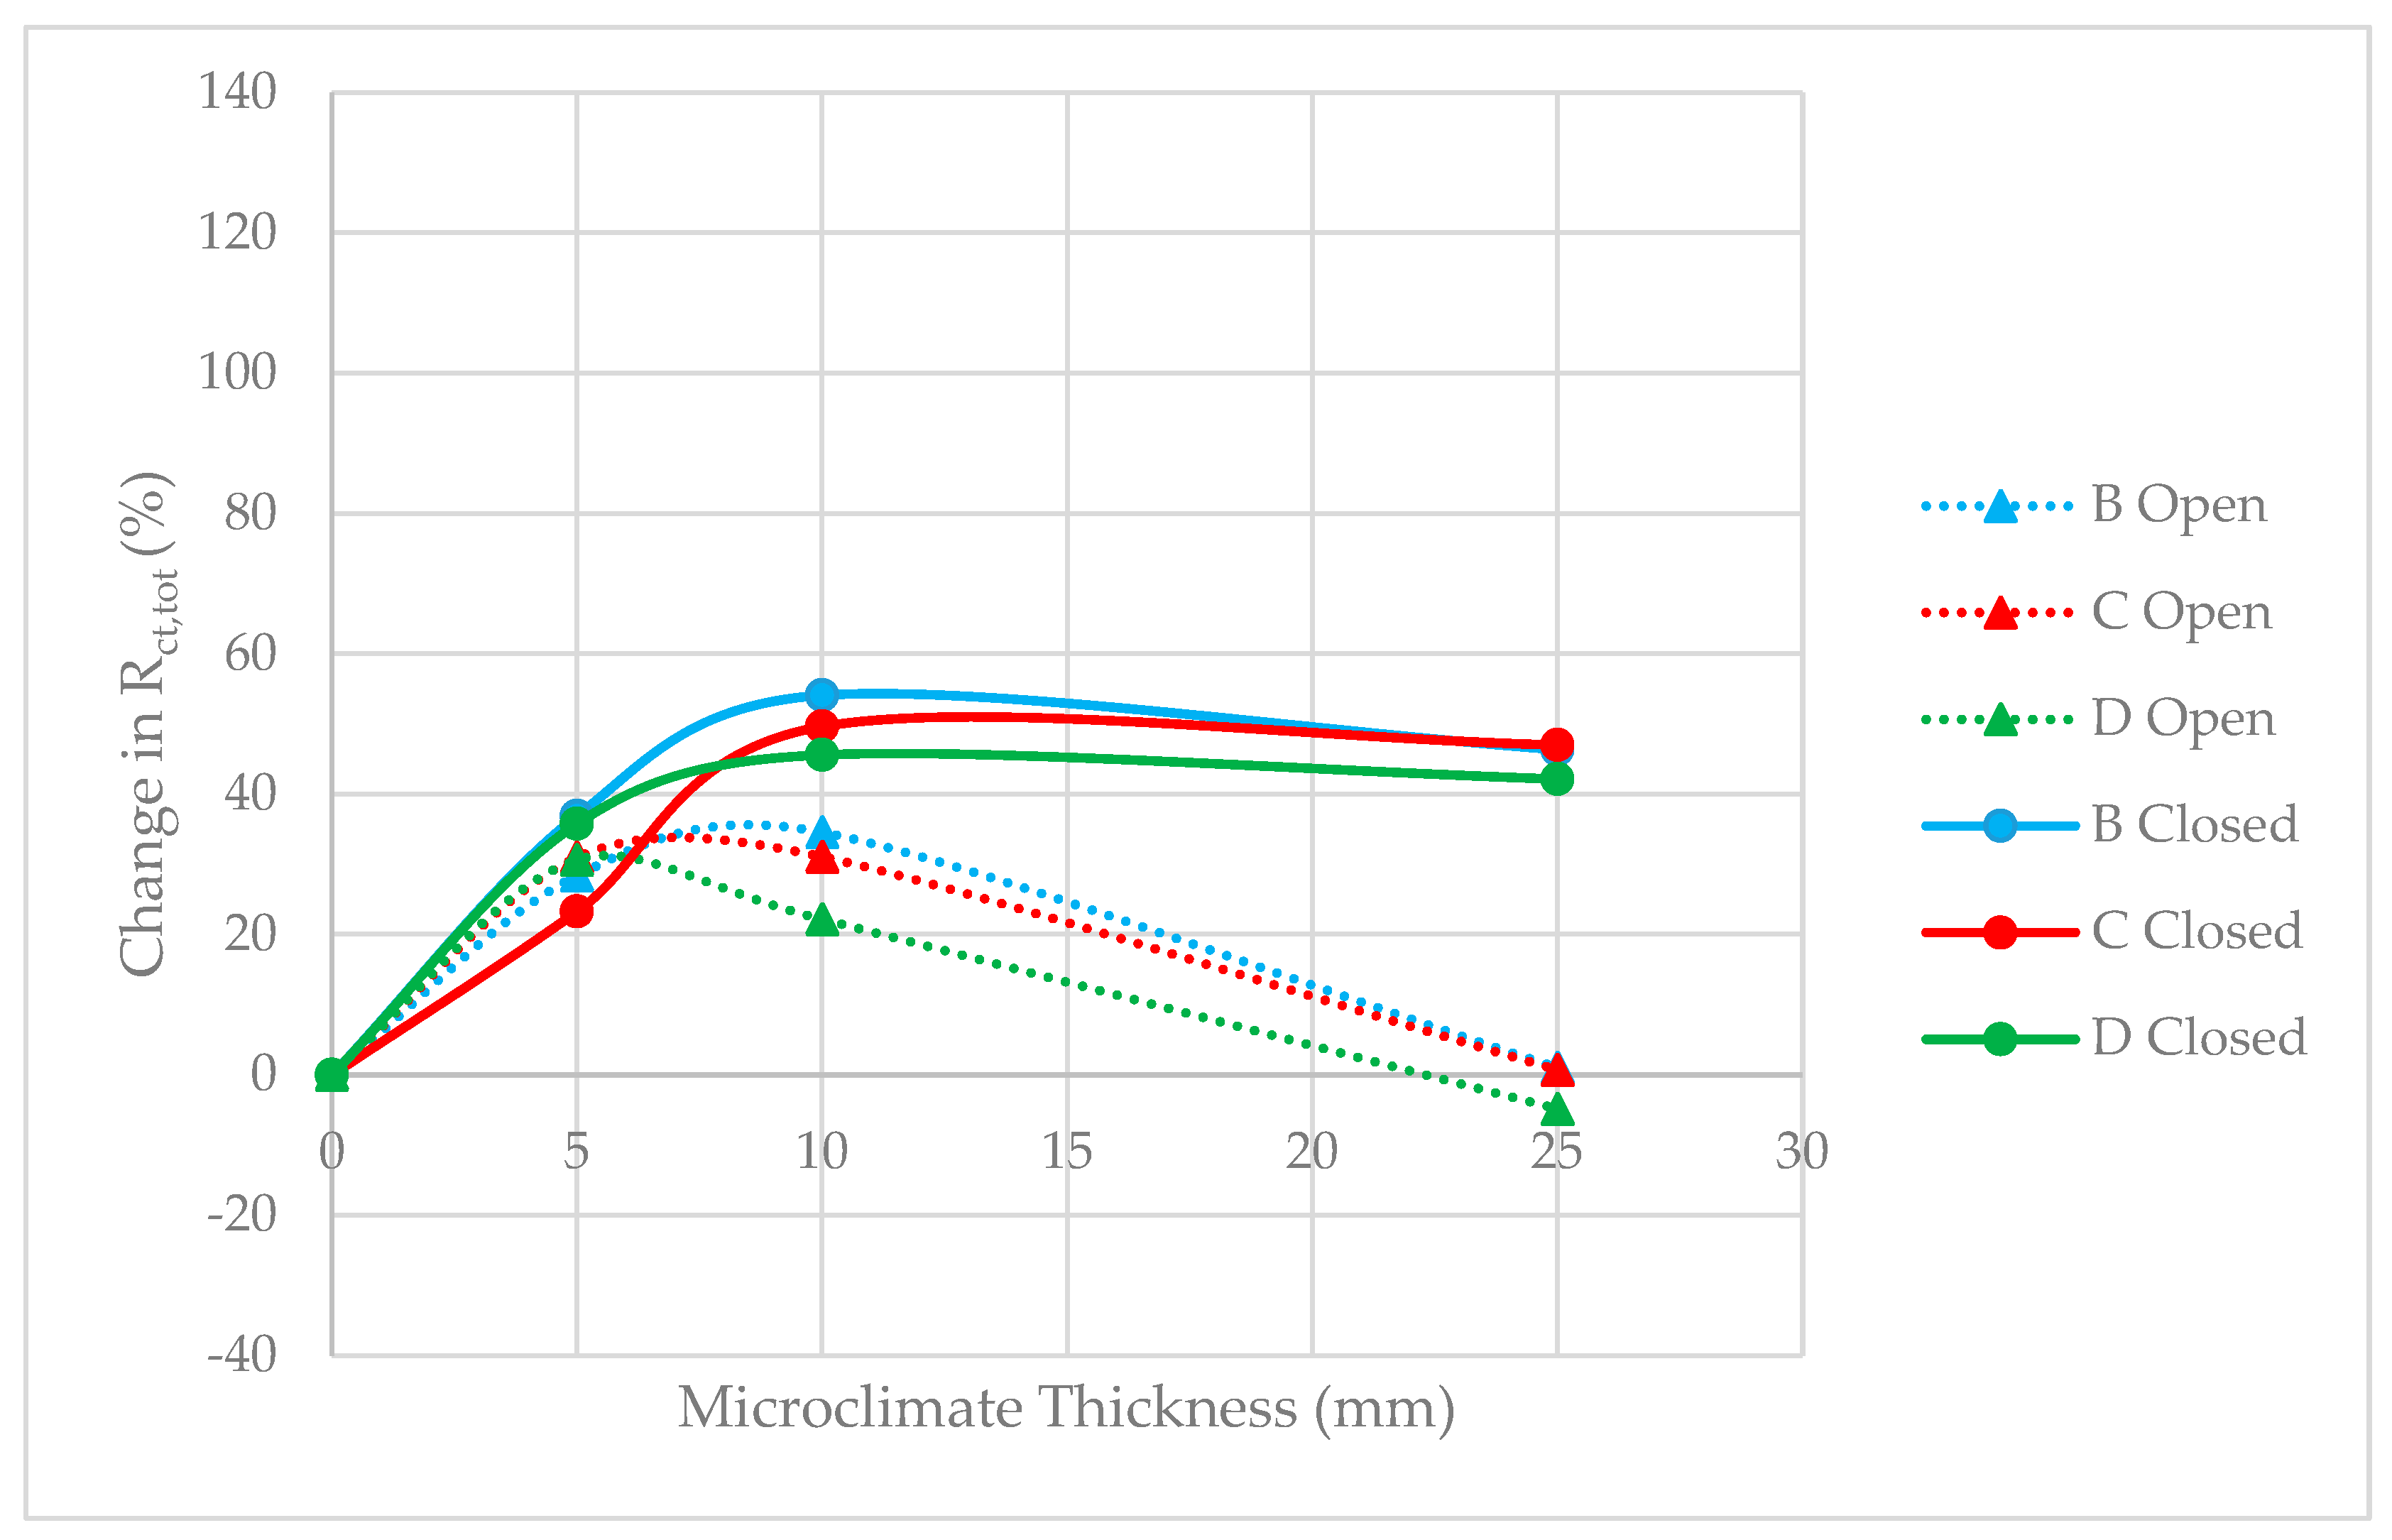
Figure 2 below outlines the change in the Rct,tot values with the increasing microclimate thickness at a 0.25 m/s wind speed. In all the figures, the dotted lines indicate the open-spacer design, and the solid lines represent the closed-spacer design. From the graph, both spacer designs show an increase in insulation until 5 mm, but, at the 10 mm microclimate thickness, the open-spacer design shows a decrease in insulation while the closed-spacer design shows a small increase and then a plateau. Sample C in the closed-spacer design shows a slightly lower increase in insulation, and samples B and D show a 23% increase vs. a 35% increase. Otherwise, the samples yielded similar changes in insulation values, except for sample D, which shows a slightly higher decrease in the open-spacer design at the 10 and 25 mm microclimate thicknesses and a decrease of −5% from the 0 mm microclimate thickness as opposed to samples B and C, which both show 1% increases.
Figure 3 below illustrates the results at the 0.5 m/s wind speed. Again, the dotted lines represented the open-spacer design, and the solid lines show the closed-spacer design. In the closed-spacer design, all of the samples showed similar changes in insulation, except at 25 mm, where sample D demonstrated a decrease from 10 mm, a drop of 10%, as opposed to the increases of 12 and 13% for samples B and C, respectively. Additionally, in the open-spacer design, sample D demonstrated a higher loss in insulation than either sample B or C at the 10 and 25 mm microclimate thicknesses compared to the 0 mm value. At 10 mm, the insulation was −14% for sample D, while it was 1 and 4% for samples B and C, respectively. At 25 mm, sample D exhibited a value of −27%, while samples B and C yielded values of −13 and −11%, respectively.
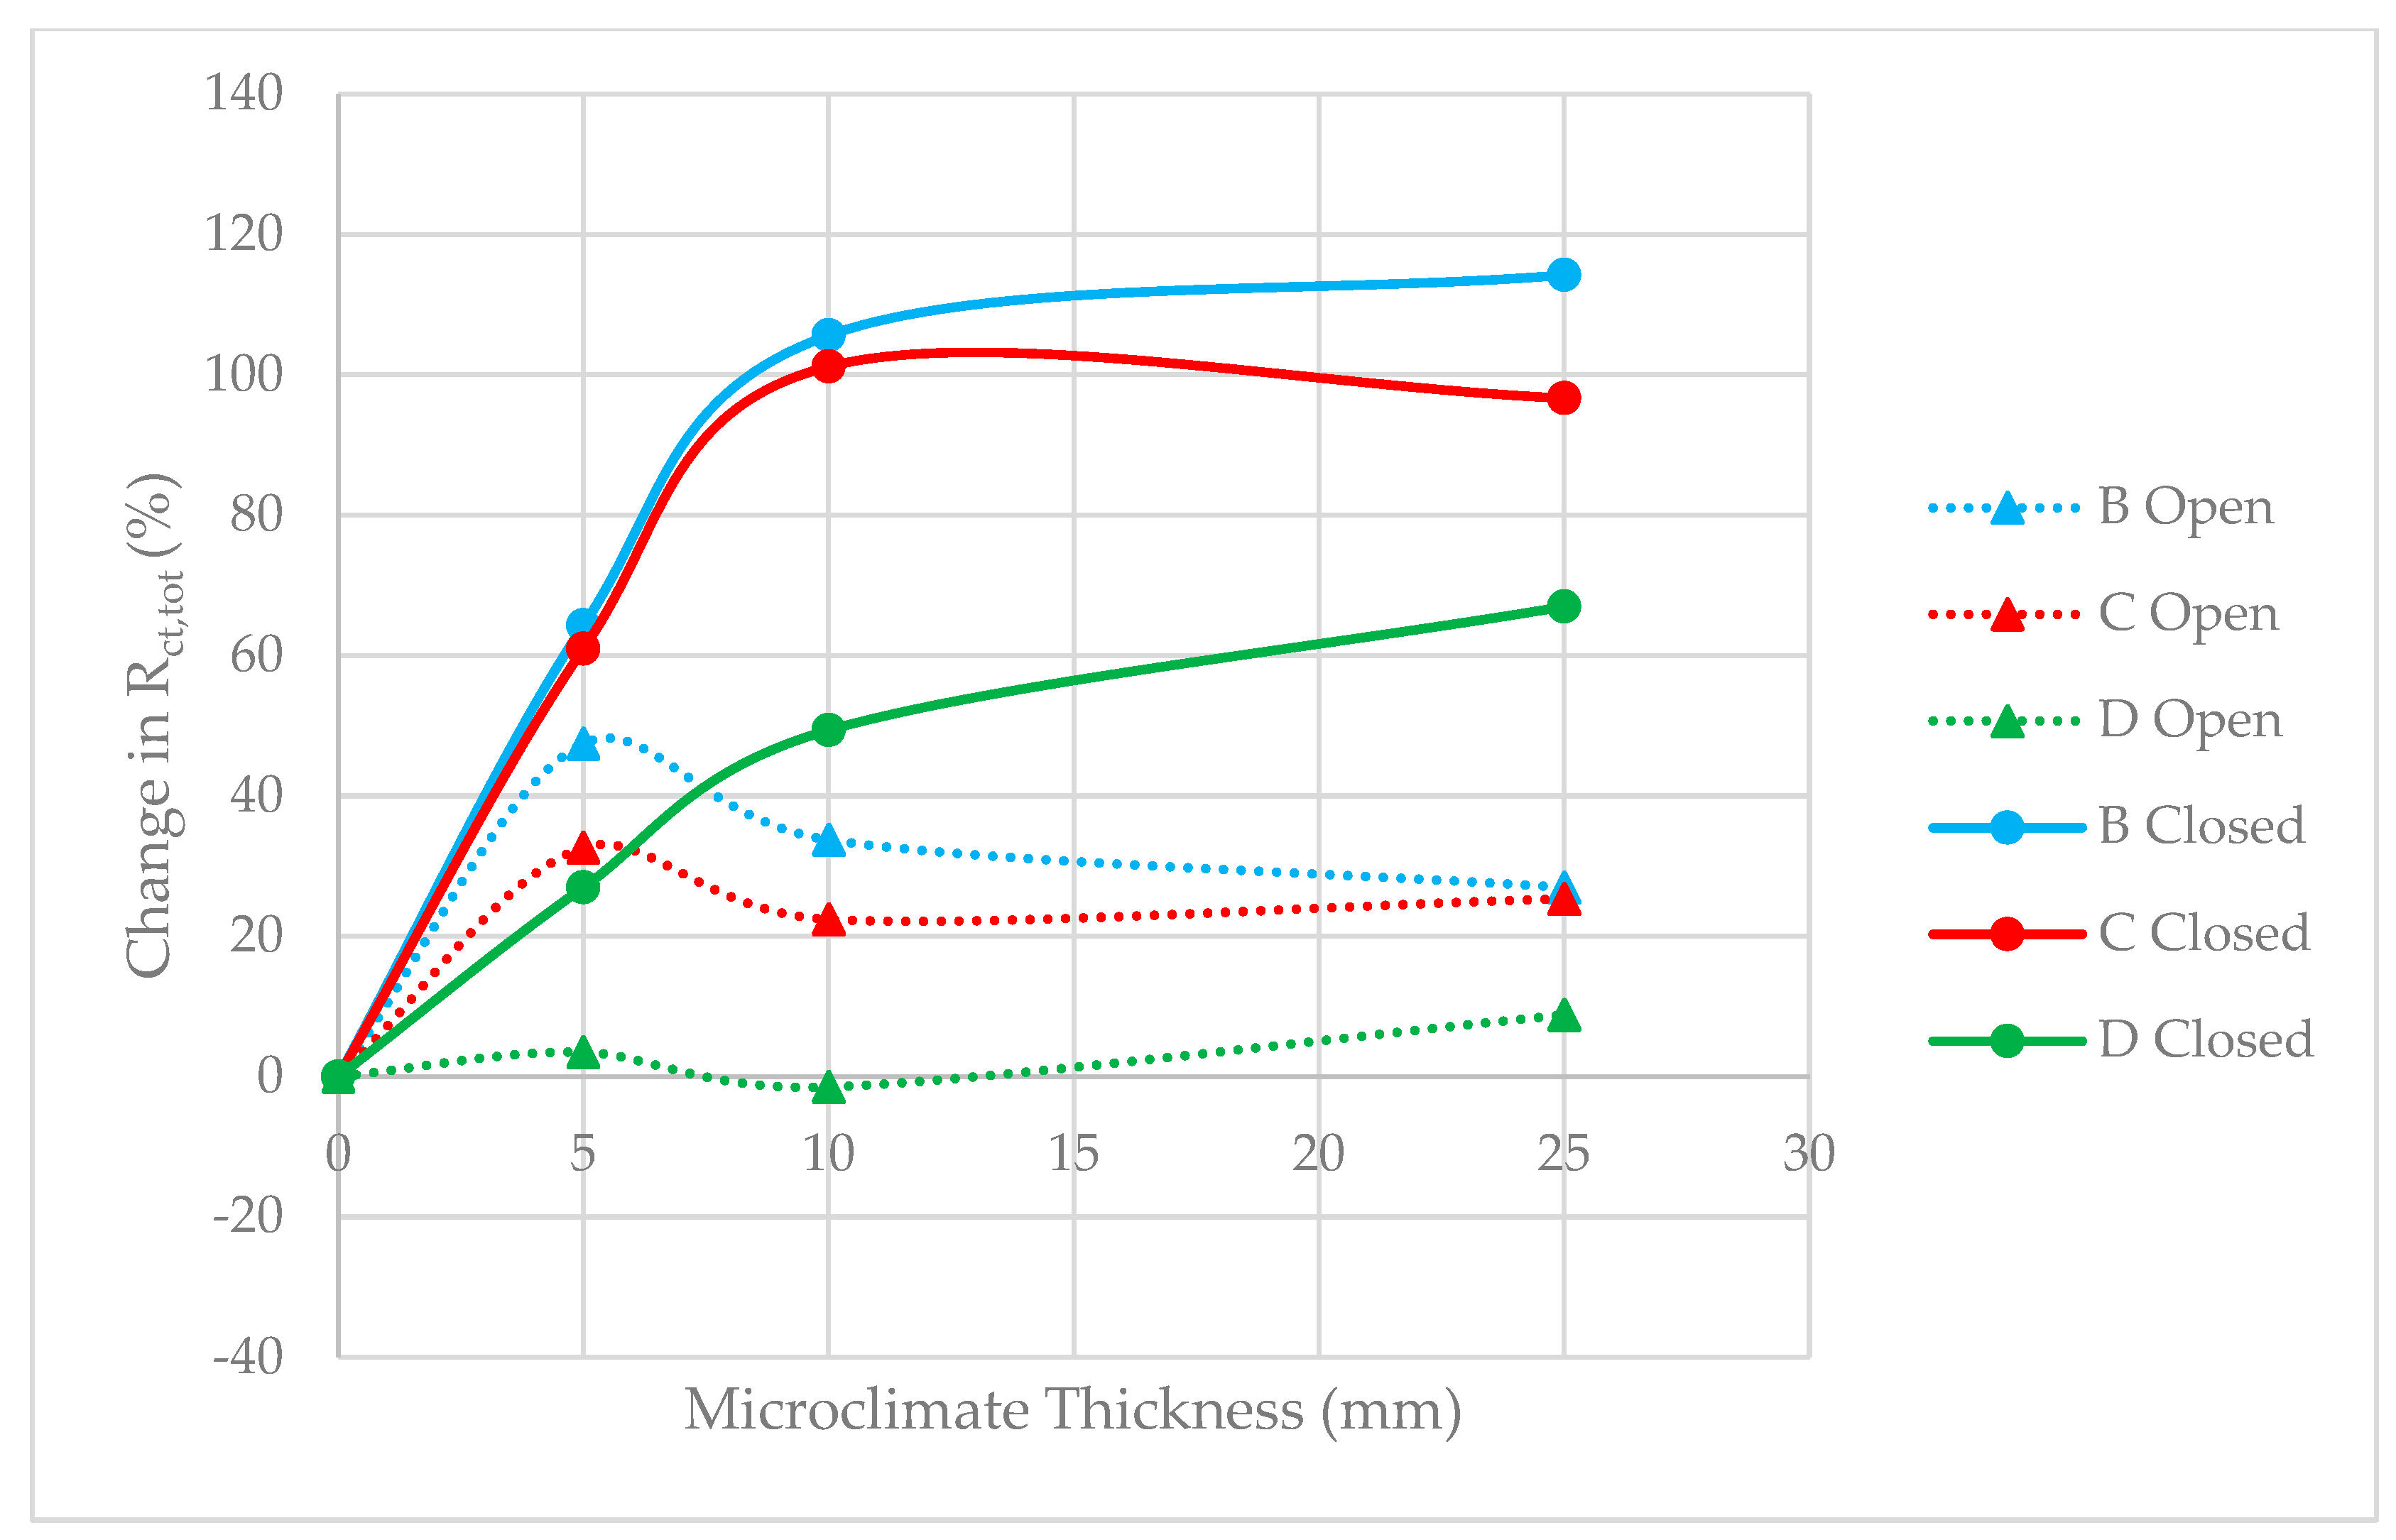
Figure 4 below outlines the results of the small-plate tests at the 1.3 m/s wind speed, wherein the dotted lines represent the open-spacer design, and the solid lines show the closed-spacer design. At the 1.3 m/s wind speed, the differences in the top layer become much more apparent than at either of the other wind speeds. Sample D consistently yielded the lowest increase in insulation. At 5, 10, and 25 mm, sample D showed increases in insulation of 27, 49, and 57%, respectively, while sample C yielded increases of 60, 101, and 97%, respectively. In the open-spacer design, sample D demonstrated increases in insulation of 3, −1, and 9% for the 5, 10, and 25 mm microclimate thicknesses compared to the 0 mm microclimate thickness value, while sample C yielded values of 32, 22, and 25% at the same levels. Sample B showed higher values than sample C in all cases.
3.2. Human Thermal Response: Low Metabolic Rate
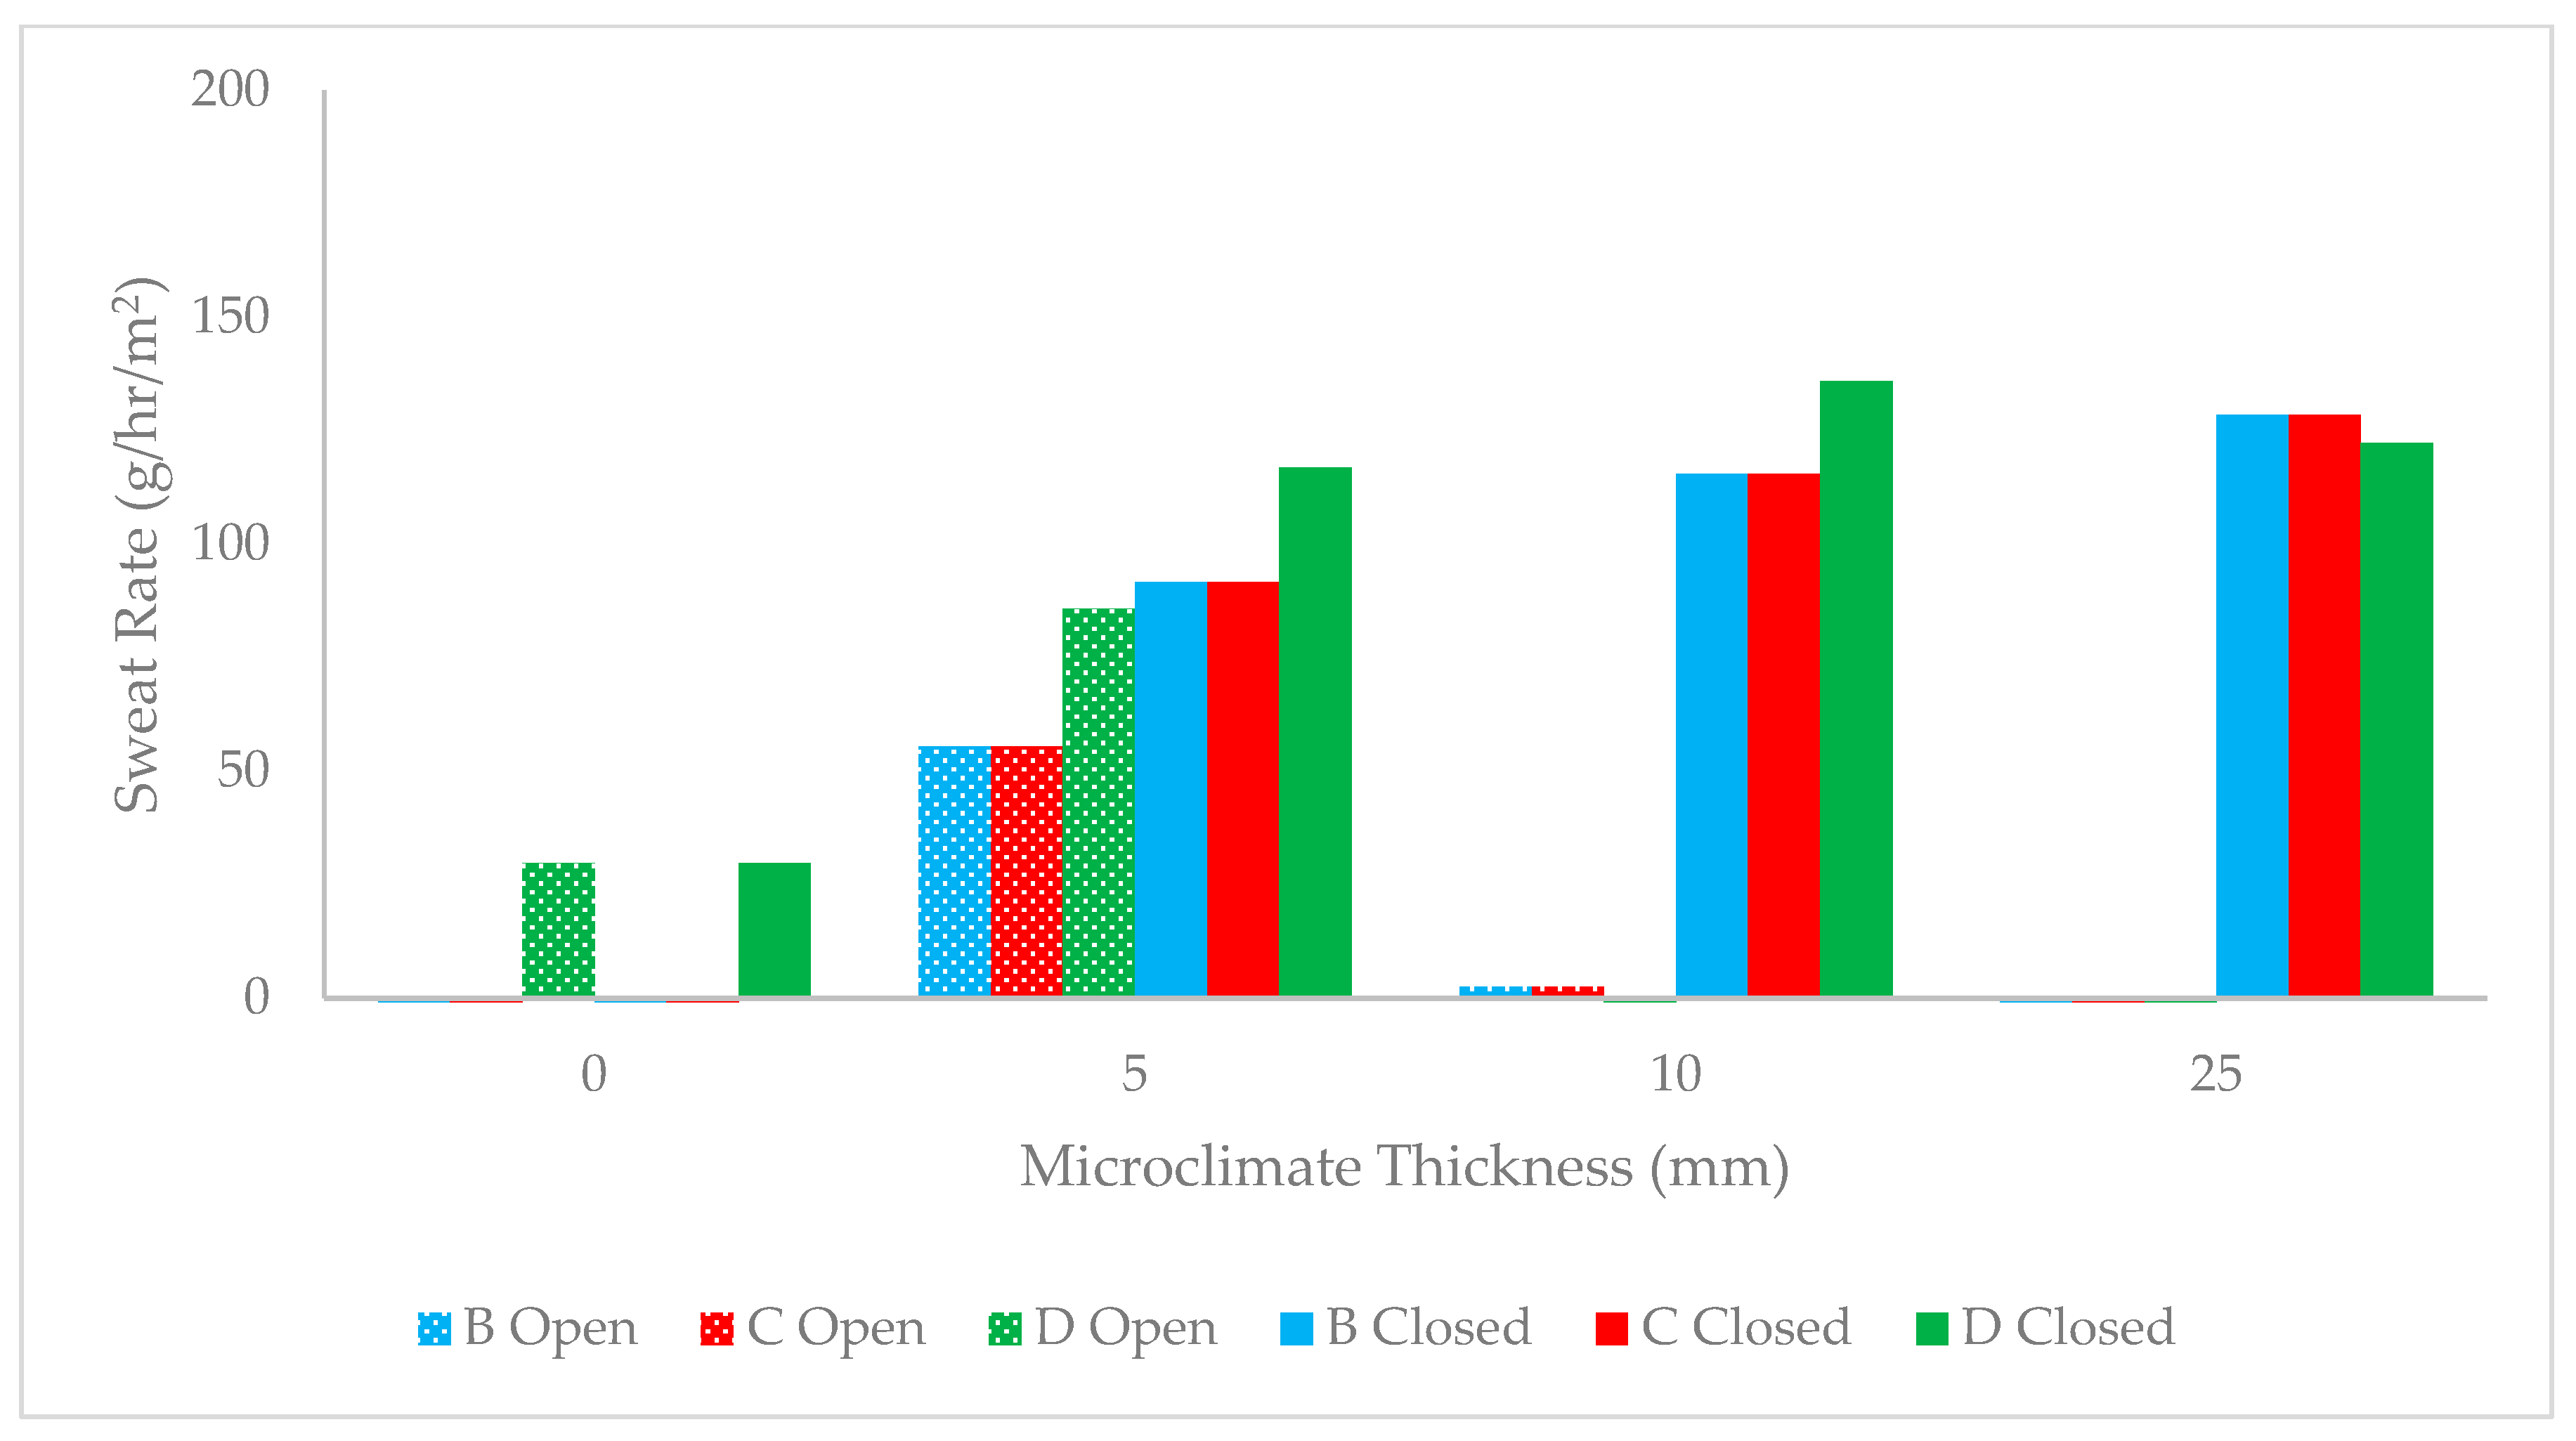
Figure 5, Figure 6 and Figure 7 below outline the required sweat (Equation (3)) that would be needed if the insulation values of the samples were used to calculate the heat storage (Equation (2)). A metabolic rate of 150 W/m2 was assumed for these calculations. Figure 5 outlines the results at the 0.25 m/s wind speed, Figure 6 at the 0.5 m/s wind speed, and Figure 7 at the 1.3 m/s wind speed.
It was seen from the results that the 0 mm microclimate consistently exhibited the lowest required sweat rate. In Figure 6, it can be seen that most conditions could compensate for the heat storage through dry heat loss, while Figure 7 shows that all the conditions were able to do so. In Figure 5, it can be observed that the highest sweat rates were required to compensate for the heat storage at 0.25 m/s, and, generally, the open-spacer design required less sweating than the closed design. Figure 6 and Figure 7 exhibit similar overall trends. The peak sweat rate was typically at the 5 or 10 mm microclimate thickness for the open-spacer design but remained at a similar level at 10 and 25 mm for the closed spacer. In Figure 7, it can also be observed that sample D was able to compensate for the heat storage solely through dry heat loss at the 5 and 10 mm microclimate thicknesses, while samples B and C required some level of sweating to compensate for the heat storage.
3.3. Human Thermal Response: High Metabolic Rate
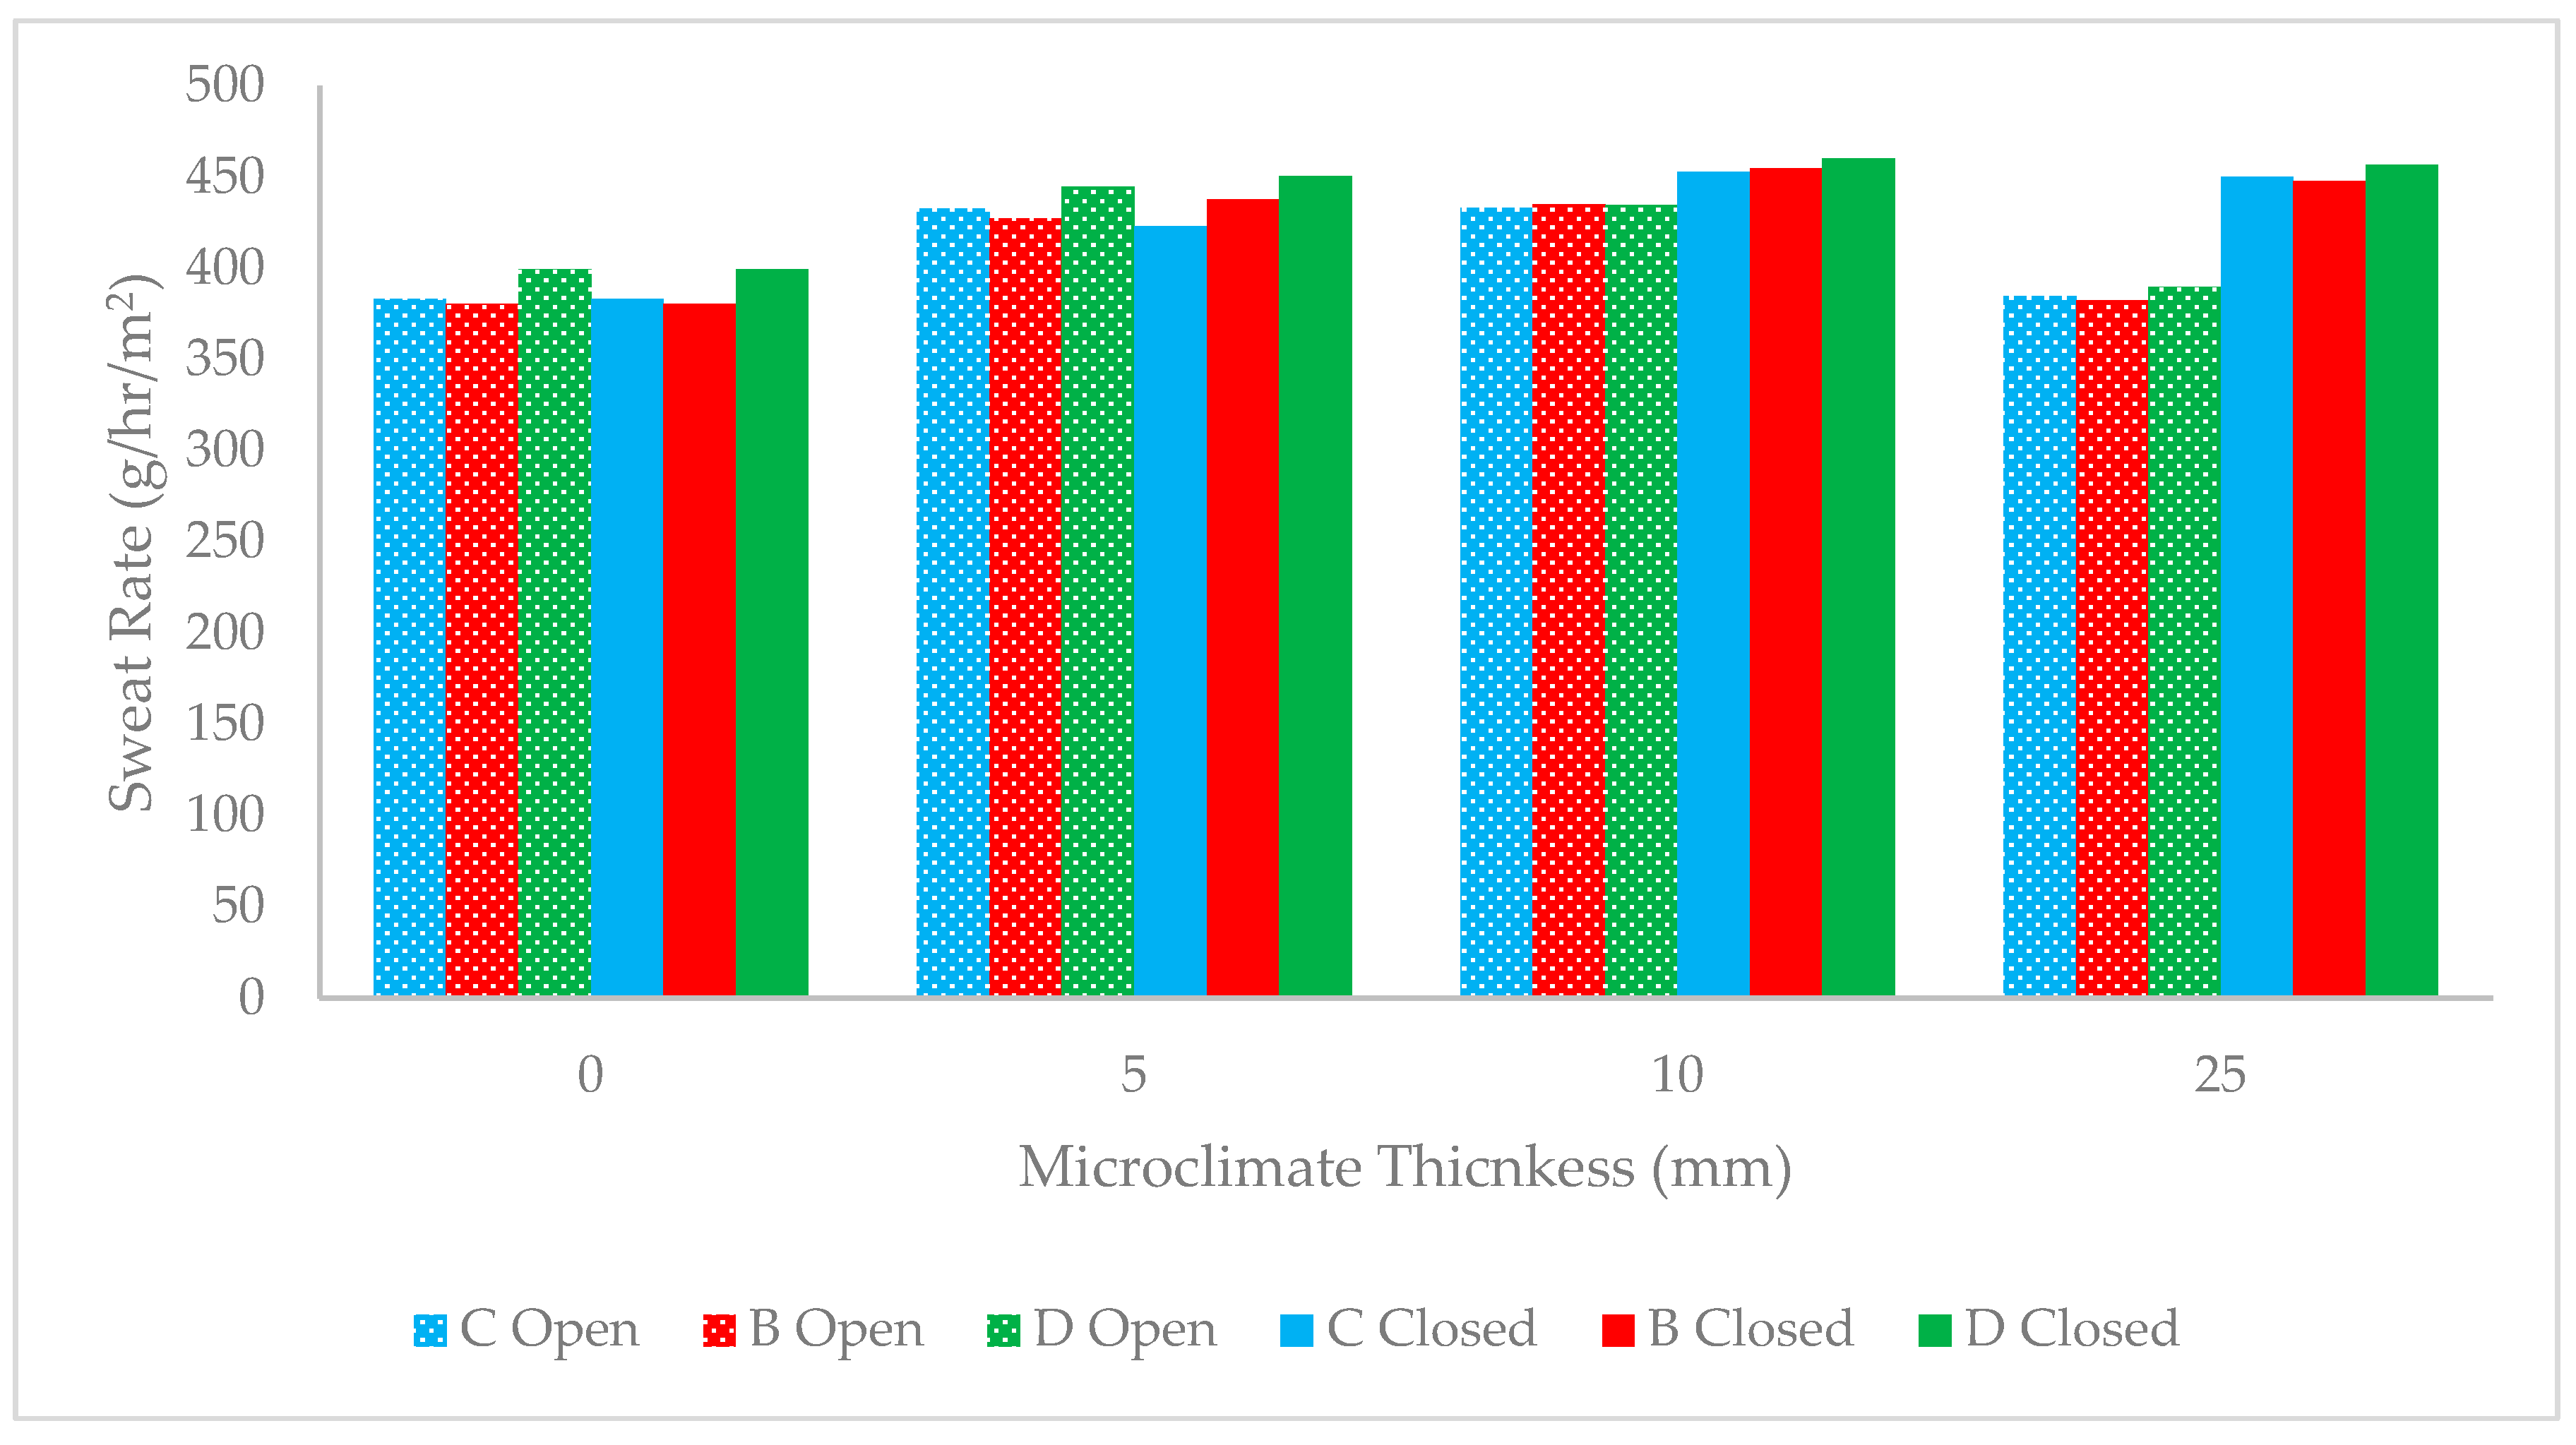
Figure 8, Figure 9 and Figure 10 show the required sweat rates when the metabolic rate was at 400 W/m2 in all conditions and represent the 0.25, 0.5, and 1.3 m/s wind speeds, respectively, similar to Section 3.2.
Unlike the low activity level, at the 400 W/m2 metabolic rate, no sample and microclimate thickness combination was able to compensate for the heat storage through dry heat loss exclusively. In most conditions, the closed-spacer design led to higher sweat rates than the open-spacer design. At the 0.25 m/s wind speed, most microclimate thicknesses yielded similar sweat rates (~400 g/h/m2), regardless of the sample or spacer design, except at the 25 mm microclimate thickness, where the open-spacer design resulted in lower sweat rates than the closed-spacer design (~350 g/h/m2). For all the wind speeds, the 25 mm microclimate thickness generally yielded the most differences between the spacer designs, but the 10 mm microclimate thickness yielded more differences between the samples. For example, at 1.3 m/s and 10 mm, samples B, C, and D yielded sweat rates of 320, 300, and 275 g/h/m2, respectively, in the open-spacer design, while at 1.3 m/s and the 25 mm microclimate thickness, the sweat rates were 307, 307, and 304 g/h/m2 in the open-spacer design for samples B, C, and D, respectively. This showed that the effect of the material is highly dependent on the environmental conditions considered.
4. Discussion
At 0.25 m/s, the effect of the spacer design had a stronger influence on the insulation than the material itself (Figure 2). The closed-spacer design demonstrated an increase in insulation to about 50% for all the samples, while the open-spacer design demonstrated an initial increase in insulation to about 35% at the 5 mm microclimate thickness and then a decrease. The values at the 25 mm microclimate thickness were similar to the starting value at 0 mm. Similar observations are seen in Figure 3, but at the 10 and 25 mm microclimate thicknesses, there was a larger difference in the samples, especially D, which demonstrated a larger decrease in insulation than either of the other materials. The overall trends of increasing insulation in the closed spacer and the increase–decrease pattern in the open spacer remained the same. At the 1.3 m/s wind speed, Figure 4 demonstrates a much larger difference in the samples in the closed-spacer design. Samples B and C showed 2* the insulation values at the 0 mm air layer, while sample D peaked at 1.6* the starting value. Similarly, with the open-spacer design, sample D demonstrated a much lower increase in insulation compared to samples B and C.
Overall, this showed that the environmental conditions, wind speed, ventilation, and microclimate thickness had strong effects on the insulation. At the 0.25 m/s wind speed, the ventilation and microclimate thickness had the strongest effects. But as the wind speed increased, the material construction began to have more of an influence. In some cases, such as sample D at 1.3 m/s, the material construction mitigated the effect of the environment, and the open-spacer design saw minimal differences in insulation as the microclimate thickness increased. The largest influence observed was at the 25 mm microclimate thickness, which yielded an insulation increase of 8% for sample D. While these graphs were helpful in the observation of the interaction of the materials with the environment, the trends are relative to the starting point, the 0 mm microclimate thickness. Therefore, calculating the heat balance and sweating rate using absolute Rct,tot values gave a more applicable comparison.
Figure 5, Figure 6 and Figure 7 show that a low metabolic rate could be compensated for solely through dry heat loss for all the samples at the 0 mm microclimate thickness, but this was heavily dependent on the wind speed and level of ventilation. The presence of an air layer increases the insulation of the system, but at wind speeds above 0.5 m/s and with ventilation present, the material insulation can be negligible. With a microclimate of at least 5 mm in the closed-spacer design, every sample needed some level of sweating to compensate for the metabolic rate. However, in the open design, sample D was able to compensate for the metabolic rate solely through dry heat loss at 0.5 m/s and a microclimate thickness of at least 10 mm. At 25 mm and 0.5 m/s, all the samples were able to compensate for the metabolic rate solely through dry heat loss, further showing the importance of the environmental parameters.
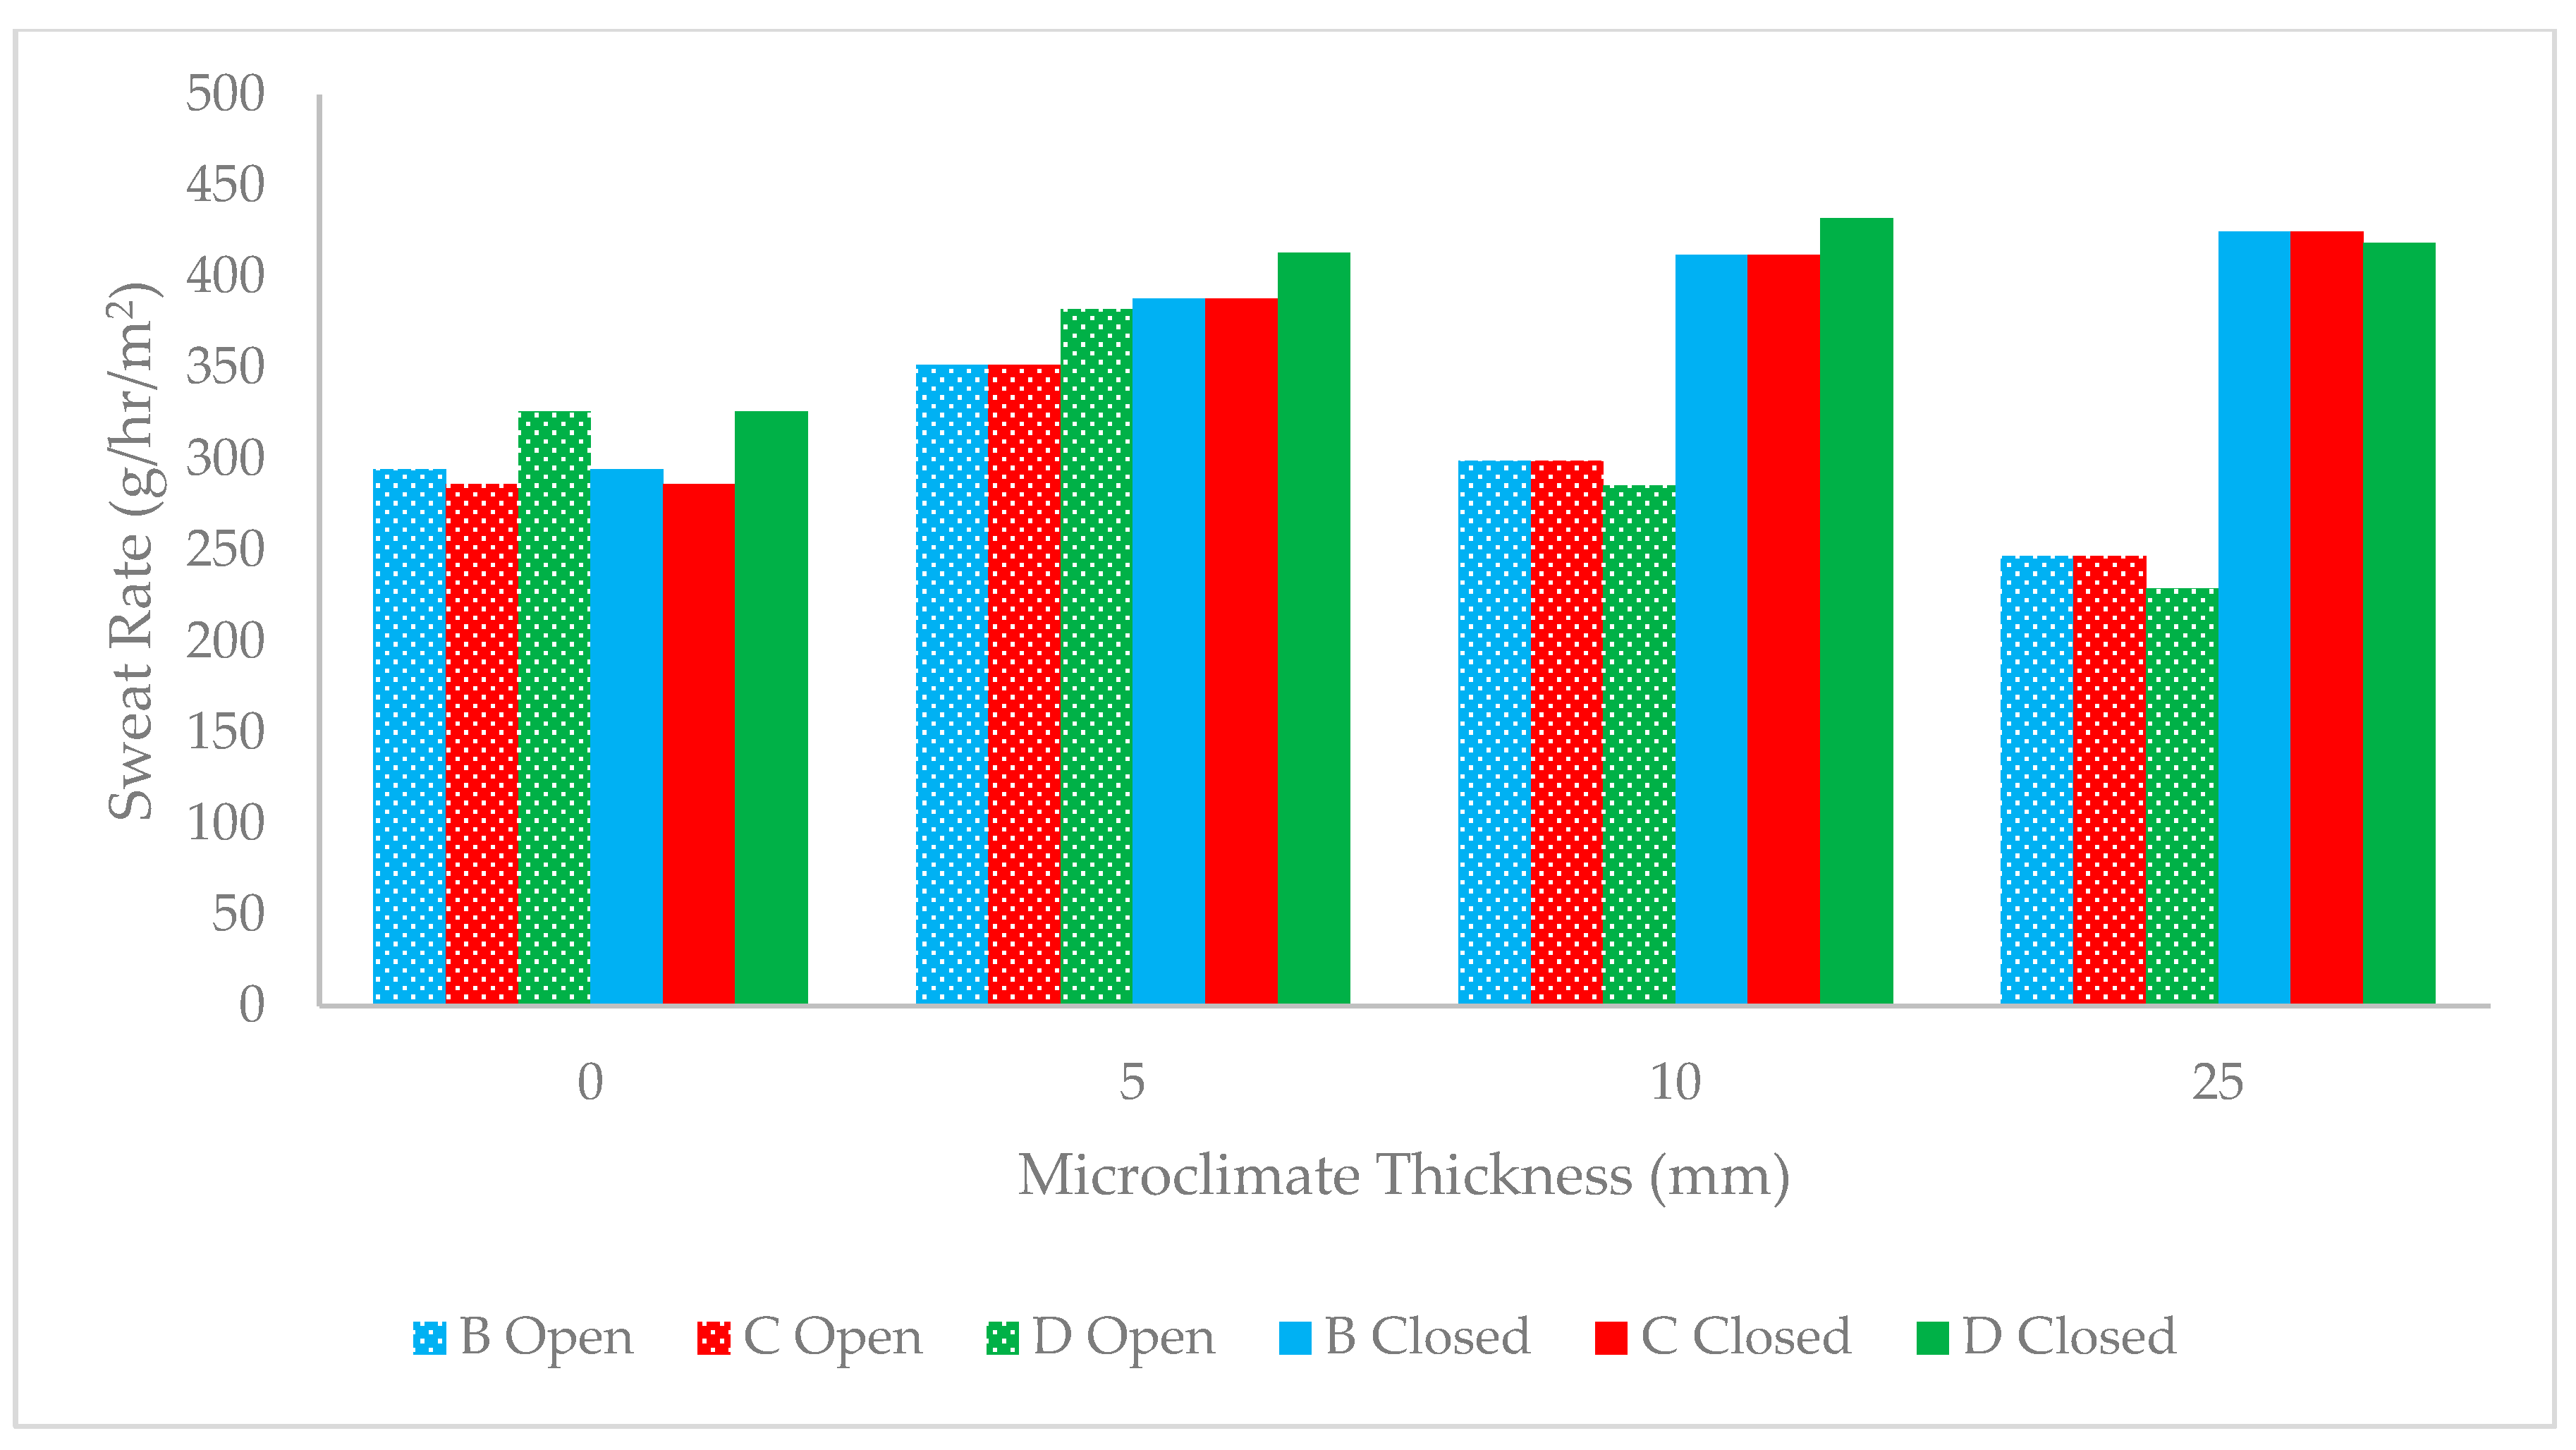
Figure 8 demonstrates that, at a higher metabolic rate and a low wind speed of 0.25 m/s, the material did not have much influence on the sweat rate, except at the 25 mm microclimate thickness, where the open-spacer design showed lower sweat rates than the closed-spacer design: approximately 385 g/h/m2 and 450 g/h/m2 for all the samples in the open vs. closed designs, respectively. Figure 9 showed a similar result, with the open-spacer sweat rates being almost half the closed-spacer sweat rates at the 25 mm microclimate thickness: around 420 g/h/m2 vs. 230 g/h/m2 for the closed and open designs, respectively. A similar pattern was observed at 10 mm. Figure 10 demonstrated similar overall trends but also a larger difference between the materials. This implies that the material construction had a more prominent effect as the wind speed increased.
It should be noted that the results of the thermal audit differ slightly from those of the Rct,tot mapping. This was due to the Rct,tot results being shown as relative changes to the starting value at the 0 mm microclimate thickness, whereas the results of the thermal audit were conducted using the absolute Rct,tot values. This notably impacted the trends at the 0 and 5 mm air layer thicknesses. The trends became more coherent as the microclimate thickness increased. For example, in Figure 3, it was observed that, in the open-spacer design, the insulation peaked at 5 mm in all the samples and then decreased below the initial value at 0 mm at the 10 and 25 mm microclimate thicknesses. In Figure 9, it can be similarly observed that 5 mm required the highest sweat rate in the open-spacer design, and at 10 and 25 mm, less sweating was required. To express this numerically, sample B had the following sweat rates as the microclimate thickness increased: 294 g/h/m2, 352 g/h/m2, 299 g/h/m2, and, finally, 247 g/h/m2. Similarly, sample D exhibited the following values: 326 g/h/m2, 358 g/h/m2, 286 g/h/m2, and 229 g/h/m2. The results of each should be contextualized but overall similar trends are present between the Rct,tot mapping and thermal audit.
Overall, the results of the predicted thermal response demonstrated that not only were the individual levels of all the parameters important but also the levels of the other parameters. Therefore, when assessing thermal loads, all specifications of the environmental parameters must be considered, even when only assessing one parameter. For example, the presence of ventilation influenced whether sweating was even needed for the different samples (Figure 6). However, this is also dependent on the microclimate thickness, as even a difference of 5 vs. 10 mm can greatly influence the predicted physiological response. At low ambient wind speeds (≤0.5 m/s), the microclimate thickness and level of ventilation were crucial. But when the wind speed was increased to 1.3 m/s, the air permeability of the material began to exhibit a stronger influence on the thermal load. For future work, the heterogeneity of the microclimate thickness can be incorporated to provide a stronger representation of the thermal response.
The results of this analysis were consistent with the findings of Yang et al. [10], which observed that the ventilation rate had a strong effect on the heat loss. Similarly, it was also observed in Yang et al.’s study that the effect of the clothing size (i.e., microclimate thickness) varied with the ventilation rate. Ho et al. [14] also found that as the ventilation and microclimate thickness increased, so did the heat loss, but the exact values of these metrics were not specified. Gonzalez et al. [5] also found that garments higher in air permeability had better performances when conducting experiments with human subjects. However, the microclimate thickness and ventilation levels were not specified in this work. Fontana et al. [3] also found that a higher metabolic rate was better suited to outline differences between garment ensembles, but not much information is given on the material construction and environmental parameters, so it is difficult to quantify the results overall. But, generally, the results of this study agree with those of previous studies conducted on more complex measurement systems, showing that the sweating guarded hot plate can be used to predict the performances of different samples by incorporating different levels of wind speed, microclimate thickness, and ventilation.
5. Conclusions
In conclusion, the sample construction, ventilation, and microclimate thickness had less influence on the thermal load at lower wind speeds (0.25 m/s). But as the wind speed was increased to levels of 1.3 m/s, the magnitude of the influence of each parameter shifted as well. At the 0.25 and 0.5 m/s wind speeds, the microclimate thickness and level of ventilation demonstrated the strongest impacts on the predicted physiological response. However, at the 1.3 m/s wind speed, the construction of the material had a strong influence on the predicted response. Additionally, at the lower metabolic rate, the heat storage could be compensated for solely through dry heat loss at small microclimate thicknesses and both ventilation levels for several materials, particularly at wind speeds above 0.5 m/s. However, in no configuration was the heat storage able to be compensated for solely by dry heat loss at the high metabolic rate. This demonstrated that the activity level (i.e., the predicted end use) can strongly influence conclusions about different materials. Additionally, the expected environment also had a strong influence on the expected physiological response (in this case, sweating) and should also be considered when comparing materials.
Author Contributions
Conceptualization, E.G.T. and E.D.; methodology, E.G.T.; formal analysis, E.G.T.; investigation, E.G.T.; resources, E.D.; data curation, E.G.T.; writing—original draft preparation, E.G.T.; writing—review and editing, E.D.; visualization, E.G.T.; supervision, E.D.; project administration, E.G.T.; funding acquisition, E.D. All authors have read and agreed to the published version of the manuscript.
Funding
This research received no external funding.
Institutional Review Board Statement
Not Applicable.
Informed Consent Statement
Not applicable.
Data Availability Statement
The data presented in this study are available upon request from the corresponding author due to legal restrictions.
Acknowledgments
The authors acknowledge Cotton Inc. for providing some of the samples used in this research.
Conflicts of Interest
The authors declare no conflicts of interest.
References
- Havenith, G. Interaction of Clothing and Thermoregulation. EXD 2002, 1, 221–230. [Google Scholar] [CrossRef]
- Song, G.; Paskaluk, S.; Sati, R.; Crown, E.M.; Doug Dale, J.; Ackerman, M. Thermal Protective Performance of Protective Clothing Used for Low Radiant Heat Protection. Text. Res. J. 2011, 81, 311–323. [Google Scholar] [CrossRef]
- Fontana, P.; Saiani, F.; Grütter, M.; Croset, J.-P.; Capt, A.; Camenzind, M.; Morrissey, M.; Rossi, R.M.; Annaheim, S. Exercise Intensity Dependent Relevance of Protective Textile Properties for Human Thermo-Physiology. Text. Res. J. 2017, 87, 1425–1434. [Google Scholar] [CrossRef]
- Holmér, I. Protective Clothing in Hot Environments. Ind. Health 2006, 44, 404–413. [Google Scholar] [CrossRef] [PubMed]
- Gonzalez, N.W.; Bernard, T.E.; Carroll, N.L.; Bryner, M.A.; Zeigler, J.P. Maximum Sustainable Work Rate for Five Protective Clothing Ensembles with Respect to Moisture Vapor Transmission Rate and Air Permeability. J. Occup. Environ. Hyg. 2006, 3, 80–86. [Google Scholar] [CrossRef] [PubMed]
- Ullah, H.M.K.; Lejeune, J.; Cayla, A.; Monceaux, M.; Campagne, C.; Devaux, É. A Review of Noteworthy/Major Innovations in Wearable Clothing for Thermal and Moisture Management from Material to Fabric Structure. Text. Res. J. 2021, 92, 00405175211027799. [Google Scholar] [CrossRef]
- Li, X.; Tokura, H. The Effects of Two Types of Clothing on Seasonal Heat Tolerance. Eur. J. Appl. Physiol. 1996, 72, 287–291. [Google Scholar] [CrossRef] [PubMed]
- Havenith, G.; Heus, R.; Lotens, W.A. Resultant Clothing Insulation: A Function of Body Movement, Posture, Wind, Clothing Fit and Ensemble Thickness. Ergonomics 1990, 33, 67–84. [Google Scholar] [CrossRef]
- Havenith, G. Heat Balance When Wearing Protective Clothing. Ann. Occup. Hyg. 1999, 43, 289–296. [Google Scholar] [CrossRef] [PubMed]
- Yang, J.; Wang, F.; Song, G.; Li, R.; Raj, U. Effects of Clothing Size and Air Ventilation Rate on Cooling Performance of Air Ventilation Clothing in a Warm Condition. Int. J. Occup. Saf. Ergon. 2022, 28, 354–363. [Google Scholar] [CrossRef] [PubMed]
- Morrissey, M.P.; Rossi, R.M. The Effect of Wind, Body Movement and Garment Adjustments on the Effective Thermal Resistance of Clothing with Low and High Air Permeability Insulation. Text. Res. J. 2014, 84, 583–592. [Google Scholar] [CrossRef]
- Špelić, I.; Rogale, D.; Mihelić Bogdanić, A.; Petrak, S.; Naglić, M.M. Changes in Ensembles’ Thermal Insulation According to Garment’s Fit and Length Based on Athletic Figure. Fibers Polym. 2018, 19, 1278–1287. [Google Scholar] [CrossRef]
- He, H.; Yu, Z. Effect of Air Gap Entrapped in Firefighter Protective Clothing on Thermal Resistance and Evaporative Resistance. Autex Res. J. 2018, 18, 28–34. [Google Scholar] [CrossRef]
- Ho, C.; Fan, J.; Newton, E.; Au, R. Effects of Athletic T-Shirt Designs on Natural Ventilation. Res. J. Text. Appar. 2016, 20, 112–123. [Google Scholar] [CrossRef]
- Bouskill, L.; Havenith, G.; Kuklane, K.; Parsons, K.; Withey, W. Relationship Between Clothing Ventilation and Thermal Insulation. AIHA J. Sci. Occup. Environ. Health Saf. 2002, 63, 262–268. [Google Scholar] [CrossRef] [PubMed]
- Holmér, I.; Gavhed, D.C.E.; Grahn, S.; Nilsson, H. Effect of Wind and Body Movements on Clothing Insulation—Measurement with a Moveable Thermal Manikin. In Proceedings of the Fifth International Conference on Environmental Ergonomics, Maastricht, The Netherlands, 2–6 November 1992. [Google Scholar]
- Alberghini, M.; Hong, S.; Lozano, L.M.; Korolovych, V.; Huang, Y.; Signorato, F.; Zandavi, S.H.; Fucetola, C.; Uluturk, I.; Tolstorukov, M.Y.; et al. Sustainable Polyethylene Fabrics with Engineered Moisture Transport for Passive Cooling. Nat. Sustain. 2021, 4, 715–724. [Google Scholar] [CrossRef]
- Ukponmwan, J.O. The Thermal-Insulation Properties of Fabrics. Text. Prog. 1993, 24, 1–54. [Google Scholar] [CrossRef]
- Havenith, G.; den Hartog, E.; Martini, S. Heat Stress in Chemical Protective Clothing: Porosity and Vapour Resistance. Ergonomics 2011, 54, 497–507. [Google Scholar] [CrossRef] [PubMed]
- Özkan, E.T.; Meriç, B. Thermophysiological Comfort Properties of Different Knitted Fabrics Used in Cycling Clothes. Text. Res. J. 2015, 85, 62–70. [Google Scholar] [CrossRef]
- Psikuta, A.; Richards, M.; Fiala, D. Single-Sector Thermophysiological Human Simulator. Physiol. Meas. 2008, 29, 181. [Google Scholar] [CrossRef] [PubMed]
- Zimmerli, T.; Weder, M.S. Protection and Comfort—A Sweating Torso for the Simultaneous Measurement of Protective and Comfort Properties of PPE. In Proceedings of the Performance of Protective Clothing: Sixth Volume; Stull, J., Schwope, A., Eds.; ASTM International: West Conshohocken, PA, USA, 1997; pp. 271–280. [Google Scholar]
- Pamuk, O. Thermal Manikins and Clothing Comfort. Eng. Sci. 2008, 3, 124–132. [Google Scholar]
- Ross, K.; Barker, R.; Deaton, A. Translation between Heat Loss Measured Using Guarded Sweating Hot Plate, Sweating Manikin, and Physiologically Assessed Heat Stress of Firefighter Turnout Ensembles. 2012. Available online: https://app.knovel.com/web/view/khtml/show.v/rcid:kpPPCEVEI7/cid:kt00URSOM1/viewerType:khtml//root_slug:performance-protective/url_slug:translation-between-heat?cid=kt00URSO81&kpromoter=Summon&view=collapsed&zoom=1&page=19. (accessed on 20 June 2022).
- Ke, Y.; Udayraj; Li, Z.; Wang, F. Hot Plates and Thermal Manikins for Evaluating Clothing Thermal Comfort. In Firefighters’ Clothing and Equipment; CRC Press: Boca Raton, FL, USA, 2018; ISBN 978-0-429-44487-6. [Google Scholar]
- Parsons, K. Human Thermal Environments: The Effects of Hot, Moderate, and Cold Environments on Human Health, Comfort, and Performance, 3rd ed.; CRC Press: Boca Raton, FL, USA, 2002. [Google Scholar]
- Joshi, S.S.; Lesser, T.J.; Olsen, J.W.; O’Hara, B.F. The Importance of Temperature and Thermoregulation for Optimal Human Sleep. Energy Build. 2016, 131, 153–157. [Google Scholar] [CrossRef]
- Das, S.; Subudhi, S. A Review on Different Methodologies to Study Thermal Comfort. Int. J. Environ. Sci. Technol. 2022, 19, 2155–2171. [Google Scholar] [CrossRef]
- Prek, M. Thermodynamic Analysis of Human Heat and Mass Transfer and Their Impact on Thermal Comfort. Int. J. Heat. Mass. Transf. 2005, 48, 731–739. [Google Scholar] [CrossRef]
- ISO 8996:2021; Ergonomics of the Thermal Environment. Determination of Metabolic Rate. ISO- International Organization for Standardization: Geneva, Switzeralnd, 2021.
Figure 1.
Image of the small-guarded-hot-plate apparatus (top left), 3D model of the spacer (top right), and schematic of heat transfer in plate (bottom left).
Figure 1.
Image of the small-guarded-hot-plate apparatus (top left), 3D model of the spacer (top right), and schematic of heat transfer in plate (bottom left).

Figure 2.
Changes in Rct,tot with increasing microclimate thickness at 0.25 m/s wind speed.

Figure 3.
Changes in Rct,tot with increasing microclimate thickness at 0.5 m/s wind speed.

Figure 4.
Changes in Rct,tot with increasing microclimate thickness at 1.3 m/s wind speed.

Figure 5.
Sweating required to compensate for Ereq at 0.25 m/s wind speed at 150 W/m2 metabolic rate.
Figure 5.
Sweating required to compensate for Ereq at 0.25 m/s wind speed at 150 W/m2 metabolic rate.

Figure 6.
Sweating required to compensate for Ereq at 0.5 m/s wind speed at 150 W/m2 metabolic rate.
Figure 6.
Sweating required to compensate for Ereq at 0.5 m/s wind speed at 150 W/m2 metabolic rate.

Figure 7.
Sweating required to compensate for Ereq at 1.3 m/s wind speed at 150 W/m2 metabolic rate.
Figure 7.
Sweating required to compensate for Ereq at 1.3 m/s wind speed at 150 W/m2 metabolic rate.

Figure 8.
Sweating required to compensate for Ereq at 0.25 m/s wind speed at 400 W/m2 metabolic rate.
Figure 8.
Sweating required to compensate for Ereq at 0.25 m/s wind speed at 400 W/m2 metabolic rate.

Figure 9.
Sweating required to compensate for Ereq at 0.5 m/s wind speed at 400 W/m2 metabolic rate.
Figure 9.
Sweating required to compensate for Ereq at 0.5 m/s wind speed at 400 W/m2 metabolic rate.

Figure 10.
Sweating required to compensate for Ereq at 1.3 m/s wind speed at 400 W/m2 metabolic rate.
Figure 10.
Sweating required to compensate for Ereq at 1.3 m/s wind speed at 400 W/m2 metabolic rate.


Table 1.
Sample construction information.
| Sample | Material | Structure | Thickness (mm) | Air Permeability (L/min/m2) | Rct,tot (m2 °C/W) |
|---|---|---|---|---|---|
| A | 100% Cotton | Knit | 1.00 | 18.9 | 0.080 |
| B | 100% Cotton | Woven | 0.68 | 9.7 | 0.076 |
| C | 100% Cotton | Knit | 0.64 | 90.4 | 0.081 |
| D | 100% Wool | Knit | 0.60 | 200 | 0.089 |
Disclaimer/Publisher’s Note: The statements, opinions and data contained in all publications are solely those of the individual author(s) and contributor(s) and not of MDPI and/or the editor(s). MDPI and/or the editor(s) disclaim responsibility for any injury to people or property resulting from any ideas, methods, instructions or products referred to in the content. |
© 2024 by the authors. Licensee MDPI, Basel, Switzerland. This article is an open access article distributed under the terms and conditions of the Creative Commons Attribution (CC BY) license (https://creativecommons.org/licenses/by/4.0/).
Share and Cite
MDPI and ACS Style
Garcia Torres, E.; DenHartog, E. Alternative Method for Predicting Thermal Response in Two-Layer Systems. Appl. Sci. 2024, 14, 3576. https://doi.org/10.3390/app14093576
AMA Style
Garcia Torres E, DenHartog E. Alternative Method for Predicting Thermal Response in Two-Layer Systems. Applied Sciences. 2024; 14(9):3576. https://doi.org/10.3390/app14093576
Chicago/Turabian StyleGarcia Torres, Edgar, and Emiel DenHartog. 2024. "Alternative Method for Predicting Thermal Response in Two-Layer Systems" Applied Sciences 14, no. 9: 3576. https://doi.org/10.3390/app14093576
Note that from the first issue of 2016, this journal uses article numbers instead of page numbers. See further details here.